modeling hole transport on the surface of ge …/media/np/pdf/sbir sttr...modeling hole transport on...
TRANSCRIPT

Modeling Hole Transport on the Modeling Hole Transport on the Surface of Ge GammaSurface of Ge Gamma--RayRaySurface of Ge GammaSurface of Ge Gamma Ray Ray
DetectorsDetectorsN l Ph i SBIR/STTR E h M ti S t b 13N l Ph i SBIR/STTR E h M ti S t b 13 14 201014 2010
Presented by: Cory AhrensPresented by: Cory Ahrens PI: Paul MullowneyPI: Paul MullowneyKevin Paul, MingKevin Paul, Ming--Chieh Lin, Michael Loh (TechChieh Lin, Michael Loh (Tech--X Corp)X Corp)
Nuclear Physics SBIR/STTR Exchange Meeting, September 13Nuclear Physics SBIR/STTR Exchange Meeting, September 13--14, 201014, 2010
, g, g , (, ( p)p)David Radford, Ren Cooper, Karen Lagergren (ORNL)David Radford, Ren Cooper, Karen Lagergren (ORNL)
[email protected]/[email protected]@txcorp.com/[email protected]
TechTech--X CorporationX Corporation5621 Arapahoe Ave., Boulder, CO 803035621 Arapahoe Ave., Boulder, CO 80303
http://www.txcorp.comhttp://www.txcorp.com
Thi k t d bThi k t d bThis work was supported byThis work was supported byDOE SBIR Phase II Award No. DE-FG02-07ER84758
Office of Nuclear Physics
OutlineOutlineOutlineOutline
• Background• Phase II objectives• Work so far and results• Conclusions
C t d f t k• Current and future work
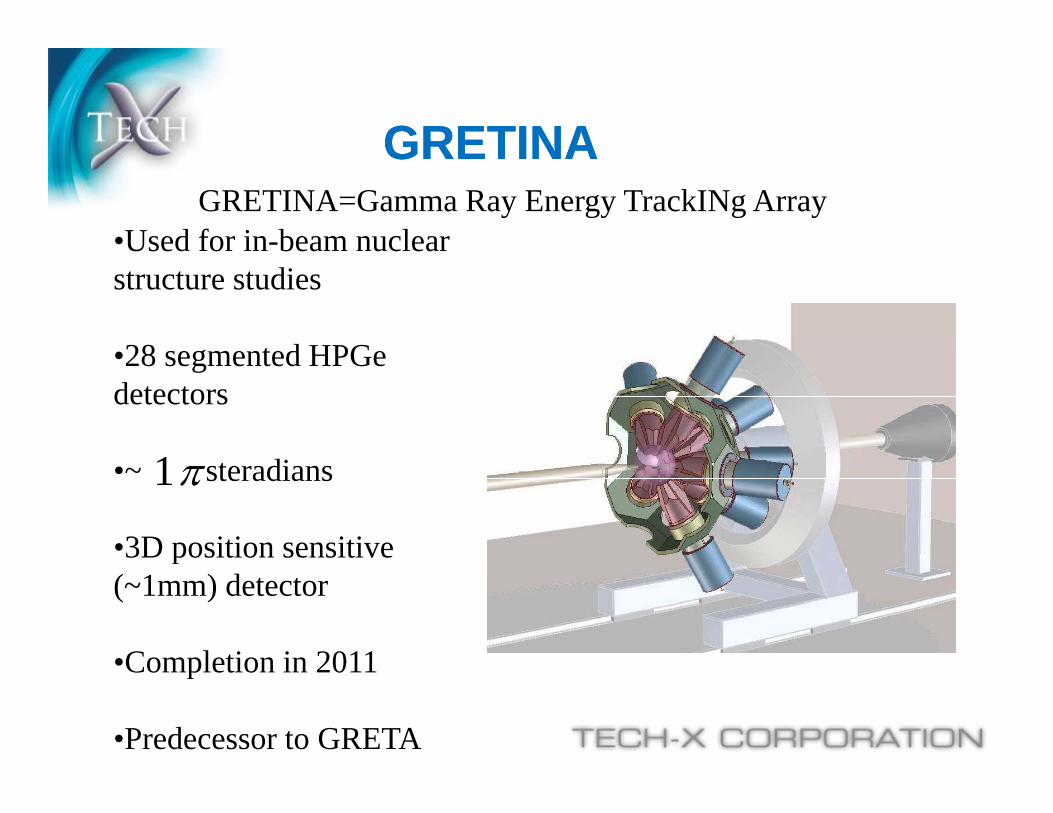
GRETINAGRETINAGRETINAGRETINAGRETINA=Gamma Ray Energy TrackINg Array
•Used for in-beam nuclearstructure studies
•28 segmented HPGe•28 segmented HPGe detectors
1•~ steradians
•3D position sensitive
1
p(~1mm) detector
•Completion in 2011•Completion in 2011
•Predecessor to GRETA
SegmentedSegmentedGRETINA D t tGRETINA D t tGRETINA DetectorGRETINA Detector
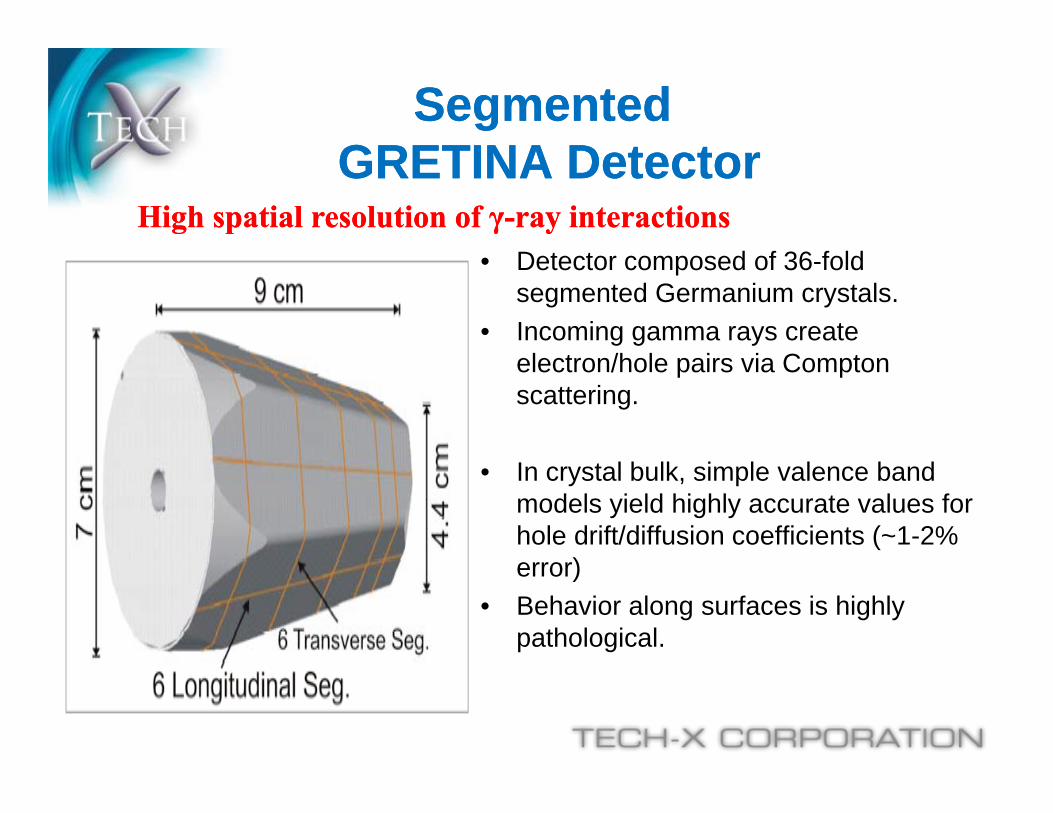
D t t d f 36 f ldHigh spatial resolution of High spatial resolution of γγ--ray interactionsray interactions
• Detector composed of 36-fold segmented Germanium crystals.
• Incoming gamma rays create l t /h l i i C telectron/hole pairs via Compton
scattering.
• In crystal bulk, simple valence band models yield highly accurate values for hole drift/diffusion coefficients (~1-2%
)error)• Behavior along surfaces is highly
pathological.

GRETINA Modeling GRETINA Modeling F kF kFrameworkFramework
F M t C lFrom Monte Carlo simulations
Dictionary of detector responses
(Currently done in house at ORNL)
signaldetectionalgorithmsalgorithms
Current modeling effort : encapsulate this infrastructure within VORPAL

Calculated signals: sensitivity t itito position
Hit segment Signals color-coded for
position
Image charge
position
Image chargeImage charge
Signals are nonlineargwith respect to position;necessary to extract multiple positions.
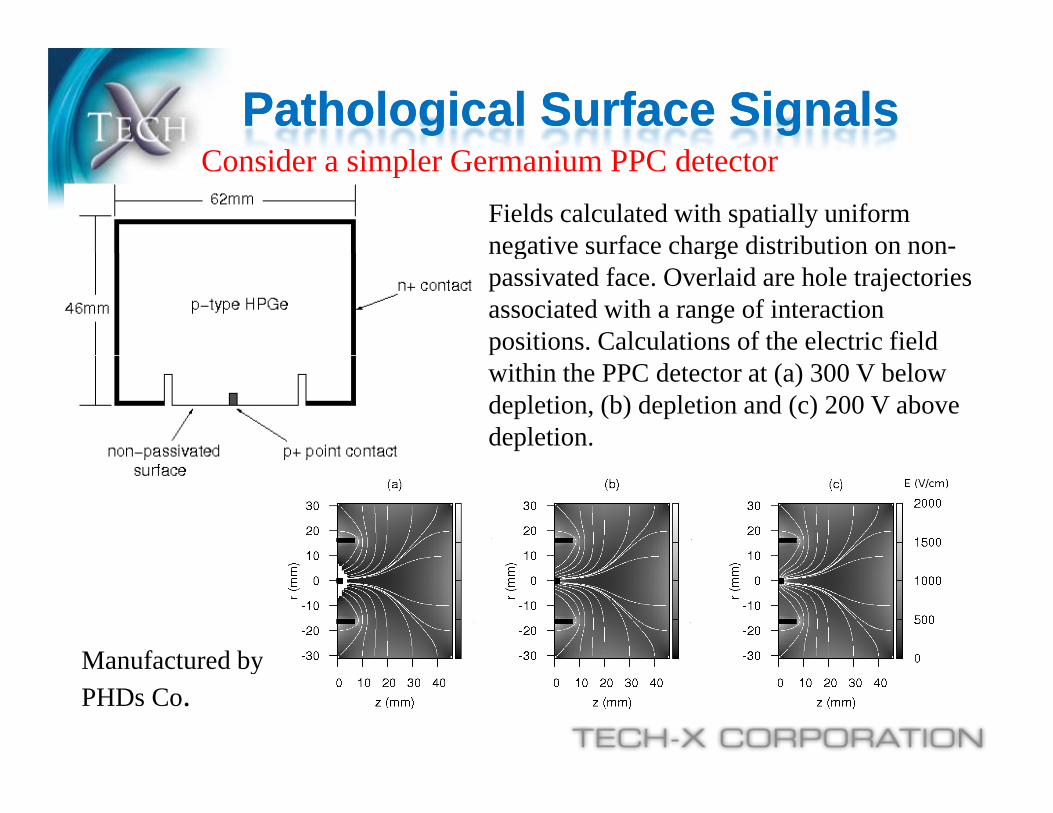
Pathological Surface SignalsPathological Surface SignalsC id i l G i PPC dConsider a simpler Germanium PPC detector
Fields calculated with spatially uniform negative surface charge distribution on non-negative surface charge distribution on nonpassivated face. Overlaid are hole trajectories associated with a range of interaction positions. Calculations of the electric field within the PPC detector at (a) 300 V below depletion, (b) depletion and (c) 200 V above depletion.
Manufactured byManufactured byPHDs Co.

Pathological Surface Signals Pathological Surface Signals ( ti d)( ti d)(continued)(continued)
• A : Normal Bulk Charge motion• B : Plateau for ~500 ns• C : Acceleration (still impaired motion)• D : Pulse reaches a maximum
Bulk interactionBulk interaction
Surface interaction
Example of anomalous signal recorded when PPC detector was operated close to depletion.
Regions of the pulse shape have been highlighted to show the key features. For comparison, a signal representing the typical response of the PPC detector i l id (d h d bl li )is overlaid (dashed blue line).

Surface Drift Velocity Surface Drift Velocity EstimationEstimation
• Histogram of radial drift velocity estimatedHistogram of radial drift velocity estimated from one thousand anomalous events.
• Guassian fit to the data yields a mean value of 0 0025 (±0 0011) mm/ns or 2500 m/sof 0.0025 (±0.0011) mm/ns, or 2500 m/s
• A factor of 40 slower than the accepted value for hole drift in bulk HPGe
• Means timing characteristics of interactions near surface MUCH different than those in the bulk
• Need to model/understand near surface transport

Phase II Project ObjectivesPhase II Project ObjectivesPhase II Project ObjectivesPhase II Project ObjectivesWe have three technical objectives in the Phase II project whose feasibility has been demonstrated in the Phase I projectdemonstrated in the Phase I project.
Objective 1: Demonstrate the ability to accurately model carrier mobility in the crystal bulk. (Done—will show results)
Objective 2: Demonstrate the ability to accurately compute the electric field around the passivated surface. (currently at ORNL, moving to VORPAL)
Objective 3: Develop a more accurate determination of the gamma ray event location near the non-passivated surface. (Rest of this talk)

Valence Band Structure for Valence Band Structure for
• Band structure incorporated in dispersion relation:• Determines energy vs velocity and group velocity for MC simulations
Monte Carlo SimulationsMonte Carlo Simulations• Determines energy vs. velocity and group velocity for MC simulations• Analytic models (Warped, Parabolic, Elliptic, etc.)
•Straight forward to compute scattering probabilities between crystal and particleand particle• Can include binary interactions: carrier-carrier scattering in a straightforward manner• Models have small range of validity in energy domain around the g y gyband maxima (valence) or minima (conduction)
• Numerical models (e.g., k.p and full band)• Wider range of validity in energy domain• Scattering probabilities are far more computationally intensive
• Numerical models may be necessary on surfaces where band structure is complicated, e.g., sub-band splitting due to surface electronic structure ( fi t) f E fi ld 2D DOS t(confinement), surface E-fields, 2D DOS, etc.
Warped Band Model (3D)Warped Band Model (3D)
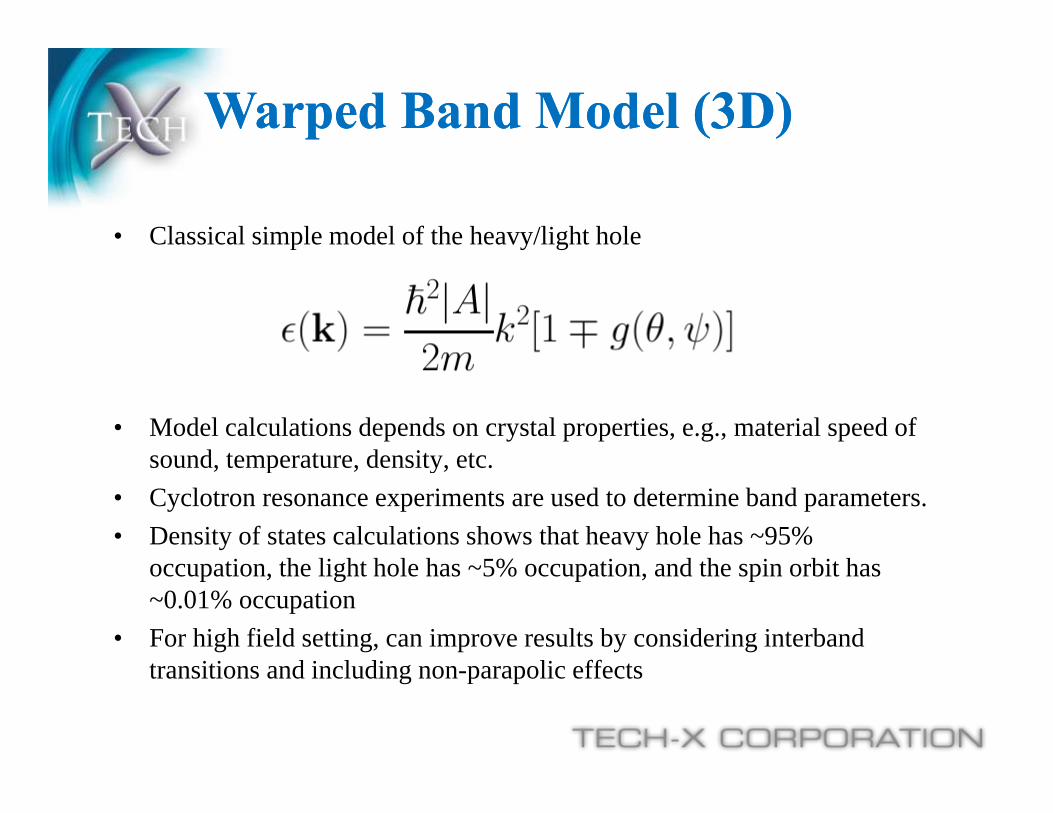
• Classical simple model of the heavy/light hole
• Model calculations depends on crystal properties, e.g., material speed of sound temperature density etcsound, temperature, density, etc.
• Cyclotron resonance experiments are used to determine band parameters.• Density of states calculations shows that heavy hole has ~95%
ti th li ht h l h 5% ti d th i bit hoccupation, the light hole has ~5% occupation, and the spin orbit has ~0.01% occupation
• For high field setting, can improve results by considering interband t iti d i l di li ff ttransitions and including non-parapolic effects
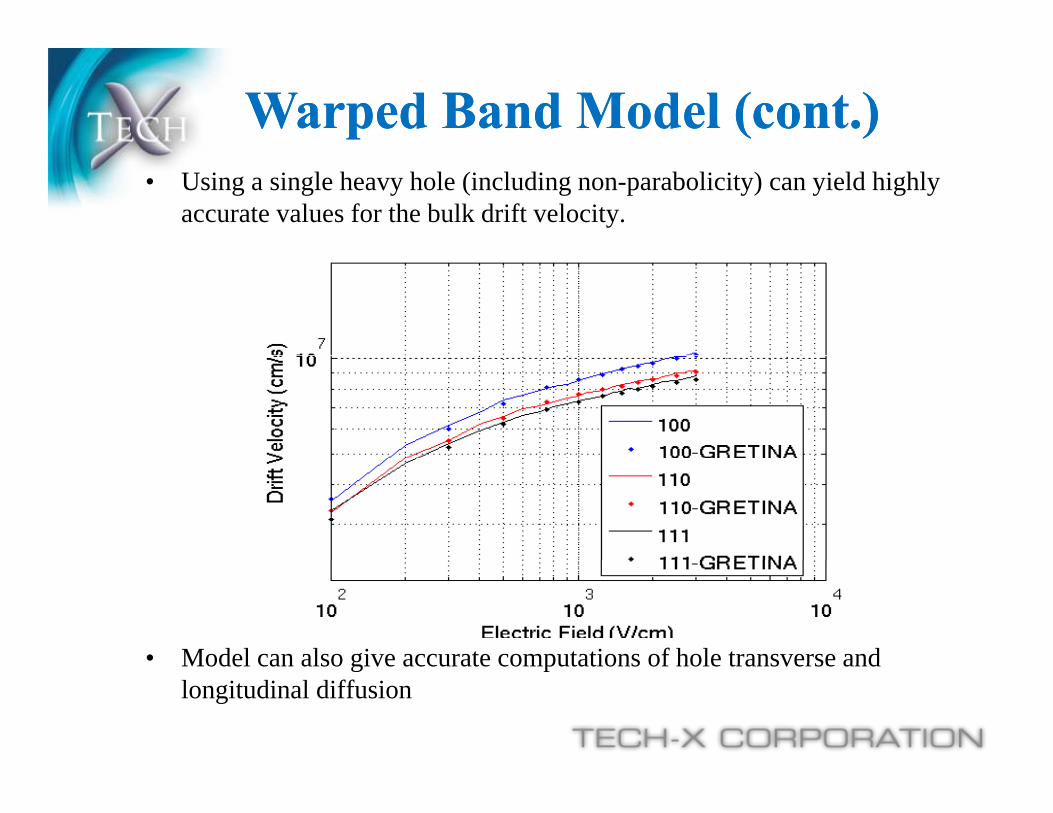
Warped Band Model (cont.)Warped Band Model (cont.)• Using a single heavy hole (including non-parabolicity) can yield highly
accurate values for the bulk drift velocity.
• Model can also give accurate computations of hole transverse andModel can also give accurate computations of hole transverse and longitudinal diffusion
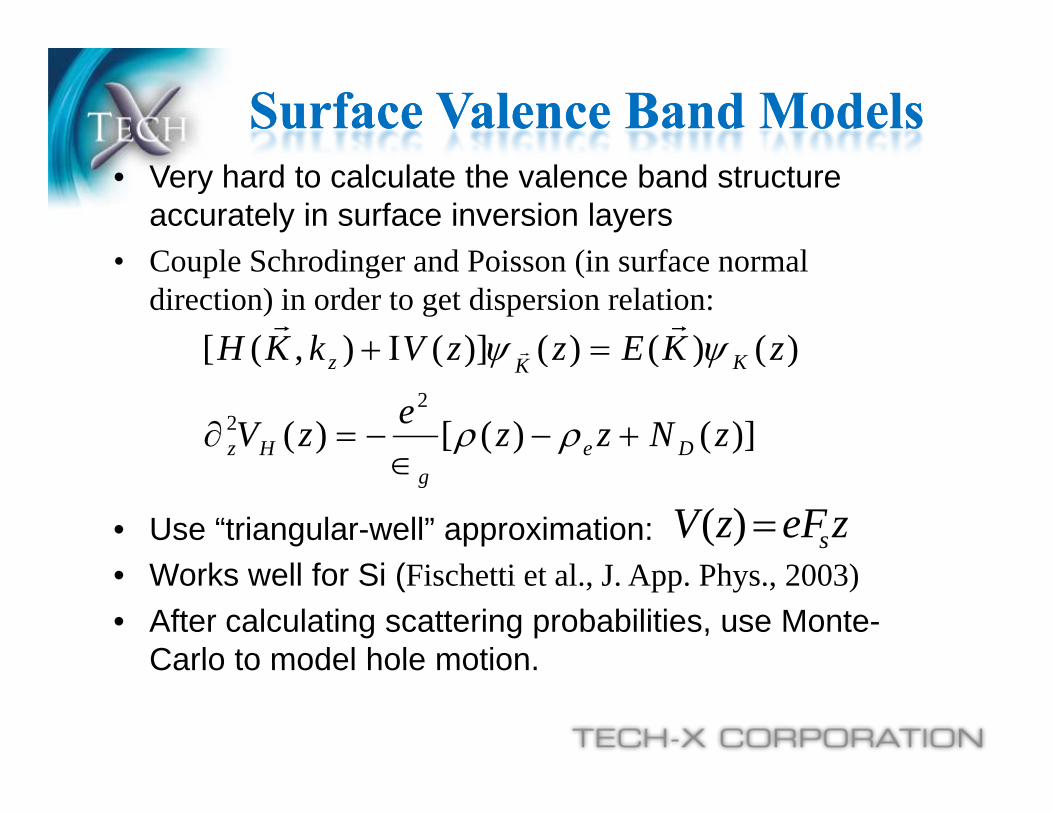
Surface Valence Band ModelsSurface Valence Band Models• Very hard to calculate the valence band structure
accurately in surface inversion layersC l S h di d P i (i f l• Couple Schrodinger and Poisson (in surface normal direction) in order to get dispersion relation:
)()()()]()([ zKEzzVkKH K
)]()([)(
)()()()](),([2
2 zNzzezV
zKEzzVkKH
DeHz
KKz
• Use “triangular-well” approximation:
g
zeFzV s)(• Works well for Si (Fischetti et al., J. App. Phys., 2003)• After calculating scattering probabilities, use Monte-
Carlo to model hole motionCarlo to model hole motion.

Surface Valence Band ModelsSurface Valence Band Models(Fischetti et al J App Phys 2003)(Fischetti et al., J. App. Phys., 2003)
• Surface potential gives rise to band splittingp g p g
• Phonons can scatter holes into various sub-bands
A Simple Surface Valence A Simple Surface Valence Band Model (2D)Band Model (2D)Band Model (2D)Band Model (2D)
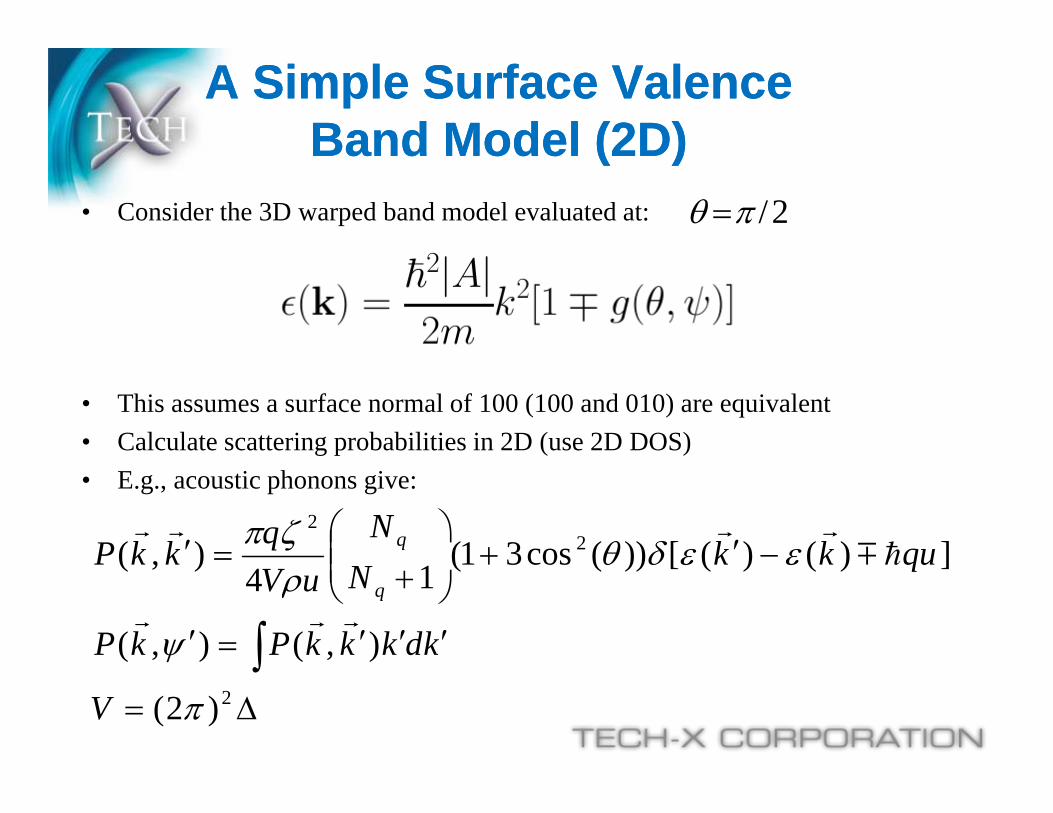
• Consider the 3D warped band model evaluated at: 2/
• This assumes a surface normal of 100 (100 and 010) are equivalent• Calculate scattering probabilities in 2D (use 2D DOS)• E.g., acoustic phonons give:
22
])()([))(cos31()( qukkNqkkP q
),(),(
])()([))(cos31(14
),(
kdkkkPkP
qukkNuV
kkPq
2)2( V
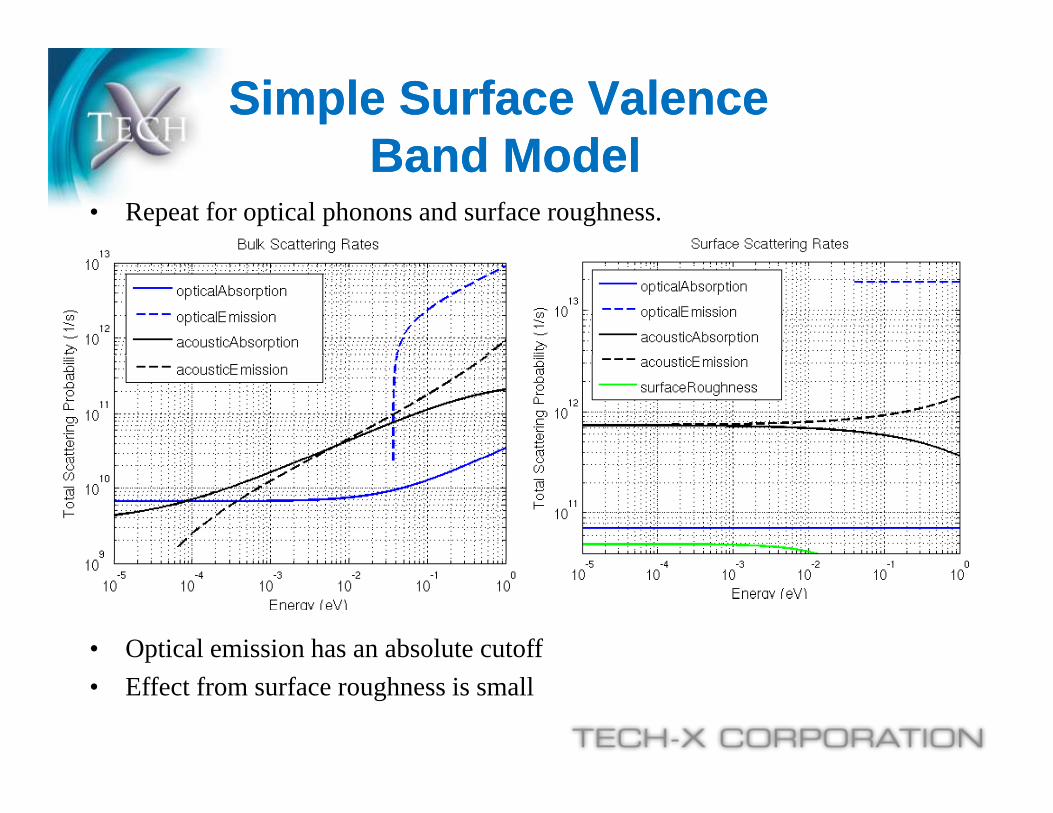
Simple Surface ValenceSimple Surface ValenceBand ModelBand ModelBand ModelBand Model
• Repeat for optical phonons and surface roughness.
• Optical emission has an absolute cutoff• Effect from surface roughness is small

Simple Surface Valence Simple Surface Valence Band ModelBand ModelBand ModelBand Model
• Drift velocity shows substantial changes.
• PPC detector surface radial E-field 125 V/cm; Vd=2.5*10^5 cm/s

ConclusionsConclusions• Reduction in surface mobility because of fundamental changes in phonon
scattering• Surface effects change with delta (for model considered here).• Simple models can yield insight into the surface behavior
Current and future workCurrent and future work• Implementing interband scattering between heavy and light bands• Integrating more accurate band non-parabolicity for simple warped band model
Current and future workCurrent and future work
Integrating more accurate band non parabolicity for simple warped band model (energy dependent effective mass)
• Developing surface subband calculations (triangular well appx) for Ge and coupling into Monte Carlo simulations (VORPAL)coupling into Monte Carlo simulations (VORPAL)
• Need to validate results with more experimental data to from PPC and GRETINA detectors
• Overall result will be better signal modeling for GRETINA=better• Overall result will be better signal modeling for GRETINA=better resolution = better physics