modeling genomic regulatory networks with big data · · 2017-06-24modeling genomic regulatory...
TRANSCRIPT
TIGS-1108; No. of Pages 10
Modeling genomic regulatorynetworks with big dataHamid Bolouri
Division of Human Biology, Fred Hutchinson Cancer Research Center (FHCRC), 1100 Fairview Avenue North, PO Box 19024, Seattle,
WA 98109, USA
Review
High-throughput sequencing, large-scale data generationprojects, and web-based cloud computing are changinghow computational biology is performed, who performsit, and what biological insights it can deliver. I review herethe latest developments in available data, methods, andsoftware, focusing on the modeling and analysis of thegene regulatory interactions in cells. Three key findingsare: (i) although sophisticated computational resourcesare increasingly available to bench biologists, tailoredongoing education is necessary to avoid the erroneoususe of these resources. (ii) Current models of the regula-tion of gene expression are far too simplistic and needupdating. (iii) Integrative computational analysis of large-scale datasets is becoming a fundamental component ofmolecular biology. I discuss current and near-term oppor-tunities and challenges related to these three points.
Gene regulatory networks (GRNs)The past few years have witnessed dramatic milestones inhigh-throughput sequencing, large-scale data generation,cloud computing, and computational biology. Supra-expo-nential improvements in the throughput and cost of DNAsequencing (http://www.genome.gov/sequencingcosts/) havebeen accompanied by improvements in accuracy and reduc-tions in the required sample size. These improvements havein turn led to the widespread adoption of a broad range ofsequencing-based technologies (reviewed in [1]) to charac-terize not only genomes but also the regulatory interactionsthat allow genomes to specify cellular structure, function,and behavior.
GRNs are defined as the set of interactions among genesand their products (RNAs and proteins) that determine theisoforms, location (cell type), timing, and rate of RNAexpression [2] (see Figure 1 for examples). With the possi-ble exception of some metabolic and physiological process-es, GRNs are the primary drivers of cellular behavior andfunction.
Because GRNs are ultimately specified by the digitalcode of DNA, they are uniquely accessible to both high-
0168-9525/$ – see front matter
� 2014 Published by Elsevier Ltd. http://dx.doi.org/10.1016/j.tig.2014.02.005
Corresponding author: Bolouri, H. ([email protected]).Keywords: gene regulatory networks; modeling; network biology; big data; computa-tional biology; bioinformatics; systems biology.
throughput sequencing-based technologies and to compu-tational modeling and analysis. At the same time, GRNsare both complex (i.e., can exhibit hard-to-predict/nonline-ar behaviors) and complicated (i.e., they are composed oflarge numbers of component parts and interactions). Forthis reason, mathematical and computational approachesare essential in GRN research.
Cellular behaviors have traditionally been character-ized as being mediated through highly distinct processes(e.g., DNA replication) and pathways (e.g., the canonicalWNT signaling pathway). However, because of widespreadinteractions among cellular processes and pathways, theuse of unbiased, genome-wide technologies is essential tothe discovery and characterization of GRNs.
In addition to the bedrock of ‘classical’ cis-regulatoryanalysis, GRN modeling today is buttressed by four cor-nerstones: (i) high-throughput technologies, (ii) integrativeanalysis of complementary data types, (iii) leveraginglarge-scale public datasets, (iv) computational modelingand analysis. This article reviews recent developments anddiscusses their implications for future research.
To maintain coherence and brevity, this review willfocus on developments in human GRN modeling and anal-ysis. Diverse new GRN modeling opportunities are alsoopening up in both well-studied and less-studied organ-isms. These and the complex GRNs underlying interac-tions between hosts and commensal or pathogenicorganisms are beyond the scope of the present review.
Types and uses of human GRN modelingA model is any representation of a system that can facili-tate its analysis, communication, or documentation [3].Modeling is at the heart of GRN research at multiplelevels. At the most basic level, statistical models are atthe heart of all high-throughput data analysis. For exam-ple, statistical models are commonly used to characterizeDNA fragment length distribution as a first step towardsthe identification of transcription factor (TF) binding peaksin ChIP-seq (chromatin immunoprecipitation followed byhigh-throughput DNA sequencing) data.
Given filtered data, methods such as network inference[4], guilt-by-association (e.g., through network or expres-sion clustering; see Figures 2 and 3), and enrichment/over-representation analysis (e.g., to identify the impactedpathways or processes [5]) are used to organize genesand their products into broad-brush conceptual models.These models can then be refined and extended by inte-grating multiple data types each highlighting a different
Trends in Genetics xx (2014) 1–10 1

PROMOTE S
89 Notch/CSL PROMOTE S Deltex1 Taghon et al 2005 Genes Dev; Franco et al. 2006 PNAS; Taghon et al 2007 Nat Immunol; many earlier references
116 Notch/CS L PROMOTE S Ets2 Taghon et al 2007 Nat Immunol; Franco et al 2006 PNAS
34 Notch/CSL PROMOTE S HES- 1 Taghon et al 2005 Genes Dev; man y other re ferences
149 Notch/CS L PROMOTE S LEF-1 Taghon et al 2007 Nat Immunol
165 Notch/CS L PROMOTE S Notch1 Taghon et al 2007 Na t Immu nol
166 Notch/CS L Notch3 Taghon et al 2007 Na t Immuno l
0 Notch/C SL PRO MOT ES PTaReizis, B. & Leder Genes D ev. 200 2 Feb 1;1 6(3) :295-3 00; F ranco et a l. 200 6 PN AS; Taghon et al 2007 Nat Immunol
153 Notch/CS L PROMOTE S Runx1 Taghon et al 2007 Nat Immunol; Franco et al 2006 PNAS; cf. also Nakag awa,M.et al.: Chiba, Blood . 20 06 Nov 15;108(10 ):3329-3 4.
SourceId TargetId Source Sig n Target Evidence
32 171 Notch/CSL REPRESSES C/EBPa Weak early effect? Stronger indirect effect? (Franco et al. 2006 shows effect on purified Thy-1+ cells; not seen in crude frac�on in Taghon et al 2007)
265 100 DN2, DN3 Stage nega�veRegulator REPRESSES GATA-2 Tydell et al. 2007 J. Immunol.
264 163 DN3 Specific regulator PROMOTES Eva 1 Tydell et al. 2007 J. Immunol.
265 161DN2, DN3 Stage nega�veRegulator REPRESSES c-Kit Taghon et al. 2006 Immunity; Yui & Rothenberg 2004 J. Immunol.
264 16 5 DN3 Specific regulator PROMOTES Notch1 Taghon et al. 2006 Immunity
192 82 Notch-mod. GATA- 3 REPRESSES TCF-1 Taghon et al 2007 Nat Immunol
32 117 Notch/CSL PROMOTES HEBAlt Wang, D.et al.: Anderson, J Immunol. 2006 Jul 1;177(1):109 -19; Franco et al 2006 PNAS.
32 160 Notch/CS L PROMOTES CD25 Ta ghon et al 2005 ; I. Maillardet al.: Pear, J Exp Med. 2006 Oct 2;203 (10 ):2239 -45.
32
32
32
32
32
32
32
32
(A)
(B)
TRENDS in Genetics
Expression:Key:
LowMediumHigh
GATA-3 GATA-3 GATA-3 GATA-3
Notch-mod.GATA-3
Notch-mod.GATA-3
Notch-mod.GATA-3
Notch-mod.GATA-3
Bcl11BTCF-1 Bcl11BTCF-1 Bcl11BTCF-1 Bcl11B
PTαNrarpHES-1PTαNrarpHES-1PTαNrarpHES-1PTαNrarpHES-1
Notch3 Notch3 Notch3 Notch3
Notch1 CD25Deltex1Notch1 CD25Deltex1Notch1 CD25Deltex1Notch1 CD25Deltex1
Pou6f1 LEF-1 SATB1
Bcl2 Erg
Pou6f1 LEF-1 SATB1
Bcl2 Erg
Pou6f1 LEF-1 SATB1
Bcl2 Erg
Pou6f1 LEF-1 SATB1
Bcl2 ErgDN4DN3DN2DN1
TCF-1
Figure 1. Examples of gene regulatory network analysis, documentation, and visualization. (A) Part of BioTapestry visualization of a proposed early T cell specification gene
regulatory network (GRN) (adapted from: http://www.its.caltech.edu/�tcellgrn/Oldnetwork.html). Each gene (symbol with a bent arrow) is represented as having a
regulatory region (horizontal line) and a transcriptional output (arrow). A transcription factor (TF)–DNA binding interaction is depicted as an arrow incident on the regulatory
region of a gene. Protein–protein interactions are depicted by circles with incident and output arrows. The background color of each gene indicates the fold-change in
expression of the gene at a particular developmental stage. Snapshots of the network over four developmental stages are shown [double negative (DN) 1 to 4]. In the
interactive viewer, clicking on a gene brings up a table showing the experimental data supporting the indicated regulatory interactions. (B) Cytoscape visualization of
potential T cell specification gene regulatory interactions derived from ChIP-seq and gene expression data. Arrows represent regulatory interactions. Node colors and sizes
represent gene expression levels at early and late developmental stages. The inset shows a zoomed-in view of the lower portion of the network. Using Cytoscape utilities,
the user can quickly and easily identify a set of genes coregulated by Sfpi1 and Lyl1 (edge arrows highlighted in gold). This example network was derived during a 1.5 h
introductory laboratory session by novice computational biology students (see http://www.bu.edu/computationalimmunology/summer-school/ for details).
Review Trends in Genetics xxx xxxx, Vol. xxx, No. x
TIGS-1108; No. of Pages 10
2
Expression in condi�on 1
Expr
essio
n in
con
di�o
n 2
PC1
PC2
PC1
PC2
PC1
PC2
(A) (B)
(C) (D)
TRENDS in Genetics
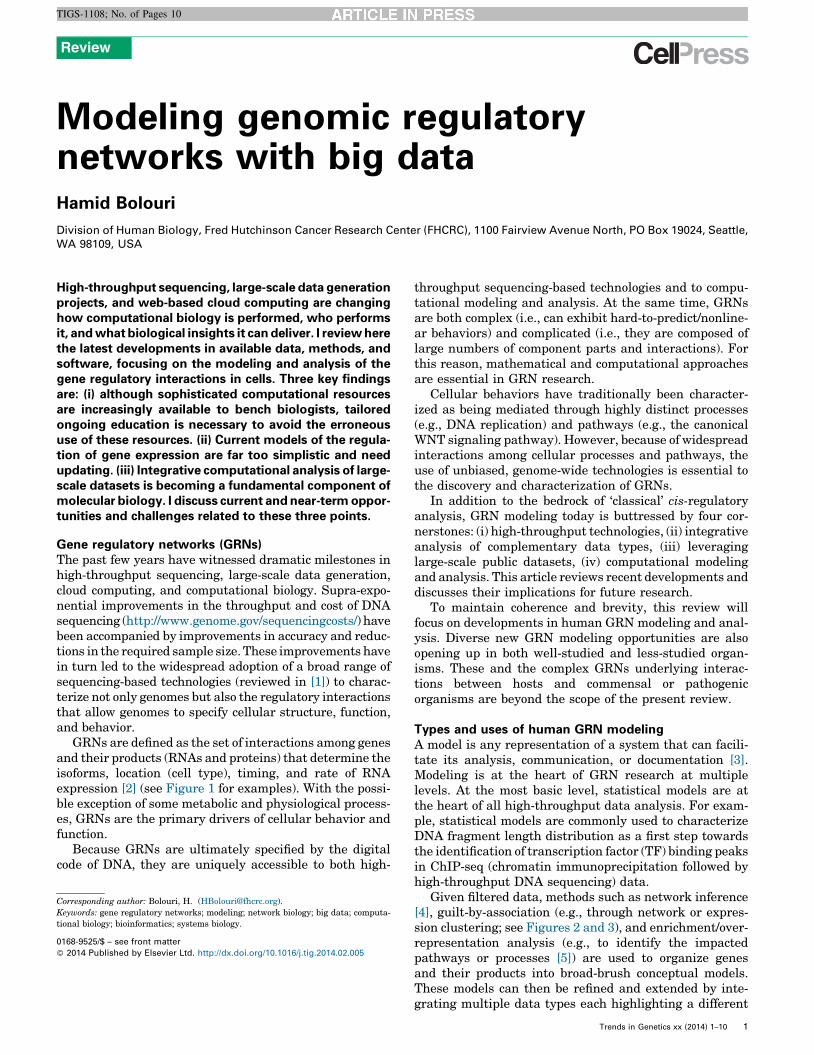
Figure 2. An example of how choices in data processing impact the findings. (A) Scatter plot of example simulated data showing the expression of 200 genes in two
conditions. This simulated dataset was intentionally generated to have two distinct characteristics. First, genes near the lower-right (upper-left) corner of the plot are high
(low) in condition 1 and low (high) in condition 2. In addition, there are two well-separated groups of genes distinguished by having generally higher (lower) expression in
both conditions. (B) The same data plotted in the space of the principal components (PC) (in this case, because there were only two conditions, there are only two PCs). Note
that the two PCs optimally distinguish the two characteristics of the data. (C,D) Unsupervised hierarchical clustering identifies different features of the data depending on
how distances between clusters are measured (clusters marked by oblongs and labeled 1 and 2). In ‘single-linkage’ clustering (C), the distance between two clusters is
defined as the distance between their nearest elements. In ‘complete-linkage’ clustering (D), the distance between two clusters is defined as the distance between their
farthest elements.
Review Trends in Genetics xxx xxxx, Vol. xxx, No. x
TIGS-1108; No. of Pages 10
aspect of the system {e.g., mRNA and microRNA (miRNA)expression data from RNA-seq (whole transcriptome shot-gun RNA sequencing), TF DNA-binding data from ChIP-seq, and protein interaction data from mass spectrometry[6] or yeast two-hybrid assays [7]}.
Depending on the available data, GRN models mayrepresent snapshots of the state of the GRN in differentcells (for examples, see [8] and Figure 1), they may capturethe dynamic trajectory of GRN state changes in a particu-lar group of cells over time (e.g., [9]), or they may quanti-tatively predict the kinetics of expression of individualgenes (e.g., [10]).
Importantly, all of the above GRN model types can beused to predict the impact of genetic, epigenetic, and
environmental perturbations on cells (see below), or topredict potential drug targets (e.g., [11]). Drug targetdiscovery based on GRN models was recently reviewedcomprehensively in [12] and therefore will not be discussedfurther here.
Using GRN models to address diseaseIn the application of GRN modeling to diseases it is helpfulto consider disease-causing perturbations as impacting aGRN in two distinct ways: (1) changes in the interactions ofthe component genes (e.g., [13]) impact the ‘view from thegenome’ (i.e., the set of all regulatory interactions encodedin the genome [14]). (2) Changes in the cell type(s) in whicha gene is expressed, the time of onset and duration of
3

-2 -1 0 1 2Column Z-score
00.
20.
4De
nsity
Color keyand density plot
-2 -1 0 1 2Column Z-score
00.
20.
4De
nsity
Color keyand density plot
-2 -1 0 1 2Column Z-score
00.
20.
4De
nsity
Color keyand density plot
-2 -1 0 1 2Column Z-score
00.
20.
4De
nsity
Color keyand density plot
(A) (B)
(C) (D)
TRENDS in Genetics
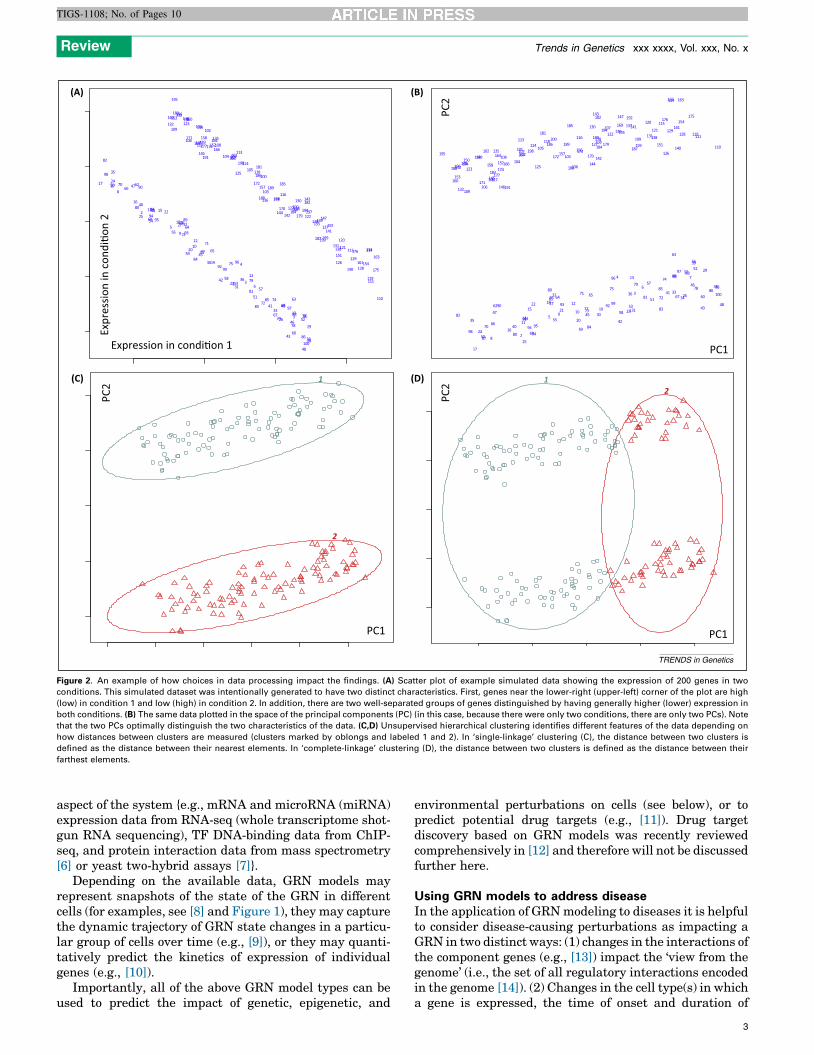
Figure 3. Example of the impact of choices in data visualization. (A,B) Heatmaps of the same data as in Figure 2 clustered as in Figure 2C. (C,D) Heatmaps of the same data
as in Figure 2 clustered as in Figure 2D. Each vertical column (marked by the gold and brown bar) represents data from one condition. Each row represents the expression
levels of one gene across the two conditions (note identical row dendrograms in A,B and C,D). The purple and gray side-bar colors mark the two well-separated groups of
genes visible in Figure 2A. The only difference between (A) and (C) – or between (B) and (D) – is the color scale (as indicated at the top-left of each plot). Note how (A) and (C)
give the impression of more homogeneous gene expression clusters. This example highlights the need to include dendrogram and color-scale information in heatmap
plots, something that is often overlooked by inexpert users.
Review Trends in Genetics xxx xxxx, Vol. xxx, No. x
TIGS-1108; No. of Pages 10
transcriptional activity (e.g., brief versus long-lasting), orthe magnitude of gene expression (e.g., [10]).
The impact of the latter group of perturbations (e.g.,activating or loss of function mutations) can often be pre-dicted by appropriately modifying GRN models for healthycells. To predict the effects of group 1 perturbations (i.e.,those affecting interactions) we need to know all changes ininteractions. For example, a DNA-binding fusion oncopro-tein such as TMPRSS2:ERG (transmembrane protease,serine 2, fused to the ETS-related gene ERG) or RUN-X1:ETO [Runt-related transcription factor 1, fused to theeight-twenty-one (ETO) nuclear corepressor] may bind tonew DNA loci and activate or repress genes that neither ofthe fusion partners regulate individually [15]. Alternative-ly, a gene product may lose a subset of its interactions, for
4
example when a particular DNA binding site is mutated[16]. Because functional protein–DNA interactions areoften the result of complex multiprotein interplay, compu-tational prediction of lost and gained interactions is cur-rently challenging, but promising new experimentalapproaches have recently been demonstrated [17,18].
Another way in which GRN models of healthy cells canbe used to address human disease is through the identifi-cation of candidate disease-causing genes. Candidate dis-ease-causing gene lists can be produced by a wide variety ofapproaches, including genome-wide association studies(GWAS), DNA sequencing, expression profiling, andRNA interference (RNAi) and synthetic-lethality screens.GRN structure analysis can help rank candidate genes. Forexample, a recent study [19] suggests that, in both protein

Review Trends in Genetics xxx xxxx, Vol. xxx, No. x
TIGS-1108; No. of Pages 10
interaction and gene regulatory networks, essential genestend to be more central and highly connected. Thus, asimple approach to ranking candidate genes would be toprioritize genes that are more highly connected and morecentral in GRN models. For a review of candidate geneprioritization tools using interaction networks and guilt-by-association see [20] and the associated Gene PrioritizationPortal (http://homes.esat.kuleuven.be/�bioiuser/gpp/).
An additional approach to discovering candidate dis-ease-causing genes is ‘genetical genomics’, which typicallygenerates multiple candidate quantitative trait loci (QTLs)identifying associations between gene expression and ab-errant splicing, chromatin state, or TF binding in a givencell type (reviewed in [21]). In this context, GRN models ofdisease-related pathways and processes can be used torank variants and target genes by disease relevance andpotential to be causal (see e.g., [22,23]).
The cumulative efforts of many disease-focused projectshave also led to the development of generally useful GRNmodeling resources. For example, many cancer cell linesare also used to study cellular pathways and processes notspecific to cancer. The Cancer Cell Line Encyclopedia(CCLE, http://www.broadinstitute.org/ccle) includes dataon mutations in �1600 genes, and genome-wide data ongene expression and copy-number variations in 947 humancell lines. Integration of these data with existing interac-tion and pathway databases will aid the development ofcell line-specific GRN models and further our understand-ing of the impact of DNA sequence variants on GRNstructure, function, and behavior.
Several dedicated online resources (e.g., https://genome-cancer.ucsc.edu and http://www.cbioportal.org) allow inter-active mining and exploration of large-scale datasets fromThe Cancer Genome Atlas (TCGA, http://cancergenome.nih.gov/) project. Of special interest here is the platform-independent, menu-driven geWorkbench (genomics work-bench) of TCGA (http://wiki.c2b2.columbia.edu/workbench),which offers a large collection of general-purpose ‘plug-in’modules including the popular ARACNE (algorithm for thereconstruction of accurate cellular networks) GRN inferencealgorithm [24], and the MARINa master regulator TF de-tection algorithm [25].
The impact of high-throughput technologiesChIP-seq, RNA-seq, and miRNA-seq are by now well-established (for a review of ChIP-seq and related emergingtechnologies, see [26]). The October 2012 data release fromthe ENCODE project (Encyclopedia of DNA Elements;http://encodeproject.org, see http://genome.ucsc.edu/en-code/pubs.html for publications) spans 4060 experimentsusing 33 experimental approaches. Likewise, as of October2013, the National Institutes of Health (NIH) RoadmapEpigenomics project (http://www.roadmapepigenomics.org/) has performed 3176 experiments in 61 tissue types.
Together, the ENCODE and Epigenomics projects pro-vide a unique resource of multiple cell lines in which geneexpression, chromatin regulatory state (via DNA methyla-tion assays and histone-modification ChIP-seq), chromatinaccessibility (via DNase I-seq and FAIRE-seq, see below),RNA polymerase II (Pol2) activity state, and the bindingpatterns for multiple TFs have been characterized. As
discussed below, these datasets enable the prediction ofcell type-specific gene regulatory interactions and greatlyfacilitate GRN modeling in other cell types by revealing the‘view from the genome’ GRN in humans.
In addition to antibodies for Pol2, phosphorylated (tran-scriptionally active) Pol2, Pol3, and 17 histone modificationstates, the ENCODE project currently lists antibodies for221 protein isoforms (https://genome.ucsc.edu/encode/antibodies.html, accessed October 2013), suggesting thatChIP-seq is currently feasible for only about 10% of theestimated 1500–3000 [27,28] human TFs (the 2012 EN-CODE release of uniformly processed TF ChIP-seq peaks,encompassing 690 experiments, 161 distinct factors, and91 cell types, can be accessed at http://genome.ucsc.edu/cgi-bin/hgFileUi?db=hg19&g=wgEncodeAwgTfbsUniform).
In contrast to ChIP-seq, DNase I-seq and FAIRE–seq(formaldehyde-assisted identification of regulatory ele-ments followed by tag sequencing) experiments offer unbi-ased genome-wide identification of (nucleosome-depleted,open-chromatin) regulatory regions [29]. Moreover, veryhigh coverage DNase I/FAIRE-seq can be used to delineateat nucleotide resolution the binding footprints of individualTFs [30].
Because DNase I hypersensitivity (HS) regions areshort and well-defined, searching them for occurrencesof known TF binding motifs can yield high-confidencebinding-site predictions. As part of the ENCODE effort,researchers [31] searched for in vitro determined TF bind-ing motifs in DNase I HS regions within 5 kb of thetranscription start-sites of 475 TFs in 41 cell types. TheGRNs inferred in this way recapitulate many known cell-specific interactions, confirming the potential of this ap-proach.
Searching within DNase I HS and footprint regions hasallowed high-confidence predictions of TF binding withinthese regions. However, motif searches typically cannotdistinguish between members of TF families. This uncer-tainty is alleviated in ChIP-seq data where the mostenriched motifs should correspond to the immunoprecipi-tated factor and its co-factors. Accordingly, all ENCODEChIP-seq binding peaks have been searched for matches toknown TF binding motifs and also for statistically over-represented novel motifs [32], and these data are publiclyavailable for mining (http://compbio.mit.edu/encode-motifs/).
In parallel efforts, TF ChIP-seq peaks have been dem-onstrated to cluster spatially in the genome [33,34] andthese cluster regions were shown to correspond closelywith regulatory regions marked by DNase I and histonemodification assays [35]. Clustered TF binding regionsmay distinguish functionally active regulatory DNA bind-ing from inactive, random DNA binding.
Correlations between histone modification patterns andactive/poised enhancers and promoters are well estab-lished (for a review of epigenetic regulation, see [36]). Arecent study combined the latest large-scale data releasesand two previously demonstrated machine-learning meth-ods to identify candidate regulatory regions genome-wide[37]. These and other annotations resulting from integra-tive analysis of the ENCODE data are now available asbrowser tracks from the University of California, SantaCruz – UCSC (http://genome.ucsc.edu/encode/analysis.
5

Review Trends in Genetics xxx xxxx, Vol. xxx, No. x
TIGS-1108; No. of Pages 10
html) and ENSEMBL (http://ensembl.org/info/website/tutorials/encode.html) genome browsers.
To date, GRN modeling and analysis efforts have tendedto focus on RNA and gene-level data. Recent technologicalimprovements are driving the development of morenuanced GRN models. In particular, high-depth RNA se-quencing is increasingly providing isoform abundance in-formation [38], thus allowing GRN models to includealternative splicing events. At the same time, phosphopro-teomics is maturing to allow the integration of post-trans-lational modifications into GRN models [39].
Associating distal enhancers with specific genes hasbeen challenging so far. Many previous studies have usedthe binding sites of the boundary element/insulator pro-tein CTCF (CCCTC-binding factor) to impose bounds onthe possible targets of a candidate enhancer region. How-ever, CTCF is a multifunctional protein with complexregulatory roles (reviewed in [40]). ChIA-PET (chromatininteraction analysis using paired-end tag sequencing) andgenome-wide high-resolution chromatin conformationcapture techniques such as HiC now provide improvedmethods for mapping DNA–DNA interactions (reviewedin [41]).
The studies reviewed above deliver snapshots of GRNstates under specified conditions. Recent developmentsenabling large-scale measurements of the productionand decay rates of mRNA and protein levels enable model-ing of GRN dynamics. Specifically, dynamic transcriptomeanalysis (DTA) uses metabolic RNA labeling to measurethe production and decay rate of RNAs [42], whereas‘ribosome profiling’ measures translational efficiency bydeep sequencing of ribosome-protected mRNA fragments[43,44].
The implications of big dataAs discussed above, high-throughput data are driving thedevelopment of more detailed, more mechanistic, and morepredictive GRN models. In addition to the CCLE, ENCODE,TCGA, and Roadmap Epigenomics projects discussed above,many national and international projects are now generat-ing large volumes of sequencing-based data. Examples in-clude the National Cancer Institute (NCI) TARGET project(Therapeutically Applicable Research to Generate EffectiveTreatments; http://ocg.cancer.gov/programs/target), the1000 Genomes project (http://www.1000genomes.org/), theNIH Gene-Tissue Expression program (http://common-fund.nih.gov/GTEx/), the International Cancer Genome(http://dcc.icgc.org/) and Epigenome (http://ihec-epigenome-s.org/) Consortia, and many more.
There is a pressing need for careful filtering and inter-pretation of these data (see examples in Figure 4). Effortssuch as the NIH Big Data to Knowledge (BD2K, http://bd2k.nih.gov/) initiative are needed to ensure that largedatasets can be easily accessed, understood, searched,cross-referenced, combined, and interpreted. Such effortswill ultimately make big data directly available to benchbiologists for mining. In the meantime, there are excitingopportunities for computational biologists to develop celltype- and disease-specific GRN models by filtering, compar-ing, and integrating data from multiple sources and experi-ments. For example, the Bioconductor AnnotationHub
6
(http://www.bioconductor.org/packages/2.13/bioc/html/AnnotationHub.html) currently makes 5324 human data-sets readily accessible to users of the R programming lan-guage. Genome-wide GRN models built from such data canbe used to inform the construction of more focused small-scale GRN models of specific cellular processes and path-ways.
To enable reproducible research, data, script, and work-flow sharing facilities offered by dedicated tools such asSynapse (https://www.synapse.org) and by multifunctionalsoftware suites such as GenePattern and Galaxy (dis-cussed below) can be used to make the models derivedfrom big data publicly available along with their associateddata, scripts and workflows. Such sharing will aid rapidand widespread uptake, ensure reproducibility, and cata-lyze the development of future GRN models.
Developments and trends in computational toolsGRN models can span from genetic interaction maps tophysical interaction graphs to models of network dynamicsand gene expression kinetics. A very broad range of soft-ware tools have been developed to address GRN modelingand analysis at all these levels. For brevity, here I sum-marize only recent trends and cite some examples.
In integrative model-building, multiple types of experi-mental data and computational predictions are combinedto infer gene regulatory interactions from large-scale data[45]. A large number of databases provide protein–proteinand protein–DNA interaction information extracted fromthe literature and curated to varying degrees. GeneMania(http://genemania.org/) integrates pathway and interac-tion data with coexpression, colocalization, and gene on-tology information from a multitude of sources. Aconfidence weight is associated with each reported inter-action, making GeneMania a convenient and useful start-ing point for GRN modeling (for two other useful startingpoints, see http://www.ihop-net.org/UniPub/iHOP andhttp://string-db.org/).
Many new and established tools provide specializeddata analysis resources – typically via platform-indepen-dent downloadable software or through web browsers.Such tools include over-representation/enrichment analy-sis servers such as GeneTrail (http://genetrail.bioinf.uni-sb.de/), TargetMine (http://targetmine.nibio.go.jp/), andDavid (http://david.abcc.ncifcrf.gov/); Gene-E for expres-sion clustering (http://www.broadinstitute.org/cancer/soft-ware/GENE-E); the MATISSE (module analysis viatopology of interactions and similarity sets)–DEGAS (dys-regulated gene set analysis via subnetworks) suite for theidentification of GRN modules and pathways from expres-sion data (http://acgt.cs.tau.ac.il/matisse/); and Genomica(http://genomica.weizmann.ac.il/), which identifies func-tionally related gene groups and enrichment patterns inexpression data.
GRN models have several distinctive features not sharedby signaling and other network models. Changes in geneexpression patterns typically occur on a much slower time-scale than protein–protein interactions and post-transla-tional modifications. Viewed from the perspective ofGRNs, many signaling and other processes can be viewedas simple switching ‘events’. This realization greatly
00
10000
10000
20000
20000
30000
30000
40000
40000
50000
50000
60000
60000
70000
70000 0 10000 20000 30000 40000 50000 60000 70000
(A) (B)
(C) (D)
0
10000
20000
30000
40000
50000
60000
70000
0
5000
10000
15000
20000
25000
30000
35000
40000
45000
50000
0 10000 20000 30000 40000 50000
‘Op�mal’ parameters ‘Conserva�ve’ parameters
Shared(SPP and peakSeq)
Shared and inDNase I HS
Number of ‘op�mal’ peaks
Num
ber o
f ‘co
nser
va�v
e’ p
eaks
Num
ber o
f ‘co
nser
va�v
e’ p
eaks
Shared and inDNase I HS
Number of peakSeq peaks Number of peakSeq peaks
1
100
1000
Dis�nct transcrip�on factors
Num
ber o
f SPP
pea
ks
Num
ber o
f SPP
pea
ks
TRENDS in Genetics
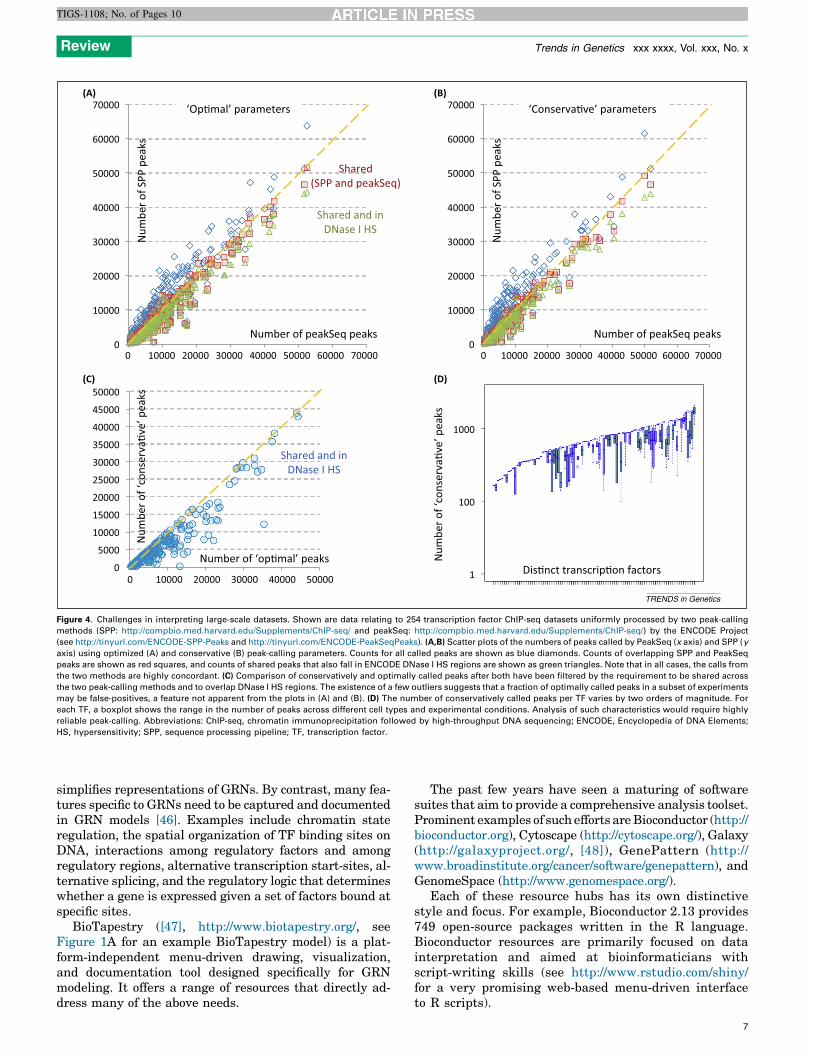
Figure 4. Challenges in interpreting large-scale datasets. Shown are data relating to 254 transcription factor ChIP-seq datasets uniformly processed by two peak-calling
methods (SPP: http://compbio.med.harvard.edu/Supplements/ChIP-seq/ and peakSeq: http://compbio.med.harvard.edu/Supplements/ChIP-seq/) by the ENCODE Project
(see http://tinyurl.com/ENCODE-SPP-Peaks and http://tinyurl.com/ENCODE-PeakSeqPeaks). (A,B) Scatter plots of the numbers of peaks called by PeakSeq (x axis) and SPP (y
axis) using optimized (A) and conservative (B) peak-calling parameters. Counts for all called peaks are shown as blue diamonds. Counts of overlapping SPP and PeakSeq
peaks are shown as red squares, and counts of shared peaks that also fall in ENCODE DNase I HS regions are shown as green triangles. Note that in all cases, the calls from
the two methods are highly concordant. (C) Comparison of conservatively and optimally called peaks after both have been filtered by the requirement to be shared across
the two peak-calling methods and to overlap DNase I HS regions. The existence of a few outliers suggests that a fraction of optimally called peaks in a subset of experiments
may be false-positives, a feature not apparent from the plots in (A) and (B). (D) The number of conservatively called peaks per TF varies by two orders of magnitude. For
each TF, a boxplot shows the range in the number of peaks across different cell types and experimental conditions. Analysis of such characteristics would require highly
reliable peak-calling. Abbreviations: ChIP-seq, chromatin immunoprecipitation followed by high-throughput DNA sequencing; ENCODE, Encyclopedia of DNA Elements;
HS, hypersensitivity; SPP, sequence processing pipeline; TF, transcription factor.
Review Trends in Genetics xxx xxxx, Vol. xxx, No. x
TIGS-1108; No. of Pages 10
simplifies representations of GRNs. By contrast, many fea-tures specific to GRNs need to be captured and documentedin GRN models [46]. Examples include chromatin stateregulation, the spatial organization of TF binding sites onDNA, interactions among regulatory factors and amongregulatory regions, alternative transcription start-sites, al-ternative splicing, and the regulatory logic that determineswhether a gene is expressed given a set of factors bound atspecific sites.
BioTapestry ([47], http://www.biotapestry.org/, seeFigure 1A for an example BioTapestry model) is a plat-form-independent menu-driven drawing, visualization,and documentation tool designed specifically for GRNmodeling. It offers a range of resources that directly ad-dress many of the above needs.
The past few years have seen a maturing of softwaresuites that aim to provide a comprehensive analysis toolset.Prominent examples of such efforts are Bioconductor (http://bioconductor.org), Cytoscape (http://cytoscape.org/), Galaxy(http://galaxyproject.org/, [48]), GenePattern (http://www.broadinstitute.org/cancer/software/genepattern), andGenomeSpace (http://www.genomespace.org/).
Each of these resource hubs has its own distinctivestyle and focus. For example, Bioconductor 2.13 provides749 open-source packages written in the R language.Bioconductor resources are primarily focused on datainterpretation and aimed at bioinformaticians withscript-writing skills (see http://www.rstudio.com/shiny/for a very promising web-based menu-driven interfaceto R scripts).
7

Review Trends in Genetics xxx xxxx, Vol. xxx, No. x
TIGS-1108; No. of Pages 10
In contrast to Bioconductor, Cytoscape provides a menu-driven user interface through the platform-independentJava language, and is primarily focused on integrativemodeling and analysis of interaction networks. Like theBioconductor project, which accepts and curates third-party R packages, Cytoscape enables third-party research-ers to contribute to its resources through ‘Apps’ (Javaplugins that perform specific functions within Cytoscape).
A notable feature of Galaxy is that it combines a web-based, menu-driven user interface with the ability for usersand providers to save and share work-flows. These fea-tures, combined with Galaxy’s ability to integrate third-party tools (including R/Bioconductor packages) empowerbench biologists to run complex data-processing pipelineswithout the need for script writing. GenePattern has ca-pabilities and resources very similar to Galaxy. It currentlyhas a larger toolset, additional data visualization capabili-ties, and a more visually-rich user interface.
GenomeSpace integrates other resource integrators,including Cytoscape, Galaxy, Genepattern, and Genomica(see below). Notably, users of GenomeSpace can easilytransfer/re-use data and analysis results among thesesoftware suites.
Finally, as noted earlier, large-scale measurements ofmRNA and protein production and decay rates are becom-ing feasible, allowing quantitative modeling of transcrip-tional dynamics (reviewed in [49]). A large number of toolsare available for simulation modeling and analysis ofdynamical system properties – such as intrinsic noisiness,controllability (e.g., for cellular re-programming), and ro-bustness to environmental and genetic perturbations (seehttp://sbml.org for a list of over 250 such tools).
Opportunities and challenges aheadThe tools reviewed above all require the user either toinstall the software locally or to upload data to a remoteserver. Raw and aligned read data from high-throughputsequencing experiments are typically gigabytes in size,making data transfer to and from remote servers cumber-some. At the same time, multiple central processing units(CPUs) and large amounts of memory are necessary fordata analysis. Installation, configuration, and mainte-nance of software on such platforms often require sys-tem-administration skills not available in mostindividual research laboratories.
At present, initial data processing (e.g., read alignment,ChIP-seq peak calling, RNA-seq differential gene expres-sion analysis) is often performed by the facility generatingthe data, and researchers often focus on downstream anal-ysis of the summary tables generated by the facility.Although this approach may be adequate for routineexperiments, many – perhaps most – discovery-researchexperiments are better served by iterative reprocessing ofthe raw data based on initial findings. For example, ifpeaks from two different ChIP-seq experiments are foundto overlap to a surprising degree, one may wish to searchthe neighborhoods of apparently non-overlapping peaks tosee if they were in fact flanked by peaks that were belowthe calling threshold in the first round of analysis.
These considerations increasingly point to a need tocolocate high-throughput data with the computational
8
tools to analyze the data [50]. In support of this trend,web-based cloud-computing bioinformatics platforms suchas GenePattern, GenomeSpace, and Galaxy in the publicdomain, as well as DNAnexus (https://www.dnanexus.com/)in the commercial domain, already provide the necessaryinfrastructure.
Low-cost high-throughput technologies and cloud-basedintegrative databases and tools are making GRN modelingand analyses more accessible to bench biologists. Theenormous and growing range of methods provided by theBioconductor project can now be tapped through Cytos-cape, Galaxy, and GenePattern, bringing intuitive, menu-driven workflows and sophisticated computationalresources to bench biologists. This is an inevitable andvery welcome trend, but it also brings challenges andpitfalls.
With only a few mouse clicks, a user can now performhighly complex statistical, mathematical, and algorith-mic operations and create sophisticated data visualiza-tions. But users who fail to understand the theoreticalprinciples underlying a point-and-click computationaltool risk using inappropriate methods, incorrect algorith-mic parameters, and improperly pre-processed inputdata. To illustrate this point, some example scenariosare presented and discussed in Figures 2–4. These con-siderations highlight a pressing need for widely accessi-ble ongoing training in computational biology for benchbiologists at all levels.
Our understanding of how TFs regulate gene expres-sion (reviewed in [51]) remains far from complete. With theexplosion of new data in the past few years there is a needand an opportunity to develop new models of transcrip-tional regulation that better explain the effects of engi-neered as well as disease-causing perturbations. Forexample, an assumption underlying virtually all qualita-tive and quantitative GRN models is that the concentra-tions of regulatory TFs determine the rate of transcription(e.g., [3,52]). Remarkably, recent findings suggest that theduration of TF dwell time on DNA – rather than itsaverage occupancy – can determine target gene expression[53]. Similar arguments can be made regarding recentdiscoveries of widespread polymerase pausing [54], theregulation of enhancer–promoter interactions [40,55,56],and so on.
To date, most GRN modeling efforts have focused onTF–TF and TF–gene interactions. The availability of large-scale data and high-throughput technologies is now en-abling far more nuanced hierarchical and modular GRNmodels incorporating cross-regulation of gene expressionwith histone modifications, DNA methylation, miRNAexpression, RNA splicing, and so on. These added dimen-sions will in turn permit GRN models better to predictcellular differentiation, re-programming, aging, and dis-ease.
More nuanced models will necessitate a shift away fromsharply defined GRN modules and pathways (which areprimarily aids to human comprehension) towards hierar-chical networks composed of recurring ‘functional buildingblocks’ [57] each consisting of no more than a handfulof components and performing a distinct regulatoryfunction.

Review Trends in Genetics xxx xxxx, Vol. xxx, No. x
TIGS-1108; No. of Pages 10
Characterizations of protein localization, abundance,post-translational modifications, and in vivo interactiondynamics have so far been challenging. Recent break-throughs (reviewed in [58]) and a better understandingof the many modes of translational regulation (reviewed in[59]) offer the exciting possibility of ‘completing the circle’in GRN models from DNA to RNA to protein and back toDNA.
AcknowledgmentsI thank Bill Longabaugh (Institute for Systems Biology) and PaulShannon (Bioconductor team, FHCRC) for many helpful comments onan early draft of this review.
References1 Soon, W.W. et al. (2013) High-throughput sequencing for biology and
medicine. Mol. Syst. Biol. 9, 6402 Davidson, E.H. (2006) The Regulatory Genome: Gene Regulatory
Networks in Development and Evolution, Academic3 Bolouri, H. (2008) Computational Modeling of Gene Regulatory
Networks: A Primer, Imperial College Press4 Maetschke, S.R. et al. (2013) Supervised, semi-supervised and
unsupervised inference of gene regulatory networks. Brief.Bioinform. http://dx.doi.org/10.1093/bib/bbt034
5 Geistlinger, L. et al. (2011) From sets to graphs: towards a realisticenrichment analysis of transcriptomic systems. Bioinformatics 27,i366–i373
6 Mazloom, A.R. et al. (2011) Recovering protein–protein and domain–domain interactions from aggregation of IP-MS proteomics ofcoregulator complexes. PLoS Comput. Biol. 7, e1002319
7 Baker, M. (2012) Proteomics: the interaction map. Nature 484, 271–2758 Yosef, N. et al. (2013) Dynamic regulatory network controlling TH17
cell differentiation. Nature 496, 461–4689 Calzone, L. et al. (2010) Mathematical modelling of cell-fate decision in
response to death receptor engagement. PLoS Comput. Biol. 6,e1000702
10 Purvis, J.E. et al. (2012) p53 dynamics control cell fate. Science 336,1440–1444
11 Chen, E.Y. et al. (2012) Expression2Kinases: mRNA profiling linked tomultiple upstream regulatory layers. Bioinformatics 28, 105–111
12 Csermely, P. et al. (2013) Structure and dynamics of molecularnetworks: a novel paradigm of drug discovery: a comprehensivereview. Pharmacol. Ther. 138, 333–408
13 Bandyopadhyay, S. et al. (2010) Rewiring of genetic networks inresponse to DNA damage. Science 330, 1385–1389
14 Bolouri, H. and Davidson, E.H. (2002) Modeling transcriptionalregulatory networks. Bioessays 24, 1118–1129
15 Okumura, A.J. et al. (2008) t(8;21)(q22;q22) Fusion proteinspreferentially bind to duplicated AML1/RUNX1 DNA-bindingsequences to differentially regulate gene expression. Blood 112,1392–1401
16 Wang, S. et al. (2013) An enhancer element harboring variantsassociated with systemic lupus erythematosus engages theTNFAIP3 promoter to influence A20 expression. PLoS Genet. 9,e1003750
17 Patwardhan, R.P. et al. (2012) Massively parallel functional dissectionof mammalian enhancers in vivo. Nat. Biotechnol. 30, 265–270
18 Akhtar-Zaidi, B. et al. (2012) Epigenomic enhancer profiling defines asignature of colon cancer. Science 336, 736–739
19 Khurana, E. et al. (2013) Interpretation of genomic variants using aunified biological network approach. PLoS Comput. Biol. 9, e1002886
20 Moreau, Y. and Tranchevent, L.C. (2012) Computational tools forprioritizing candidate genes: boosting disease gene discovery. Nat.Rev. Genet. 13, 523–536
21 Gaffney, D.J. (2013) Global properties and functional complexity ofhuman gene regulatory variation. PLoS Genet. 9, e1003501
22 Huang, J. et al. (2011) eResponseNet: a package prioritizing candidatedisease genes through cellular pathways. Bioinformatics 27, 2319–2320
23 Erten, S. et al. (2011) DADA: Degree-aware algorithms for network-based disease gene prioritization. BioData Min. 4, 19
24 Margolin, A.A. et al. (2006) ARACNE: an algorithm for thereconstruction of gene regulatory networks in a mammalian cellularcontext. BMC Bioinformatics 7 (Suppl. 1), S7
25 Lefebvre, C. et al. (2010) A human B-cell interactome identifies MYBand FOXM1 as master regulators of proliferation in germinal centers.Mol. Syst. Biol. 6, 377
26 Furey, T.S. (2012) ChIP-seq and beyond: new and improvedmethodologies to detect and characterize protein–DNA interactions.Nat. Rev. Genet. 13, 840–852
27 Vaquerizas, J.M. et al. (2009) A census of human transcription factors:function, expression and evolution. Nat. Rev. Genet. 10, 252–263
28 Fulton, D.L. et al. (2009) TFCat: the curated catalog of mouse andhuman transcription factors. Genome Biol. 10, R29
29 Song, L. et al. (2011) Open chromatin defined by DNase I and FAIREidentifies regulatory elements that shape cell-type identity. GenomeRes. 21, 1757–1767
30 Neph, S. et al. (2012) An expansive human regulatory lexicon encodedin transcription factor footprints. Nature 489, 83–90
31 Neph, S. et al. (2012) Circuitry and dynamics of human transcriptionfactor regulatory networks. Cell 150, 1274–1286
32 Kheradpour, P. and Kellis, M. (2013) Systematic discovery andcharacterization of regulatory motifs in ENCODE TF bindingexperiments. Nucleic Acids Res. http://dx.doi.org/10.1093/nar/gkt1249
33 Yan, J. et al. (2013) Transcription factor binding in human cells occursin dense clusters formed around cohesin anchor sites. Cell 154, 801–813
34 Chen, X. et al. (2008) Integration of external signaling pathways withthe core transcriptional network in embryonic stem cells. Cell 133,1106–1117
35 Bolouri, H. and Ruzzo, W.L. (2012) Integration of 198 ChIP-seqdatasets reveals human cis-regulatory regions. J. Comput. Biol. 19,989–997
36 Rivera, C.M. and Ren, B. (2013) Mapping human epigenomes. Cell 155,39–55
37 Hoffman, M.M. et al. (2013) Integrative annotation of chromatinelements from ENCODE data. Nucleic Acids Res. 41, 827–841
38 Zhao, K. et al. (2013) GLiMMPS: robust statistical model for regulatoryvariation of alternative splicing using RNA-seq data. Genome Biol. 14,R74
39 Huang, S.S. et al. (2013) Linking proteomic and transcriptional datathrough the interactome and epigenome reveals a map of oncogene-induced signaling. PLoS Comput. Biol. 9, e1002887
40 Merkenschlager, M. and Odom, D.T. (2013) CTCF and cohesin: linkinggene regulatory elements with their targets. Cell 152, 1285–1297
41 Smallwood, A. and Ren, B. (2013) Genome organization and long-rangeregulation of gene expression by enhancers. Curr. Opin. Cell Biol. 25,387–394
42 Rabani, M. et al. (2011) Metabolic labeling of RNA uncovers principlesof RNA production and degradation dynamics in mammalian cells.Nat. Biotechnol. 29, 436–442
43 Brar, G.A. et al. (2012) High-resolution view of the yeast meioticprogram revealed by ribosome profiling. Science 335, 552–557
44 Ingolia, N.T. et al. (2012) The ribosome profiling strategy formonitoring translation in vivo by deep sequencing of ribosome-protected mRNA fragments. Nat. Protoc. 7, 1534–1550
45 Bebek, G. et al. (2012) Network biology methods integrating biologicaldata for translational science. Brief. Bioinform. 13, 446–459
46 Longabaugh, W.J. et al. (2009) Visualization, documentation, analysis,and communication of large-scale gene regulatory networks. Biochim.Biophys. Acta 1789, 363–374
47 Longabaugh, W.J. (2012) BioTapestry: a tool to visualize the dynamicproperties of gene regulatory networks. Methods Mol. Biol. 786, 359–394
48 Goecks, J. et al. (2010) Galaxy: a comprehensive approach forsupporting accessible, reproducible, and transparent computationalresearch in the life sciences. Genome Biol. 11, R86
49 Coulon, A. et al. (2013) Eukaryotic transcriptional dynamics: fromsingle molecules to cell populations. Nat. Rev. Genet. 14, 572–584
50 Stein, L.D. (2010) The case for cloud computing in genome informatics.Genome Biol. 11, 207
51 Spitz, F. and Furlong, E.E. (2012) Transcription factors: from enhancerbinding to developmental control. Nat. Rev. Genet. 13, 613–626
9

Review Trends in Genetics xxx xxxx, Vol. xxx, No. x
TIGS-1108; No. of Pages 10
52 Bolouri, H. and Davidson, E.H. (2003) Transcriptional regulatorycascades in development: initial rates, not steady state, determinenetwork kinetics. Proc. Natl. Acad. Sci. U.S.A. 100, 9371–9376
53 Lickwar, C.R. et al. (2012) Genome-wide protein–DNA bindingdynamics suggest a molecular clutch for transcription factorfunction. Nature 484, 251–255
54 Adelman, K. and Lis, J.T. (2012) Promoter-proximal pausing of RNApolymerase II: emerging roles in metazoans. Nat. Rev. Genet. 13, 720–731
55 Li, W. et al. (2013) Functional roles of enhancer RNAs for oestrogen-dependent transcriptional activation. Nature 498, 516–520
10
56 Chu, C. et al. (2011) Genomic maps of long noncoding RNA occupancyreveal principles of RNA-chromatin interactions. Mol. Cell 44, 667–678
57 Longabaugh, W. and Bolouri, H. (2006) Understanding the dynamicbehavior of genetic regulatory networks by functional decomposition.Curr. Genomics 7, 333–341
58 Altelaar, A.F. et al. (2013) Next-generation proteomics: towards anintegrative view of proteome dynamics. Nat. Rev. Genet. 14, 35–48
59 Kong, J. and Lasko, P. (2012) Translational control in cellular anddevelopmental processes. Nat. Rev. Genet. 13, 383–394