modeling crop water productivity using a coupled swat
TRANSCRIPT
water
Article
Modeling Crop Water Productivity Using a CoupledSWAT–MODSIM Model
Saeid Ashraf Vaghefi 1,*, Karim C. Abbaspour 1, Monireh Faramarzi 2, Raghavan Srinivasan 3 andJeffrey G. Arnold 4
1 Eawag, Swiss Federal Institute of Aquatic Science and Technology, 8600 Dübendorf, Switzerland;[email protected]
2 Department of Earth and Atmospheric Sciences, Faculty of Science, University of Alberta, Edmonton,AB T6G 2E3, Canada; [email protected]
3 Department of Ecosystem Science and Management, Texas A & M University, College Station, TX 77843,USA; [email protected]
4 Grassland, Soil and Water Research Laboratory, USDA Agricultural Research Service, Temple, TX 76502,USA; [email protected]
* Correspondence: [email protected] or [email protected]; Tel.: +41-58-765-5359
Academic Editor: Athanasios LoukasReceived: 30 December 2016; Accepted: 17 February 2017; Published: 24 February 2017
Abstract: This study examines the water productivity of irrigated wheat and maize yields inKarkheh River Basin (KRB) in the semi-arid region of Iran using a coupled modeling approachconsisting of the hydrological model (SWAT) and the river basin water allocation model (MODSIM).Dynamic irrigation requirements instead of constant time series of demand were considered. As thecereal production of KRB plays a major role in supplying the food market of Iran, it is necessaryto understand the crop yield-water relations for irrigated wheat and maize in the lower part ofKRB (LKRB) where most of the irrigated agricultural plains are located. Irrigated wheat and maizeyields (Y) and consumptive water use (AET) were modeled with uncertainty analysis at a subbasinlevel for 1990–2010. Simulated Y and AET were used to calculate crop water productivity (CWP).The coupled SWAT–MODSIM approach improved the accuracy of SWAT outputs by consideringthe water allocation derived from MODSIM. The results indicated that the highest CWP across thisregion was 1.31 kg·m−3 and 1.13 kg·m−3 for wheat and maize, respectively; and the lowest wasless than 0.62 kg·m−3 and 0.58 kg·m−3. A close linear relationship was found for CWP and yield.The results showed a continuing increase for AET over the years while CWP peaks and then declines.This is evidence of the existence of a plateau in CWP as AET continues to increase and evidence ofthe fact that higher AET does not necessarily result in a higher yield.
Keywords: Karkheh River Basin; dynamic irrigation scheduling; irrigated wheat; irrigated maize;uncertainty analysis; coupled SWAT-MODSIM
1. Introduction
Global human population growth requires increased food production, yet less water resources areavailable for agriculture. This critical situation can only be resolved if water is managed more efficiently,and crop yield per unit of water consumption increases [1]. Water shortage affects every continent inthe twenty-first century. Around 1.2 billion people, or almost one-fifth of the world’s population, livein areas of physical scarcity, and 500 million people are approaching this situation. Another 1.6 billionpeople, or almost one-quarter of the world’s population, probably face economic water shortage (wherecountries lack the necessary infrastructure to take water from rivers and aquifers) [2]. Spatial and
Water 2017, 9, 157; doi:10.3390/w9030157 www.mdpi.com/journal/water
Water 2017, 9, 157 2 of 15
temporal distribution of precipitation, which rarely coincides with demand, is a critical problem in thiscontext [3].
Crop water productivity (CWP) is defined as the ratio of crop yield (Y) to the amount of waterrequired to produce that yield [4]. Increasing CWP is necessary to meet a decreasing water availabilityand is a key element in improving agricultural water productivity, which is central to both economicand social development [5].
Therefore, there is a high intresrt in increasing the productivity of water in the agricultural sectorto meet the future food demand [6]. In arid and semi-arid regions where the agricultural sector isthe main consumer of water resources and less opportunities exist for the development of new waterresources, the accurate estimation of CWP and increasing the productivity of existing water resourcesis vital. Various researchers studied CWP at specific locations, with specific agricultural and watermanagement practices. Zwart and Bastiaanssen [4] reviewed 84 literature sources. They found thatglobally measured average CWP values per unit water use are 1.09, 1.09, 0.65, 0.23 and 1.80 kg·m−3
for wheat, rice, cotton seed, cotton lint, and maize, respectively. They found that the range of CWP is0.6–1.7 kg·m−3 for wheat, 0.6–1.6 kg·m−3 for rice, 0.41–0.95 kg·m−3 for cotton seed, 0.14–0.33 kg·m−3
for cotton lint, and 1.1–2.7 kg·m−3 for maize. Nhamo, et al. [7] evaluated crop evapotranspiration, cropproduction and agricultural gross domestic product contribution to assess the crop water productivityof Malawi from 2000 to 2013. They found an overall increase of 33% crop water productivity.Giménez, et al. [8] used different full and deficit irrigation practices to calibrate and validate soil waterbalance in western Uruguay using the soil water balance simulation model SIMDualKc. They foundwater productivity values, ranging from 1.39 to 2.17 kg·m−3 and 1.75 to 2.55 kg·m−3 when consideringtotal water use and crop AET, respectively. Borrego-Marín, et al. [9] analyzed the impact of drought (2005,2012) and drought management plans (2006–2008) on agricultural water productivity in GuadalquivirRiver Basin in Spain for the period of 2004 to 2012. They found significantly higher water productivityin irrigated than rain-fed agriculture. There is also much interest in the different methods to improvethe CWP. Kima, et al. [10] analyzed the effective depth of irrigation water that can keep the soil moistureclose to saturation for irrigation intervals to increase water productivity.
In general, the models on crop-water relations can be divided into two categories: empiricaland process-based models [11]. Most of the empirical models are regression-based models,where a correlation is established between the statistical crop yield and local weather-related,geostatistical-related, and management-related (e.g., irrigation) factors. Therefore, they can onlyestimate yield, without predicting crop water uptake and soil evaporation. The process-based modelssimulate the physiological development, growth and yield of a crop based on the interaction ofenvironmental variables and plant physiological processes (e.g., photosynthesis and respiration) [11,12].They often have a weakness either in crop growth simulation or hydrology. Examples of process-basedmodels include Soil Water Atmosphere Plant (SWAP) [13], Soil Vegetation Atmosphere Transfer(SVAT) [12], GIS-based Environmental Policy Integrated Climate model GEPIC [14], generic crop model(InfoCrop) [15,16], FAO’s crop water productivity and yield response model (AquaCrop) [17–19], andthe global water assessment model (WaterGAP) [20]. There are two fundamental limitations in many ofthe studies which have used these models: (i) The crop yield and consumptive water use estimated fora given area are not linked with the water resources availability of that region. Therefore, one cannotassess the aggregate impact of regional water resources availability, land use, and climate changes oncrop production directly. (ii) Uncertainties associated with crop models are not taken into accountand remained largely unquantified. There are some studies [21–24] that account for model-relateduncertainties in crop yield prediction. To the best of our knowledge, the aforementioned issues have notbeen considered together in one package. Soil and Water Assessment Tool (SWAT) [25] has been usedwidely to assess the impact of management practice, and climate and land use changes on water qualityand quantity and crop yield [26,27]. Using SWAT calibration, and uncertainty tool “SWAT-CUP”, [28]many studies have considered the uncertainties of SWAT output variables such as discharge, and cropyield [29–31]. Although SWAT has significant capabilities in the simulation of hydrologic components
Water 2017, 9, 157 3 of 15
and crop yield interactively, the lack of an optimal water allocation module inhibits the dynamicpattern of irrigation scheduling and increases uncertainty in Y and AET predictions.
Water allocation models can be used to optimize water allocation among different users.Some examples of water allocation models are integrated water allocation model (IWAM) [32],REsource ALlocation Model (REALM) [33], Water Evaluation and Planning (WEAP) [34], and riverbasin network flow model for conjunctive stream-aquifer management (MODSIM) [35]. MODSIM hasbeen used in several studies to address the problem of water allocation between non-consumptive andconsumptive water demands at the basin scale [36–38].
This paper aims to study the water productivity of irrigated wheat and maize in agriculturallands of the Lower KRB (LKRB) by using a coupled SWAT–MODSIM model considering dynamicirrigation requirements. To the best of our knowledge, previous studies have not considered dynamictime series of irrigation demands in the estimation of CWP through the aforementioned modelingapproach. SWAT is used to estimate spatial and temporal distributions of water availability andirrigation water requirements, while MODSIM [35,39] simulates the processes of reservoir operationsfor water allocations. The use of the coupled hydrological-water allocation model substantiallyimproves accuracy of Y and AET simulations and results in the implementation of more rational andsustainable water management practices.
Karkheh River Basin (KRB) has traditionally been the central point of agricultural activities inIran. The basin, located in the arid southwest of Iran, is one of the most productive agriculturalareas of the country. It is known as the food basket of Iran [40] and produces about 10% of thecountry’s wheat. Available water resources and desirable climatic conditions make it a suitablebasin for growing a broad range of crops. In the KRB, water availability is of great importance insupporting economic and social development [41]. Due to limited potential for developing new waterresources and a significant decrease in downstream runoff due to both climate change and humaninterventions, improving the productivity of the existing water resources in the basin is one of themost important management challenges to sustainable food production [42]. Rafiee and Shourian [43]used a simulation-optimization approach to find the optimal irrigation plan and crop pattern in theAzadegan plain in the KRB. In the basin, excessive irrigation is a key management practice that leadsto remarkable water losses [44]. Therefore, several studies have concentrated on the issue of foodproduction in KRB [40,45]. It is also projected that the problem of water will further increase due toclimate change in southern parts of the basin [42].
The coupled SWAT–MODSIM approach in this study has some novel features: (i) it considersdynamic irrigation requirements instead of constant time series of demands; (ii) it is a fully coupledmodel and both models have feedback on each other; (iii) it is supported by a full tutorial whichfacilitates the application of the coupled model in other similar research studies.
This paper is organized to (i) calibrate (1997–2010) and validate (1990–1996) crop yield at fiveimportant agricultural regions in LKRB; (ii) model the spatial and temporal variability of crop yieldas well as crop consumptive water use with uncertainty analysis for wheat and maize at a subbasinlevel, and calculate CWP; and (iii) analyze the relation between yields and consumptive water useby quantifying the applied irrigation water and crop yield in each of the five regions by using thecoupled model.
2. Methodology
2.1. Study Area
Karkheh River Basin, with a total area of about 51,000 km2, is located in the south-western partof Iran between 30◦ N to 35◦ N and 46◦ E to 49◦ E. KRB is the third largest agricultural river basin inIran [41] with a significant hydropower generation capacity. The southern part of the basin receivesan average annual precipitation of about 250 mm·year−1, whereas the northern part receives up to700 mm·year−1 [46]. During the period 2006–2010, the average annual precipitation of the southern
Water 2017, 9, 157 4 of 15
part decreased to 150 mm·year−1 [47]. Precipitation in many regions is insufficient to meet crop waterrequirements, therefore irrigation is very important in LKRB [42,48–50]. The LKRB has been selectedfor water productivity analysis in our study. The Karkheh Reservoir, in the most downstream part ofthe basin, is the largest reservoir in the basin, and is operated for irrigation and hydropower. Table 1presents the characteristics of Karkheh Dam operation, which are considered in our model. LKRB hastwo major agricultural production systems. The rainfed system, which is dominant in Dashte Abbasand Dolsagh, and the fully irrigated areas, which are scattered in all five regions [44]. The averageannual rainfall (2005–2010) in LKRB has recently been as low as 150 mm·year−1 [51]. Over the pastthree decades, large rainfed areas have turned into irrigated areas mainly because of increasing accessto water (mainly groundwater). However, irrigation efficiencies in KRB are still low as 35%–50% [48,51].The productivity of water is very low, i.e., 0.5 kg·m−3 for most of the field crops [41,46]. The totalirrigated area in LKRB is 360,000 ha with a planned expansion to 500,000 ha [44]. Major crops such aswheat and maize are grown over 55% of the area [44,48].
Table 1. Characteristics of Karkheh dam in Karkheh River Basin.
Dam Name StatusNormal Level
(Meter above Sea Level)m.a.s.l
Storage(Miliion Cubic Meter)
MCMPurpose
Karkheh Operational 220 4616 Irrigation and hydropower
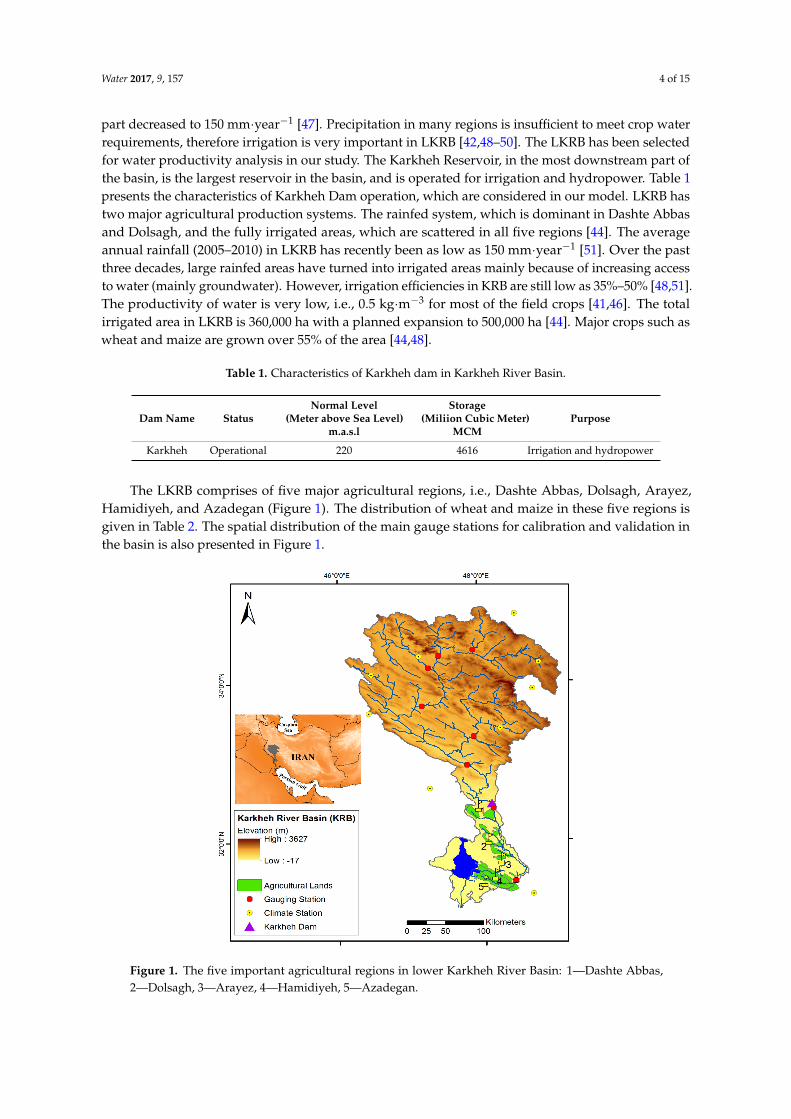
The LKRB comprises of five major agricultural regions, i.e., Dashte Abbas, Dolsagh, Arayez,Hamidiyeh, and Azadegan (Figure 1). The distribution of wheat and maize in these five regions isgiven in Table 2. The spatial distribution of the main gauge stations for calibration and validation inthe basin is also presented in Figure 1.
Water 2017, 9, 157 4 of 15
presents the characteristics of Karkheh Dam operation, which are considered in our model. LKRB has two major agricultural production systems. The rainfed system, which is dominant in Dashte Abbas and Dolsagh, and the fully irrigated areas, which are scattered in all five regions [44]. The average annual rainfall (2005–2010) in LKRB has recently been as low as 150 mm·year−1 [51]. Over the past three decades, large rainfed areas have turned into irrigated areas mainly because of increasing access to water (mainly groundwater). However, irrigation efficiencies in KRB are still low as 35%–50% [48,51]. The productivity of water is very low, i.e., 0.5 kg·m−3 for most of the field crops [41,46]. The total irrigated area in LKRB is 360,000 ha with a planned expansion to 500,000 ha [44]. Major crops such as wheat and maize are grown over 55% of the area [44,48].
Table 1. Characteristics of Karkheh dam in Karkheh River Basin.
Dam Name Status Normal Level
(Meter above Sea Level) m.a.s.l
Storage(Miliion Cubic Meter)
MCM Purpose
Karkheh Operational 220 4616 Irrigation and hydropower
The LKRB comprises of five major agricultural regions, i.e., Dashte Abbas, Dolsagh, Arayez, Hamidiyeh, and Azadegan (Figure 1). The distribution of wheat and maize in these five regions is given in Table 2. The spatial distribution of the main gauge stations for calibration and validation in the basin is also presented in Figure 1.
Figure 1. The five important agricultural regions in lower Karkheh River Basin: 1—Dashte Abbas, 2—Dolsagh, 3—Arayez, 4—Hamidiyeh, 5—Azadegan.
Figure 1. The five important agricultural regions in lower Karkheh River Basin: 1—Dashte Abbas,2—Dolsagh, 3—Arayez, 4—Hamidiyeh, 5—Azadegan.
Water 2017, 9, 157 5 of 15
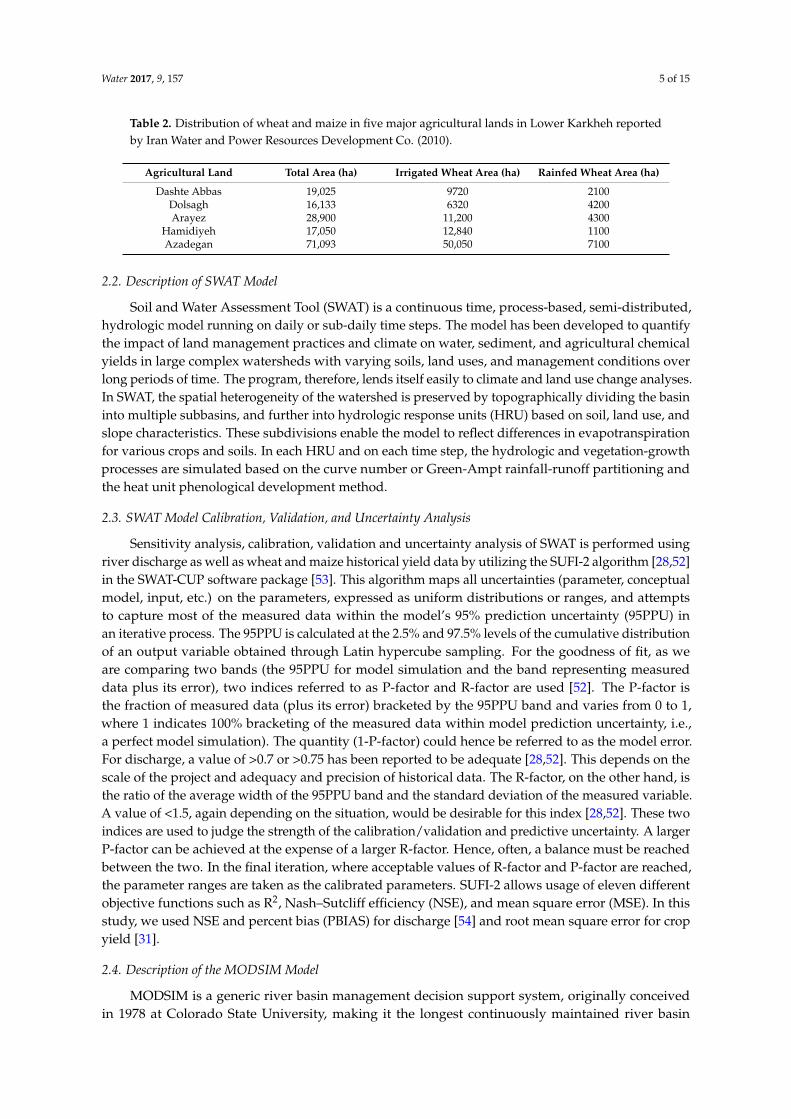
Table 2. Distribution of wheat and maize in five major agricultural lands in Lower Karkheh reportedby Iran Water and Power Resources Development Co. (2010).
Agricultural Land Total Area (ha) Irrigated Wheat Area (ha) Rainfed Wheat Area (ha)
Dashte Abbas 19,025 9720 2100Dolsagh 16,133 6320 4200Arayez 28,900 11,200 4300
Hamidiyeh 17,050 12,840 1100Azadegan 71,093 50,050 7100
2.2. Description of SWAT Model
Soil and Water Assessment Tool (SWAT) is a continuous time, process-based, semi-distributed,hydrologic model running on daily or sub-daily time steps. The model has been developed to quantifythe impact of land management practices and climate on water, sediment, and agricultural chemicalyields in large complex watersheds with varying soils, land uses, and management conditions overlong periods of time. The program, therefore, lends itself easily to climate and land use change analyses.In SWAT, the spatial heterogeneity of the watershed is preserved by topographically dividing the basininto multiple subbasins, and further into hydrologic response units (HRU) based on soil, land use, andslope characteristics. These subdivisions enable the model to reflect differences in evapotranspirationfor various crops and soils. In each HRU and on each time step, the hydrologic and vegetation-growthprocesses are simulated based on the curve number or Green-Ampt rainfall-runoff partitioning andthe heat unit phenological development method.
2.3. SWAT Model Calibration, Validation, and Uncertainty Analysis
Sensitivity analysis, calibration, validation and uncertainty analysis of SWAT is performed usingriver discharge as well as wheat and maize historical yield data by utilizing the SUFI-2 algorithm [28,52]in the SWAT-CUP software package [53]. This algorithm maps all uncertainties (parameter, conceptualmodel, input, etc.) on the parameters, expressed as uniform distributions or ranges, and attemptsto capture most of the measured data within the model’s 95% prediction uncertainty (95PPU) inan iterative process. The 95PPU is calculated at the 2.5% and 97.5% levels of the cumulative distributionof an output variable obtained through Latin hypercube sampling. For the goodness of fit, as weare comparing two bands (the 95PPU for model simulation and the band representing measureddata plus its error), two indices referred to as P-factor and R-factor are used [52]. The P-factor isthe fraction of measured data (plus its error) bracketed by the 95PPU band and varies from 0 to 1,where 1 indicates 100% bracketing of the measured data within model prediction uncertainty, i.e.,a perfect model simulation). The quantity (1-P-factor) could hence be referred to as the model error.For discharge, a value of >0.7 or >0.75 has been reported to be adequate [28,52]. This depends on thescale of the project and adequacy and precision of historical data. The R-factor, on the other hand, isthe ratio of the average width of the 95PPU band and the standard deviation of the measured variable.A value of <1.5, again depending on the situation, would be desirable for this index [28,52]. These twoindices are used to judge the strength of the calibration/validation and predictive uncertainty. A largerP-factor can be achieved at the expense of a larger R-factor. Hence, often, a balance must be reachedbetween the two. In the final iteration, where acceptable values of R-factor and P-factor are reached,the parameter ranges are taken as the calibrated parameters. SUFI-2 allows usage of eleven differentobjective functions such as R2, Nash–Sutcliff efficiency (NSE), and mean square error (MSE). In thisstudy, we used NSE and percent bias (PBIAS) for discharge [54] and root mean square error for cropyield [31].
2.4. Description of the MODSIM Model
MODSIM is a generic river basin management decision support system, originally conceivedin 1978 at Colorado State University, making it the longest continuously maintained river basin
Water 2017, 9, 157 6 of 15
management software package currently available [55]. MODSIM represents a river basin as a networkof links and nodes. Unregulated inflows, evaporation and channel losses, reservoir storage rights andexchanges, stream–aquifer modeling components, reservoir operating targets, and consumptive andinstream flow demands are considered in MODSIM [56]. More details can be found in Labadie [55].
2.5. Model Setup and Data Collection
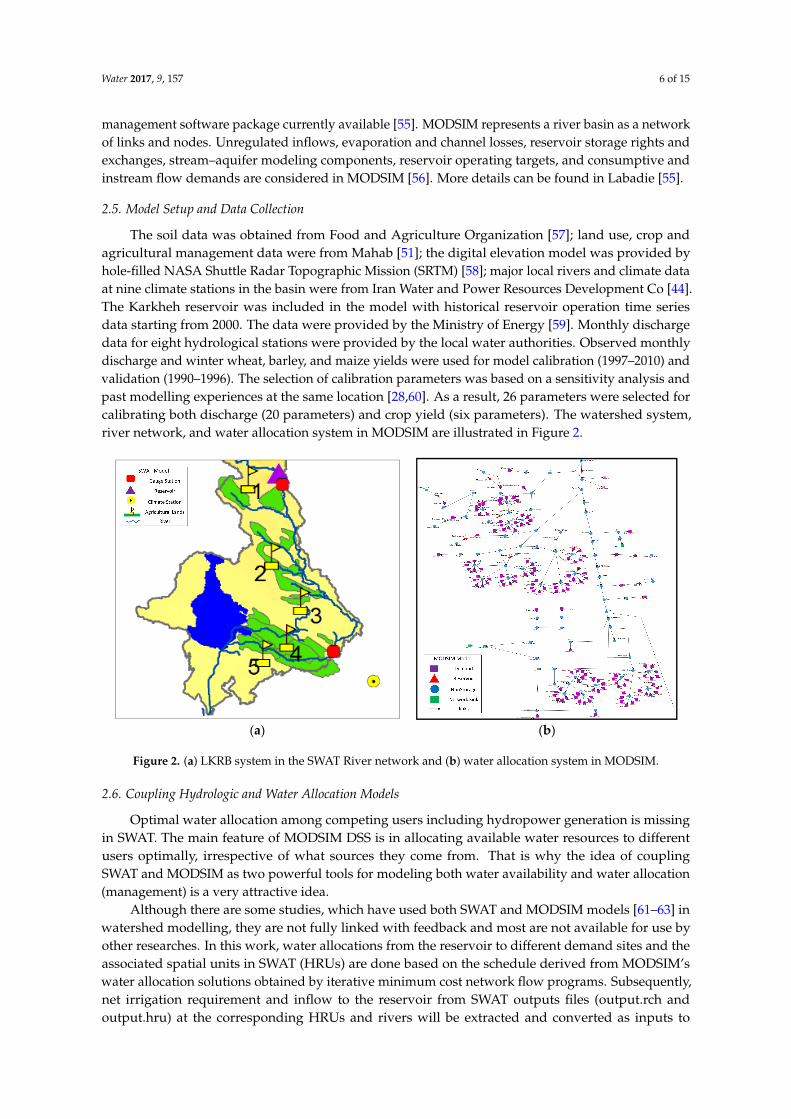
The soil data was obtained from Food and Agriculture Organization [57]; land use, crop andagricultural management data were from Mahab [51]; the digital elevation model was provided byhole-filled NASA Shuttle Radar Topographic Mission (SRTM) [58]; major local rivers and climate dataat nine climate stations in the basin were from Iran Water and Power Resources Development Co [44].The Karkheh reservoir was included in the model with historical reservoir operation time seriesdata starting from 2000. The data were provided by the Ministry of Energy [59]. Monthly dischargedata for eight hydrological stations were provided by the local water authorities. Observed monthlydischarge and winter wheat, barley, and maize yields were used for model calibration (1997–2010) andvalidation (1990–1996). The selection of calibration parameters was based on a sensitivity analysis andpast modelling experiences at the same location [28,60]. As a result, 26 parameters were selected forcalibrating both discharge (20 parameters) and crop yield (six parameters). The watershed system,river network, and water allocation system in MODSIM are illustrated in Figure 2.
Water 2017, 9, 157 6 of 15
network of links and nodes. Unregulated inflows, evaporation and channel losses, reservoir storage rights and exchanges, stream–aquifer modeling components, reservoir operating targets, and consumptive and instream flow demands are considered in MODSIM [56]. More details can be found in Labadie [55].
2.5. Model Setup and Data Collection
The soil data was obtained from Food and Agriculture Organization [57]; land use, crop and agricultural management data were from Mahab [51]; the digital elevation model was provided by hole-filled NASA Shuttle Radar Topographic Mission (SRTM) [58]; major local rivers and climate data at nine climate stations in the basin were from Iran Water and Power Resources Development Co [44]. The Karkheh reservoir was included in the model with historical reservoir operation time series data starting from 2000. The data were provided by the Ministry of Energy [59]. Monthly discharge data for eight hydrological stations were provided by the local water authorities. Observed monthly discharge and winter wheat, barley, and maize yields were used for model calibration (1997–2010) and validation (1990–1996). The selection of calibration parameters was based on a sensitivity analysis and past modelling experiences at the same location [28,60]. As a result, 26 parameters were selected for calibrating both discharge (20 parameters) and crop yield (six parameters). The watershed system, river network, and water allocation system in MODSIM are illustrated in Figure 2.
(a) (b)
Figure 2. (a) LKRB system in the SWAT River network and (b) water allocation system in MODSIM.
2.6. Coupling Hydrologic and Water Allocation Models
Optimal water allocation among competing users including hydropower generation is missing in SWAT. The main feature of MODSIM DSS is in allocating available water resources to different users optimally, irrespective of what sources they come from. That is why the idea of coupling SWAT and MODSIM as two powerful tools for modeling both water availability and water allocation (management) is a very attractive idea.
Although there are some studies, which have used both SWAT and MODSIM models [61–63] in watershed modelling, they are not fully linked with feedback and most are not available for use by other researches. In this work, water allocations from the reservoir to different demand sites and the associated spatial units in SWAT (HRUs) are done based on the schedule derived from MODSIM’s water allocation solutions obtained by iterative minimum cost network flow programs. Subsequently, net irrigation requirement and inflow to the reservoir from SWAT outputs files (output.rch and output.hru) at the corresponding HRUs and rivers will be extracted and converted as inputs to MODSIM. Once the amount of water allocated to each demand node (equivalent to HRUs in SWAT) is determined by MODSIM, SWAT is run using new updated-by-MODSIM irrigation
Figure 2. (a) LKRB system in the SWAT River network and (b) water allocation system in MODSIM.
2.6. Coupling Hydrologic and Water Allocation Models
Optimal water allocation among competing users including hydropower generation is missingin SWAT. The main feature of MODSIM DSS is in allocating available water resources to differentusers optimally, irrespective of what sources they come from. That is why the idea of couplingSWAT and MODSIM as two powerful tools for modeling both water availability and water allocation(management) is a very attractive idea.
Although there are some studies, which have used both SWAT and MODSIM models [61–63] inwatershed modelling, they are not fully linked with feedback and most are not available for use byother researches. In this work, water allocations from the reservoir to different demand sites and theassociated spatial units in SWAT (HRUs) are done based on the schedule derived from MODSIM’swater allocation solutions obtained by iterative minimum cost network flow programs. Subsequently,net irrigation requirement and inflow to the reservoir from SWAT outputs files (output.rch andoutput.hru) at the corresponding HRUs and rivers will be extracted and converted as inputs to
Water 2017, 9, 157 7 of 15
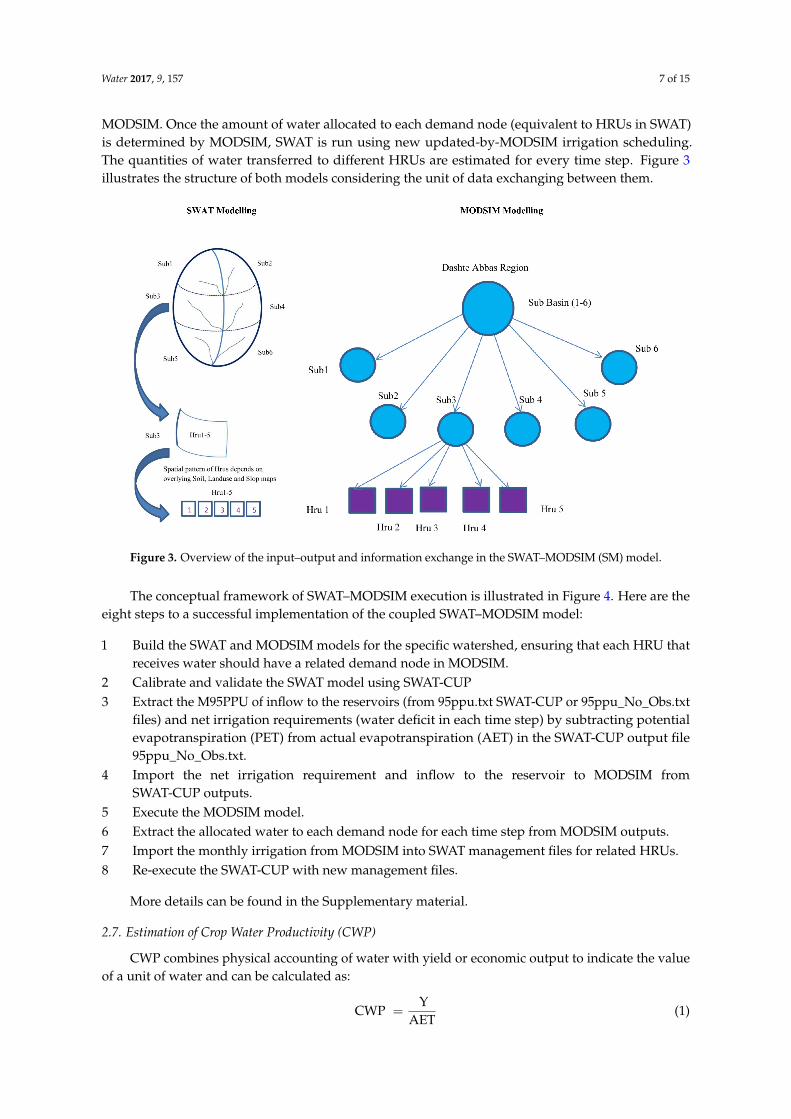
MODSIM. Once the amount of water allocated to each demand node (equivalent to HRUs in SWAT)is determined by MODSIM, SWAT is run using new updated-by-MODSIM irrigation scheduling.The quantities of water transferred to different HRUs are estimated for every time step. Figure 3illustrates the structure of both models considering the unit of data exchanging between them.
Water 2017, 9, 157 7 of 15
scheduling. The quantities of water transferred to different HRUs are estimated for every time step. Figure 3 illustrates the structure of both models considering the unit of data exchanging between them.
Figure 3. Overview of the input–output and information exchange in the SWAT–MODSIM (SM) model.
The conceptual framework of SWAT–MODSIM execution is illustrated in Figure 4. Here are the eight steps to a successful implementation of the coupled SWAT–MODSIM model:
1 Build the SWAT and MODSIM models for the specific watershed, ensuring that each HRU that receives water should have a related demand node in MODSIM.
2 Calibrate and validate the SWAT model using SWAT-CUP 3 Extract the M95PPU of inflow to the reservoirs (from 95ppu.txt SWAT-CUP or
95ppu_No_Obs.txt files) and net irrigation requirements (water deficit in each time step) by subtracting potential evapotranspiration (PET) from actual evapotranspiration (AET) in the SWAT-CUP output file 95ppu_No_Obs.txt.
4 Import the net irrigation requirement and inflow to the reservoir to MODSIM from SWAT-CUP outputs.
5 Execute the MODSIM model. 6 Extract the allocated water to each demand node for each time step from MODSIM outputs. 7 Import the monthly irrigation from MODSIM into SWAT management files for related HRUs. 8 Re-execute the SWAT-CUP with new management files.
More details can be found in the Supplementary material.
2.7. Estimation of Crop Water Productivity (CWP)
CWP combines physical accounting of water with yield or economic output to indicate the value of a unit of water and can be calculated as: CWP = YAET (1)
where CWP is the crop water productivity in kg·m−3, Y is the crop yield in kg·ha−1, and AET is the seasonal actual evapotranspiration in m3·ha−1, assumed here to be the crop’s consumptive water use,
Figure 3. Overview of the input–output and information exchange in the SWAT–MODSIM (SM) model.
The conceptual framework of SWAT–MODSIM execution is illustrated in Figure 4. Here are theeight steps to a successful implementation of the coupled SWAT–MODSIM model:
1 Build the SWAT and MODSIM models for the specific watershed, ensuring that each HRU thatreceives water should have a related demand node in MODSIM.
2 Calibrate and validate the SWAT model using SWAT-CUP3 Extract the M95PPU of inflow to the reservoirs (from 95ppu.txt SWAT-CUP or 95ppu_No_Obs.txt
files) and net irrigation requirements (water deficit in each time step) by subtracting potentialevapotranspiration (PET) from actual evapotranspiration (AET) in the SWAT-CUP output file95ppu_No_Obs.txt.
4 Import the net irrigation requirement and inflow to the reservoir to MODSIM fromSWAT-CUP outputs.
5 Execute the MODSIM model.6 Extract the allocated water to each demand node for each time step from MODSIM outputs.7 Import the monthly irrigation from MODSIM into SWAT management files for related HRUs.8 Re-execute the SWAT-CUP with new management files.
More details can be found in the Supplementary material.
2.7. Estimation of Crop Water Productivity (CWP)
CWP combines physical accounting of water with yield or economic output to indicate the valueof a unit of water and can be calculated as:
CWP =Y
AET(1)
Water 2017, 9, 157 8 of 15
where CWP is the crop water productivity in kg·m−3, Y is the crop yield in kg·ha−1, and AET is theseasonal actual evapotranspiration in m3·ha−1, assumed here to be the crop’s consumptive water use,so the above definition of CWP does not account for the waste of water due to irrigation inefficiencies.Note that Y is the annual yield while AET is calculated on a monthly basis. The spatial resolution of Y,AET, and CWP is at a subbasin level, but for comparison with other studies and the available statistics,the results are aggregated to the level of agricultural lands.
Water 2017, 9, 157 8 of 15
so the above definition of CWP does not account for the waste of water due to irrigation inefficiencies. Note that Y is the annual yield while AET is calculated on a monthly basis. The spatial resolution of Y, AET, and CWP is at a subbasin level, but for comparison with other studies and the available statistics, the results are aggregated to the level of agricultural lands.
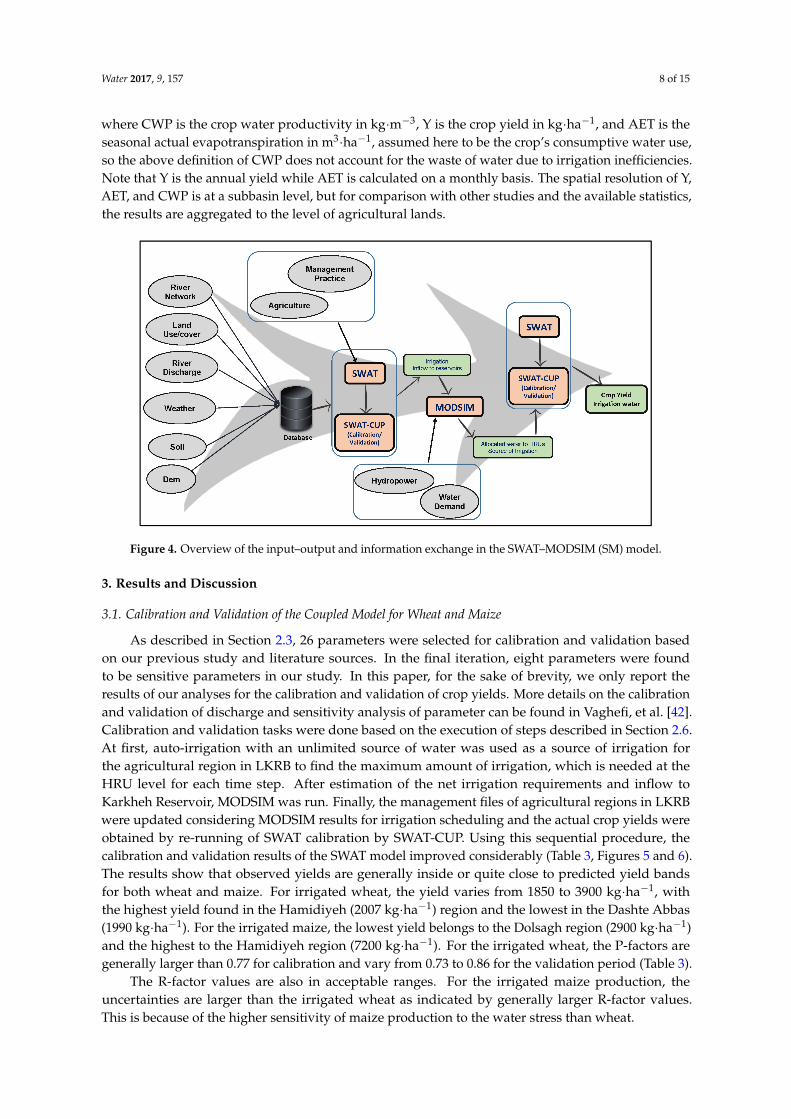
Figure 4. Overview of the input–output and information exchange in the SWAT–MODSIM (SM) model.
3. Results and Discussion
3.1. Calibration and Validation of the Coupled Model for Wheat and Maize
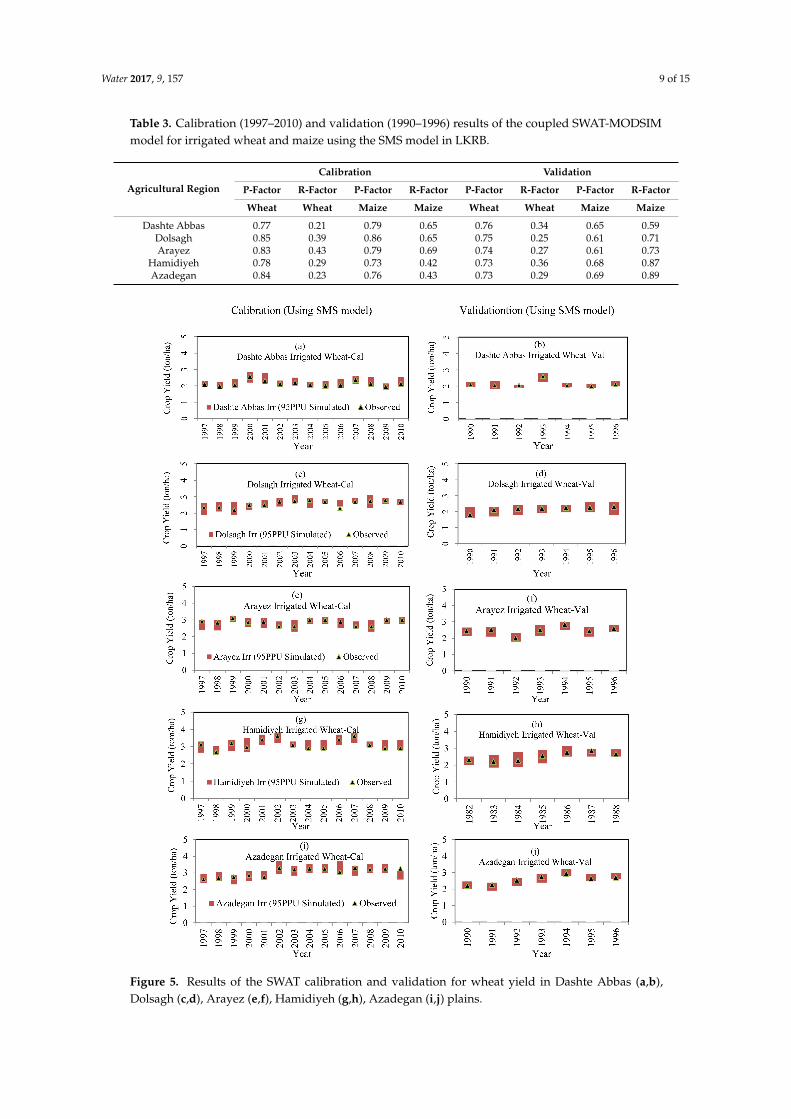
As described in Section 2.3, 26 parameters were selected for calibration and validation based on our previous study and literature sources. In the final iteration, eight parameters were found to be sensitive parameters in our study. In this paper, for the sake of brevity, we only report the results of our analyses for the calibration and validation of crop yields. More details on the calibration and validation of discharge and sensitivity analysis of parameter can be found in Vaghefi, et al. [42]. Calibration and validation tasks were done based on the execution of steps described in Section 2.6. At first, auto-irrigation with an unlimited source of water was used as a source of irrigation for the agricultural region in LKRB to find the maximum amount of irrigation, which is needed at the HRU level for each time step. After estimation of the net irrigation requirements and inflow to Karkheh Reservoir, MODSIM was run. Finally, the management files of agricultural regions in LKRB were updated considering MODSIM results for irrigation scheduling and the actual crop yields were obtained by re-running of SWAT calibration by SWAT-CUP. Using this sequential procedure, the calibration and validation results of the SWAT model improved considerably (Table 3, Figures 5 and 6). The results show that observed yields are generally inside or quite close to predicted yield bands for both wheat and maize. For irrigated wheat, the yield varies from 1850 to 3900 kg·ha−1, with the highest yield found in the Hamidiyeh (2007 kg·ha−1) region and the lowest in the Dashte Abbas (1990 kg·ha−1). For the irrigated maize, the lowest yield belongs to the Dolsagh region (2900 kg·ha−1) and the highest to the Hamidiyeh region (7200 kg·ha−1). For the irrigated wheat, the P-factors are generally larger than 0.77 for calibration and vary from 0.73 to 0.86 for the validation period (Table 3).
The R-factor values are also in acceptable ranges. For the irrigated maize production, the uncertainties are larger than the irrigated wheat as indicated by generally larger R-factor values. This is because of the higher sensitivity of maize production to the water stress than wheat.
Figure 4. Overview of the input–output and information exchange in the SWAT–MODSIM (SM) model.
3. Results and Discussion
3.1. Calibration and Validation of the Coupled Model for Wheat and Maize
As described in Section 2.3, 26 parameters were selected for calibration and validation basedon our previous study and literature sources. In the final iteration, eight parameters were foundto be sensitive parameters in our study. In this paper, for the sake of brevity, we only report theresults of our analyses for the calibration and validation of crop yields. More details on the calibrationand validation of discharge and sensitivity analysis of parameter can be found in Vaghefi, et al. [42].Calibration and validation tasks were done based on the execution of steps described in Section 2.6.At first, auto-irrigation with an unlimited source of water was used as a source of irrigation forthe agricultural region in LKRB to find the maximum amount of irrigation, which is needed at theHRU level for each time step. After estimation of the net irrigation requirements and inflow toKarkheh Reservoir, MODSIM was run. Finally, the management files of agricultural regions in LKRBwere updated considering MODSIM results for irrigation scheduling and the actual crop yields wereobtained by re-running of SWAT calibration by SWAT-CUP. Using this sequential procedure, thecalibration and validation results of the SWAT model improved considerably (Table 3, Figures 5 and 6).The results show that observed yields are generally inside or quite close to predicted yield bandsfor both wheat and maize. For irrigated wheat, the yield varies from 1850 to 3900 kg·ha−1, withthe highest yield found in the Hamidiyeh (2007 kg·ha−1) region and the lowest in the Dashte Abbas(1990 kg·ha−1). For the irrigated maize, the lowest yield belongs to the Dolsagh region (2900 kg·ha−1)and the highest to the Hamidiyeh region (7200 kg·ha−1). For the irrigated wheat, the P-factors aregenerally larger than 0.77 for calibration and vary from 0.73 to 0.86 for the validation period (Table 3).
The R-factor values are also in acceptable ranges. For the irrigated maize production, theuncertainties are larger than the irrigated wheat as indicated by generally larger R-factor values.This is because of the higher sensitivity of maize production to the water stress than wheat.
Water 2017, 9, 157 9 of 15
Table 3. Calibration (1997–2010) and validation (1990–1996) results of the coupled SWAT-MODSIMmodel for irrigated wheat and maize using the SMS model in LKRB.
Agricultural Region
Calibration Validation
P-Factor R-Factor P-Factor R-Factor P-Factor R-Factor P-Factor R-Factor
Wheat Wheat Maize Maize Wheat Wheat Maize Maize
Dashte Abbas 0.77 0.21 0.79 0.65 0.76 0.34 0.65 0.59Dolsagh 0.85 0.39 0.86 0.65 0.75 0.25 0.61 0.71Arayez 0.83 0.43 0.79 0.69 0.74 0.27 0.61 0.73
Hamidiyeh 0.78 0.29 0.73 0.42 0.73 0.36 0.68 0.87Azadegan 0.84 0.23 0.76 0.43 0.73 0.29 0.69 0.89
Water 2017, 9, 157 9 of 15
Table 3. Calibration (1997–2010) and validation (1990–1996) results of the coupled SWAT-MODSIM model for irrigated wheat and maize using the SMS model in LKRB.
Agricultural Region Calibration Validation
P-Factor R-Factor P-Factor R-Factor P-Factor R-Factor P-Factor R-Factor Wheat Wheat Maize Maize Wheat Wheat Maize Maize
Dashte Abbas 0.77 0.21 0.79 0.65 0.76 0.34 0.65 0.59 Dolsagh 0.85 0.39 0.86 0.65 0.75 0.25 0.61 0.71 Arayez 0.83 0.43 0.79 0.69 0.74 0.27 0.61 0.73
Hamidiyeh 0.78 0.29 0.73 0.42 0.73 0.36 0.68 0.87 Azadegan 0.84 0.23 0.76 0.43 0.73 0.29 0.69 0.89
Figure 5. Results of the SWAT calibration and validation for wheat yield in Dashte Abbas (a,b), Dolsagh (c,d), Arayez (e,f), Hamidiyeh (g,h), Azadegan (i,j) plains.
Figure 5. Results of the SWAT calibration and validation for wheat yield in Dashte Abbas (a,b),Dolsagh (c,d), Arayez (e,f), Hamidiyeh (g,h), Azadegan (i,j) plains.

Water 2017, 9, 157 10 of 15Water 2017, 9, 157 10 of 15
Figure 6. Results of the SMS calibration and validation for maize yield in Dashte Abbas (a,b), Dolsagh (c,d), Arayez (e,f), Hamidiyeh (g,h), Azadegan (i,j) plains.
3.2. Water Productivity of Wheat and Maize
The results of the coupled model for both calibration and validation periods and for the entire region indicates that the basin-wide wheat water productivity (WWP) is equal to 0.94 kg·m−3, ranging from 0.55 kg·m−3 to 1.21 kg·m−3. The highest WWP can be ascribed to higher yields under limited water supply conditions. Lower WWP is mainly due to higher water application and relatively lower wheat yields (Figure 7a). The basin-wide maize water productivity (MWP) is equal to 0.8 kg·m−3, ranging from 0.55 kg·m−3 to 1.15 kg·m−3 (Figure 7b).
Figure 6. Results of the SMS calibration and validation for maize yield in Dashte Abbas (a,b),Dolsagh (c,d), Arayez (e,f), Hamidiyeh (g,h), Azadegan (i,j) plains.
3.2. Water Productivity of Wheat and Maize
The results of the coupled model for both calibration and validation periods and for the entireregion indicates that the basin-wide wheat water productivity (WWP) is equal to 0.94 kg·m−3, rangingfrom 0.55 kg·m−3 to 1.21 kg·m−3. The highest WWP can be ascribed to higher yields under limitedwater supply conditions. Lower WWP is mainly due to higher water application and relatively lowerwheat yields (Figure 7a). The basin-wide maize water productivity (MWP) is equal to 0.8 kg·m−3,ranging from 0.55 kg·m−3 to 1.15 kg·m−3 (Figure 7b).
Water 2017, 9, 157 11 of 15Water 2017, 9, 157 11 of 15
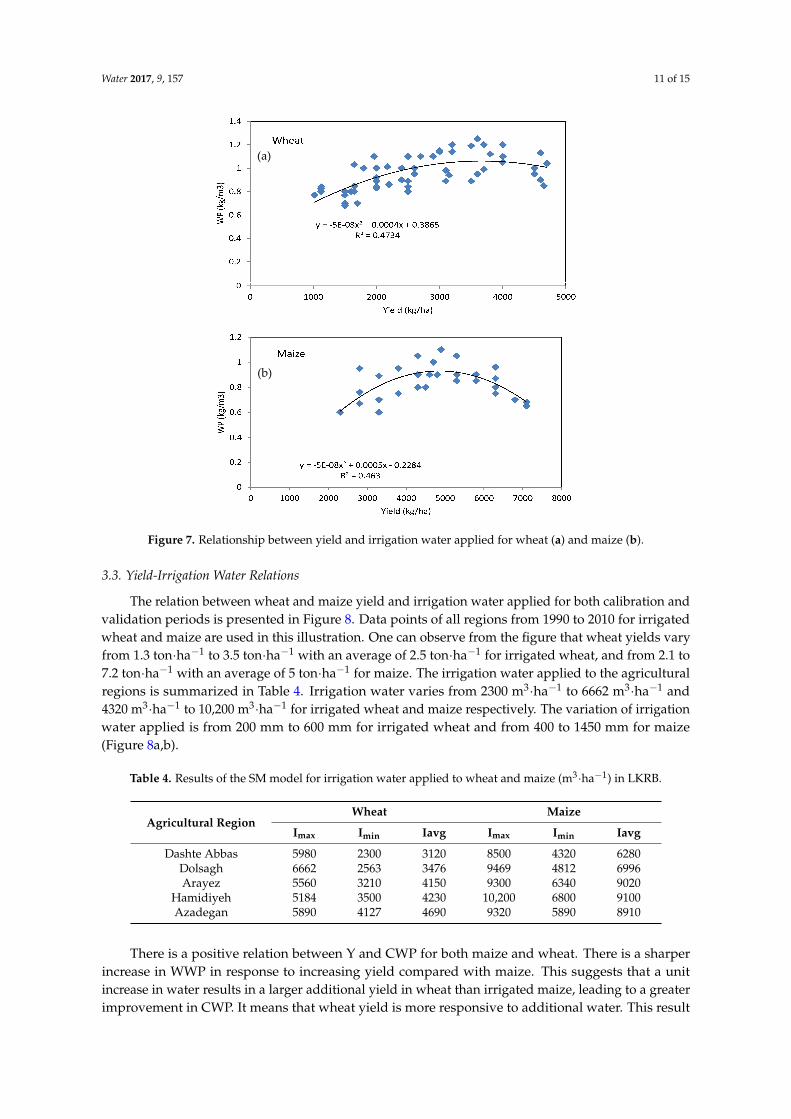
Figure 7. Relationship between yield and irrigation water applied for wheat (a) and maize (b).
3.3. Yield-Irrigation Water Relations
The relation between wheat and maize yield and irrigation water applied for both calibration and validation periods is presented in Figure 8. Data points of all regions from 1990 to 2010 for irrigated wheat and maize are used in this illustration. One can observe from the figure that wheat yields vary from 1.3 ton·ha−1 to 3.5 ton·ha−1 with an average of 2.5 ton·ha−1 for irrigated wheat, and from 2.1 to 7.2 ton·ha−1 with an average of 5 ton·ha−1 for maize. The irrigation water applied to the agricultural regions is summarized in Table 4. Irrigation water varies from 2300 m3·ha−1 to 6662 m3·ha−1 and 4320 m3·ha−1 to 10,200 m3·ha−1 for irrigated wheat and maize respectively. The variation of irrigation water applied is from 200 mm to 600 mm for irrigated wheat and from 400 to 1450 mm for maize (Figure 8a,b).
Table 4. Results of the SM model for irrigation water applied to wheat and maize (m3·ha−1) in LKRB.
Agricultural Region Wheat Maize
Imax Imin Iavg Imax Imin Iavg Dashte Abbas 5980 2300 3120 8500 4320 6280
Dolsagh 6662 2563 3476 9469 4812 6996 Arayez 5560 3210 4150 9300 6340 9020
Hamidiyeh 5184 3500 4230 10,200 6800 9100 Azadegan 5890 4127 4690 9320 5890 8910
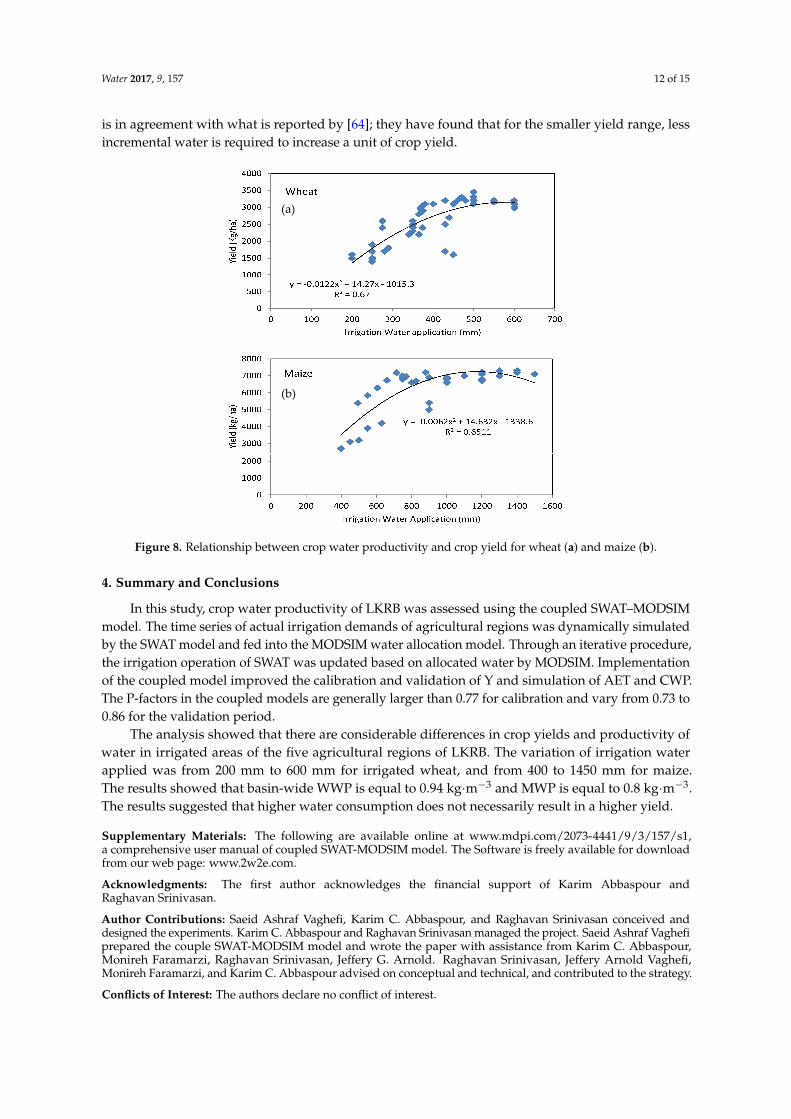
There is a positive relation between Y and CWP for both maize and wheat. There is a sharper increase in WWP in response to increasing yield compared with maize. This suggests that a unit increase in water results in a larger additional yield in wheat than irrigated maize, leading to a greater improvement in CWP. It means that wheat yield is more responsive to additional water. This result
(a)
(b)
Figure 7. Relationship between yield and irrigation water applied for wheat (a) and maize (b).
3.3. Yield-Irrigation Water Relations
The relation between wheat and maize yield and irrigation water applied for both calibration andvalidation periods is presented in Figure 8. Data points of all regions from 1990 to 2010 for irrigatedwheat and maize are used in this illustration. One can observe from the figure that wheat yields varyfrom 1.3 ton·ha−1 to 3.5 ton·ha−1 with an average of 2.5 ton·ha−1 for irrigated wheat, and from 2.1 to7.2 ton·ha−1 with an average of 5 ton·ha−1 for maize. The irrigation water applied to the agriculturalregions is summarized in Table 4. Irrigation water varies from 2300 m3·ha−1 to 6662 m3·ha−1 and4320 m3·ha−1 to 10,200 m3·ha−1 for irrigated wheat and maize respectively. The variation of irrigationwater applied is from 200 mm to 600 mm for irrigated wheat and from 400 to 1450 mm for maize(Figure 8a,b).
Table 4. Results of the SM model for irrigation water applied to wheat and maize (m3·ha−1) in LKRB.
Agricultural RegionWheat Maize
Imax Imin Iavg Imax Imin Iavg
Dashte Abbas 5980 2300 3120 8500 4320 6280Dolsagh 6662 2563 3476 9469 4812 6996Arayez 5560 3210 4150 9300 6340 9020
Hamidiyeh 5184 3500 4230 10,200 6800 9100Azadegan 5890 4127 4690 9320 5890 8910
There is a positive relation between Y and CWP for both maize and wheat. There is a sharperincrease in WWP in response to increasing yield compared with maize. This suggests that a unitincrease in water results in a larger additional yield in wheat than irrigated maize, leading to a greaterimprovement in CWP. It means that wheat yield is more responsive to additional water. This result
Water 2017, 9, 157 12 of 15
is in agreement with what is reported by [64]; they have found that for the smaller yield range, lessincremental water is required to increase a unit of crop yield.
Water 2017, 9, 157 12 of 15
is in agreement with what is reported by [64]; they have found that for the smaller yield range, less incremental water is required to increase a unit of crop yield.
Figure 8. Relationship between crop water productivity and crop yield for wheat (a) and maize (b).
4. Summary and Conclusions
In this study, crop water productivity of LKRB was assessed using the coupled SWAT–MODSIM model. The time series of actual irrigation demands of agricultural regions was dynamically simulated by the SWAT model and fed into the MODSIM water allocation model. Through an iterative procedure, the irrigation operation of SWAT was updated based on allocated water by MODSIM. Implementation of the coupled model improved the calibration and validation of Y and simulation of AET and CWP. The P-factors in the coupled models are generally larger than 0.77 for calibration and vary from 0.73 to 0.86 for the validation period.
The analysis showed that there are considerable differences in crop yields and productivity of water in irrigated areas of the five agricultural regions of LKRB. The variation of irrigation water applied was from 200 mm to 600 mm for irrigated wheat, and from 400 to 1450 mm for maize. The results showed that basin-wide WWP is equal to 0.94 kg·m−3 and MWP is equal to 0.8 kg·m−3. The results suggested that higher water consumption does not necessarily result in a higher yield.
Supplementary Materials: The following are available online at www.mdpi.com/2073-4441/9/2/157/s1, a comprehensive user manual of coupled SWAT-MODSIM model. The Software is freely available for download from our web page: www.2w2e.com.
Acknowledgments: The first author acknowledges the financial support of Karim Abbaspour and Raghavan Srinivasan.
Author Contributions: Saeid Ashraf Vaghefi, Karim C. Abbaspour, and Raghavan Srinivasan conceived and designed the experiments. Karim C. Abbaspour and Raghavan Srinivasan managed the project. Saeid Ashraf Vaghefi prepared the couple SWAT-MODSIM model and wrote the paper with assistance from Karim C. Abbaspour, Monireh Faramarzi, Raghavan Srinivasan, Jeffery G. Arnold. Raghavan Srinivasan, Jeffery Arnold Vaghefi, Monireh Faramarzi, and Karim C. Abbaspour advised on conceptual and technical, and contributed to the strategy.
(a)
(b)
Figure 8. Relationship between crop water productivity and crop yield for wheat (a) and maize (b).
4. Summary and Conclusions
In this study, crop water productivity of LKRB was assessed using the coupled SWAT–MODSIMmodel. The time series of actual irrigation demands of agricultural regions was dynamically simulatedby the SWAT model and fed into the MODSIM water allocation model. Through an iterative procedure,the irrigation operation of SWAT was updated based on allocated water by MODSIM. Implementationof the coupled model improved the calibration and validation of Y and simulation of AET and CWP.The P-factors in the coupled models are generally larger than 0.77 for calibration and vary from 0.73 to0.86 for the validation period.
The analysis showed that there are considerable differences in crop yields and productivity ofwater in irrigated areas of the five agricultural regions of LKRB. The variation of irrigation waterapplied was from 200 mm to 600 mm for irrigated wheat, and from 400 to 1450 mm for maize.The results showed that basin-wide WWP is equal to 0.94 kg·m−3 and MWP is equal to 0.8 kg·m−3.The results suggested that higher water consumption does not necessarily result in a higher yield.
Supplementary Materials: The following are available online at www.mdpi.com/2073-4441/9/3/157/s1,a comprehensive user manual of coupled SWAT-MODSIM model. The Software is freely available for downloadfrom our web page: www.2w2e.com.
Acknowledgments: The first author acknowledges the financial support of Karim Abbaspour andRaghavan Srinivasan.
Author Contributions: Saeid Ashraf Vaghefi, Karim C. Abbaspour, and Raghavan Srinivasan conceived anddesigned the experiments. Karim C. Abbaspour and Raghavan Srinivasan managed the project. Saeid Ashraf Vaghefiprepared the couple SWAT-MODSIM model and wrote the paper with assistance from Karim C. Abbaspour,Monireh Faramarzi, Raghavan Srinivasan, Jeffery G. Arnold. Raghavan Srinivasan, Jeffery Arnold Vaghefi,Monireh Faramarzi, and Karim C. Abbaspour advised on conceptual and technical, and contributed to the strategy.
Conflicts of Interest: The authors declare no conflict of interest.
Water 2017, 9, 157 13 of 15
References
1. Food and Agriculture Organization of the United Nations (FAO). Crop Yield Response to Water; Steduto, P.,Hsiao, T.C., Fereres, E., Raes, D., Eds.; Food and Agriculture Organization of the United Nations: Rome, Italy, 2012.
2. World Water Assessment Programme (WWAP). The United Nations World Water Development Report 4:Managing Water under Uncertainty and Risk; World Water Assessment Programme: Paris, France, 2012.
3. Keller, A.; Sakthivadivel, R.; Seckler, D. Water Scarcity and the Role of Storage in Development; InternationalWater Management Institute (IWMI): Colombo, Sri Lanka, 2010.
4. Zwart, S.J.; Bastiaanssen, W.G.M. Review of measured crop water productivity values for irrigated wheat,rice, cotton and maize. Agric. Water Manag. 2004, 69, 115–133. [CrossRef]
5. Molden, D.; Oweis, T.; Steduto, P.; Bindraban, P.; Hanjra, M.A.; Kijne, J. Improving agricultural waterproductivity: Between optimism and caution. Agric. Water Manag. 2010, 97, 528–535. [CrossRef]
6. Sarwar, A.; Bastiaanssen, W.G.M. Long-term effects of irrigation water conservation on crop production andenvironment in semiarid areas. J. Irrig. Drain. Eng. ASCE 2001, 127, 331–338. [CrossRef]
7. Nhamo, L.; Mabhaudhi, T.; Magombeyi, M. Improving water sustainability and food security throughincreased crop water productivity in malawi. Water 2016, 8, 411. [CrossRef]
8. Giménez, L.; Petillo, M.; Paredes, P.; Pereira, L. Predicting maize transpiration, water use and productivity fordeveloping improved supplemental irrigation schedules in western Uruguay to cope with climate variability.Water 2016, 8, 309. [CrossRef]
9. Borrego-Marín, M.; Gutiérrez-Martín, C.; Berbel, J. Water productivity under drought conditions estimatedusing SEEA-water. Water 2016, 8, 138. [CrossRef]
10. Kima, A.; Chung, W.; Wang, Y.-M. Improving irrigated lowland rice water use efficiency under saturatedsoil culture for adoption in tropical climate conditions. Water 2014, 6, 2830. [CrossRef]
11. Roudier, P.; Sultan, B.; Quirion, P.; Berg, A. The impact of future climate change on West African crop yields:What does the recent literature say? Glob. Environ. Chang. 2011, 21, 1073–1083. [CrossRef]
12. Mo, X.; Liu, S.; Lin, Z.; Xu, Y.; Xiang, Y.; McVicar, T.R. Prediction of crop yield, water consumption andwater use efficiency with a SVAT-crop growth model using remotely sensed data on the North China Plain.Ecol. Model. 2005, 183, 301–322. [CrossRef]
13. Singh, R.; van Dam, J.C.; Feddes, R.A. Water productivity analysis of irrigated crops in sirsa district, India.Agric. Water Manag. 2006, 82, 253–278. [CrossRef]
14. Liu, J.G. A gis-based tool for modelling large-scale crop-water relations. Environ. Model. Softw. 2009, 24,411–422. [CrossRef]
15. Aggarwal, P.K.; Banerjee, B.; Daryaei, M.G.; Bhatia, A.; Bala, A.; Rani, S.; Chander, S.; Pathak, H.;Kalra, N. Infocrop: A dynamic simulation model for the assessment of crop yields, losses due to pests, andenvironmental impact of agro-ecosystems in tropical environments. II. Performance of the model. Agric. Syst.2006, 89, 47–67. [CrossRef]
16. Aggarwal, P.K.; Kalra, N.; Chander, S.; Pathak, H. Infocrop: A dynamic simulation model for the assessmentof crop yields, losses due to pests, and environmental impact of agro-ecosystems in tropical environments. I.Model description. Agric. Syst. 2006, 89, 1–25. [CrossRef]
17. Vanuytrecht, E.; Raes, D.; Steduto, P.; Hsiao, T.C.; Fereres, E.; Heng, L.K.; Garcia Vila, M.; Mejias Moreno, P.Aquacrop: Fao’s crop water productivity and yield response model. Environ. Model. Softw. 2014, 62, 351–360.[CrossRef]
18. Steduto, P.; Raes, D.; Hsiao, T.C.; Fereres, E.; Heng, L.K.; Howell, T.A.; Evett, S.R.; Rojas-Lara, B.A.;Farahani, H.J.; Izzi, G.; et al. Concepts and applications of AquaCrop: The FAO crop water productivity model.In Crop Modeling and Decision Support; Cao, W., White, J.W., Wang, E., Eds.; Springer: Berlin/Heidelberg,Germany, 2009; pp. 175–191.
19. Raes, D.; Steduto, P.; Hsiao, T.C.; Fereres, E. AquaCrop—The FAO Crop model to simulate yield response towater: II. Main algorithms and software description all rights reserved. No part of this periodical may bereproduced or transmitted in any form or by any means, electronic or mechanical, including photocopying,recording, or any information storage and retrieval system, without permission in writing from the publisher.Agron. J. 2009, 101, 438–447.
20. Alcamo, J.; DÖLl, P.; Henrichs, T.; Kaspar, F.; Lehner, B.; RÖSch, T.; Siebert, S. Development and testing ofthe WaterGap 2 global model of water use and availability. Hydrol. Sci. J. 2003, 48, 317–337. [CrossRef]
Water 2017, 9, 157 14 of 15
21. Li, T.; Hasegawa, T.; Yin, X.; Zhu, Y.; Boote, K.; Adam, M.; Bregaglio, S.; Buis, S.; Confalonieri, R.;Fumoto, T.; et al. Uncertainties in predicting rice yield by current crop models under a wide range ofclimatic conditions. Glob. Chang. Biol. 2015, 21, 1328–1341. [CrossRef] [PubMed]
22. Challinor, A.J.; Wheeler, T.R. Crop yield reduction in the tropics under climate change: Processes anduncertainties. Agric. For. Meteorol. 2008, 148, 343–356. [CrossRef]
23. Lobell, D.B.; Cassman, K.G.; Field, C.B. Crop yield gaps: Their importance, magnitudes, and causes.Annu. Rev. Environ. Resour. 2009, 34, 179–204. [CrossRef]
24. Iizumi, T.; Yokozawa, M.; Nishimori, M. Parameter estimation and uncertainty analysis of a large-scalecrop model for paddy rice: Application of a Bayesian approach. Agric. For. Meteorol. 2009, 149, 333–348. [CrossRef]
25. Arnold, J.G.; Srinivasan, R.; Muttiah, R.S.; Williams, J.R. Large area hydrologic modeling andassessment—Part 1: Model development. J. Am. Water Resour. Assoc. 1998, 34, 73–89. [CrossRef]
26. Gassman, P.W.; Reyes, M.R.; Green, C.H.; Arnold, J.G. The soil and water assessment tool: Historicaldevelopment, applications, and future research directions. Trans. ASABE 2007, 50, 1211–1250. [CrossRef]
27. Arnold, J.G.; Moriasi, D.N.; Gassman, P.W.; Abbaspour, K.C.; White, M.J.; Srinivasan, R.; Santhi, C.;Harmel, R.D.; van Griensven, A.; Van Liew, M.W.; et al. Swat: Model use, calibration, and validation.Trans. ASABE 2012, 55, 1491–1508. [CrossRef]
28. Abbaspour, K.C.; Yang, J.; Maximov, I.; Siber, R.; Bogner, K.; Mieleitner, J.; Zobrist, J.; Srinivasan, R. Modellinghydrology and water quality in the pre-ailpine/alpine Thur watershed using SWAT. J. Hydrol. 2007, 333,413–430. [CrossRef]
29. Schuol, J.; Abbaspour, K.C.; Yang, H.; Srinivasan, R.; Zehnder, A.J.B. Modeling blue and green wateravailability in Africa. Water Resour. Res. 2008, 44. [CrossRef]
30. Abbaspour, K.C.; Rouholahnejad, E.; Vaghefi, S.; Srinivasan, R.; Yang, H.; Klove, B. A continental-scalehydrology and water quality model for Europe: Calibration and uncertainty of a high-resolution large-scaleSWAT model. J. Hydrol. 2015, 524, 733–752. [CrossRef]
31. Faramarzi, M.; Yang, H.; Schulin, R.; Abbaspour, K.C. Modeling wheat yield and crop water productivity inIran: Implications of agricultural water management for wheat production. Agric. Water Manag. 2010, 97,1861–1875. [CrossRef]
32. Babel, M.S.; Gupta, A.D.; Nayak, D.K. A model for optimal allocation of water to competing demands.Water Resour. Manag. 2005, 19, 693–712. [CrossRef]
33. Perera, B.J.C.; James, B.; Kularathna, M.D.U. Computer software tool REALM for sustainable water allocationand management. J. Environ. Manag. 2005, 77, 291–300. [CrossRef] [PubMed]
34. Yates, D.; Sieber, J.; Purkey, D.; Huber-Lee, A. Weap21—A demand-, priority-, and preference-driven waterplanning model part 1: Model characteristics. Water Int. 2005, 30, 487–500. [CrossRef]
35. Labadie, J.W. Modsim: River Basin Network Flow Model for Conjunctive Stream-Aquifer Management. ProgramUser Manual and Documentation; Colorado State University: Boulder, CO, USA, 1995.
36. Mousavi, S.J.; Shourian, M. Adaptive sequentially space-filling metamodeling applied in optimal waterquantity allocation at basin scale. Water Resour. Res. 2010, 46. [CrossRef]
37. Shourian, M.; Mousavi, S.J.; Tahershamsi, A. Basin-wide water resources planning by integrating PSOalgorithm and MODSIM. Water Resour. Manag. 2008, 22, 1347–1366. [CrossRef]
38. De Azevedo, L.G.T.; Gates, T.K.; Fontane, D.G.; Labadie, J.W.; Porto, R.L. Integration of water quantity andquality in strategic river basin planning. J. Water Resour. Plan. Manag. ASCE 2000, 126, 85–97. [CrossRef]
39. Dai, T.W.; Labadie, J.W. River basin network model for integrated water quantity/quality management.J. Water Resour. Plan. Manag. ASCE 2001, 127, 295–305. [CrossRef]
40. Ahmad, M.U.D.; Giordano, M. The Karkheh River Basin: The food basket of Iran under pressure. Water Int.2010, 35, 522–544. [CrossRef]
41. Qureshi, A.S.; Oweis, T.; Karimi, P.; Porehemmat, J. Water productivity of irrigated wheat and maize in theKarkheh River Basin of Iran. Irrig. Drain. 2010, 59, 264–276. [CrossRef]
42. Vaghefi, S.A.; Mousavi, S.J.; Abbaspour, K.C.; Srinivasan, R.; Yang, H. Analyses of the impact of climatechange on water resources components, drought and wheat yield in semiarid regions: Karkheh River Basinin Iran. Hydrol. Process. 2014, 28, 2018–2032. [CrossRef]
43. Rafiee, V.; Shourian, M. Optimum multicrop-pattern planning by coupling swat and the harmonysearch algorithm. J. Irrig. Drain. Eng. 2016, 142. [CrossRef]
Water 2017, 9, 157 15 of 15
44. Iran Water and Power Resources Development Co. Systematic Studies of Karkheh River Basin; IWPR: Tehran,Iran, 2010. (In Persian)
45. Marjanizadeh, S.; de Fraiture, C.; Loiskandl, W. Food and water scenarios for the Karkheh River Basin, Iran.Water Int. 2010, 35, 409–424. [CrossRef]
46. Oweis, T.; Abbasi, F.; Siadat, H. Improving on-Farm Agricultural Water Productivity in the Karkheh RiverBasin (PN08); Department for International Development: Chatham, UK, 2009.
47. Fisher, M.J.; Cook, S.E. Water, Food and Poverty in River Basins, Defining the Limits; Routledge: London, UK,2012; p. 406.
48. Keshavarz, A.; Ashraft, S.; Hydari, N.; Pouran, M.; Farzaneh, E.A.; Natl Acad, P. Water Allocation and Pricingin Agriculture of Iran; National Academies Press: Washington, DC, USA, 2005; pp. 153–172.
49. Farahani, H.; Oweis, T. Chapter I Agricultural Water Productivity in Karkheh River Basin. Improving on-FarmAgricultural water Productivity in the Karkheh River Basin; Research Report No. 1: A Compendium of ReviewPapers; ICARDA: Aleppo, Syria, 2008; p. 103.
50. Ahmad, M.-U.-D.; Islam, M.A.; Masih, I.; Muthuwatta, L.; Karimi, P.; Turral, H. Mapping basin-level waterproductivity using remote sensing and secondary data in the Karkheh River Basin, Iran. Water Int. 2009, 34,119–133. [CrossRef]
51. MahabGhods Consulting Engineer Co. Systematic Planning of Karkheh Watershed: Studying the WaterConsumption of Demand Sectors; MahabGhods Consulting Engineer Co.: Tehran, Iran, 2009. (In Persian)
52. Abbaspour, K.C.; Johnson, C.A.; van Genuchten, M.T. Estimating uncertain flow and transport parametersusing a sequential uncertainty fitting procedure. Vadose Zone J. 2004, 3, 1340–1352. [CrossRef]
53. Abbaspour, K.C. User Manual for Swat-Cup, Swat Calibration and Uncertainty Analysis Programs; Swiss FederalInstitute of Aquatic Science and Technology, Eawag: Duebendorf, Switzerland, 2011; p. 103.
54. Moriasi, D.N.; Arnold, J.G.; van Liew, M.W.; Bingner, R.L.; Harmel, R.D.; Veith, T.L. Model evaluationguidelines for systematic quantification of accuracy in watershed simulations. Trans. ASABE 2007, 50,885–900. [CrossRef]
55. Labadie, J.W. River Basin Network Model for Water Rights Planning, Modsim: Technical Manual, Department ofCivil Engineering; Colorado State University: Fort Collins, CO, USA, 2010.
56. Fredericks, J.W.; Labadie, J.W.; Altenhofen, J.M. Decision support system for conjunctive stream-aquifermanagement. J. Water Resour. Plan. Manag. ASCE 1998, 124, 69–78. [CrossRef]
57. Food and Agriculture Organization (FAO). The Digital Soil Map of the World and Derived Soil Properties;FAO: Rome, Iatly, 1995.
58. Jarvis, A.; Reuter, H.I.; Nelson, A.; Guevara, E. Hole-Filled Srtm for the Globe Version 4; Available from theCGIAR-CSI Srtm 90 m Database; CGIAR-CSI: Washington, DC, USA, 2008.
59. Ministry of Energy of Iran. An Overview of National Water Planning of Iran; Ministry of Energy of Iran: Tehran,Iran, 1998. (In Persian)
60. Faramarzi, M.; Abbaspour, K.C.; Schulin, R.; Yang, H. Modelling blue and green water resources availabilityin Iran. Hydrol. Process. 2009, 23, 486–501. [CrossRef]
61. Vaghefi, S.A.; Mousavi, S.J.; Abbaspour, K.C.; Srinivasan, R.; Arnold, J.R. Integration of hydrologic and waterallocation models in basin-scale water resources management considering crop pattern and climate change:Karkheh River Basin in Iran. Reg. Environ. Chang. 2015, 15, 475–484. [CrossRef]
62. Chhuon, K.; Herrera, E.; Nadaoka, K. Application of integrated hydrologic and river basin managementmodeling for the optimal development of a multi-purpose reservoir project. Water Resour. Manag. 2016, 30,3143–3157. [CrossRef]
63. Ahn, S.R.; Jeong, J.H.; Kim, S.J. Assessing drought threats to agricultural water supplies under climatechange by combining the SWAT and MODSIM models for the Geum River Basin, South Korea. Hydrol. Sci. J.2016, 61, 2740–2753. [CrossRef]
64. Rockström, J.; Hatibu, N.; Oweis, T.; Wani, S.P. Managing water in rain-fed agriculture. In Water for Food,Water for Life: A Comprehensive Assessment of Water Management in Agriculture; Molden, D., Ed.; Earthscan:London, UK; International Water Management Institute (IWMI): Colombo, Sri Lanka, 2007; pp. 315–348.
© 2017 by the authors. Licensee MDPI, Basel, Switzerland. This article is an open accessarticle distributed under the terms and conditions of the Creative Commons Attribution(CC BY) license (http://creativecommons.org/licenses/by/4.0/).