modeling and analysis work group #xx
TRANSCRIPT

Modeling and Analysis Work Group #4
March 11, 20211

Meeting Logistics Summary
• Roll Call• Members will unmute and acknowledge their attendance when their name is
called.• Modeling and Analysis Workgroup Members
• Use the WebEx “raise hand” feature to request to speak or ask questions.• Wait to be recognized before speaking to ensure clear communication and
remain muted when not speaking.• Livestream Attendees
• Electronic public comment forms are available at cap-az.com/ARC for anyone wishing to submit a comment or question during the meeting.
• All submissions will be addressed during the Call to the Public at the end of the meeting, unless relevant to a specific topic in the presentation.
• Modeling and Analysis Workgroup and ARC Information• Meeting materials have been posted on the ADWR and CAP ARC pages:
cap-az.com/ARC or new.azwater.gov/ARC.
March 11, 20212

Meeting Agenda• Review of Colorado River Conditions• Review of MAWG #3 • Arizona Priority System• Arizona On-River Uses • Yuma Area Operations• Salinity Management Impacts to Arizona• Multi-Species Conservation Program (MSCP) Constraints• CAP System and Model Overview• Preview of MAWG #5• Call to the Public
3

Colorado River System Update
4
2021

Colorado River System
5

Colorado River System
6

Colorado River System Update
7

Summary of MAWG #3
March 11, 20218
• Reservoir Operations (specifically coordinated operations of Lakes Powell and Mead) are a key driver of Lake Mead elevations.
• Average Upper Basin use over the last ten years (2008-2018) are around 3.9 maf (excluding CRSP evap)
• Multiple UB Use scenarios have been developed: 2016 UCRC schedule reaches 5.48 maf in 2060 (excluding CRSP evap)
• CRSS Projections of Lake Mead elevations are sensitive to the UB demand schedules and Lower Basin uses
• Lower Division States are at full apportionment. ICS and System conservation use behaviors impact Lake Mead elevation

Comparison of UB Demand Schedules (excludes CRSP evaporation)Name 2020
(MAF)2030(MAF)
2040(MAF)
2050(MAF)
2060(MAF)
1999 4.85 5.03 5.15 5.32 5.43
2007 UCRC 5.08 5.33 5.46 5.56 5.57
Basin Study (Current Projected)
4.87 5.11 5.30 5.45 5.55
2016 UCRC 4.80 5.01 5.22 5.42 5.48
Guideline Period Trend Extended
4.25 4.46 4.67 4.88 5.09
Average 2008 - 2018 3.92 NA NA NA NA

Lower Basin Water Use
March 11, 202110
•Since 2014, average CU in LB has been about 400 kaf lower than apportionment•System conservation
•Intentionally Created Surplus (ICS)
•Prior to this time period, CU was about 300 kaf higher

Priority 1(474,276 AF)
Priority 2 & 3(528,502 AF)
Priority 4 (56,324 AF)
P5/6(4,474 AF)
EC-ICS(6,274 AF) System
Conservation(27,645 AF)
Priority 3 (68,400 AF)
Priority 4(1,280,592 AF)
EC-ICS(143,146 AF)
System Conservation(134,555 AF)
Losses (75,000 AF)
On-River CAP
2019 Available Supply ≈ 1.7 MA
FArizona’s 2019 Uses
2019
Con
sum
ptiv
e U
se ≈
1.1
MA
F

Mainstem Water Use, by Priority(Total Consumptive Use, plus System Conservation and ICS Creation)
March 11, 202112
Linear Trend
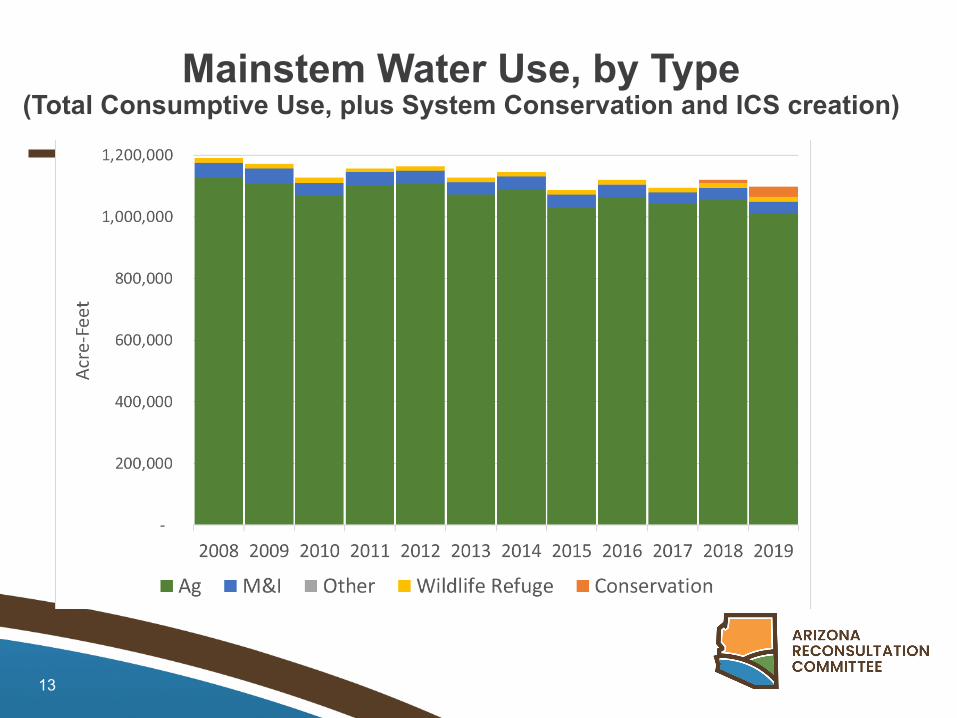
March 11, 202113
Mainstem Water Use, by Type(Total Consumptive Use, plus System Conservation and ICS creation)

P4 On-River Reductions Consistent with Arizona Shortage Sharing Recommendation (Current P4 On-River Use)
0
20,000
40,000
60,000
80,000
100,000
120,000
140,000
160,000
180,000
192,000
512,000
640,000
720,000
Diversion Entitlements - 164,652 AF
Agricultural Use54 KAF
M&I Use37 KAF
592,000
Firmed by AWBA

Arizona On-River Uses Scenarios
15
Update…

Arizona On-River Uses Scenarios
Name 2020(MAF)
2030(MAF)
2040(MAF)
2050(MAF)
2060(MAF)
0.1% Growth Trend* 1.109 1.120 1.131 1.143 1.154
Available to CAP 1.691 1.680 1.669 1.657 1.646
0.2% Growth Trend* 1.110 1.132 1.155 1.178 1.202
Available to CAP 1.690 1.668 1.645 1.622 1.598
0.1% Declining Trend* 1.107 1.096 1.085 1.074 1.063
Available to CAP 1.693 1.704 1.715 1.726 1.737
Average 2008 – 2019 1.135 1.135 1.135 1.135 1.135
Available to CAP 1.665 1.665 1.665 1.665 1.665
* Trend begins at 2015-2019 average. Potential refinement for different use sectors and priorities

Yuma Area Operations
17
• On-river CU = Diversion – Return Flows
• Yuma area drainage pumping and salinity management impact AZ CU, including supply available to CAP

Yuma Area Salinity Management
18
• Minute 242 defines water quality requirements for US deliveries to Mexico
• Minute 242 requirement WQ at Morelos Dam = 115 +/- 30ppm at Imperial Dam
• NIB = 1.360 MAF/yr• SIB = 0.140 MAF/yr

Yuma Area Operations: 2019
19
2019 Bypass + Excess*• Bypass 143 kaf (5 yr avg = 139
kaf/yr)• Excess 39 kaf (5 yr avg = 18
kaf/yr)• 2019 = 182 kaf (5 yr avg = 157
kaf/yr)
2019 Impacts• Decrease in Return Flows (incr. in
CU)• Decrease availability to CAP• Loss to Lake Mead*Source = BOR CR Water Accounting Reports

Yuma Area Modeling Tools
20
• Reclamation operates a Yuma area drainage and salinity model in RiverWare
• Guides real-time and near-term operations and management
• Some aspects of Yuma area operation included in CRSS• CAP has developed a Yuma Area salinity analysis model
in GoldSim• Monthly time step• Calibrated from 2003-2019

MSCP Overview
21
• Purpose: Provide Endangered Species Act (ESA) coverage for ongoing and future operations and maintenance activities on the Lower Colorado River (LCR) through 2055.
• Planning area: Lake Mead full pool to the Southerly International Border (SIB) with Mexico.
• Balances Lower Colorado River water use and the conservation of native species and their habitats.
• Reclamation is the Program’s implementing agency, with input and oversight from the Program Steering Committee.
• 27 Federal or State listed, candidate, and sensitive species and their associated habitat
• Program creates at least 8,132 acres of habitat; • Provides 660k subadult razorback suckers and 620k bonytail to augment existing
LCR populations.• Program costs shared among Federal and non-Federal partners:
BOR: 50%, CA: 25%, AZ: 12.5%, NV: 12.5% FY ‘21 ~$30.3M

MSCP Constraints • Integrates Section 7 and Section 10 responsibilities under the ESA• Program considerations related to AZ Reconsultation:
• Flow-related covered activities include power production, changes to points of diversion and reduction in water releases from Hoover, Davis and Parker Dams. Covered reductions in flow: 845 kaf below Hoover Dam (Reach 2) 860 kaf below Davis Dam (Reach 3) 1.574 maf below Parker Dam to Imperial Dam (Reaches 4 & 5)
Evaluation of future flow within MSCP will be necessary as part of the Guidelines Reconsultation Process.
March 11, 202122

MSCP Key Reaches
March 11, 202123
845 kaf below Hoover Dam (Reach 2)
860 kaf below Davis Dam (Reach 3)
1.574 maf below Parker Dam to Imperial Dam (Reaches 4 & 5)

BREAK
24

Maricopa
Pinal
Pima
• Indian Contractors
• M&I Subcontractors
• Irrigation Districts
• Non-subcontractors w/CAGRD relationship
• 3-County Service Area
CAP’s Service Area and Water Users*
* Based on Jurisdictional Boundary or Planning Area
CAP Service Area

CAP Contract Utilization
March 11, 202126
1985 – 2019 (by Contract Category) Voluntary Mead Contributions

0100,000200,000300,000400,000500,000600,000700,000800,000900,000
1,000,0001,100,0001,200,0001,300,0001,400,0001,500,0001,600,000
Volu
me
[AF]
CAP Priority System
March 11, 202127
Low
High
Delivery PriorityM&IIndian
NIA
Ag Pool
P3
Other Excess
*Based on 2021 Orders Prior to DCP contribution, System Conservation and ICS Creation (includes NIA reallocation water)
Excess
Long-Term Contracts

0100,000200,000300,000400,000500,000600,000700,000800,000900,000
1,000,0001,100,0001,200,0001,300,0001,400,0001,500,0001,600,000
Volu
me
[AF]
CAP Priority System (Full Supply)
March 11, 202128
2022 (Current Use) Full Buildout (post-2043)
NIAP3
Ag PoolIndian
M&IOther Excess
1.415 MAF
M&IIndian
NIA
Ag Pool
P3
M&IIndian
NIA
Excess
P3
March 11, 202129
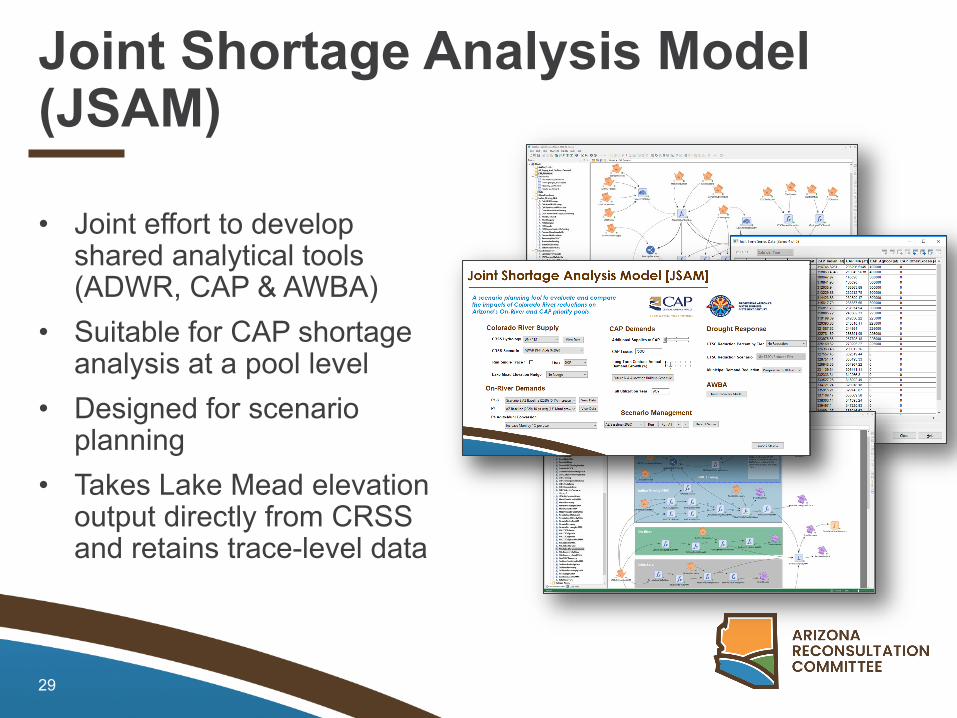
Joint Shortage Analysis Model(JSAM)
• Joint effort to develop shared analytical tools (ADWR, CAP & AWBA)
• Suitable for CAP shortage analysis at a pool level
• Designed for scenario planning
• Takes Lake Mead elevation output directly from CRSS and retains trace-level data

JSAM Modeling Steps (Generalized)
March 11, 202130
Elevation of Lake Mead
Supply to AZ
Use by On-River
P1-3
Use By On-River
P4
CAP Supply
Impact to CAP By Priority
CAP Demand
Director’s Shortage Sharing Agreement Implemented
Arizona Water Settlements Act Shortage
Sharing Formula
On-River Model Output

Key Factors Influencing Available CAP Supply and Impacts
• AZ Colorado River Supply• Function of Upper Basin Demand, System
Operations, Hydrology, etc.• On-River Demands
• P1-3• P4 M&I and Ag
• CAP Demands• Utilization of existing Long-Term Contracts• Timing and magnitude of future allocation of
NIA supplies• Drought Response
• Rate of LTSC accrual• Changes in annual direct demands
March 11, 202131
CAP Driving Forces in
JSAM

CAP Buildup Schedule
March 11, 202132
• Defines supply utilization through time at the pool level
• Includes both current and future uses
• Expressed as a time-series in JSAM
NIA
M&I
Ag Pool Excess
IndianP3

CAP Buildup Schedule
March 11, 202133
1.415 MAF CAP Long-Term Contracts Recent Long-Term
Contract Use(All Priorities)
Underutilized AllocationsFuture Allocations

CAP Buildup Schedule
March 11, 202134
1.415 MAF
Pending and Future Allocations (164,813 af)
Round One of NIA Reallocation (2022)
Allocations:• Additional NIA for M&I Use • WMAT• Hualapai• Future Tribal Settlements

CAP Buildup Schedule
March 11, 202135
• Allocation of future supplies is uncertain
• JSAM allows for evaluation of different timing and magnitude
• The settings ultimately affect the point when all long-term contracts are allocated and used
• e.g., 2040, 2050, or 2060

Demand Response to Shortages
March 11, 202136
• JSAM can simulate reduced demands during shortage conditions
• Cost• Drought response• Demand management
• Reduction in demand by pool is tied to shortage tiers
Scenario Tier 1
Tier 2a
Tier2b
Tier 3
No Reduction 0% 0% 0% 0%
Progressive to 10% 0% 5% 7% 10%
Progressive to 20% 0% 10% 14% 20%
Municipal Demand Reduction

Demand Response to Shortage
37
2045
No Growth
Current
Growth in Direct Use Demand
Underutilized
LTSC Accrual
Direct Use Demand

Supply Availability by Priority
March 11, 202138

JSAM Visualizations
• JSAM generates a variety of outputs from each set of inputs from CRSS
• Evaluated within the model or post-processed in Excel or R
• Recent examples include• Heatmaps• Histograms• Volume/Probability
Charts
March 11, 202139
0
20000
40000
60000
80000
100000
120000
140000
160000
180000
200000
220000
240000
2020 2022 2024 2026 2028 2030 2032 2034 2036 2038 2040 2042 2044
Year
45%..55%40%..45% / 55%..60%35%..40% / 60%..65%30%..35% / 65%..70%25%..30% / 70%..75%20%..25% / 75%..80%15%..20% / 80%..85%10%..15% / 85%..90%5%..10% / 90%..95%1%..5% / 95%..99%Min..1% / 99%..Max50%Mean
0
20,000
40,000
60,000
80,000
100,000
120,000
140,000
2020 2022 2024 2026 2028 2030 2032 2034 2036 2038 2040 2042 2044
Tier 2b
Tier 3
Tier 1
Tier 2a

Additional Evaluation Tools
• During the AZDCP discussions a set of stand-alone interactive tools for visualizing and comparing scenarios was developed
• Single-Year Tool• Single-Trace Tool• Multiple-Trace Tool
• Versions of these are being updated and refined to support MAWG and other efforts
March 11, 202140

Single-Year Tool
March 11, 202141
|
0
200,000
400,000
600,000
800,000
1,000,000
1,200,000
1,400,000
1,600,000
Volu
me
[AF]
CAWCD BOARD MEETING | MARCH 4, 2021
17
2022 – Tier 1 Shortage
USF-to-GSF
Firming
Mitigation Water
Compensated Mitigation
CAP-SRP Exchange
2022 – Tier 1 Prior to Mitigation

Single-Trace Tool
March 11, 202142
42
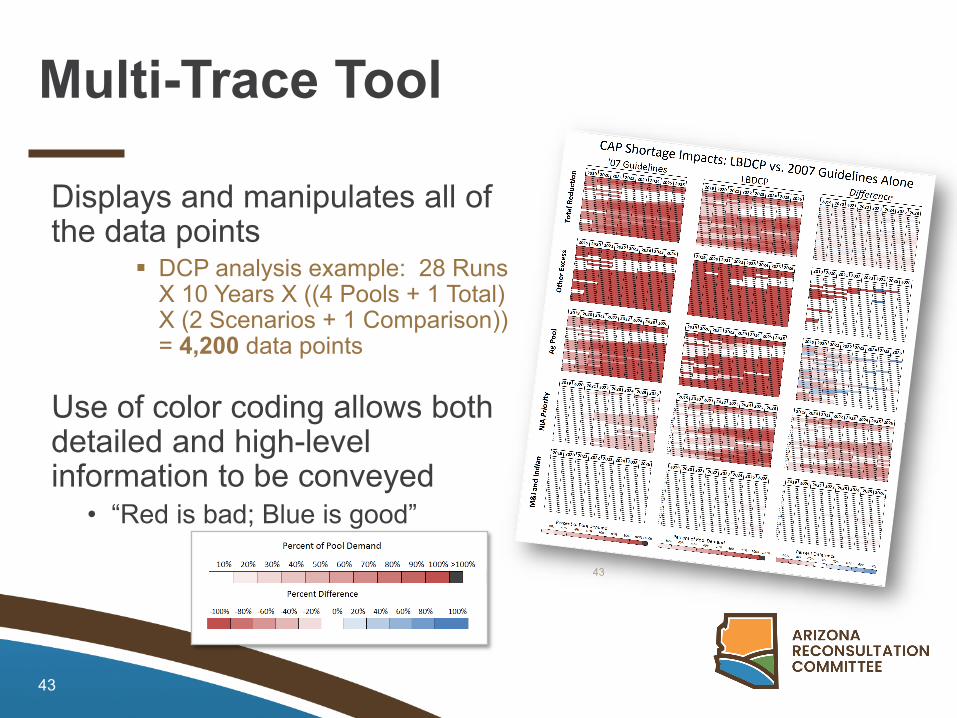
Multi-Trace Tool
March 11, 202143
43
Displays and manipulates all of the data points
DCP analysis example: 28 Runs X 10 Years X ((4 Pools + 1 Total) X (2 Scenarios + 1 Comparison)) = 4,200 data points
Use of color coding allows both detailed and high-level information to be conveyed
• “Red is bad; Blue is good”

Multi-Trace Tool
March 11, 202144
44
0%
20%
40%
60%
80%
100%
Ag Pool
0%
20%
40%
60%
80%
100%
M&I and Indian Priority
0%
20%
40%
60%
80%
100%
NIA-Priority
LegendNo Change, No Supply
No Change, Full Supply
A Little Worse
A Lot Worse
A Lot Better
A Little Better

Multi-Trace Tool
March 11, 202145
Assumptions• Stress Test Hydrology (1988-2015)• USBR’s April 2018 DCP CRSS Model• 2019 through 2026• Slice Size = # of occurrences• “A Little” < 30%• “A Lot” >= 30%
A Lot More A Little More No Change, No Supply No Change, Full Supply A Little Less A Lot Less
Available Supply
Legend

CAP Shortage Impact Analysis
• The primary modeling tools and visualizations are available to simulate and analyze a wide range of plausible futures at the CAP priority pool level
• Additional refinements are expected based on feedback from the MAWG and ARC members, and the evolving needs of the Reconsultation process
• The ability to evaluate differences in alternatives will become increasingly important
March 11, 202146

Preview of MAWG #5 Scenario Development
• Review of modeling scenario components• Colorado River Basin• Arizona On-River• CAP
• Initial Conditions Scenario Development Exercise• Recommendation(s) to ARC• Modeling and analysis of results in follow up meetings
• Post-confirmation by ARC
March 11, 202147

Selection of Initial Scenario ComponentsColorado River Basin• Hydrology:
• Observed• Pluvial Removed• Stress Test• Paleo Resampled• Paleo Conditioned• Downscaled GCM
• Operations:• DCP Extended
March 11, 202148
• Upper Basin Demand:• 1999 Schedule• 2007 UCRC• USBR Basin Study (Current Projected)• 2016 UCRC• Guidelines Period Trend Extended• Average 2008-2018
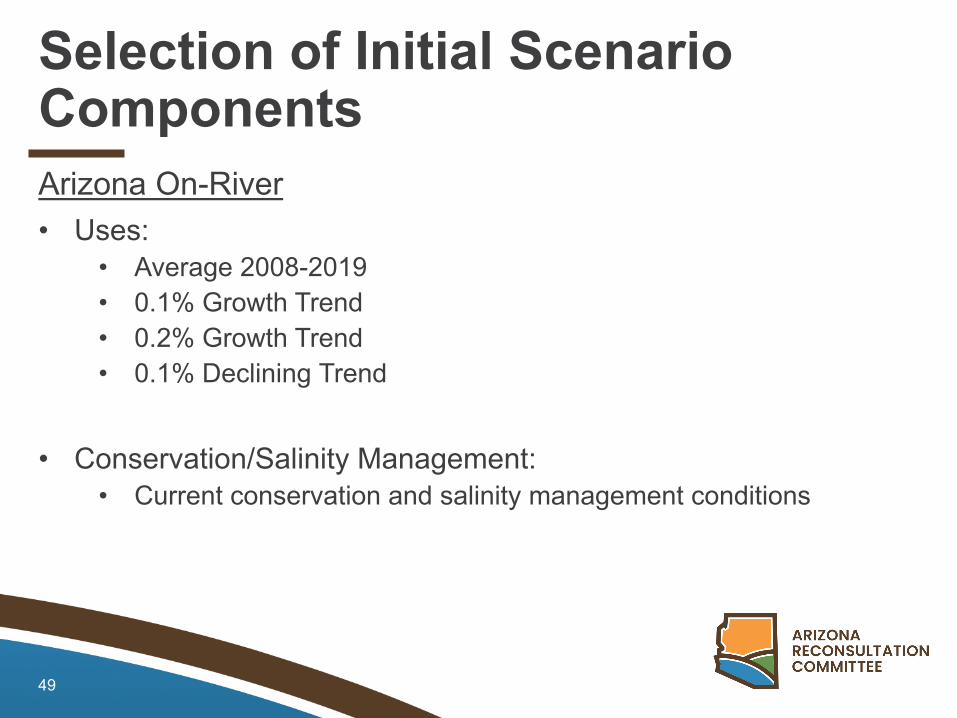
Selection of Initial Scenario ComponentsArizona On-River• Uses:
• Average 2008-2019• 0.1% Growth Trend• 0.2% Growth Trend• 0.1% Declining Trend
• Conservation/Salinity Management:• Current conservation and salinity management conditions
March 11, 202149

Selection of Initial Scenario ComponentsCAP• Uses/Supply:
• Trends in Long-term Contract Use Low Growth Medium Growth High Growth
• Timing and Magnitude of Future NIA Supply Rapid Slow
• Drought Response Demand Management No Demand Management Moderate Management Aggressive Management
March 11, 202150

Scenario Development
March 11, 202151
Guidance on selection of scenario components:• Each combination of scenario components represents a scenario• Each scenario should target a particular theme, exploration, or goal• The combination of scenario components for each scenario should be
logical, plausible, and consistent• Each scenario should be unique by selecting different combinations of
scenario components for each scenario

Summary
March 11, 202152
• On-River Uses average 1.135 MAF/yr, including conservation (2008 – 2019)
• 4 On-River Use Scenarios identified: Average Extended, 0.1 % Growth Trend, 0.2 % Growth Trend, 0.1% Declining Trend
• Yuma area drainage and salinity management impact consumptive use in AZ, influencing the supply available to CAP
• MSCP flow constraints will be evaluated as part of Reconsultation process
• CAP system modeling and analysis tools are available to evaluate impacts to CAP priority pools
• MAWG #5 – MAWG will develop Initial Conditions Scenarios

MAWG #5 Initial Scenario Development Draft Agenda
• May 13, 2021 tentative date• Colorado River Update• Review of Key components
• Basin Scale• On-River Scale• CAP Scale
• Initial Conditions Scenario Development Exercise• Recommendation(s) to ARC• Next Steps for MAWG
March 11, 202153

Call to the Public
Submit questions or comments using the electronic public comment form at cap-az.com/ARC.
March 11, 202154

For continued information and updates, visit
new.azwater.gov/ARC or cap-az.com/ARC
55