modeling, analysis and deployment of high pv penetration in a
TRANSCRIPT

Modeling, Analysis and Deployment of High PV Penetration in a Distribution System
School of Electrical, Computer and Energy Engineering
Arizona State University
Raja Ayyanar
PSERC Webinar
October 2, 2012
ASU Team
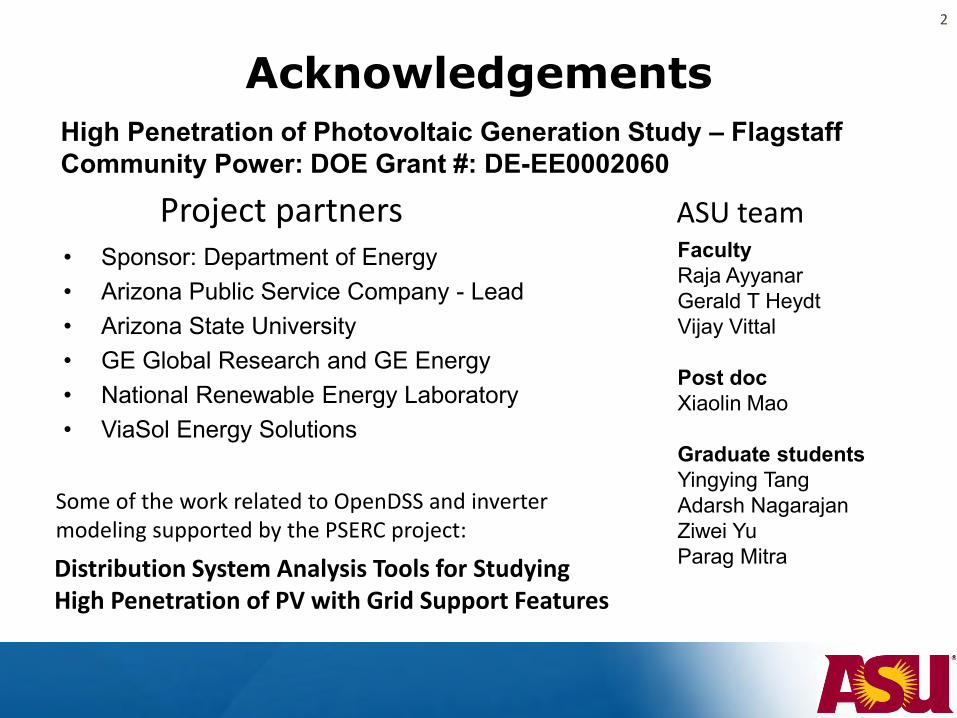
Faculty Raja Ayyanar Gerald T Heydt Vijay Vittal Post doc Xiaolin Mao Graduate students Yingying Tang Adarsh Nagarajan Ziwei Yu Parag Mitra
ASU team
• Sponsor: Department of Energy • Arizona Public Service Company - Lead • Arizona State University • GE Global Research and GE Energy • National Renewable Energy Laboratory • ViaSol Energy Solutions
Project partners
Acknowledgements
High Penetration of Photovoltaic Generation Study – Flagstaff Community Power: DOE Grant #: DE-EE0002060
2
Some of the work related to OpenDSS and inverter modeling supported by the PSERC project:
Distribution System Analysis Tools for Studying High Penetration of PV with Grid Support Features

3
This material is based upon work supported by the Department of Energy under Award Number(s) DE-EE0002060. This report was prepared as an account of work sponsored by an agency of the United States Government. Neither the United States Government nor any agency thereof, nor any of their employees, makes any warranty, express or implied, or assumes any legal liability or responsibility for the accuracy, completeness, or usefulness of any information, apparatus, product, or process disclosed, or represents that its use would not infringe privately owned rights. Reference herein to any specific commercial product, process, or service by trade name, trademark, manufacturer, or otherwise does not necessarily constitute or imply its endorsement, recommendation, or favoring by the United States Government or any agency thereof. The views and opinions of authors expressed herein do not necessarily state or reflect those of the United States Government or any agency thereof.
The methods, results and conclusions shown are preliminary and based on an ongoing project, and are subject to change as more data become available.

Outline
• Description of the high PV penetration deployment
• Development of feeder model using GIS and PV/AMI data
• Power flow analysis and preliminary results
• Protection coordination analysis
• Anti-islanding study methods
4

Outline
• Description of the high PV penetration deployment
• Development of feeder model using GIS and PV/AMI data
• Power flow analysis and preliminary results
• Protection coordination analysis
• Anti-islanding study methods
5

Feeder Information
6
• Located in Flagstaff, AZ • Radial feeder 9 miles long • Peak load: ~ 7 MW
(winter peaking) • Max. capacity: ~ 13 MW • Customers: ~ 3000 residential,
~ 300 commercial/industrial
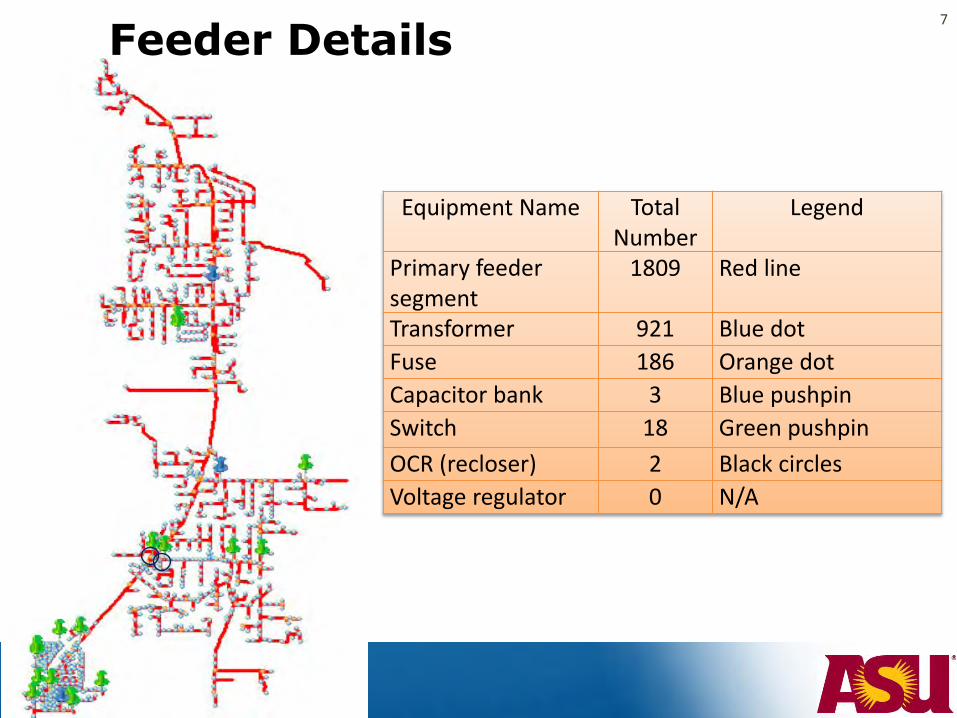
Feeder Details 7
Equipment Name Total Number
Legend
Primary feeder segment
1809 Red line
Transformer 921 Blue dot
Fuse 186 Orange dot
Capacitor bank 3 Blue pushpin
Switch 18 Green pushpin
OCR (recloser) 2 Black circles
Voltage regulator 0 N/A

8
PV Systems Deployed: Residential
• Residential - 470 kW
• 125 systems deployed, owned and operated by APS (additionally a few customer owned)
• 2 kW, 3 kW and 4 kW types
• Inverters from 3 different inverter manufacturers
• PV panels from 6 different manufacturers
• PV panel ratings from 185 W to 235 W with series connected strings ranging from 7 to 13 panels, and 1 to 2 strings in parallel
• Combination of various orientations (South, East facing etc.) and various tilt angles

PV Systems Deployed: Larger Systems 9
• 600 kW PV system with a 700 kVA GE smart inverter (project partner) at Doney Park renewable energy site
• A 333 kW (ground-mounted) and a 75 kW (roof-top) commercial PV system

GE Smart Inverter 10
• 3-phase, 480V, 700kVA Inverter • Grid support features
• Voltage regulation • Reactive power / power factor support • High/low/zero voltage ride-through
• Can help mitigate intermittency effects • Extensive communication and monitoring
features • Integrates into utility operations
and SCADA functions
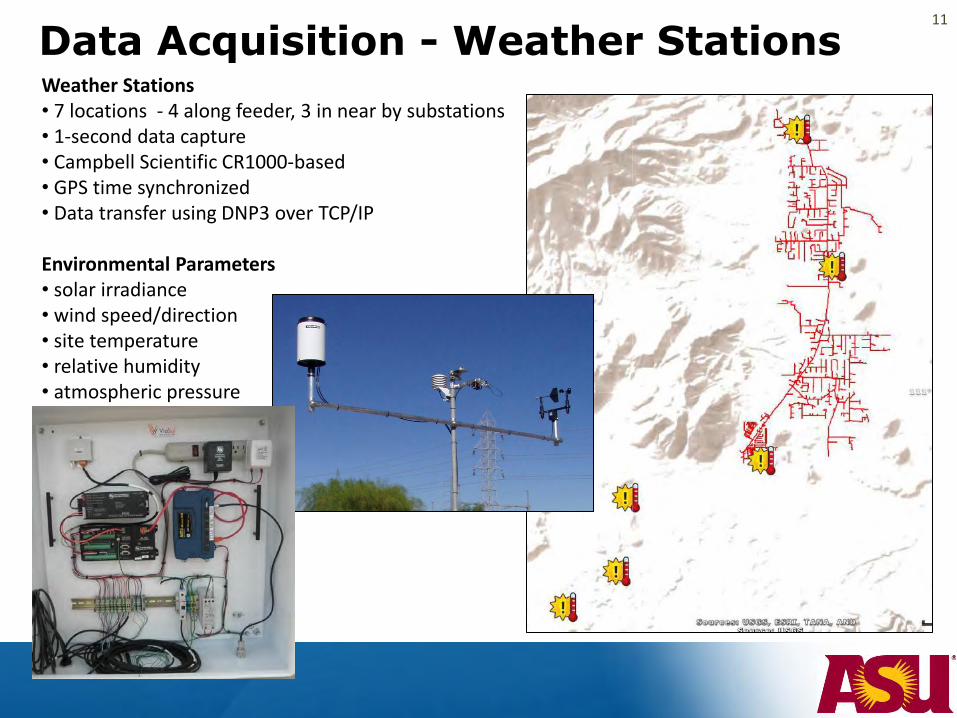
Data Acquisition - Weather Stations Weather Stations • 7 locations - 4 along feeder, 3 in near by substations • 1-second data capture • Campbell Scientific CR1000-based • GPS time synchronized • Data transfer using DNP3 over TCP/IP Environmental Parameters • solar irradiance • wind speed/direction • site temperature • relative humidity • atmospheric pressure • rain
11
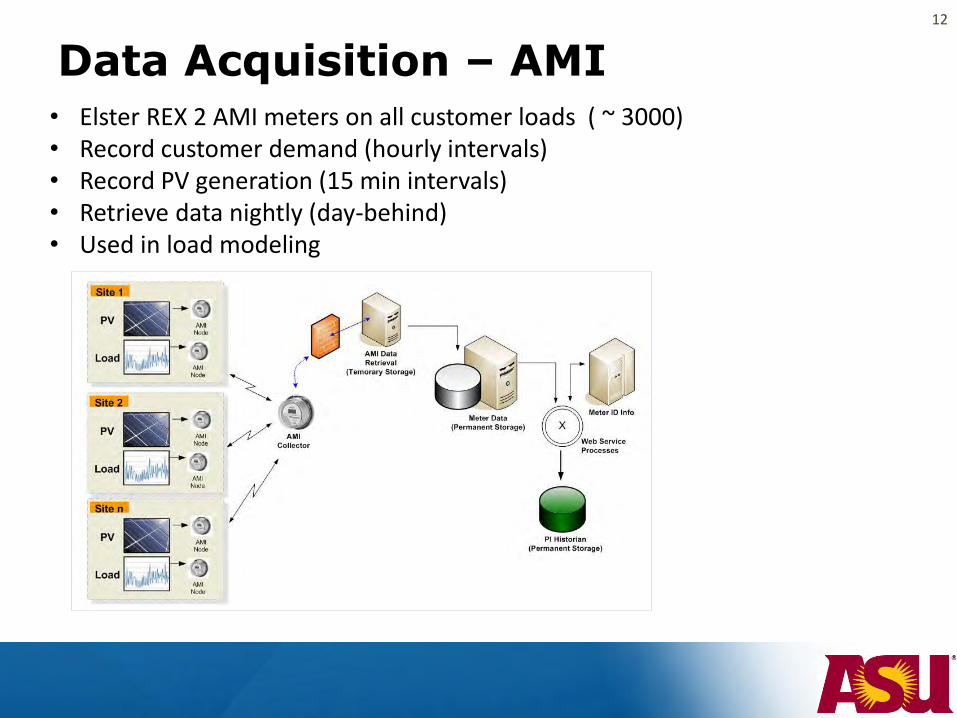
Data Acquisition – AMI • Elster REX 2 AMI meters on all customer loads ( ~ 3000) • Record customer demand (hourly intervals) • Record PV generation (15 min intervals) • Retrieve data nightly (day-behind) • Used in load modeling
12

Data Acquisition – PV systems
• SEL 734P PQ meters
• 1- sec data
• Retrieve data using APS SCADA (semi real-time)
• Parameters monitored
• V, I, kW, kWh, kVAr
• harmonics, PQ as needed
• All the 125 residential PV units have dedicated AMI meters for 15-min PV generation data
• Used in steady-state power flow analysis
• In addition, 17 residential PV systems have more elaborate DAS with
• The utility-scale inverters monitor > 100 internal/external parameters
13

High Bandwidth Feeder Data Acquisition
• 6 high bandwidth DAS along the feeder • SEL 735 PQ meters • High event sample rate • GPS synchronized • Event based data capture – e.g., change in
solar irradiance, faults, low voltage • Wireless cross-device triggering of all DAS
based on events or at set time • Data availability – real time • Parameters monitored (> 70)
– V, I, kW, kWh, kVAr, harmonics and other PQ parameters
• Used in steady-state and dynamic model validation and grid operations
Feeder DAS locations
14

Outline
• Description of the high PV penetration deployment
• Development of feeder model using GIS and PV/AMI data
• Power flow analysis and preliminary results
• Protection coordination analysis
• Anti-islanding study methods
15

Modeling Process Equipment Data
• Conductor and protection device parameters • Source impedance • Transformer parameters
CYMDIST Model
MATLAB
•Topology identification •Add equipment to network •Load mapping •Create import txt files
ArcCatalog
Mdb file
GIS Data • Line and equipment
locations and attributes
Load Data • AMI data
• Meter locations
PV data • 15 min and fine resolution data
Excel
•Initial calculation •Equipment mapping
PV/Inverter data • Manufacturer
• Ratings • Detailed params
Excel & MATLAB
• Data conditioning • Load mapping
Define Equip in CYMDIST
Load.txt
PV & Inverter Modeling
network.txt
Shape files
Power flow model
APS input data
Power Flow Analysis
Time-Series Load Flow Analysis (OpenDSS)
Protection Coordination Analysis
16

GIS Data—MDB File
Red roof house
17

18
Feeder Network Model Development (Auto conversion of GIS data to CYMDIST model using MATLAB)
18
Read Shape Files
Start
Topology Identification
Island Analysis
Write to TXT Files
End
Add Equipment (xfmr, load, fuse, switch, cap)
Associate Conductors with Sections
All Lines processed?
Initialize Node List as empty
Is the start point at any node in Node
List?
Record From Node for the Section
Get a Line, and create a Section for it
Y
N
Add start point to Node List
Is the end point at any node in Node List?
Record End Node for the Section
Y
N
Add end point to Node List
Return Y

Conductor Modeling
Primary: 39 line types – 25 overhead,14 underground Secondary: 28 line types – all underground cables
19
UG or OH
Primary Neutral
No.
of
cond
ucto
rs
per
GIS
Line type per GIS
APS conductor code R
elev
ant
Stan
dard
APS conductor code R
elev
ant
Stan
dard
Comment UG 1 1/0A Unknown 6215 Concentric Primary could be any of the varieties of UA 1/0
UG 2 1/0A Unknown 6215 Concentric Primary could be any of the varieties of UA 1/0
UG 3 1/0A Unknown 6215 Concentric Primary could be any of the varieties of UA 1/0
OH 1 2R Unknown 6251 Same as primary Primary could be R002V or R002W
… … … … … … … …
UG/ OH
Line type per GIS
APS conductor code
Relevant Standard Material Size Stranding
Dia (In.)
GMR (In.)
AC Res @25C
Ohm/mile
AC Res @50C
Ohm/mile UG 1/0A Unknown 6215 Al SOLID HD 0.325 0.139 0.8823 0.9699
OH 2R R002V 6251 ACSR 2 6\1 0.316 0.05016 1.41 1.69
OH 2R R002W 6251 ACSR 2 7\1 0.325 0.06048 1.41 1.65
OH 4R R004V 6251 ACSR 4 6\1 0.25 0.05244 2.24 2.57
… … … … … … … … … … …
Conductor types per GIS
Diameter, stranding, resistances, GMR values from APS standards, various handbooks and other standards
Conductor data
Typical framing methods used in Flagstaff modeled - ‘Clean’ construction - Cross arm construction
Positive and zero sequence impedances for all line types and susceptance for cables obtained directly in CYMDIST
19

20
Equipment Modeling in CYMDIST: Conductors
Conductor window in CYMDIST
Spacing or framing window
Overhead line impedances
Underground cable impedances
20

Protective Devices Modeling 21
Fuses o Fuses for protecting primary sides
– Types, ratings provided in GIS data
o Transformer fuses
– Types and ratings based on transformer rating and APS standard
o Street light fuses
– Ratings from APS standards
Reclosers ( One in main line and one in branch)
– Parameters are given by APS standard
Substation Relay – Parameters are given by APS standard
Protective device library is constructed in CYMDIST and CYMTCC
Screen shots of substation relay modeling in CYMDIST
Screen shots of recloser modeling in CYMDIST

Feeder Modeling Outcome 22
GIS Data
MATLAB Program
CYMDIST Model

Modeling of Meter Loads
AMI meter data with corresponding transformer ID and coordinates used MATLAB code to match meters to the nearest load points and summing up
meter data when multiple meters correspond to same load points kW data for almost all the loads available in 60 min or 15 min intervals, and are
directly input to CYMDIST
Power factor for all loads is presently assumed as 0.9; to be refined as DAS measurements become available in Phase 3 of the project
GIS Diagram
CYMDIST Diagram
23

Photovoltaic Generator Modeling
125 small residential PV systems (totaling 470 kW) and the 2 large PV systems (408 kW and 600 kW) are modeled as electronically coupled generators in CYMDIST
Automated process to associate PV with correct end points and create a PV section in CYMDIST
Active power set equal to the measured data for each of the 127 PV systems in each time interval
Fault current contribution presently set at 200% of the rated current – to be modified as we get data from manufacturers
Generator window in CYMDIST
24

Screenshot of PVs in CYMDIST Model
Part of CYMDIST model – Green circles are PVs
25
400 kW PV system

Outline
• Description of the high PV penetration deployment
• Development of feeder model using GIS and PV/AMI data
• Power flow analysis and preliminary results
• Protection coordination analysis
• Anti-islanding study methods
26

Power Flow Analysis with CYMDIST Model
AMI data from Jan 2012 to May 2012 and corresponding measured PV data are considered
Power flow results for the following two conditions with and without PV are shown
Highest load case – Jan 16, 6 PM
Highest PV penetration case - May 4, 1PM
Penetration at the substation corresponding to this feeder at a given time is defined as
Penetration levels at other locations within the feeder can be significantly higher – e.g., downstream of the main recloser, or near the two large PV systems, and at some transformers with multiple PVs the penetration can be higher than 100%
Voltage profile, kW and kVAR profile and loss estimate (no-load loss not considered)
Total measured PVoutputPenetration =
Measured feeder head load + Total measured PV output
27

28
Total Load: 5484 kW Total amount of PV: 3.3 kW Penetration: 0.06%
kW Profile at Highest Load (Jan 16, 6PM)
28

29
kVAR Profile at Highest Load (Jan 16, 6PM)

Voltage Profile at Highest Load Condition (Jan 16, 6 PM)
Total Loads: 5484 kW Total amount of PV: 3.336 kW Penetration: 0.06%
If morning peak load along with significant PV generation is considered the impact on voltage profile is significant
30

Voltage profile at highest load with reactive power support from two large PVs (90% of inverter rating) (Jan 16, 6 PM)
Doney Park
400 kVA PV
31
Two capacitor banks turned off automatically
• Reactive power from the two large inverters sufficient to maintain voltage without the two downstream capacitors

Doney Park
Without PV With PV
kW Losses
41.28 27.38
kW Profile at Highest Penetration (30.66%) (May 4, 1 PM)
No-load losses not included
32
Total Loads: 2937 kW Total amount of PV: 1299 kW Penetration: 30.66 %
400 kW PV

Total Loads: 2937 kW Total amount of PV: 1299 kW Penetration: 30.66 %
Voltage Profile at Highest Penetration (May 4, 1 PM)
33
• Significant improvements in both voltage magnitude and in phase unbalance

Reverse Power Flow in Recloser
Reactive power through recloser
Reactive power through recloser
Recloser at main line
Real power through recloser
Under high load /low PV condition
Real power through recloser
Under high PV penetration
34

Time-Series Analysis using OpenDSS
• High PV penetration feeder model also developed in OpenDSS
• OpenDSS is an open source distribution system analysis tool with several advanced features - especially time-series analysis
• Time series analysis helps to analyze the distribution system over a defined interval – a week, day or minutes for different study objectives such as impact of clouds, impact of PV on capacitor bank operation and impact on other control devices
• Time series analysis will also be used to validate the feeder model by comparison with feeder and residential DAS over long time intervals
35
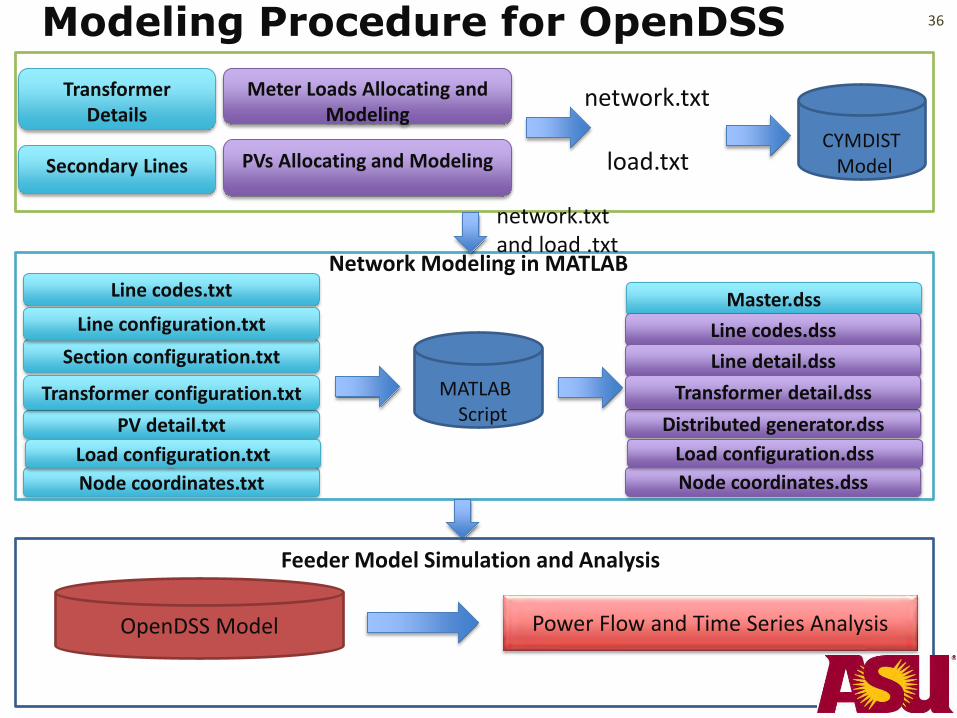
CYMDIST Model
Section configuration.txt
Node coordinates.txt
Network Modeling in MATLAB
OpenDSS Model
network.txt
load.txt
Power Flow and Time Series Analysis
Feeder Model Simulation and Analysis
36
Modeling Procedure for OpenDSS
network.txt and load .txt
Line codes.txt
Transformer Details
Secondary Lines
Meter Loads Allocating and Modeling
PVs Allocating and Modeling
PV detail.txt
Line configuration.txt
Transformer configuration.txt
Load configuration.txt
Master.dss
Node coordinates.dss
Line codes.dss
Distributed generator.dss
Line detail.dss
Transformer detail.dss
Load configuration.dss
MATLAB Script
36
0
100
200
300
400
500
600
700
800
1 2 3 4 5 6 7 8 9 10 11 12 13 14 15 16 17 18 19 20 21 22 23 24
kW
Hour
PA PB pc
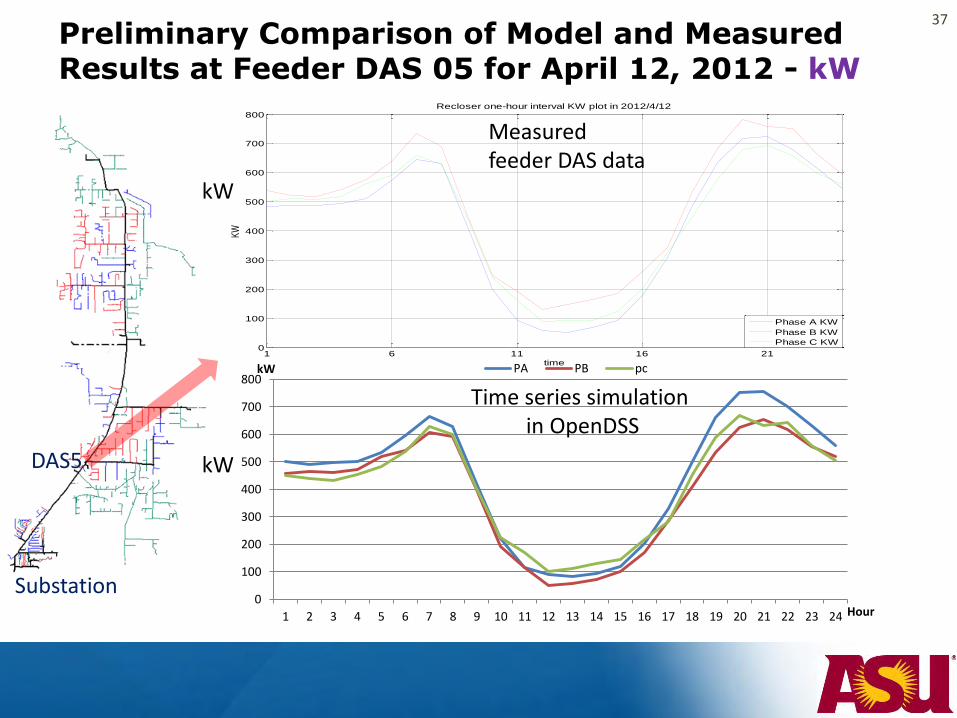
Preliminary Comparison of Model and Measured Results at Feeder DAS 05 for April 12, 2012 - kW
kW
kW
Time series simulation in OpenDSS
1 6 11 16 210
100
200
300
400
500
600
700
800
time
KW
Recloser one-hour interval KW plot in 2012/4/12
Phase A KW
Phase B KW
Phase C KW
Measured feeder DAS data
Substation
37
DAS5

Time Series Analysis (OpenDSS) of Power Flow at Substation with and without PV (April 12)
38
Pow
er (
kW)
0
500
1000
1500
1 2 3 4 5 6 7 8 9 10 11 12 13 14 15 16 17 18 19 20 21 22 23 24Hour
Phase A Power at phase A with PV impactsPower at phase A without PV impacts
0
500
1000
1500
1 2 3 4 5 6 7 8 9 10 11 12 13 14 15 16 17 18 19 20 21 22 23 24Hour
Phase B Power at phase B with PV impactsPower at phase B without PV impacts
0
500
1000
1500
1 2 3 4 5 6 7 8 9 10 11 12 13 14 15 16 17 18 19 20 21 22 23 24Hour
Phase C Power at phase C with PV impactsPower at phase C without PV impacts
Pow
er (
kW)
Pow
er (
kW)
38
Outline
• Description of the high PV penetration deployment
• Development of feeder model using GIS and PV/AMI data
• Power flow analysis and preliminary results
• Protection coordination analysis
• Anti-islanding study methods
39
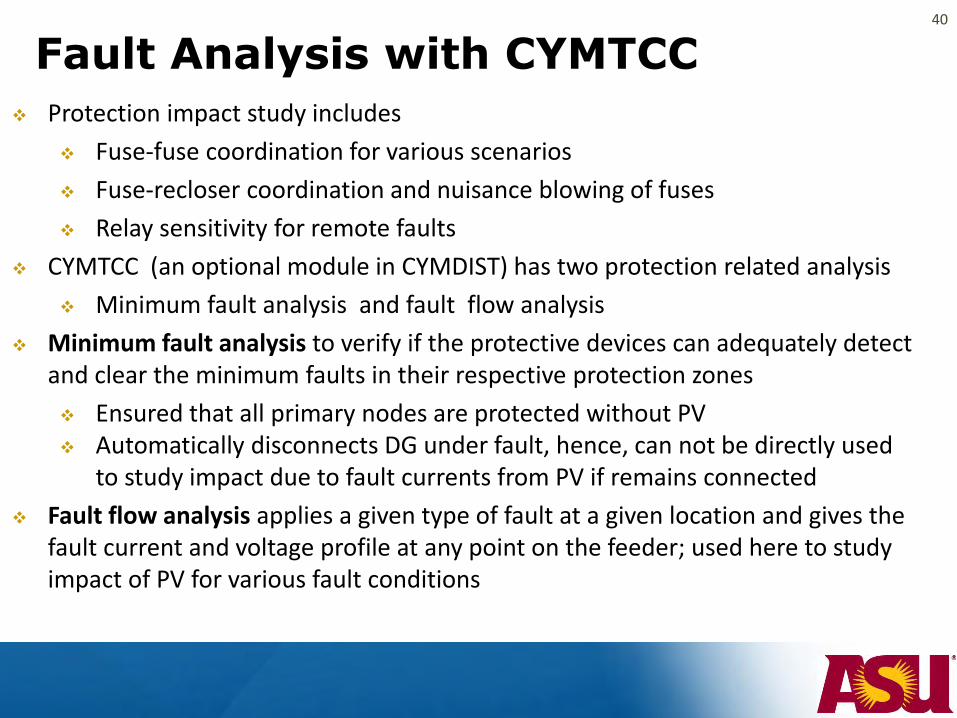
Fault Analysis with CYMTCC 40
Protection impact study includes
Fuse-fuse coordination for various scenarios
Fuse-recloser coordination and nuisance blowing of fuses
Relay sensitivity for remote faults
CYMTCC (an optional module in CYMDIST) has two protection related analysis
Minimum fault analysis and fault flow analysis
Minimum fault analysis to verify if the protective devices can adequately detect and clear the minimum faults in their respective protection zones
Ensured that all primary nodes are protected without PV Automatically disconnects DG under fault, hence, can not be directly used
to study impact due to fault currents from PV if remains connected
Fault flow analysis applies a given type of fault at a given location and gives the fault current and voltage profile at any point on the feeder; used here to study impact of PV for various fault conditions

Fault Flow Analysis • Voltage profile with a line to ground fault on
phase C in the middle of the feeder
41
fault

Fuse Coordination Study Situation 1: DG located upstream of fault
• When DG is upstream of two originally coordinated fuses as shown, fault currents flowing through fuses 1 and 2 increase due to DG contribution
• With increased currents in both fuses, fuse-fuse coordination is maintained; need to ensure the increased fault current does not exceed the ratings of the fuses
Fuse 1Fuse 2
Fault
DG
AC
• For the 600 kW Doney Park PV, Situation 1 is studied considering the two nearest coordinated fuses - upstream transformer fuse X04 and upstream fuse K65
Doney park PV generator
fault main feeder line
42

Impact of PV Penetration on Fuse Coordination
• L-G fault applied at the transformer primary, and fault currents at Fuse X04 and Fuse K65 with and without PV studied
• Fuse coordination is maintained and fault currents do not exceed the ratings of either fuse
Study: untitled.dat
0.01
0.1
1
10
100
1000
1 M
inu
te
0.5 1 10 100 1000 10000
Current in Amperes: x 1 at 12.47 kV and x 1.000 at 12.47 kV.
Tim
e in
Se
con
ds
25 kVAFLA=3.47 [A]
Transformer InRush25 kVAType:Circ leINRUSH=41.67 [A]Multiplier:12.00
1-Trans.1phZ=2.60 [%%]P=25 [kVA]12.47 [kV]
2-Fuse KEARNEY XRating: 4X [A]12.47 [kV]
3-Fuse KEARNEY KRating: 65K [A]12.47 [kV]
3-Fuse KEARNEY KRating: 65K [A]12.47 [kV]
4-Rec l. RXE,RVEGround tcc#1:151Pick Up:200.0 [A]
4-Rec l. RXE,RVEGround tcc#2:151Pick Up:200.0 [A]
4-Rec l. RXE,RVEGround tcc#1:151Pick Up:200.0 [A]
4-Rec l. RXE,RVEGround tcc#2:151Pick Up:200.0 [A]
8-Relay SCHWEITZER U3 SEL351Tap Range:[0.05 / 2.4] Tap:1Pick Up:720.00 [A] TD:1.5CT:600:5 at 12.47 [kV]Ins t. Option: ONInst. Pick Up: 10000.00 [A] Ins t. Delay: 0.01
8-Relay SCHWEITZER U3 SEL351Tap Range:[0.05 / 2.4] Tap:1Pick Up:720.00 [A] TD:1.5CT:600:5 at 12.47 [kV]Ins t. Option: ONInst. Pick Up: 10000.00 [A] Ins t. Delay: 0.01
9-Fault Current 927 A
10-Fault current 902 A
Without PV With PV
Fault
current
Operating
time
Fault
current
Operating
time
Fuse X04 902.09 A 0.0302 s 927.51 A 0.0291 s
Fuse K65 902.08 A 0.1596 s 927.51 A 0.1509 s
43

Impact of PV Penetration on Fuse Coordination
Situation 2: DG located downstream of fault
– For Fault 1, Fuse 2 is expected to operate faster than Fuse 1
– For Fault 2, Fuse 2 should not operate and Fuse 1 is expected to isolate the fault
– Whether or not Fuse 2 opens for Fault 2 depends on DG fault current contribution
Fuse 1Fuse 2
Fault 1
AC
DG
Fault 2
Downstream fault Upstream fault Fault
current
Operating
time
Fault
current
Operating
time
Fuse X04 55.45 A 6.99 s 1.11 A No
operation
Fuse K25 55.09 A No
operation
478.67 A 0.098 s
Since, fault current magnitude of roof top PV inverters is limited (~2 X rated current), downstream fuses do not clear for upstream faults
PV (4 kW)
Fault downstream
Fault upstream
Part of feeder with X04 downstream fuse on
transformer with PV, and two upstream fuses in the
lateral – K25 and T65
T65
K25
X04
44

Stiffness Ratio
_ max
fault
DG
IStiffness ratio
I
_ max
fault current available at interconnection
max. current from the inverter
fault
DG
I
I
• Stiffness ratio is a good measure of the potential for impact • Stiffness ratio in the Flagstaff feeder mostly above 50 and hence limited
impact due to PV • Generators with low stiffness ratios are studied more extensively
45
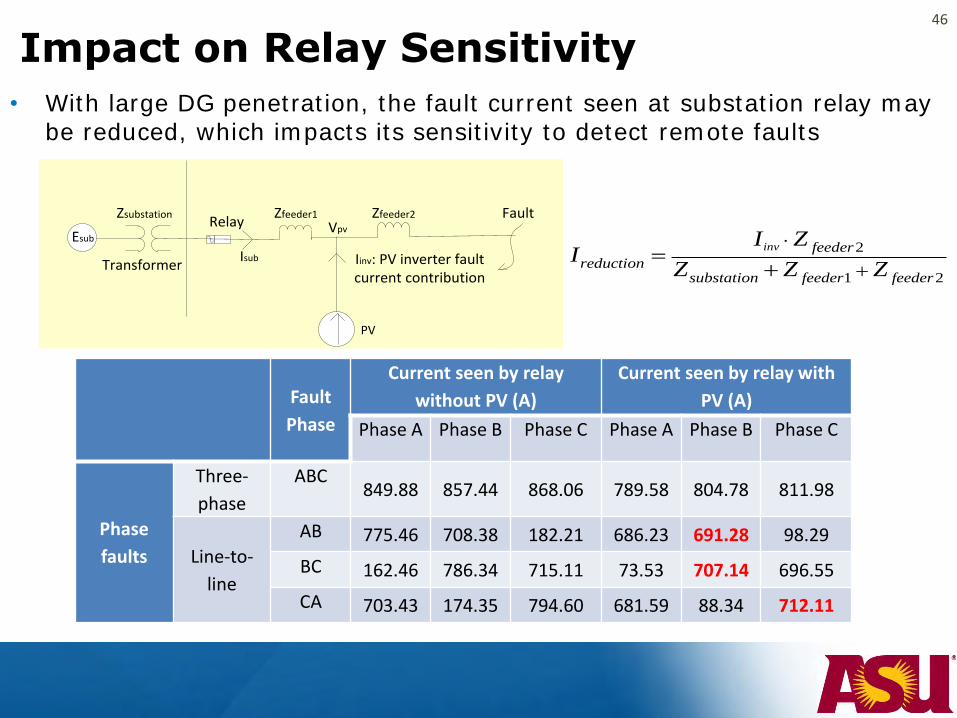
Impact on Relay Sensitivity
• With large DG penetration, the fault current seen at substation relay may be reduced, which impacts its sensitivity to detect remote faults
RelayEsub
Transformer
Isub
FaultZsubstation Zfeeder1 Zfeeder2
PV
Iinv: PV inverter fault current contribution
Vpv
2
1 2
inv feeder
reductionsubstation feeder feeder
I ZI
Z Z Z
Fault
Phase
Current seen by relay
without PV (A) Current seen by relay with
PV (A) Phase A Phase B Phase C Phase A Phase B Phase C
Phase
faults
Three-
phase
ABC 849.88 857.44 868.06 789.58 804.78 811.98
Line-to-
line
AB 775.46 708.38 182.21 686.23 691.28 98.29
BC 162.46 786.34 715.11 73.53 707.14 696.55
CA 703.43 174.35 794.60 681.59 88.34 712.11
46

Outline
• Description of the high PV penetration deployment
• Development of feeder model using GIS and PV/AMI data
• Power flow analysis and preliminary results
• Protection coordination analysis
• Anti-islanding study methods
47

Islanding Protection Study
Cromer
Doney park
Cap bank 2
Cap bank 3
Recloser
• When Recloser 1 opens possibility of both the larger PV systems forming an island and energizing the section downstream of the recloser under perfect load-DG match
• The two inverters are modeled in detail with relevant control loops and assumed parameters
• dq reference-frame-based control with active anti-islanding scheme employed
• positive feedback on frequency/voltage • Tested individually with worst case,
matching RLC load • Simplified model of feeder for islanding study
• Group loads downstream of recloser into three zones as shown
• Each combined load can be modeled as a combination of constant P-Q, constant impedance loads, or detailed model
• Obtain series line impedance from power flow, matching the resistive and reactive losses individually
48

SimPowerSystems Model of Simplified Feeder with Large PV Inverters
49

Preliminary Results from Islanding Study
With active island detection disabled, inverters remain on with slightly lower voltage; small changes in load can lead to island detection
With active island detection enabled both inverters detect island and turn off in 0.2 s
Time (s) Time (s)
Thre
e p
has
e vo
ltag
es
at in
vert
er t
erm
inal
(
V)
Syst
em f
req
uen
cy
(Hz)
Recloser opens Recloser opens
50
• Actual AI methods and control parameters for inverters in field needed • Single phase inverter models with anti-islanding also developed

Future Work
• Phase 3:
– Extensive validation with field DAS
– Quasi-steady-state and dynamic models
– Grid support features of utility-scale inverters
• Phase 4:
– Energy storage study and demonstration
– Study on microgrids and other advanced features
• Phase 5:
– Extension to larger distribution systems
– Recommendations for high penetration design
51

Summary
• Large scale PV implemented in a feeder leading to higher than 30% peak penetration at feeder head, and higher levels at some other locations
• Extensive data acquisition systems
• Extensive modeling and impact analysis using GIS, AMI and installed feeder/residential DAS
• Modeling process established and software tools developed that can be adapted for evolving needs
• Preliminary modeling results show improved voltage profile along feeder, and low impact on protection coordination at present levels of penetration
52