modeling a superposition of renewal processes by a mmpp
TRANSCRIPT

Modeling a superposition of renewal processes by a MMPP
Adeyemo Adesegun Adetayo
Master Thesis Computer Engineering
2006 Nr: E3383D

Name: Adeyemo Adesegun Adetayo Registration Number: E3383D 2
Högskolan Dalarna Tel.: 023 778 000 Röda vägen 3, 781 88 Fax: 023 778 050 Borlänge URL: http://www2.du.se
DEGREE PROJECT
In Computer Engineering
Programme Reg. number Extent International Masters in Computer Engineering E 3383 D 30 ECTS Name of student Year-Month-Day Adeyemo Adesegun Adetayo 2006-06-07 Supervisor Examiner Dr. Ernst Nordström
Prof. Mark Dougherty Company/Department Supervisor at the Company/Department Department of Culture, Media and Computer Science, Dalarna University, Sweden.
Dr. Ernst Nordström
Title Modeling a Superposition of renewal processes by a MMPP
Keywords Superposition, MMPP, Quality of Service, Grade of Service, Mean waiting time, Asymptotic, Queuing networks, Markov chain, Switching
Abstract
This project models a superposition of renewal arrival process. This modeling issue arises in the design of call admission control (CAC) and routing function in telecommunication networks. Several models have proposed different processes to model link traffic. This thesis presents two models based on the Markov Modulated Poisson Process, which is a doubly stochatistic Poisson process where the rate process is determined by the state of continuous-time Markov chain. The Models used the Gusella and Lucantoni approaches to model a superposition of renewal arrival process. We compare the exact superposition with the Lucantoni and Gusella models. This was achieved by defining and estimating the index of dispersion for counts for the two models from the exact superposition (real traffic). Furthermore, four parameters of the MMPP (λ1, λ2, r1, r2) were chosen so that the characteristics of the superposition are matched. The MMPP traffic models (Lucantoni and Gusella) were implemented in an existing simulator and the parameters gotten from the exact superposition were fed into the MMPP models. The mean waiting time and the probability of delay (in percentage) for each model was plotted as graphs and compared. This was achievable by varying some parameters like the number of classes and lambda. The sensitivity of each model to the varying parameter was evaluated. Comparison between the exact superposition, Lucantoni model and Gusella method shows that while the Gusella’s output tends towards the exact superposition, The Lucantoni model offers a lower mean waiting time and Probability of delay for the same number of classes and lambda value than the Exact Superposition and Gusella model.

Name: Adeyemo Adesegun Adetayo Registration Number: E3383D 3
Högskolan Dalarna Tel.: 023 778 000 Röda vägen 3, 781 88 Fax: 023 778 050 Borlänge URL: http://www2.du.se
TABLE OF CONTENTS
1.0 Introduction 6
1.1 Background 6 1.3 Objectives 6 1.4 Limitations 7 1.5 Work Method 7 1.6 Questions for Investigation 8 1.7 Disposition 9 2.0 Problem Formulation 9
3.0 System Overview 10
3.1 Multiservice Network 10 3.1.1 Circuit Switching 10 3.1.2 Packet Switching 12 3.1.3 Virtual Circuit Switching 13 3.2 Resource Allocation at Setup 16 3.2.1 Call Admission Control 16 3.2.2 Routing 17 3.3 Queuing Systems Under Evaluation 18 3.3.1 Classification 18 3.3.2 G/M/1 Queuing System 20 4.0 Modeling the Superposition of Renewal Arrival Process 21
4.1 Literature Overview 21 4.2 Modeling of Data and Voice Traffic 27 4.3 The Gusella MMPP Approach 28 4.4 The Lucantoni MMPP Approach 33 4.4.1 The Model 33 4.4.1.1 Statistical Properties of Packetized voice Process 34 4.3.1.2 Approximating the Superposition of Packetized Voice and Data Streams 34 5.0 Numerical Results 39
5.1 Considered superposition modelling methods 39 5.2 Examples and results 39 5.3 Result analysis 55 6.0 Conclusion 57
7.0 References 59

Name: Adeyemo Adesegun Adetayo Registration Number: E3383D 4
Högskolan Dalarna Tel.: 023 778 000 Röda vägen 3, 781 88 Fax: 023 778 050 Borlänge URL: http://www2.du.se
DEDICATION
This thesis is dedicated to God and my late parents: Adeyemo ‘Dele Adeniran & Adeyemo
Grace Abosede.
To my mother: “You were cut short in your prime by death, not allowing your little baby to
know you. I wish you were here to witness this day. I love you”.
To my father: “Thanks for giving me the best legacy in life (education). It was not easy
bringing us up alone but i want to say a big THANK YOU even in death. I
love you”.
God: “What would i have been today without you, knowing all that i went through
as i child. You have always been there for me. Thank you for making me see
the end of this program”.

Name: Adeyemo Adesegun Adetayo Registration Number: E3383D 5
Högskolan Dalarna Tel.: 023 778 000 Röda vägen 3, 781 88 Fax: 023 778 050 Borlänge URL: http://www2.du.se
ACKNOWLEDGEMENTS
I would like to express my profound and heart-felt gratitude to my supervisor, Dr. Ernst
Nordstöm, for sparing a great deal of his valuable time, for making me work hard and taking
his time to explain a lot of things to me in order to complete this project early enough.
Also, my gratitude goes to Prof. Mark Dougherty for his invaluable advice and
encouragement in publishing my first paper. I would also say a big thank you to Hassan
Fleyeh for his fatherly role while i was studying.
Many thanks to my course coordinator, Pascal Rebreyend, Syril Yella and other lecturers in
the departments of Computer and Electrical Engineering in Dalarna University and STADIA
Helsinki Polythechnic. Thanks for your support. You have given me what it takes to make a
difference.
My sincere gratitude goes to my loving sister, Nike and brothers, Deji and Stephen for their
invaluable support financially and spiritually. I am so grateful.
My deepest thanks my friends, Olayiwola, Rotimi, Ayo, Dolapo, Lara, Sunday, Jumoke, Kola
(P.A), Wole (Governor), Layo, and others too numerous to mention. You never made me feel
home-sick. Thanks for being a friend.
To my friend, soulmate, confidant and love Oluwatoyin, thank you for your love, prayers and
understanding while my studies lasted.

Name: Adeyemo Adesegun Adetayo Registration Number: E3383D 6
Högskolan Dalarna Tel.: 023 778 000 Röda vägen 3, 781 88 Fax: 023 778 050 Borlänge URL: http://www2.du.se
1.0 INTRODUCTION
In this project the task is to model a superposition of renewal processes. This modeling issue
arises in design of the call admission control (CAC) and routing function in
Telecommunication networks. Specifically, the stream of call requests offered to an
individual link is modeled by superposition of renewal processes. The superposition is a result
of splitting and merging of component arrival processes. First, the arrival process to each
origin-destination node pair is splitted over many alternative paths. Second, at each link the
per-path arrival processes are merged to form a superposed arrival process to the link. The
project uses existing traffic model to achieve the superposition arrival process. The resulting
traffic model will be used in MDP (Markov Decision Problem)-based call admission control
and routing.
1.1 BACKGROUND
This is a Master thesis work done in partial fulfilment of the requirements for the award of
International Master of Science in Computer Engineering degree, Högskolan Dalarna
(Dalarna University), Sweden. The project was carried out under the teletraffic research
program and is supported by Department of Culture, Media and Computer Science, Dalarna
University, Sweden.
1.2 OBJECTIVES
This thesis work is part of the ongoing research on resource management in multi-service
network at the University of Dalarna in Sweden. The project deals with mathematically
modelling and simulation of resource management in a multi-service communication
network.

Name: Adeyemo Adesegun Adetayo Registration Number: E3383D 7
Högskolan Dalarna Tel.: 023 778 000 Röda vägen 3, 781 88 Fax: 023 778 050 Borlänge URL: http://www2.du.se
The main objective in this thesis work is to model a superposition of renewal processes using
the Markov Modulated Poisson Process (MMPP). We use the Lucantoni and Gusella
approaches in building the model. We do this by matching the model with real superposition;
simulating MMPP models for the three approaches, simulating a real superposition, simulate
an earlier project simulator on simple renewal process and finally comparing the results of all
the approaches. This will help us evaluate the performance of a single server queue offered
MMPP traffic or a simple renewal. Also, it will help us to compare the versatility of the three
models numerically.
1.3 LIMITATIONS
The limitations encountered in the course of implementing this project is the incomplete
definition of some parameters in the model. In the Gusella and Lucantoni approaches, some
parameters were not defined explicitly. This made the completion of the project work
delayed.
1.4 WORK METHOD
The project was started by preparing a project plan in which various tasks leading to the
completion of the project and a deadline was set. Several related papers, journal and articles
related to the research were studied in order to have a sufficient background and
understanding of the project. Weekly meetings were scheduled in order to have
communication between my supervisor and me. In the meetings, the progress of the project
work was discusses while problem encountered were solved as the project was progressing.
This continued till the completion of the project.

Name: Adeyemo Adesegun Adetayo Registration Number: E3383D 8
Högskolan Dalarna Tel.: 023 778 000 Röda vägen 3, 781 88 Fax: 023 778 050 Borlänge URL: http://www2.du.se
The steps involved in carrying out this work includes but not limited to the following:
• Problem definition.
• Solution design: The project is implemented in a previously built simulator.
• Implementation: This is carried out in the following order;
� Setup/Initialization of MMPP model parameters (λ1,λ2,r1,r2)
� Simulation of MMPP process.
� MMPP measurement using the Lucantoni approach.
� MMPP measurement using the Gusella approach.
� Real traffic measurement
� Previously built traffic simulator measurement.
� Comparison of the different approaches using statistical tools such as graphs
and chart.
• Validation: Achieved by comparing output of different approaches with the exact
theoretical superposition.
1.5 QUESTIONS FOR INVESTIGATION
This project compares numerically between three methods: Exact superposition method
Gusella’s method, and the Lucantoni’s method. The comparison is to check the accuracy of
the Lucantoni and Gusella models against the exact superposition.
Name: Adeyemo Adesegun Adetayo Registration Number: E3383D 9
Högskolan Dalarna Tel.: 023 778 000 Röda vägen 3, 781 88 Fax: 023 778 050 Borlänge URL: http://www2.du.se
1.6 DISPOSITION
This project is organized into four major parts. In chapter two, the problem formulation is
explained. This discusses the source of idea behind the project work. Discusses the kind of
problems that are encountered in a multiservice network, the need for solving the problem and
methods by which it can be done. Chapter three gives an overview of a multiservice network.
This is achieved by describing the circuit switching, packet switching and virtual circuit
switching as examples of a multiservice network. Similarly, different methods of resource
allocation at setup were evaluated and advantages of a method over the other were discussed.
Also, queuing system was described and the G/M/1 system was described as an example of a
queue. Chapter four discusses in-depth the Gusella and Lucantoni models, describing the
statistical properties of Packetized voice process. Similarly, chapter four presents a technique
for approximating the superposition of Packetized voice and data streams. Chapter five
presents the results and analysis of simulations. Chapter six discusses the conclusions and
gives recommendation for future work.
2.0 PROBLEM FORMULATION
In this project the task is to model a superposition of renewal processes. This modeling issue
arises in design of the call admission control (CAC) and routing function in
telecommunication networks. Specifically, the stream of call requests offered to an individual
link is modeled by superposition of renewal (Weibull) processes. The superposition is a result
of splitting and merging of component arrival processes. First, the arrival process to each

Name: Adeyemo Adesegun Adetayo Registration Number: E3383D 10
Högskolan Dalarna Tel.: 023 778 000 Röda vägen 3, 781 88 Fax: 023 778 050 Borlänge URL: http://www2.du.se
origin-destination node pair is splitted over many alternative paths. Second, at each link the
per-path arrival processes are merged to form a superposed arrival process to the link.
We model the stream of call requests to each origin-destination node pair of the network as a
general renewal process with Weibull distributed interarrival times. This choice of our traffic
model is supported by recent measurements of TCP connection arrivals in the Internet. The
problem was motivated by the desire to analytically evaluate the performance of an integrated
voice/data network; the models developed were versatile in performance and applicable.
3.0 SYSTEM OVERVIEW
The reason for our interest in traffic modeling is because of application in call admission
control for voice transmission and routing of packets from its source to destination.
3.1 MULTISERVICE NETWORK
Multiservice networks provide more than one distinct communications service type over the
same physical infrastructure. Multiservice does not only imply the existence of multiple
traffic types within the network, but also the ability of a single network to support all of these
applications without compromising the Quality of Service (QoS) for any of them. A
multiservice network is divided into three, namely: circuit switching, packet switching and
virtual circuit switching.
3.1.1 CIRCUIT SWITCHING
A circuit switched network is one where a dedicated connection (circuit or channel or path)
must be set up between two nodes before they may communicate. For the duration of the

Name: Adeyemo Adesegun Adetayo Registration Number: E3383D 11
Högskolan Dalarna Tel.: 023 778 000 Röda vägen 3, 781 88 Fax: 023 778 050 Borlänge URL: http://www2.du.se
communication, that connection may only be used by the same two nodes, and when the
communication has ceased, the connection must be explicitly cancelled. Based on its
architecture, circuit switching is used for voice phone service which is a real-time event.
In telecommunications, the circuit switching has the following meanings:
1. A method of routing traffic between an originator and a destination through switching
centres, from local users or from other switching centres, whereby a continuous
electrical circuit is established and maintained between the calling and the called
station until is released by one of those stations. A method of establishing the
connection and monitoring its progress and availability may utilize a separate control
channel as in the case of ISDN or not as in the case of Public Switched Telephone
Network (PSTN).
2. A process that on demand connects two or more data terminal equipments (DTEs) and
permits the exclusive use of a data circuit between them until the connection is
released.
Fig 3.1 Circuit Switching: The two different bit streams flow on two separate circuits [12].
Name: Adeyemo Adesegun Adetayo Registration Number: E3383D 12
Högskolan Dalarna Tel.: 023 778 000 Röda vägen 3, 781 88 Fax: 023 778 050 Borlänge URL: http://www2.du.se
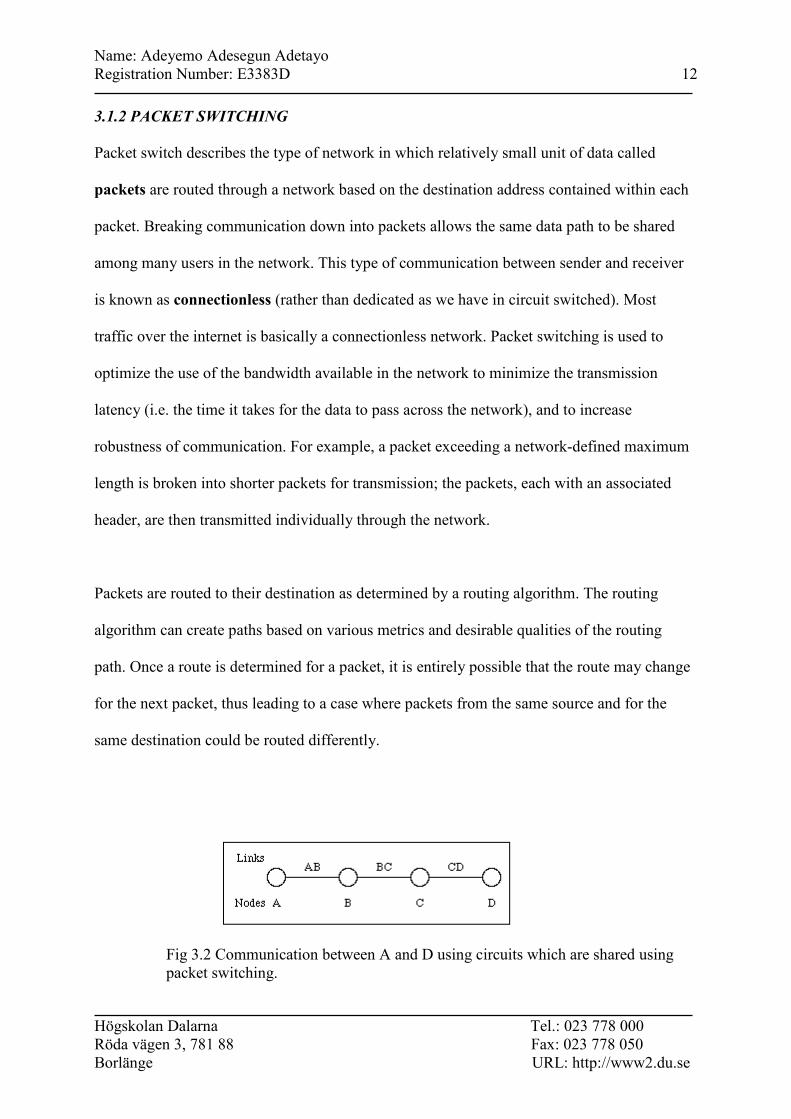
3.1.2 PACKET SWITCHING
Packet switch describes the type of network in which relatively small unit of data called
packets are routed through a network based on the destination address contained within each
packet. Breaking communication down into packets allows the same data path to be shared
among many users in the network. This type of communication between sender and receiver
is known as connectionless (rather than dedicated as we have in circuit switched). Most
traffic over the internet is basically a connectionless network. Packet switching is used to
optimize the use of the bandwidth available in the network to minimize the transmission
latency (i.e. the time it takes for the data to pass across the network), and to increase
robustness of communication. For example, a packet exceeding a network-defined maximum
length is broken into shorter packets for transmission; the packets, each with an associated
header, are then transmitted individually through the network.
Packets are routed to their destination as determined by a routing algorithm. The routing
algorithm can create paths based on various metrics and desirable qualities of the routing
path. Once a route is determined for a packet, it is entirely possible that the route may change
for the next packet, thus leading to a case where packets from the same source and for the
same destination could be routed differently.
Fig 3.2 Communication between A and D using circuits which are shared using packet switching.

Name: Adeyemo Adesegun Adetayo Registration Number: E3383D 13
Högskolan Dalarna Tel.: 023 778 000 Röda vägen 3, 781 88 Fax: 023 778 050 Borlänge URL: http://www2.du.se
Fig 3.3 Packet-switched communication between systems A and D. 3.1.3 VIRTUAL CIRCUIT SWITCHING
Virtual Circuit Switched connection is a dedicated logical connection that allows sharing of
physical path among multiple virtual circuit connections. A virtual circuit connection is
created and released dynamically and remains in use only as long as data is being transferred.
It is similar to a telephone call. Example of a system that makes use of virtual circuit
switching is the ATM (Asynchronous Transfer Mode) which is a standard for cell relay where
information for multiple service types such as voice, video or data is conveyed in small,
fixed-size cells. ATM networks are connection-oriented, which means that a virtual channel
(VC) must be set up across the ATM network prior to any data transfer (a virtual channel is
equivalent to a virtual circuit).

Name: Adeyemo Adesegun Adetayo Registration Number: E3383D 14
Högskolan Dalarna Tel.: 023 778 000 Röda vägen 3, 781 88 Fax: 023 778 050 Borlänge URL: http://www2.du.se
The advantages of virtual circuit switching include connection flexibility and call setup that
can be handled automatically by a networking device. Its disadvantages include the extra time
and overhead required to setup connection.
Fig 3.4 A Private ATM Network and a Public ATM Network Both Can Carry Voice, Video,
and Data Traffic [13].
Name: Adeyemo Adesegun Adetayo Registration Number: E3383D 15
Högskolan Dalarna Tel.: 023 778 000 Röda vägen 3, 781 88 Fax: 023 778 050 Borlänge URL: http://www2.du.se
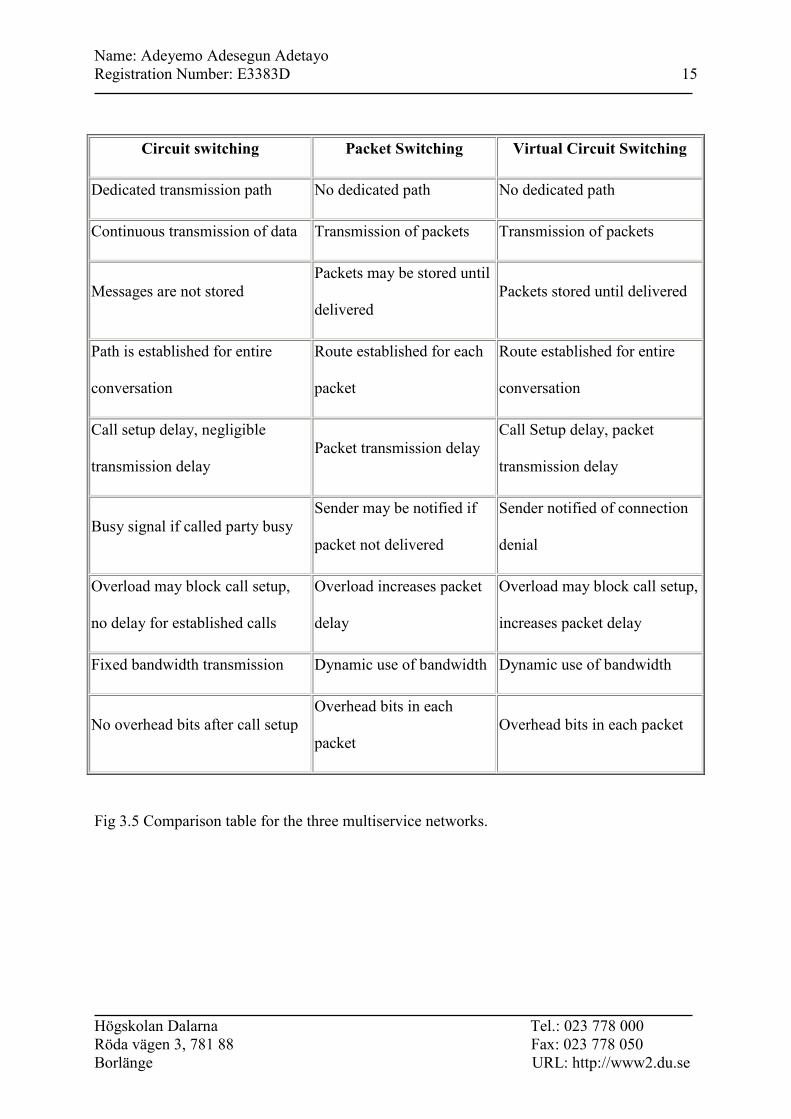
Circuit switching Packet Switching Virtual Circuit Switching
Dedicated transmission path No dedicated path No dedicated path
Continuous transmission of data Transmission of packets Transmission of packets
Messages are not stored Packets may be stored until
delivered Packets stored until delivered
Path is established for entire
conversation
Route established for each
packet
Route established for entire
conversation
Call setup delay, negligible
transmission delay Packet transmission delay
Call Setup delay, packet
transmission delay
Busy signal if called party busy Sender may be notified if
packet not delivered
Sender notified of connection
denial
Overload may block call setup,
no delay for established calls
Overload increases packet
delay
Overload may block call setup,
increases packet delay
Fixed bandwidth transmission Dynamic use of bandwidth Dynamic use of bandwidth
No overhead bits after call setup Overhead bits in each
packet Overhead bits in each packet
Fig 3.5 Comparison table for the three multiservice networks.
Name: Adeyemo Adesegun Adetayo Registration Number: E3383D 16
Högskolan Dalarna Tel.: 023 778 000 Röda vägen 3, 781 88 Fax: 023 778 050 Borlänge URL: http://www2.du.se
3.2 RESOURCE ALLOCATION AT SETUP
Resource allocation in a communication network entails reservation of resources. It deals with
the allocation of bandwidth, routing and call admission control. The essence of resource
allocation in a multiservice network is to maintain a level of quality of service regardless of
types of calls or data.
3.2.1 CALL ADMISSION CONTROL
Call Admission Control (CAC) is used to prevent congestion control in Voice Traffic. It is a
preventive Congestion Control Procedure. It is used in the Call Setup phase. The purpose of
CAC is to decide, at the time of call arrival, whether or not a new call should be admitted into
the network. A new call is admitted if and only if its Quality of Service (QoS) constraints can
be satisfied without jeopardizing the QoS constraints of existing calls in a network. Call
Admission Control prevents oversubscription of voice networks. CAC is a concept that
applies only to voice traffic and not to data traffic. CAC can be used to prevent congestion in
connection-oriented protocols such as ATM. It can also be used in VoIP (Voice over Internet
Protocol) in order to ensure QoS, and prevent loss of packets. The difference between the
former and the latter, however, is that VoIP uses RTP/UDP/IP (Real-time Transport
Protocol/User Datagram Protocol/Internet Protocol), all of which are connectionless
protocols. In this case, Integrated Services with RSVP (reserve resources for flow of packets
through the network) using Controlled-Load Service is used in order to ensure that the call
cannot be setup if it is not possible to support the flow described.

Name: Adeyemo Adesegun Adetayo Registration Number: E3383D 17
Högskolan Dalarna Tel.: 023 778 000 Röda vägen 3, 781 88 Fax: 023 778 050 Borlänge URL: http://www2.du.se
3.2.2 ROUTING
Routing is the movement of information across an internetwork from a source to a
destination. This involves selecting paths in a computer network along which to send data.
Along the way, at least one intermediate node typically is encountered. Routing involves two
basic activities: determining optimal routing paths and transporting information groups
(packets) through an internetwork. In the context of the routing process, the latter of these is
referred to as packet switching. Although packet switching is relatively straightforward, path
determination can be very complex. The routing process usually directs forwarding on the
basis of routing table within the routers, which maintain a record of the best routes to various
network destinations. Suffice to this; the construction of routing tables becomes very
important for efficient routing. Small networks may involve hand-configured routing tables.
Large networks involve complex topologies and may change constantly, making the manual
construction of routing tables very problematic. Dynamic routing attempts to solve this
problem by constructing routing tables automatically, based on information carried by routing
protocols, and allowing the network to act nearly autonomously in avoiding network failures
and blockages.
Packet Switched networks, such as the internet, split data up into packets, each labeled with
the complete destination address and each routed individually. Circuit switched networks,
such as the voice telephone network; also perform routing, in order to find paths for circuits.

Name: Adeyemo Adesegun Adetayo Registration Number: E3383D 18
Högskolan Dalarna Tel.: 023 778 000 Röda vägen 3, 781 88 Fax: 023 778 050 Borlänge URL: http://www2.du.se
3.3 QUEUING SYSTEMS UNDER EVALUATION
3.3.1 CLASSIFICATIONS
The standard notations used for classifying queuing systems were proposed by D.G. Kendall
in 1953. This however exists in several modifications. The most comprehensive classification
uses 6 symbols:
A/B/C/q/K/p
Where
• A is the interarrival time distribution,
• B is the service time distribution,
• C is the number of servers,
• q is the queuing discipline (FCFS, LCFS, SIRO.....),
• K is the system capacity (number of customers in service + in queue),
• p is the population size (numbers of possible customers). This is always omitted for
open system where the number of possible customers is not known.
The following symbols are used for arrival and service distributions:
• M is the exponential distribution associated with the Poisson/Markov process,
• Ek is the Erlang distribution with parameter k,
• Hk is the Hyper-exponential distribution with parameter k,
• D is the deterministic distribution,
• G is the general (any) distribution,
• GI is the general (any) distribution with independent random values
Name: Adeyemo Adesegun Adetayo Registration Number: E3383D 19
Högskolan Dalarna Tel.: 023 778 000 Röda vägen 3, 781 88 Fax: 023 778 050 Borlänge URL: http://www2.du.se
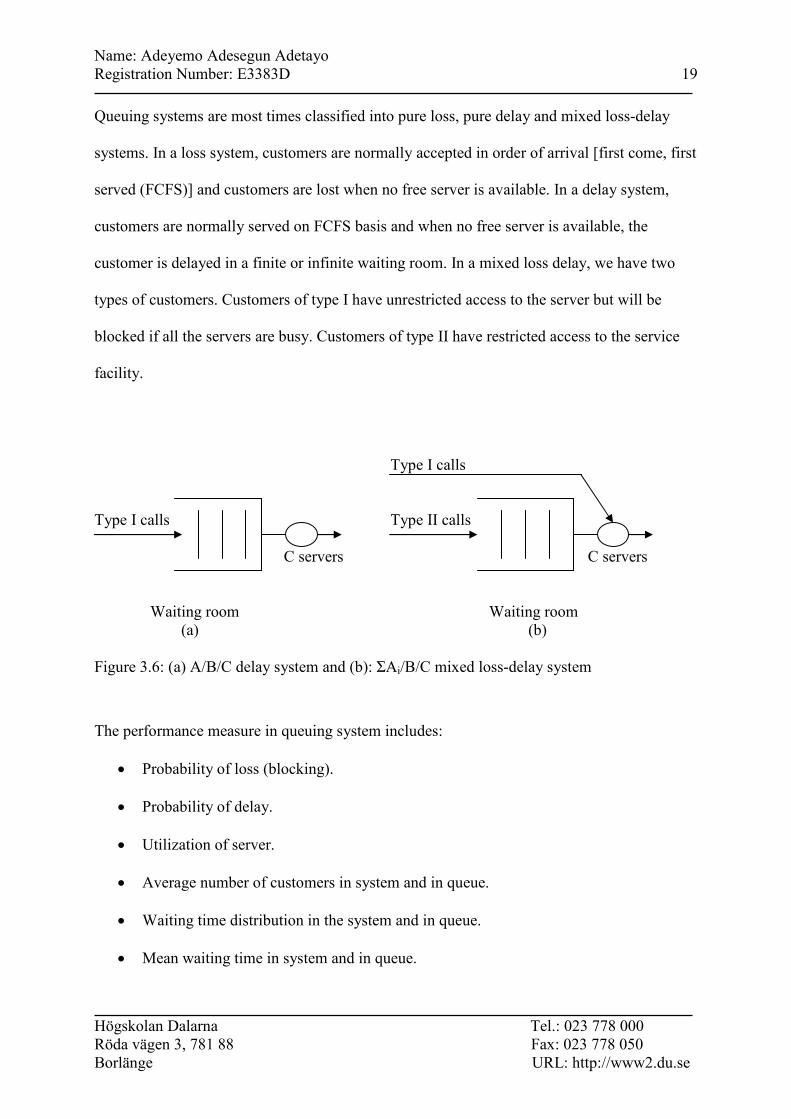
Queuing systems are most times classified into pure loss, pure delay and mixed loss-delay
systems. In a loss system, customers are normally accepted in order of arrival [first come, first
served (FCFS)] and customers are lost when no free server is available. In a delay system,
customers are normally served on FCFS basis and when no free server is available, the
customer is delayed in a finite or infinite waiting room. In a mixed loss delay, we have two
types of customers. Customers of type I have unrestricted access to the server but will be
blocked if all the servers are busy. Customers of type II have restricted access to the service
facility.
Type I calls Type I calls Type II calls C servers C servers Waiting room Waiting room
(a) (b) Figure 3.6: (a) A/B/C delay system and (b): ΣAi/B/C mixed loss-delay system
The performance measure in queuing system includes:
• Probability of loss (blocking).
• Probability of delay.
• Utilization of server.
• Average number of customers in system and in queue.
• Waiting time distribution in the system and in queue.
• Mean waiting time in system and in queue.
Name: Adeyemo Adesegun Adetayo Registration Number: E3383D 20
Högskolan Dalarna Tel.: 023 778 000 Röda vägen 3, 781 88 Fax: 023 778 050 Borlänge URL: http://www2.du.se
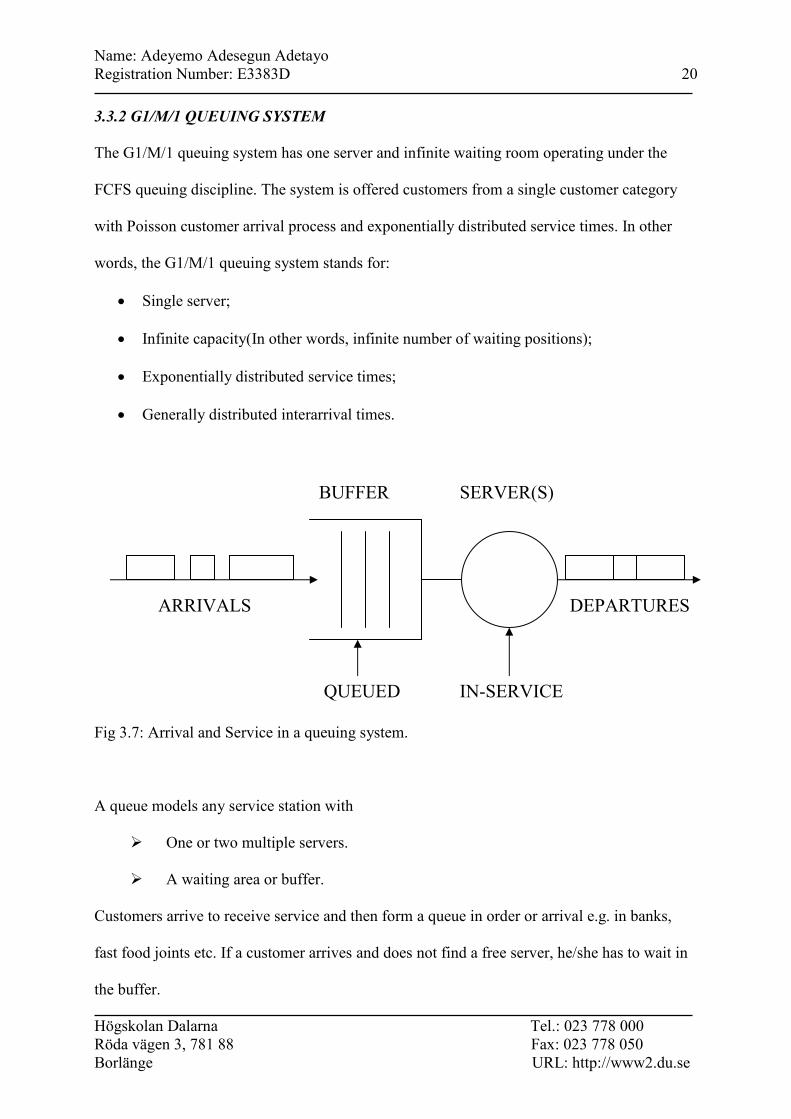
3.3.2 G1/M/1 QUEUING SYSTEM
The G1/M/1 queuing system has one server and infinite waiting room operating under the
FCFS queuing discipline. The system is offered customers from a single customer category
with Poisson customer arrival process and exponentially distributed service times. In other
words, the G1/M/1 queuing system stands for:
• Single server;
• Infinite capacity(In other words, infinite number of waiting positions);
• Exponentially distributed service times;
• Generally distributed interarrival times.
BUFFER SERVER(S) ARRIVALS DEPARTURES QUEUED IN-SERVICE Fig 3.7: Arrival and Service in a queuing system.
A queue models any service station with
� One or two multiple servers.
� A waiting area or buffer.
Customers arrive to receive service and then form a queue in order or arrival e.g. in banks,
fast food joints etc. If a customer arrives and does not find a free server, he/she has to wait in
the buffer.

Name: Adeyemo Adesegun Adetayo Registration Number: E3383D 21
Högskolan Dalarna Tel.: 023 778 000 Röda vägen 3, 781 88 Fax: 023 778 050 Borlänge URL: http://www2.du.se
4.0 MODELING THE SUPERPOSITION OF RENEWAL
ARRIVAL PROCESSES
4.1 LITERATURE OVERVIEW
The Poisson process has been used to describe the arrival and call blockage probability of a
telephone network for many years. However, modern research on communication (voice and
data) networks has revealed that the Poisson process is applicable in the data networks, most
especially in the internet [4], where the process arises when users initiate actions more or less
independently. While the dominant voice application is telephony, which is bidirectional,
symmetric, real-time conversation; the data network infrastructure was developed for bursty
applications and evolved into the internet that supports web access, e-mail, file transfer etc.
This burst id evident in the internet when a person using the internet is likely to initiate
additional downloads after the initial one. This clearly negates the Poisson paradigm.
Predicated on this, the TCP connection interarrival times are better modeled as a Weibull
distribution [4][5][6], while the voice connection is better modeled as a Poisson arrival
process.
In this thesis, we study the superposition of renewal process, an aggregate of different
sources. The arrival process offered to a given link is as a result of splitting and merging of
component arrival processes. The arrival processes in this case may either be a voice source
or a data source. The superposition of independent Poisson processes is a Poisson if and only
if all the processes are Poisson [1][2][3][5][6].
Name: Adeyemo Adesegun Adetayo Registration Number: E3383D 22
Högskolan Dalarna Tel.: 023 778 000 Röda vägen 3, 781 88 Fax: 023 778 050 Borlänge URL: http://www2.du.se
Sriram analyzed the model of multiplexer for packet voice and data [1]. He characterized the
aggregate packet arrival resulting from the superposition of separate voice streams. The
packet arrival from a single voice source consists of arrivals occurring at fixed intervals
during talk spurts and no arrivals at all during silences. This means that the interarrival times
are usually one packetization period. Sriram however argued that the aggregate packet arrival
process resulting from the superposition of many independent voice packet streams is not
nearly a renewal process. Also, the aggregate voice packet arrival process does behave like a
Poisson process over relatively short time intervals, but under heavy loads, the congestion in
the multiplexer is determined by the behaviour of the arrival process over much longer time
intervals, where it does not behave like a Poisson process. This assertion is corroborated by
[2][7][8].
In a similar manner to Sriram, Gusella characterized the variability of arrival processes with
indexes of dispersion for intervals and count [3]. The indexes of dispersion for some of the
simple analytical models that are frequently used to represent highly variable processes were
defined and evaluated. The variability of packet arrival processes is revealed when we add
together n successive groups of n successive interarrival times and compare the variance of
the resulting series with that of the original interarrival time series. Previous works [1] [3] [7]
supports this assertion. However, Sriram goes further to focus on the dependence among
successive interarrival times in the aggregate packet arrival process.
The superposition of voice and data sources clearly infers that the various sources will be
multiplexed and processed at intervals. Arrival of the processes will form a queue of
processes with different interarrival time. Sriram [1] and Lucantoni [2] proposed a single-
server queue with unlimited waiting room and the First-In-First-Out (FIFO) service discipline.
Name: Adeyemo Adesegun Adetayo Registration Number: E3383D 23
Högskolan Dalarna Tel.: 023 778 000 Röda vägen 3, 781 88 Fax: 023 778 050 Borlänge URL: http://www2.du.se
The multiplexer performance depends on many factors. It is a known fact that the multiplexer
performance strongly depends on the ratio of the multiplexer output capacity to the source
peak bit rate. Low values of this ratio imply that a dynamic bandwidth assignment might not
be effective, while larger values of it correspond to situation that can be analyzed with simple
model [8]. In static bandwidth allocation, the bandwidth allocated to a process (voice or data)
remains fixed over the entire connection period while the dynamic bandwidth allocation
allows the bandwidth of ongoing process to be degraded to accommodate new processes.
While the static bandwidth allocation is mainly used for voice and constant bit rate services,
the dynamic technique can be used for multimedia services with flexible QoS requirement
[10]. The multiplexer performance is also affected by the existence of small long-term
correlation between successive arrival [1] [2] [3].
Complex Stochastic models such as networks of queue are necessary to capture the essence of
many complex systems such as communication networks. The word complexity here means
approximation will be needed. Motivated by this need, Witt [9] developed a general
framework and several specific procedures for approximating a point process by a renewal
process characterized by a few parameters. The approximating processes are renewal
processes which make one parameter not good enough, but two parameters (representing the
rate and the variability) are often sufficient. Witt used the stationary-interval method and the
asymptotic method to approximate the superposition of arrival process by single arrival
process. It was found out that the asymptotic method is easier to use and often works better,
especially for queues with heavy loads, but neither procedure dominates the other.
Yavuz and Leung [11] proposed several call admission control (CAC) schemes which include
the two-dimensional Markov chain. It was found out that the two-dimensional Markov chain

Name: Adeyemo Adesegun Adetayo Registration Number: E3383D 24
Högskolan Dalarna Tel.: 023 778 000 Röda vägen 3, 781 88 Fax: 023 778 050 Borlänge URL: http://www2.du.se
is computationally intensive and suffers from the curse of dimensionality. Therefore, it is
desirable to come up with approximate solutions that have high accuracy. Predicated on this,
computationally efficient methods to analyze these systems using one-dimensional Markov
chain model was considered. In a similar manner, Nordström [6] formulated a particular form
of state-dependent CAC and routing policy, where the behaviour of the network is formulated
as a Markov Decision Process (MDP). A MDP is a controlled Markov process, where the set
of transitions from the current Markov state to other Markov state depends on the decision or
action taken by the controller in the current state.
In measuring the QoS of a network, Niyato [10] proposed an adaptive CAC policy to
minimize the deterioration in call-level QoS measure such as new call blocking probability
during successive adaptation intervals. The adaptive call admission control policy is based on
transient analysis where an incoming call is accepted if there is enough bandwidth available
or there are some processes which can be degraded in order to accept the process. Both the
new and handoff call (process) arrivals follow Poisson process and the channel holding times
is exponentially distributed and time varying. Niyato found out that adaptive call admission
control can successfully control the QoS performances at the desired level under time-varying
traffic.
The real-time voice communication achieved with telephony has made the voice process to be
given higher priority. More recently in computer communication networks, there has been
interest in supporting real-time communication applications such as control command, and
interactive voice and video applications in a packet-switched environment. Such real time
traffic differs from traditional data traffic is delay sensitive (loss insensitive) while data traffic
is loss insensitive (delay insensitive). The magnitude of the loss in a network determines the

Name: Adeyemo Adesegun Adetayo Registration Number: E3383D 25
Högskolan Dalarna Tel.: 023 778 000 Röda vägen 3, 781 88 Fax: 023 778 050 Borlänge URL: http://www2.du.se
quality of service; hence, it is critical to predict this loss accurately in order to provide an
acceptable grade of service. Nagarajan [7] examined three different approximation techniques
for modeling packet loss in a finite-buffer voice multiplexer. The first approach models the
superposed voice sources as a renewal process, the second approach models the superposed
voice sources as a Markov Modulated Poisson Process (MMPP) and the third approach is the
fluid flow approximation for computing packet loss.
The MMPP is a model that has received much attention in recent years. The MMPP has been
used to model average delay of voice packets through an infinite buffer multiplexer in [2]. It
was also used along with indexes of dispersion to fit the model to measured data in [3].
Similarly, [3] proposed a new method to determine an optimal randomized CAC and routing
policy for the MMPP traffic model.
The approach taken in [2] is to approximate the aggregate arrival process by a simpler,
correlated, nonrenewal stream, which is modulated in a Markovian manner. The choice of the
MMPP is based on its analytic simplicity as well as versatility. Also one advantage of the
Lucantoni characterization of voice and data sources as an MMPP is that once the parameters
of the process are obtained, it can be fed into any system we like. Previous researches have
modeled superposition of renewal processes by different methods. In [5], renewal processes
was modeled by a simple Poisson process, [1] modeled a superposition arrival process via the
index of dispersion for intervals (IDI). Feldman made use of the Weibull distribution to model
TCP connections interarrival times [4]. But in a similar manner with [2], [6]-[8] modeled the
superposition of voice and data sources by the MMPP. Much of the Lucantoni model will be
discussed extensively in sections ahead.
Name: Adeyemo Adesegun Adetayo Registration Number: E3383D 26
Högskolan Dalarna Tel.: 023 778 000 Röda vägen 3, 781 88 Fax: 023 778 050 Borlänge URL: http://www2.du.se
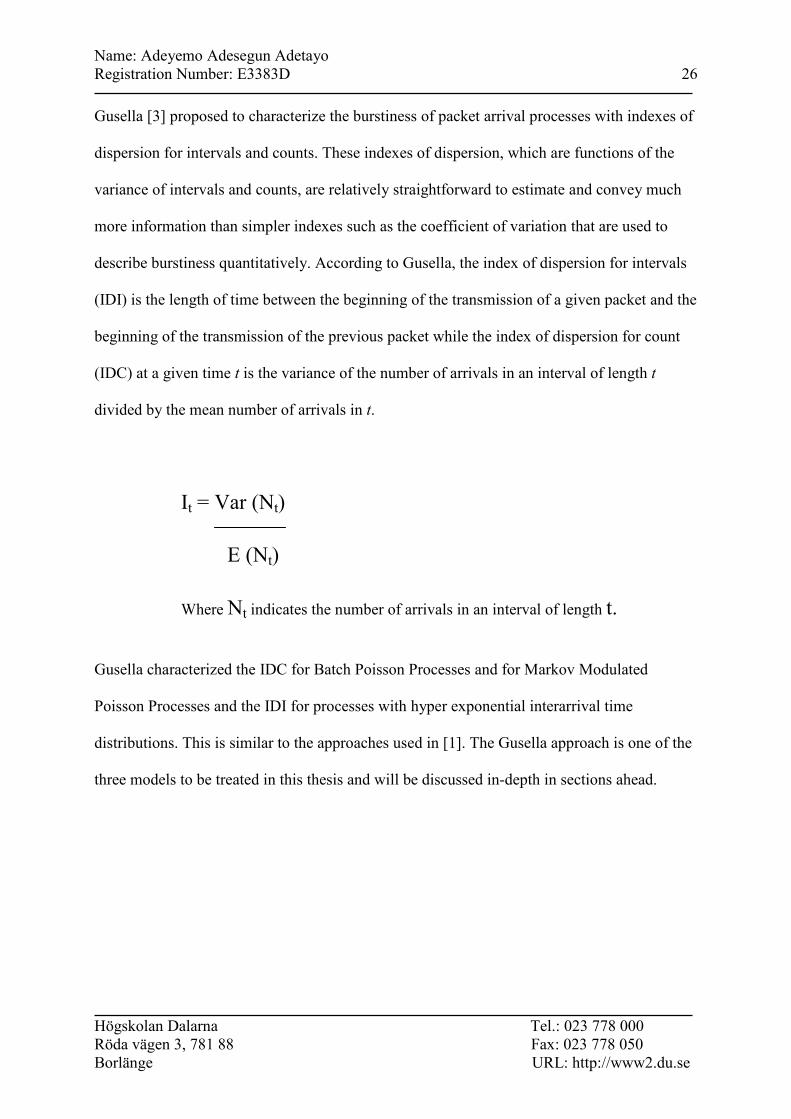
Gusella [3] proposed to characterize the burstiness of packet arrival processes with indexes of
dispersion for intervals and counts. These indexes of dispersion, which are functions of the
variance of intervals and counts, are relatively straightforward to estimate and convey much
more information than simpler indexes such as the coefficient of variation that are used to
describe burstiness quantitatively. According to Gusella, the index of dispersion for intervals
(IDI) is the length of time between the beginning of the transmission of a given packet and the
beginning of the transmission of the previous packet while the index of dispersion for count
(IDC) at a given time t is the variance of the number of arrivals in an interval of length t
divided by the mean number of arrivals in t.
It = Var (Nt)
E (Nt)
Where Nt indicates the number of arrivals in an interval of length t.
Gusella characterized the IDC for Batch Poisson Processes and for Markov Modulated
Poisson Processes and the IDI for processes with hyper exponential interarrival time
distributions. This is similar to the approaches used in [1]. The Gusella approach is one of the
three models to be treated in this thesis and will be discussed in-depth in sections ahead.
Name: Adeyemo Adesegun Adetayo Registration Number: E3383D 27
Högskolan Dalarna Tel.: 023 778 000 Röda vägen 3, 781 88 Fax: 023 778 050 Borlänge URL: http://www2.du.se
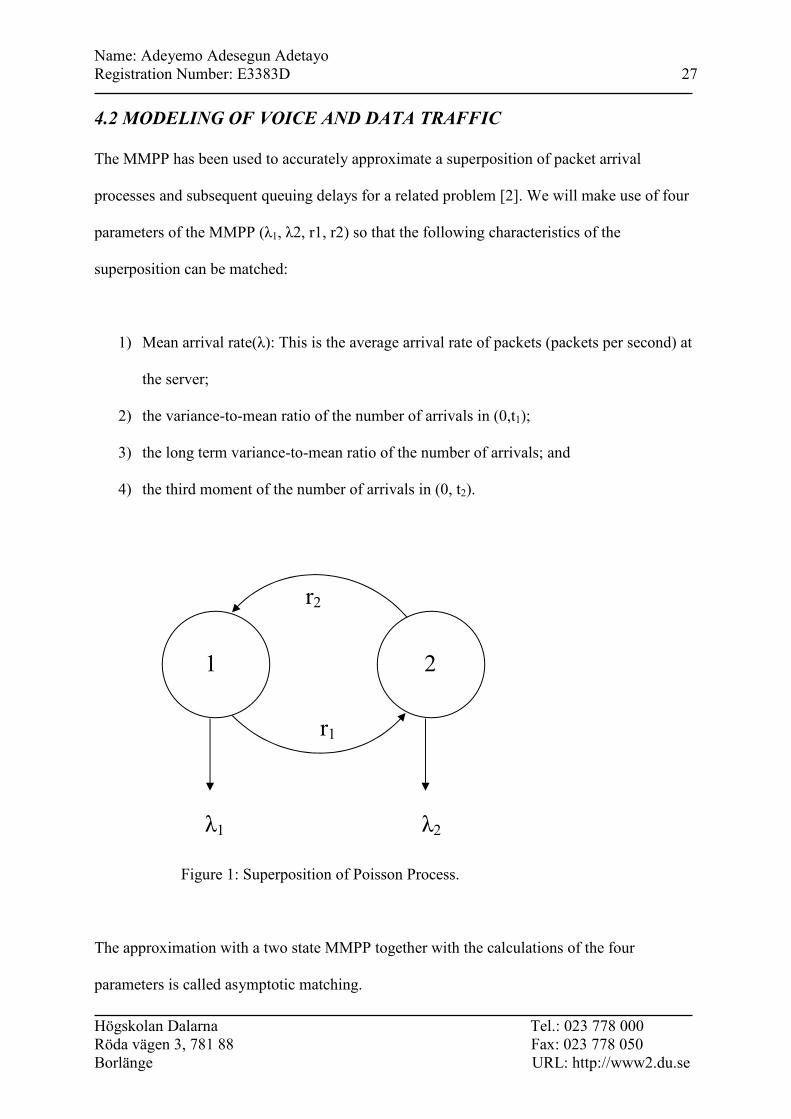
4.2 MODELING OF VOICE AND DATA TRAFFIC
The MMPP has been used to accurately approximate a superposition of packet arrival
processes and subsequent queuing delays for a related problem [2]. We will make use of four
parameters of the MMPP (λ1, λ2, r1, r2) so that the following characteristics of the
superposition can be matched:
1) Mean arrival rate(λ): This is the average arrival rate of packets (packets per second) at
the server;
2) the variance-to-mean ratio of the number of arrivals in (0,t1);
3) the long term variance-to-mean ratio of the number of arrivals; and
4) the third moment of the number of arrivals in (0, t2).
λ1 λ2
Figure 1: Superposition of Poisson Process.
The approximation with a two state MMPP together with the calculations of the four
parameters is called asymptotic matching.
1
2
r1
r2

Name: Adeyemo Adesegun Adetayo Registration Number: E3383D 28
Högskolan Dalarna Tel.: 023 778 000 Röda vägen 3, 781 88 Fax: 023 778 050 Borlänge URL: http://www2.du.se
4.3 THE GUSELLA MMPP APPROACH
This approach tends to characterize the burstiness of packet arrival processes with indexes of
dispersion for intervals and count (IDI and IDC) [3]. Furthermore, the procedure based on the
index of dispersion for counts for the MMPP was described by this approach. Gusella
approached this problem by estimating the indexes for a number of measure point processes
that were generated by workstations communicating with file servers over a local-area
network.
The approach is divided into three parts:
1. Definition of the index of dispersion for intervals (IDI) and index of dispersion for
count (IDC), calculation of one of these two indexes for each of the three classes of
analytical models that are often used to represent bursty point process
(hyperexponential interarrival times, batch Poisson processes, and the Markov
Modulated Poisson Process).
2. Estimation of indexes of dispersion for several measured packet arrival processes
generated by single-user workstations communicating with file servers over a local-
area network (the measurements were taken on a large network of workstations at the
Sun Microsystems).
3. A procedure to fit a Markov Modulated Poisson Process (MMPP) to the model arrival
process was developed.
For the purpose of this thesis, we focus on the two-state MMPP model of the Gusella
approach. This is due to the fact that only the MMPP can be used to represent correlations
between subsequent arrivals.

Name: Adeyemo Adesegun Adetayo Registration Number: E3383D 29
Högskolan Dalarna Tel.: 023 778 000 Röda vägen 3, 781 88 Fax: 023 778 050 Borlänge URL: http://www2.du.se
The IDC of a two-state MMPP is represented by:
It = 1 + 2σ1σ2(λ1-λ2)2 - 2σ1σ2(λ1-λ2)
2 . (1-e-(σ1+σ2)t) (σ1+σ2)
2(λ1σ2+λ2σ1) (σ1+σ2)3(λ1σ2+λ2σ1)t (1)
The asymptote of the IDC is given by:
I∞ = 1 + 2σ1σ2(λ1-λ2)2
(σ1+σ2)2(λ1σ2+λ2σ1) (2)
I∞ - It0 = 1 – e-rt0
I∞ - 1 rt0 (3)
Where λ1λ2 is the mean arrival rate and
σ1σ2 is the mean service rate of each packet The Gusella approach presents a procedure that can be used to fit an MMPP model to packet
processes as long as the non-stationary data components are controlled. Data from one of the
workstation was worked with in the approach (In our own case, we will work on estimated
data).

Name: Adeyemo Adesegun Adetayo Registration Number: E3383D 30
Högskolan Dalarna Tel.: 023 778 000 Röda vägen 3, 781 88 Fax: 023 778 050 Borlänge URL: http://www2.du.se
This approach makes use of the following equations in the model:
Mean arrival time of an MMPP σ1 + σ2 = a
λ1σ2+λ2σ1
Asymptotes 1 + 2σ1σ2(λ1-λ2)2 = b + 1 (4)
(σ1+σ2)2(λ1σ2+λ2σ1)
Rate at which IDC approach asymptotes (σ1 + σ2) = c
Where a & b represents the estimated mean of the arrival times of the measured
point process and the estimated value of the IDC asymptotes minus 1.
c represents the rate at which the IDC approaches its asymptotes (parameter c
can be estimated initially).
Name: Adeyemo Adesegun Adetayo Registration Number: E3383D 31
Högskolan Dalarna Tel.: 023 778 000 Röda vägen 3, 781 88 Fax: 023 778 050 Borlänge URL: http://www2.du.se
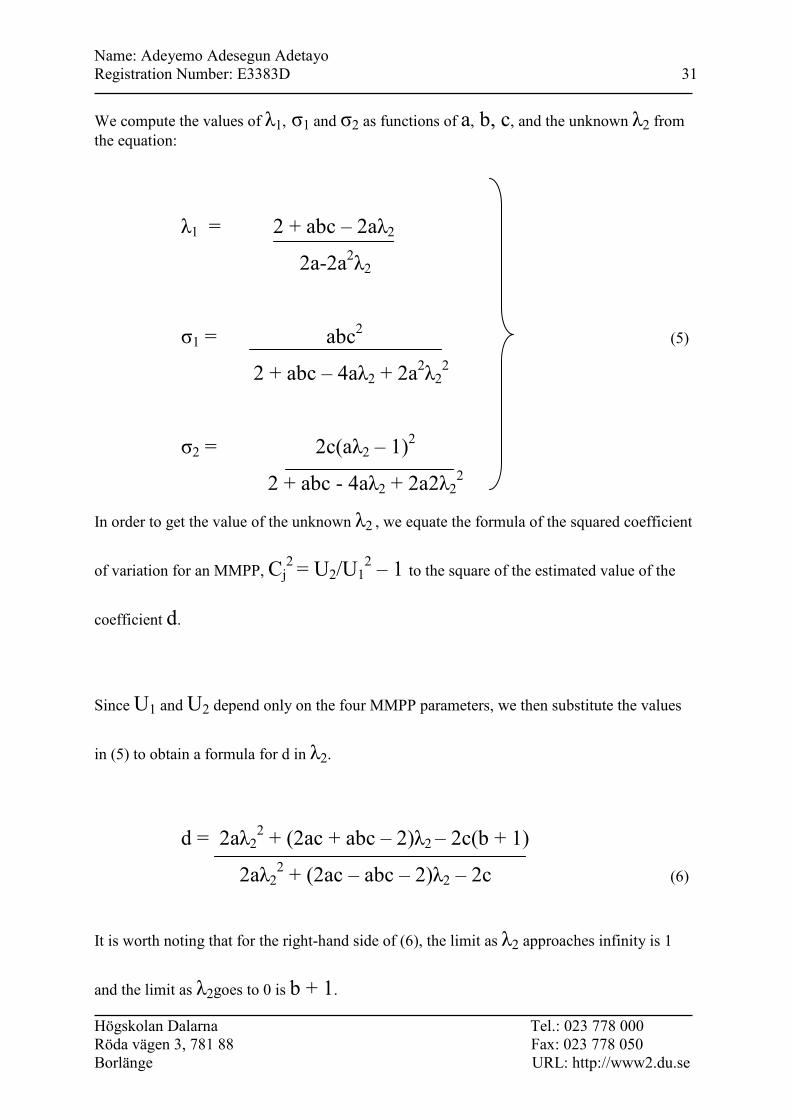
We compute the values of λ1, σ1 and σ2 as functions of a, b, c, and the unknown λ2 from the equation:
λ1 = 2 + abc – 2aλ2
2a-2a2λ2
σ1 = abc2 (5)
2 + abc – 4aλ2 + 2a2λ2
2
σ2 = 2c(aλ2 – 1)2
2 + abc - 4aλ2 + 2a2λ22
In order to get the value of the unknown λ2 , we equate the formula of the squared coefficient
of variation for an MMPP, Cj2 = U2/U1
2 – 1 to the square of the estimated value of the
coefficient d.
Since U1 and U2 depend only on the four MMPP parameters, we then substitute the values
in (5) to obtain a formula for d in λ2.
d = 2aλ22 + (2ac + abc – 2)λ2 – 2c(b + 1)
2aλ22 + (2ac – abc – 2)λ2 – 2c (6)
It is worth noting that for the right-hand side of (6), the limit as λ2 approaches infinity is 1
and the limit as λ2goes to 0 is b + 1.

Name: Adeyemo Adesegun Adetayo Registration Number: E3383D 32
Högskolan Dalarna Tel.: 023 778 000 Röda vägen 3, 781 88 Fax: 023 778 050 Borlänge URL: http://www2.du.se
In order to fit a two-state MMPP to a measured arrival process, the four parameters of the
MMPP is set as follows:
a) From the data, we estimate a, b & d.
b) Using b, t0 and It0, the value of the IDC at time t0, we estimate numerically an initial
value of the rate c by solving (3).
c) From the solution to (6), we obtained a value for and use it to derive values for λ1, σ1,
σ2 from (5).
d) Computation based on the current values of the parameters, the goodness of the
approximation by comparing the estimated IDC with the calculated one by (1).
We test for goodness of fit by evaluating the sum of the squared distances between the
estimated and theoretical IDC curves.
We adjust the values of c as appropriate to improve the fit and repeat (c) and (d) of the above
procedure until approximation is satisfactory. Choosing a smaller c will make the IDC reach
the asymptote more slowly.
Finally, we can then go ahead to estimate the mean arrival time (λ1), b, the squared
coefficient of variation, t0 & It.
Name: Adeyemo Adesegun Adetayo Registration Number: E3383D 33
Högskolan Dalarna Tel.: 023 778 000 Röda vägen 3, 781 88 Fax: 023 778 050 Borlänge URL: http://www2.du.se
4.4 THE LUCANTONI MMPP APPROACH
The Lucantoni approach studied the performance of a statistical multiplexer whose input
consists of a superposition (combined) of packetized voice and data sources [2]. The
superposition is then approximated by a correlated Markov Modulated Poisson Process
(MMPP).
The MMPP was chosen for the Lucantoni approach in such a way that several of its statistical
characteristics identically match those of the superposition. The choice of the MMPP is due to
its stochastic capability, where the rate process is determined by the state of continuous-time
Markov chain.
This Approach was used for this thesis because its comparisons with simulation show the
methods used are accurate. Similarly, the Lucantoni’s characterization of the superposition of
voice and data sources as an MMPP is very good because once the parameters are obtained;
they can be fed into any system.
4.4.1 THE MODEL
The packet voice/data multiplexer is modeled by feeding the MMPP into a single-server
queue, served first-in-first-out (FIFO), with general service time distribution, where the
service distribution is the approximate mixture of the voice and data packet service time
distribution. The model shows a method of handling overload during network congestion. The
control mechanism suggested is using a variable bit rate on voice packets during congestion,
thereby providing a graceful degradation of the system performance.
Name: Adeyemo Adesegun Adetayo Registration Number: E3383D 34
Högskolan Dalarna Tel.: 023 778 000 Röda vägen 3, 781 88 Fax: 023 778 050 Borlänge URL: http://www2.du.se
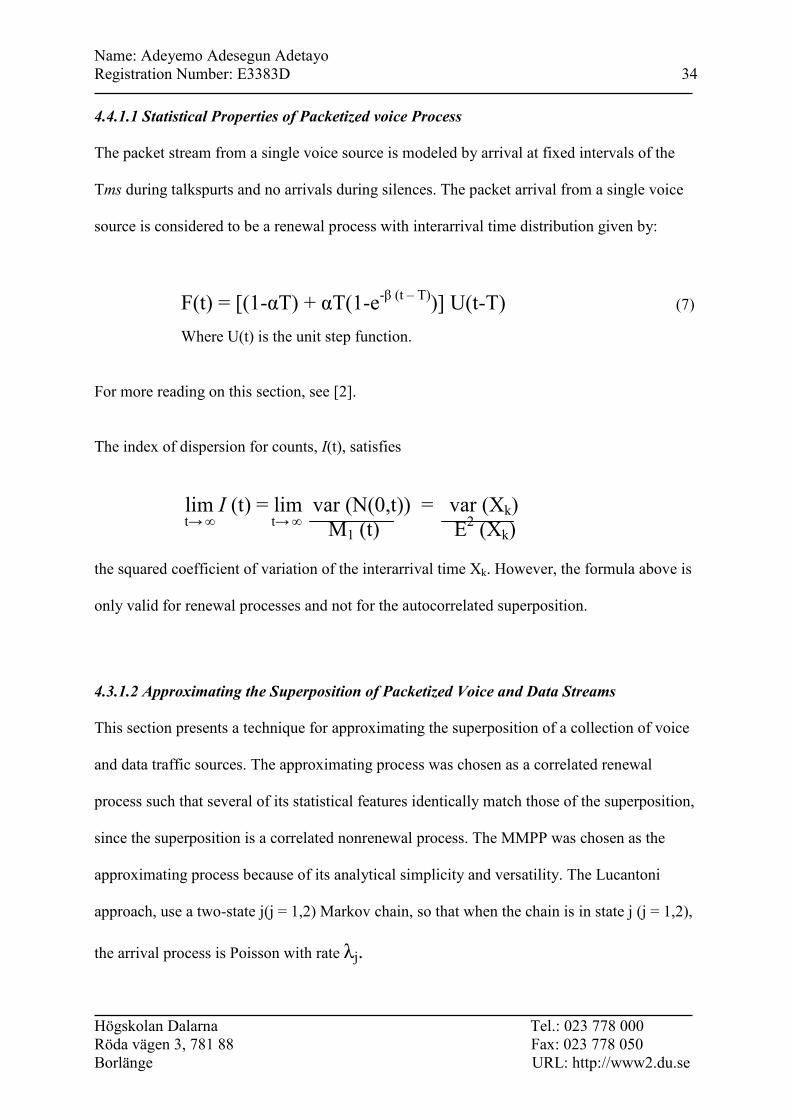
4.4.1.1 Statistical Properties of Packetized voice Process
The packet stream from a single voice source is modeled by arrival at fixed intervals of the
Tms during talkspurts and no arrivals during silences. The packet arrival from a single voice
source is considered to be a renewal process with interarrival time distribution given by:
F(t) = [(1-αT) + αT(1-e-β (t – T))] U(t-T) (7)
Where U(t) is the unit step function.
For more reading on this section, see [2].
The index of dispersion for counts, I(t), satisfies
lim I (t) = lim var (N(0,t)) = var (Xk) t→ ∞ t→ ∞ M1 (t) E
2 (Xk) the squared coefficient of variation of the interarrival time Xk. However, the formula above is
only valid for renewal processes and not for the autocorrelated superposition.
4.3.1.2 Approximating the Superposition of Packetized Voice and Data Streams
This section presents a technique for approximating the superposition of a collection of voice
and data traffic sources. The approximating process was chosen as a correlated renewal
process such that several of its statistical features identically match those of the superposition,
since the superposition is a correlated nonrenewal process. The MMPP was chosen as the
approximating process because of its analytical simplicity and versatility. The Lucantoni
approach, use a two-state j(j = 1,2) Markov chain, so that when the chain is in state j (j = 1,2),
the arrival process is Poisson with rate λj.
Name: Adeyemo Adesegun Adetayo Registration Number: E3383D 35
Högskolan Dalarna Tel.: 023 778 000 Röda vägen 3, 781 88 Fax: 023 778 050 Borlänge URL: http://www2.du.se
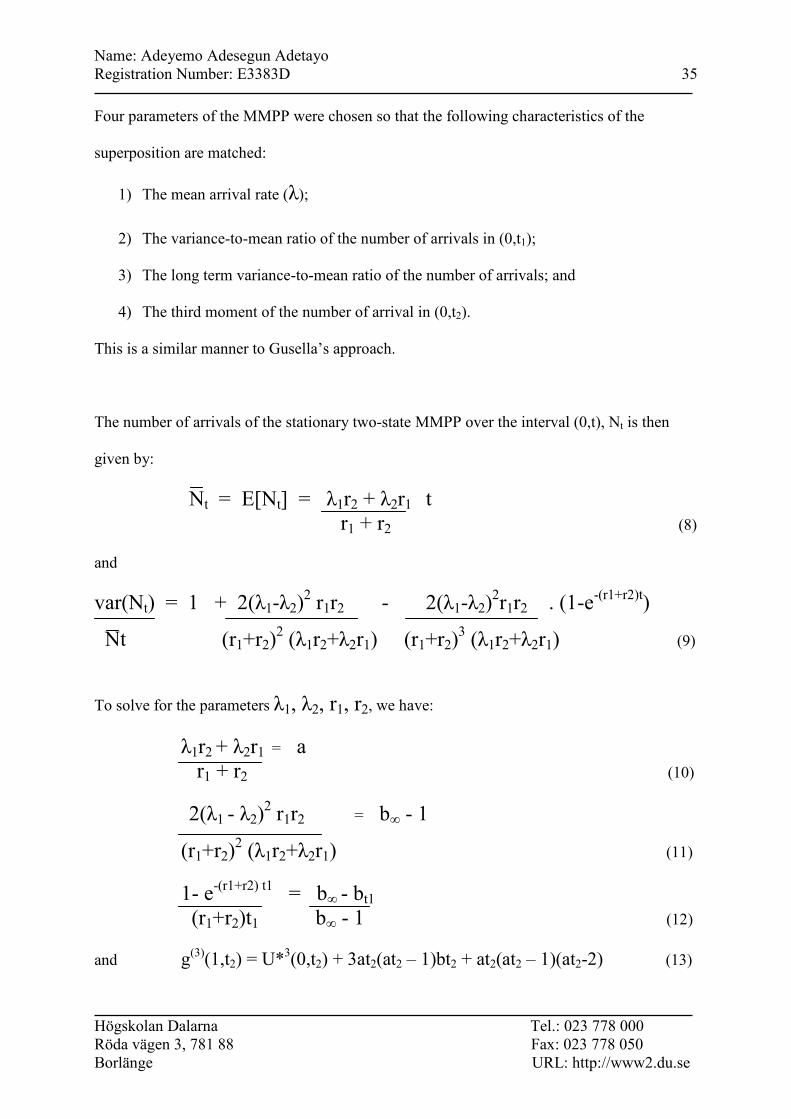
Four parameters of the MMPP were chosen so that the following characteristics of the
superposition are matched:
1) The mean arrival rate (λ);
2) The variance-to-mean ratio of the number of arrivals in (0,t1);
3) The long term variance-to-mean ratio of the number of arrivals; and
4) The third moment of the number of arrival in (0,t2).
This is a similar manner to Gusella’s approach.
The number of arrivals of the stationary two-state MMPP over the interval (0,t), Nt is then
given by:
Nt = E[Nt] = λ1r2 + λ2r1 t r1 + r2 (8) and
var(Nt) = 1 + 2(λ1-λ2)2 r1r2 - 2(λ1-λ2)
2r1r2 . (1-e-(r1+r2)t)
Nt (r1+r2)2 (λ1r2+λ2r1) (r1+r2)
3 (λ1r2+λ2r1) (9)
To solve for the parameters λ1, λ2, r1, r2, we have:
λ1r2 + λ2r1 = a r1 + r2 (10)
2(λ1 - λ2)2 r1r2 = b∞ - 1
(r1+r2)2 (λ1r2+λ2r1) (11)
1- e-(r1+r2) t1 = b∞ - bt1 (r1+r2)t1 b∞ - 1 (12) and g(3)(1,t2) = U*
3(0,t2) + 3at2(at2 – 1)bt2 + at2(at2 – 1)(at2-2) (13)

Name: Adeyemo Adesegun Adetayo Registration Number: E3383D 36
Högskolan Dalarna Tel.: 023 778 000 Röda vägen 3, 781 88 Fax: 023 778 050 Borlänge URL: http://www2.du.se
It is worth noting that the right hand side of the four equations above are computable from the
results of the superposition of voice packets.
(r1 + r2) can be solved directly from (12) if bt1 > 1, i.e., the variance-to-mean ratio of the
superposition process at t1 is greater than that of a Poisson process. The solution is denoted
by d, i.e., d = r1 + r2. By substitution,
d = 1 b∞ - 1 (1-e-dt1)
t1 b∞ - bt1
It is worth noting that d is the same as c and r in the Gusella model, i.e d = c = r. (13) can be written in terms of the parameters of the two-state MMPP, as: g(3)(1,t2) = a
3t23 + 3a2(b∞ - 1)t2
2 + 3a(b∞ - 1) . (λ1 - λ2)(r1-r2) - a t2 d d + 3a (b∞ - 1) (λ1 - λ2)(r1-r2) + ad . t2e
-dt2 – 6a (b∞ - 1) . d2 d3
(λ1 - λ2)(r1-r2)(1 - e-dt2) (15)
Therefore, (14) can be written as:
(λ1 – λ2) (r1 –r2) = K (16)
Where K is a known parameter. To derive K, we should observe that:

Name: Adeyemo Adesegun Adetayo Registration Number: E3383D 37
Högskolan Dalarna Tel.: 023 778 000 Röda vägen 3, 781 88 Fax: 023 778 050 Borlänge URL: http://www2.du.se
( ) ( ) ( ) ( ) ( )
( ) ( ).116
131313,1
2
2
3
22222
232
32
)3(
dt
dt
eKd
ba
etadKd
bata
d
K
d
batbatatg
−∞
−∞∞∞
−−
−
+−
+
−−
+−+=
(17)
The right-hand side is a linear function of K. A simple calculation implies that
( ) ( ) ( )( )( ) ( ) ( )( ) .
12113
113,122
2
2
2223
23
2)3(2
dtdt
dt
eedtba
edttbadtatdgdK
−−∞
−∞
−−+−
−−−+−=
(18)
(10) & (11) can then be written as:
(λ1r2 + λ2r1) = ad (19)
(λ1 – λ2)2 r1r2 = (b∞ - 1) ad3
2 (20)
For both (19) and (20), we require b∞ > 1, i.e., larger long term variability of the
superposition than a Poisson process.
If k = 0, then r1 = r2 = d/2 since in (18), b∞ > 1 and hence λ1 ≠ λ2. We then
solve (17) and (18) for λ1 & λ2.
If k ≠ 0, then we define
e = (b∞ - 1) ad3
2K2

Name: Adeyemo Adesegun Adetayo Registration Number: E3383D 38
Högskolan Dalarna Tel.: 023 778 000 Röda vägen 3, 781 88 Fax: 023 778 050 Borlänge URL: http://www2.du.se
The final solution is then given by:
r1 = d 1 + 1
2 √4e + 1
r2 = d - r1
λ2 = ad - K r2 r2 r1 - r2 r1 + r2 λ1 = K + λ2
r1 - r2 The above formula gives us the approximate values of the MMPP parameters. It is also worth
noting that the time points t1 and t2 can be chosen randomly over the entire range of t.
If the superposition of the data streams can be approximated by a Poisson process, then a
trivial modification of the MMPP representing the packetized voice traffic will model the
aggregate voice and data streams. If the data traffic is not a Poisson, then the methodology of
Statistical Properties of Packetized voice processes applies directly to the aggregate stream.
For our model, the data traffic is a Poisson process, which makes the MMPP more suitable. In
a two-state MMPP with parameters λ1, λ2, r1, r2, the data streams are incorporated into the
model by noting that the superposition of a Poisson process of rate λd is again a two-state
MMPP with parameters λ1 + λd, λ2 + λd, r1, r2.

Name: Adeyemo Adesegun Adetayo Registration Number: E3383D 39
Högskolan Dalarna Tel.: 023 778 000 Röda vägen 3, 781 88 Fax: 023 778 050 Borlänge URL: http://www2.du.se
5.0 NUMERICAL RESULTS
5.1 CONSIDERED SUPERPOSITION MODELLING METHODS
The three considered superposition of renewal process models considered are:
� The Exact Model: This models real data/call traffic (superposition of renewal
processes.
� The Lucantoni Model: This approximates the superposition of Packetized voice
sources and data by a correlated Markov modulated Poisson process.
� The Gusella Model: This estimates the index of dispersion for counts (IDC) to
characterize the burstiness of packet arrival processes. It makes use of this IDC in
MMPP parameter estimation. The MMPP is used to represent correlations between
subsequent arrivals.
5.2 EXAMPLES AND RESULTS
From the properties of the Markov Modulated Poison Process (MMPP), we expect the results
the MMPP model will give a good result than the simple renewal process modeling. It is
expected that the MMPP will give an early convergence of the mean waiting time and
probability of delay for the superposed traffic than that of the simple renewal process for
same number of classes.
Name: Adeyemo Adesegun Adetayo Registration Number: E3383D 40
Högskolan Dalarna Tel.: 023 778 000 Röda vägen 3, 781 88 Fax: 023 778 050 Borlänge URL: http://www2.du.se
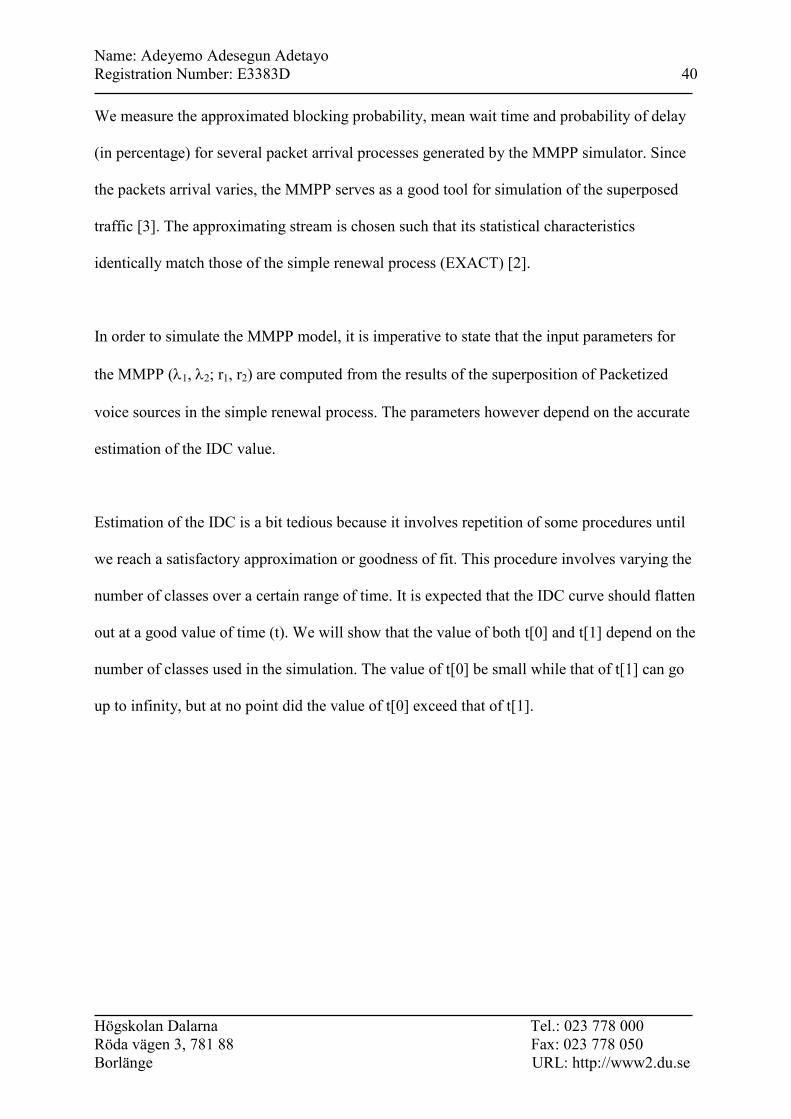
We measure the approximated blocking probability, mean wait time and probability of delay
(in percentage) for several packet arrival processes generated by the MMPP simulator. Since
the packets arrival varies, the MMPP serves as a good tool for simulation of the superposed
traffic [3]. The approximating stream is chosen such that its statistical characteristics
identically match those of the simple renewal process (EXACT) [2].
In order to simulate the MMPP model, it is imperative to state that the input parameters for
the MMPP (λ1, λ2; r1, r2) are computed from the results of the superposition of Packetized
voice sources in the simple renewal process. The parameters however depend on the accurate
estimation of the IDC value.
Estimation of the IDC is a bit tedious because it involves repetition of some procedures until
we reach a satisfactory approximation or goodness of fit. This procedure involves varying the
number of classes over a certain range of time. It is expected that the IDC curve should flatten
out at a good value of time (t). We will show that the value of both t[0] and t[1] depend on the
number of classes used in the simulation. The value of t[0] be small while that of t[1] can go
up to infinity, but at no point did the value of t[0] exceed that of t[1].
Name: Adeyemo Adesegun Adetayo Registration Number: E3383D 41
Högskolan Dalarna Tel.: 023 778 000 Röda vägen 3, 781 88 Fax: 023 778 050 Borlänge URL: http://www2.du.se
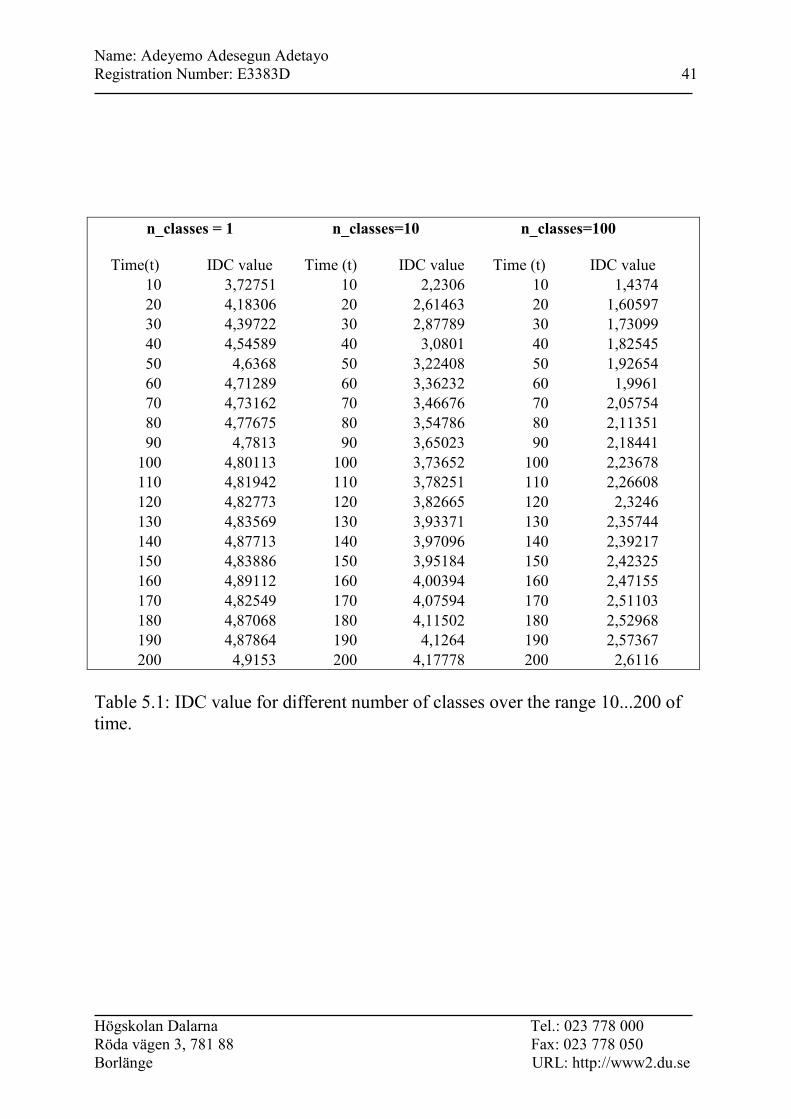
n_classes = 1 n_classes=10 n_classes=100
Time(t) IDC value Time (t) IDC value Time (t) IDC value
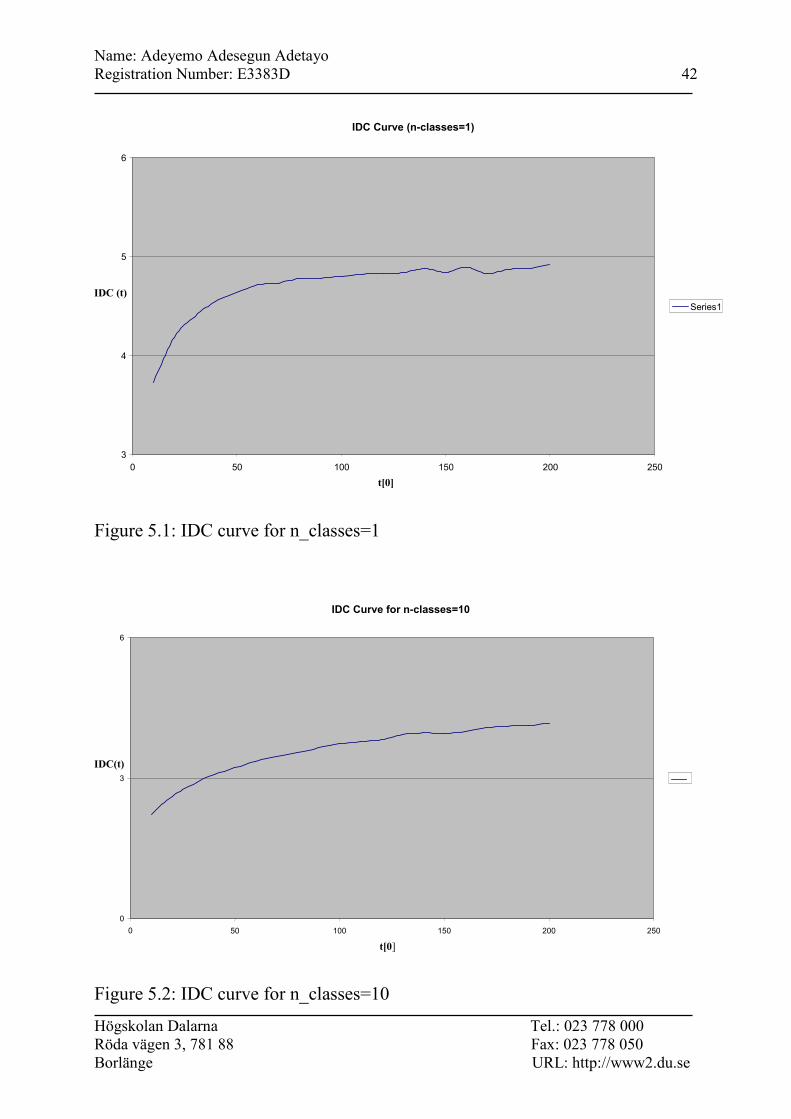
10 3,72751 10 2,2306 10 1,4374 20 4,18306 20 2,61463 20 1,60597 30 4,39722 30 2,87789 30 1,73099 40 4,54589 40 3,0801 40 1,82545 50 4,6368 50 3,22408 50 1,92654 60 4,71289 60 3,36232 60 1,9961 70 4,73162 70 3,46676 70 2,05754 80 4,77675 80 3,54786 80 2,11351 90 4,7813 90 3,65023 90 2,18441 100 4,80113 100 3,73652 100 2,23678 110 4,81942 110 3,78251 110 2,26608 120 4,82773 120 3,82665 120 2,3246 130 4,83569 130 3,93371 130 2,35744 140 4,87713 140 3,97096 140 2,39217 150 4,83886 150 3,95184 150 2,42325 160 4,89112 160 4,00394 160 2,47155 170 4,82549 170 4,07594 170 2,51103 180 4,87068 180 4,11502 180 2,52968 190 4,87864 190 4,1264 190 2,57367 200 4,9153 200 4,17778 200 2,6116
Table 5.1: IDC value for different number of classes over the range 10...200 of time.
Name: Adeyemo Adesegun Adetayo Registration Number: E3383D 42
Högskolan Dalarna Tel.: 023 778 000 Röda vägen 3, 781 88 Fax: 023 778 050 Borlänge URL: http://www2.du.se
Figure 5.1: IDC curve for n_classes=1
Figure 5.2: IDC curve for n_classes=10
IDC Curve for n-classes=10
0
3
6
0 50 100 150 200 250 t[0]
IDC(t)
IDC Curve (n-classes=1)
3
4
5
6
0 50 100 150 200 250 t[0]
IDC (t)
Series1
Name: Adeyemo Adesegun Adetayo Registration Number: E3383D 43
Högskolan Dalarna Tel.: 023 778 000 Röda vägen 3, 781 88 Fax: 023 778 050 Borlänge URL: http://www2.du.se
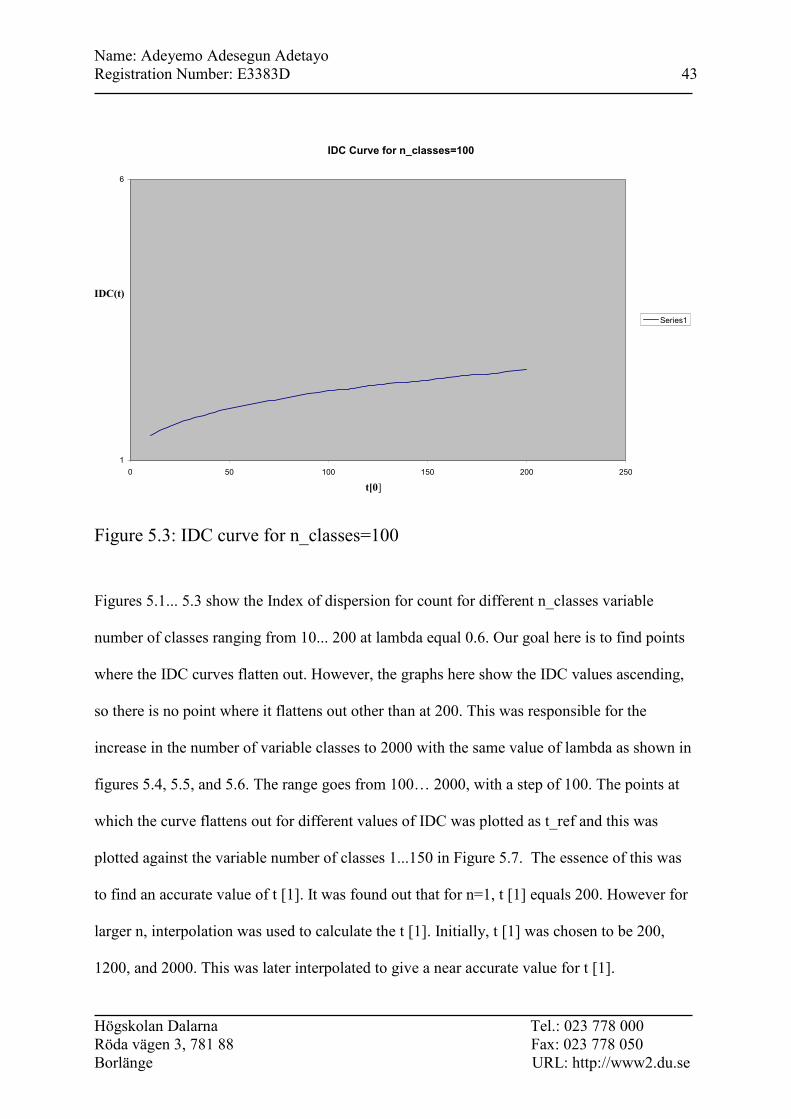
Figure 5.3: IDC curve for n_classes=100 Figures 5.1... 5.3 show the Index of dispersion for count for different n_classes variable
number of classes ranging from 10... 200 at lambda equal 0.6. Our goal here is to find points
where the IDC curves flatten out. However, the graphs here show the IDC values ascending,
so there is no point where it flattens out other than at 200. This was responsible for the
increase in the number of variable classes to 2000 with the same value of lambda as shown in
figures 5.4, 5.5, and 5.6. The range goes from 100… 2000, with a step of 100. The points at
which the curve flattens out for different values of IDC was plotted as t_ref and this was
plotted against the variable number of classes 1...150 in Figure 5.7. The essence of this was
to find an accurate value of t [1]. It was found out that for n=1, t [1] equals 200. However for
larger n, interpolation was used to calculate the t [1]. Initially, t [1] was chosen to be 200,
1200, and 2000. This was later interpolated to give a near accurate value for t [1].
IDC Curve for n_classes=100
1
6
0 50 100 150 200 250 t[0]
IDC(t)
Series1

Name: Adeyemo Adesegun Adetayo Registration Number: E3383D 44
Högskolan Dalarna Tel.: 023 778 000 Röda vägen 3, 781 88 Fax: 023 778 050 Borlänge URL: http://www2.du.se
The best IDC curve for n_classes=1 is the one with t[0] in [1,200] as shown in Figure 5.2. The
variability in the IDC curve for t[0]>200 is due to the large variance in the simulation as
shown in figures 5.4 .. 5.6. This is evident in figure 5.4 where the a small number of events
causes a large variability in the IDC curve.
Table for n_classes = 1 Table for n_classes=10 n_classes=100
Time (t) IDC value Time (t) IDC value Time (t) IDC value
100 4,79566 100 3,73909 100 2,21593 200 4,97763 200 4,15218 200 2,59718 300 4,91503 300 4,45105 300 2,84704 400 4,9113 400 4,50347 400 3,08732 500 4,87981 500 4,62052 500 3,20984 600 4,87671 600 4,72354 600 3,23595 700 4,85286 700 4,69578 700 3,42023 800 4,96769 800 4,82106 800 3,567 900 4,85943 900 4,75156 900 3,64627 1000 4,9343 1000 4,79016 1000 3,6443 1100 4,87643 1100 4,86349 1100 3,89852 1200 5,00986 1200 4,99922 1200 3,9406 1300 4,99156 1300 4,89066 1300 3,77907 1400 4,99051 1400 4,8845 1400 3,98371 1500 4,97812 1500 4,79286 1500 4,23531 1600 4,93479 1600 5,02381 1600 4,137 1700 5,06506 1700 4,78343 1700 4,02366 1800 4,98413 1800 4,8855 1800 4,01495 1900 5,01965 1900 4,93212 1900 3,98755 2000 5,0408 2000 4,99897 2000 4,06561
Table 5.2: IDC value for different number of classes over the range 100...2000 of time.

Name: Adeyemo Adesegun Adetayo Registration Number: E3383D 45
Högskolan Dalarna Tel.: 023 778 000 Röda vägen 3, 781 88 Fax: 023 778 050 Borlänge URL: http://www2.du.se
Figure 5.4: IDC curve for n_classes=1
Figure 5.5: IDC curve for n_classes=10
IDC for n_classes=10
3
4
5
6
7
8
0 500 1000 1500 2000 2500 t[0]
IDC value
Series1
IDC for n_classes=1
4,75
5,75
0 500 1000 1500 2000 2500 t[0]
IDC value
Series1

Name: Adeyemo Adesegun Adetayo Registration Number: E3383D 46
Högskolan Dalarna Tel.: 023 778 000 Röda vägen 3, 781 88 Fax: 023 778 050 Borlänge URL: http://www2.du.se
Figure 5.6: IDC curve for n_classes=100
IDC tref
1 200 10 1200 20 1200 30 1300 40 1300 50 1200 60 1300 70 1400 80 1400 90 1400 100 1500 110 1500 120 1600 130 1800 140 1900 150 1900
Table 5.3: Resultant table (from figs. 5.4, 5.5, 5.6)
IDC Curve for n_classes=100
2
3
4
5
6
0 500 1000 1500 2000 2500
t[0]
IDC value
Name: Adeyemo Adesegun Adetayo Registration Number: E3383D 47
Högskolan Dalarna Tel.: 023 778 000 Röda vägen 3, 781 88 Fax: 023 778 050 Borlänge URL: http://www2.du.se
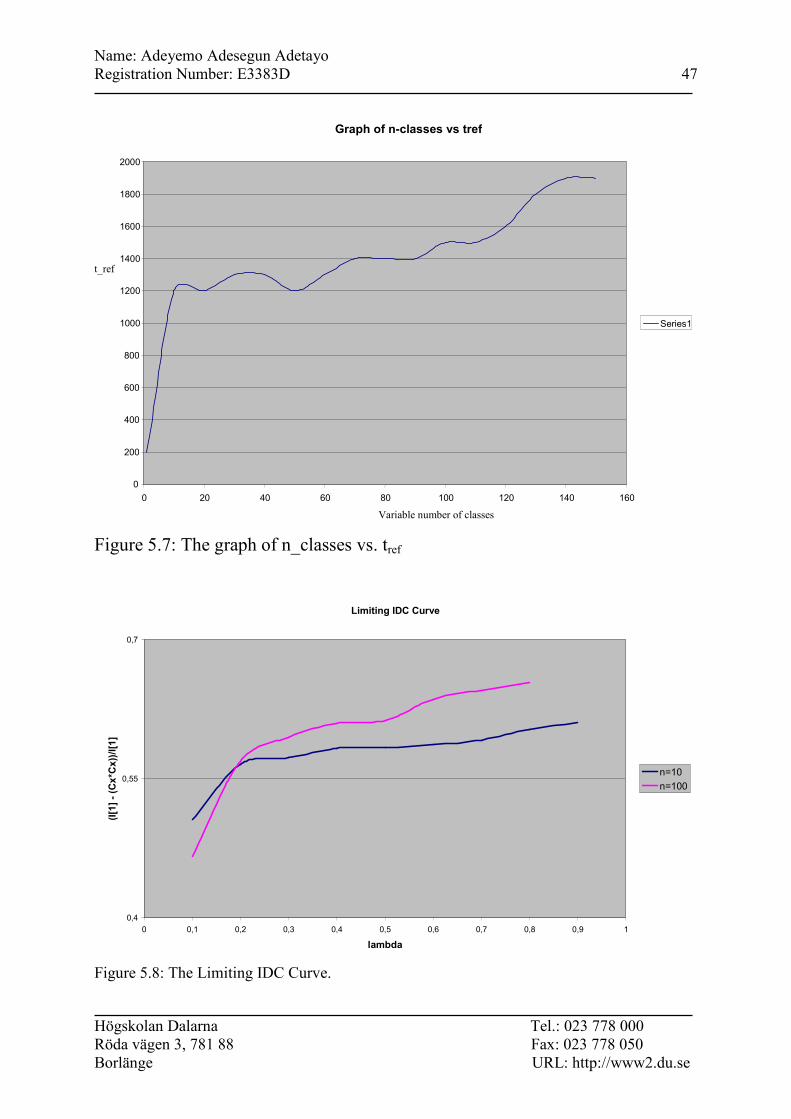
Figure 5.7: The graph of n_classes vs. tref
Limiting IDC Curve
0,4
0,55
0,7
0 0,1 0,2 0,3 0,4 0,5 0,6 0,7 0,8 0,9 1
lambda
(I[1] - (Cx*Cx))/I[1]
n=10
n=100
Figure 5.8: The Limiting IDC Curve.
Graph of n-classes vs tref
0
200
400
600
800
1000
1200
1400
1600
1800
2000
0 20 40 60 80 100 120 140 160 Variable number of classes
t_ref
Series1
Name: Adeyemo Adesegun Adetayo Registration Number: E3383D 48
Högskolan Dalarna Tel.: 023 778 000 Röda vägen 3, 781 88 Fax: 023 778 050 Borlänge URL: http://www2.du.se
Figure 5.8 above shows the effect of an increase in lambda on the limiting IDC curve. It
shows that as lambda increases, the liming IDC value increases and vice-versa. The y-axis
value measure the contribution of autocorrelation to the limiting IDC value I [1] while
C_X*C_X is the squared coefficient of variation.
Figures 5.9 and 5.10 shows the comparison between the mean waiting time of the Exact
superposition and that of Gusella. Our goal here was to compare the Gusella and the Exact
models when they are having the same number of n_classes and variable number of classes
(200 ... 2000) but with the different interarrival times (lambda). However, from the results of
the figure, the mean waiting time of the Gusella model got better with increase interarrival
time lambda. The mean waiting time of the Gusella model at lambda=0.4 and different classes
produces overestimated values. A correct estimation was made at n_classes=10 as shown in
figure 5.9. An increase in lambda to 0.8, made the Gusella approach to underestimate the
mean waiting time. This same result holds for the probability of delay between the two
models. A small value of lambda at n_classes=100 models the exact better while a higher
value of lambda underestimates the probability of delay as shown in figures 5.11 and 5.12.
The essence of the comparisons shown in figures 5.9 to 5.12 is to evaluate the
accuracy of the Gus MMPP model for different t [0]. Figures 5.9 to 5.12 evaluates the
accuracy of the Gusella MMPP model with respect to the t[0] parameter.

Name: Adeyemo Adesegun Adetayo Registration Number: E3383D 49
Högskolan Dalarna Tel.: 023 778 000 Röda vägen 3, 781 88 Fax: 023 778 050 Borlänge URL: http://www2.du.se
The Index of dispersion for counts (IDC) for the Gusella and Lucantoni models was
calculated. The IDC (t [0]) provides a measure of the autocorrelation structure of the process
in the time window (0, t [0])
Ix = Lim Ix (t) t→∞
Where Ix is a function of the squared coefficient of variation (cx*cx) and the
autocorrelation function ρx (j). Also, Ix is the limiting value of the IDC.
This IDC at time t is the variance of the number of arrivals in an interval of length t divided
by the mean number of arrivals in t.
Figure 5.9: Comparison graph of the mean waiting time for different n_classes at lambda = 0.4
Mean Waiting Time Graph (lambda=0.4)
0,5
2,5
4,5
0,0001 0,001 0,01 0,1 1 t[0]/t[1]
mean waiting tim
e
Gusella @ n=1 Gusella @ n=10 Gusella @ n=100 Exact @ n=1 Exact @ n=10 Exact @ n=100

Name: Adeyemo Adesegun Adetayo Registration Number: E3383D 50
Högskolan Dalarna Tel.: 023 778 000 Röda vägen 3, 781 88 Fax: 023 778 050 Borlänge URL: http://www2.du.se
Figure 5.10: Comparison graph of the mean waiting time for different n_classes at lambda = 0.8
Figure 5.11: Comparison graph of the probability of delay for different n_classes at lambda = 0.4
Mean Waiting Time (lambda=0.8)
4
8
12
0,0001 0,001 0,01 0,1 1
t[0]/t[1]
mean waiting tim
e
Gusella @ n=1 Gusella @ n=10 Gusella @ n=100 Exact @ n=1 Exact @ n=10 Exact @ n=100
Probability of delay Graph (lambda=0.4)
0
20
40
60
0,0001 0,001 0,01 0,1 1 t[0]/t[1]
probability of delay
Gusella @n=1 Gusella @ n=10 Gusella @ n=100 Exact @ n=1 Exact @ n=10 Exact @ n=100
Name: Adeyemo Adesegun Adetayo Registration Number: E3383D 51
Högskolan Dalarna Tel.: 023 778 000 Röda vägen 3, 781 88 Fax: 023 778 050 Borlänge URL: http://www2.du.se
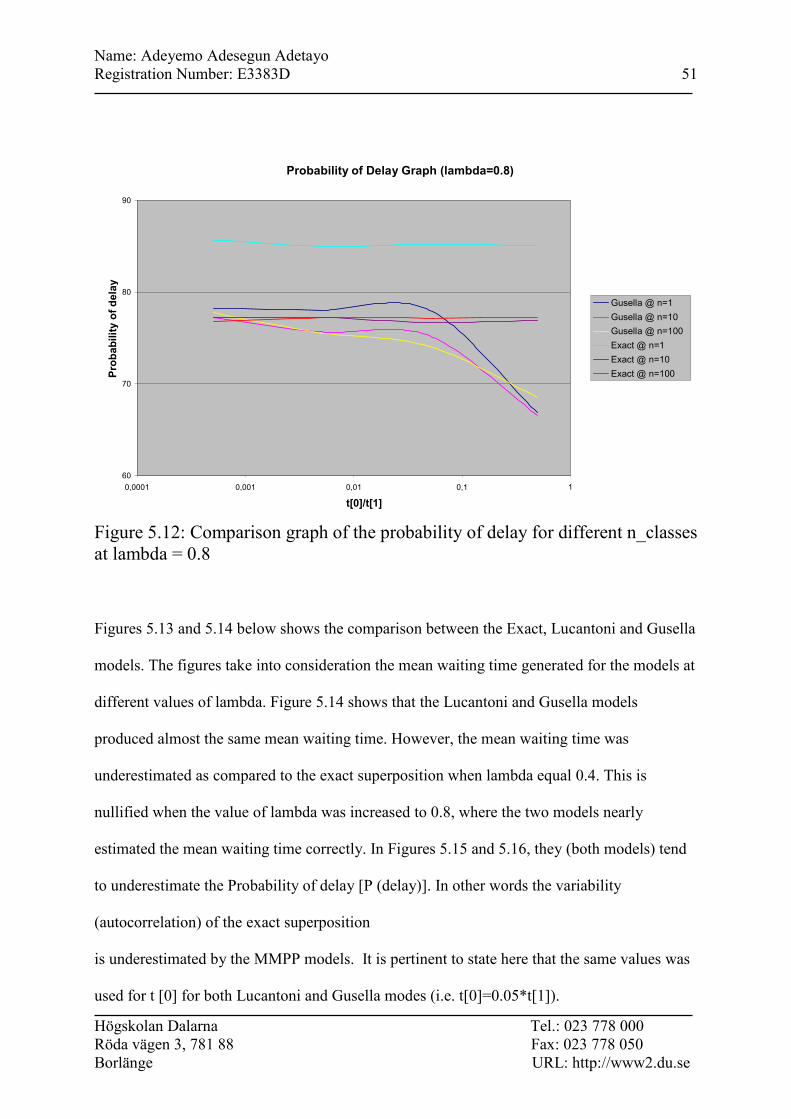
Figure 5.12: Comparison graph of the probability of delay for different n_classes at lambda = 0.8 Figures 5.13 and 5.14 below shows the comparison between the Exact, Lucantoni and Gusella
models. The figures take into consideration the mean waiting time generated for the models at
different values of lambda. Figure 5.14 shows that the Lucantoni and Gusella models
produced almost the same mean waiting time. However, the mean waiting time was
underestimated as compared to the exact superposition when lambda equal 0.4. This is
nullified when the value of lambda was increased to 0.8, where the two models nearly
estimated the mean waiting time correctly. In Figures 5.15 and 5.16, they (both models) tend
to underestimate the Probability of delay [P (delay)]. In other words the variability
(autocorrelation) of the exact superposition
is underestimated by the MMPP models. It is pertinent to state here that the same values was
used for t [0] for both Lucantoni and Gusella modes (i.e. t[0]=0.05*t[1]).
Probability of Delay Graph (lambda=0.8)
60
70
80
90
0,0001 0,001 0,01 0,1 1 t[0]/t[1]
Probability of delay
Gusella @ n=1 Gusella @ n=10 Gusella @ n=100 Exact @ n=1 Exact @ n=10 Exact @ n=100

Name: Adeyemo Adesegun Adetayo Registration Number: E3383D 52
Högskolan Dalarna Tel.: 023 778 000 Röda vägen 3, 781 88 Fax: 023 778 050 Borlänge URL: http://www2.du.se
Table 5.4: Comparison table for the three models at lambda =0.4 and lambda = 0.8
Lambda=0.4
Exact Lucantoni Gusella
M_W P_delay M_W P_delay M_W P_delay
2,33912 48,9584 2,04145 45,0564 2,64848 41,8638
1,34599 31,1027 0,917085 22,243 0,998122 22,9374
1,15826 27,4462 0,842343 20,3703 0,904592 20,7981
1,06279 25,5625 0,818337 19,8019 0,843503 19,9733
0,998314 24,2478 0,786271 18,9725 0,817008 19,2349
0,970723 23,5102 0,774222 18,7089 0,782547 18,5677
0,952535 23,092 0,766132 18,4314 0,786237 18,6035
0,935414 22,5507 0,760044 18,3405 0,792129 18,6901
0,924292 22,0978 0,74368 17,9574 0,769556 18,2651
0,902637 21,9182 0,731112 17,6729 0,767214 18,0925
0,894574 21,6858 0,729474 17,679 0,745091 17,8582
0,873528 21,0858 0,715121 17,3253 0,742779 17,6858
0,863257 20,9842 0,718206 17,4466 0,737353 17,5683
0,84702 20,5966 0,726593 17,4993 0,740394 17,7111
0,855224 20,4562 0,71732 17,3549 0,738107 17,6189
0,843566 20,2975 0,713714 17,2049 0,727849 17,4367
Lambda=0,8
Exact Lucantoni Gusella
M_W P-delay M_W P_delay M_W P_delay
11,889 85,1675 12,3494 85,4644 13,6988 78,595
9,48827 76,4449 9,51509 73,9787 9,44965 71,1526
8,38632 74,0991 8,48468 70,4712 8,9807 69,8455
8,35005 73,7356 8,61227 70,191 9,1776 69,0982
7,7874 72,7003 8,16258 69,5952 8,45674 69,1816
7,45409 71,9046 8,07045 69,3902 8,42645 68,9641
7,13584 71,6755 7,70128 68,3416 7,31863 67,7207
6,94668 70,5839 7,44819 68,448 7,63853 68,1539
6,87249 70,1178 7,69763 69,4035 7,32227 68,5479
6,91919 70,9086 7,00528 68,5502 7,07571 67,2926
6,47517 70,1805 7,24958 68,3779 6,90265 67,4836
6,84284 69,8317 6,61644 67,7206 6,95776 66,9527
6,53195 69,4921 6,76112 68,1322 6,80815 66,6547
6,41538 69,9575 6,20738 66,7079 7,01617 67,2318
6,22133 68,6156 6,2912 67,6278 7,02345 66,9803
6,20022 68,8123 5,96913 67,5775 6,37641 66,2737

Name: Adeyemo Adesegun Adetayo Registration Number: E3383D 53
Högskolan Dalarna Tel.: 023 778 000 Röda vägen 3, 781 88 Fax: 023 778 050 Borlänge URL: http://www2.du.se
Mean Waiting Time Graph at lambda = 0.4
0
1,5
3
0 20 40 60 80 100 120 140 160
Number of Events (n)
Mean W
aiting Tim
e
Exact
Lucantoni
Gusella
Figure 5.13: Comparison graph of the mean waiting time for the different models at lambda = 0.4
Mean Waiting Time Graph at lambda = 0.8
4
9
14
0 20 40 60 80 100 120 140 160
Number of Events (n)
Mean W
aiting Tim
e
Exact
Lucantoni
Gusella
Figure 5.14: Comparison graph of the mean waiting time for the different models at lambda = 0.8

Name: Adeyemo Adesegun Adetayo Registration Number: E3383D 54
Högskolan Dalarna Tel.: 023 778 000 Röda vägen 3, 781 88 Fax: 023 778 050 Borlänge URL: http://www2.du.se
Probability of delay Graph at lambda = 0.4
10
30
50
0 20 40 60 80 100 120 140 160
Number of Events (n)
Probability of delay
Exact
Lucantoni
Gusella
Figure 5.15: Comparison graph of the probability of delay for the different models at lambda = 0.4
Probability of delay Graph for lambda = 0.8 (%)
60
75
90
0 20 40 60 80 100 120 140 160
Number of Events (n)
Probability of delay
Exact
Lucantoni
Gusella
Figure 5.16: Comparison graph of the probability of delay for the different models at lambda = 0.8
Name: Adeyemo Adesegun Adetayo Registration Number: E3383D 55
Högskolan Dalarna Tel.: 023 778 000 Röda vägen 3, 781 88 Fax: 023 778 050 Borlänge URL: http://www2.du.se
5.3 RESULT ANALYSIS
From the above results of our superposition of renewal process by MMPP using the Gusella
and Lucantoni models (Fig. 5.12-5.15), the following conclusions can be deduced:
• When n_classes=1 we have a pure renewal process (no autocorrelation). This is why
the IDC is small.
• The exact model, which measures real traffic, gradually reduces the mean waiting time
and the probability of delay of the traffic.
• At lambda=0.4, the Gusella and Lucantoni models produces almost similar
performance value. At this value, they tend to underestimate the mean waiting time
and the probability of delay. In other words the variability (autocorrelation) of the
exact superposition is underestimated by the MMPP models.
• At lambda=0.4, the two models produces approximately 12% deviation in mean
waiting time and probability of delay from the Exact superposition model.
• At lambda=0.8, the Lucantoni and Gusella models produces a better result. The result
at this value of lambda almost matches that or the superposition of real traffic (Exact).
• In a G/M/1 system the probability of delay is given by ρ = λ/µ, which is easy to model.
• The accuracy of the MMPP model depends on t [0]. A small change in the value of n,
say 1 affects the performance result greatly because an increase in the value of n by 1
affects t[0] and t[2] greatly because of the power factor, i.e.
t [0]=0.0005*pow(10.0,n);
t [2]=0.0005*pow(10.0,n);
n = 0,1,2,3.
Which means an increase in n produces an increase in these time values.

Name: Adeyemo Adesegun Adetayo Registration Number: E3383D 56
Högskolan Dalarna Tel.: 023 778 000 Röda vägen 3, 781 88 Fax: 023 778 050 Borlänge URL: http://www2.du.se
• Autocorrelation of the superposition depend on n. When n (the variable number of
classes) increases, the autocorrelation value (IDC) reduces. This means there is an
inverse relation between the IDC and n.
• Small values of t [0] and t [2] give best result. A fairly large value of the parameter
produces a negative interarrival time which is not possible.
• Gusella and Lucantoni models are sensitive to the t[0] and t[2] values and the
variability in the traffic measurements.
• The autocorrelation (IDC measure) of the superposed process decreases as the number
of classes increases.
• The limiting IDC of the superposed process increases as the interarrival time (lambda)
increases, and vice-versa.
• Gusella and Lucantoni models give better results for large lambda which is clearly
evident in Figures 5.13 and 5.15. This means that for the two models to give optimal
result which is near that of a real traffic, the interarrival time of the event arrival
should be increased. Also, this is evident in the IDC curves, as the number of events
increases, we get a smooth curve.

Name: Adeyemo Adesegun Adetayo Registration Number: E3383D 57
Högskolan Dalarna Tel.: 023 778 000 Röda vägen 3, 781 88 Fax: 023 778 050 Borlänge URL: http://www2.du.se
6.0 CONCLUSIONS
This project has developed two MMPP-based models for the superposition of renewal arrival
process, which will be used in MDP-based call admission control and routing. The modeling
issue arose in the design of the call admission control (CAC) and routing function in
telecommunications network. Also, the superposition is due to splitting and merging of arrival
processes. The arrival process to each origin-destination node pair is splitted over many
alternative paths, and at each link the per-path arrival processes are merged to form a
superposed arrival process to the link. We used the Lucantoni and Gusella models as our
MMPP reference models. The Lucantoni and Gusella models were compared with the exact
model (superposition of simple renewal arrival process). The basis for comparison was the
mean waiting time and the probability of delay of packet arrival.
Estimating the times t[0] and t[2] proved a bit difficult. This was because estimating these
times requires precision of up to 0.0001. An inaccurate or deviation from the correct estimates
produces a negative MMPP parameter, which leads to segmentation error.
While our goal was to achieve similar values between the MMPP models and the
superposition of simple renewal arrival process, it was observed that the MMPP model
produces almost similar results but underestimated the mean waiting time and probability of
delay. They produced a much lower mean waiting time and probability of delay than the exact
superposition for the same number of classes and the same value of the interarrival time
(lambda). Also, it was noticed that an increase in the value of lambda makes our model yields
a near optimal result. Finally, our result shows that the Lucantoni model yields a lower mean
waiting time and probability of delay than the Gusella model.

Name: Adeyemo Adesegun Adetayo Registration Number: E3383D 58
Högskolan Dalarna Tel.: 023 778 000 Röda vägen 3, 781 88 Fax: 023 778 050 Borlänge URL: http://www2.du.se
Future research should examine how the Lucantoni and Gusella models can be improved on.
Further improvement in the modeling of a renewal arrival process can be achieved by:
• Understand the behaviour of the MMPP models with respect to lambda.
• Using of new statistical measures (e.g. peakedness, stationary-interval, and asymptotic
methods) for parameter matching.
• The modulated Poisson process could be replaced by a Weibull process.
• The number of states in the modulating Markov process can be increased.

Name: Adeyemo Adesegun Adetayo Registration Number: E3383D 59
Högskolan Dalarna Tel.: 023 778 000 Röda vägen 3, 781 88 Fax: 023 778 050 Borlänge URL: http://www2.du.se
7.0 REFERENCES
1.) Sriram K. and Whitt W. (1986): “Characterizing Superposition Arrival Processes in
Packet Multiplexers for Voice and Data”, IEEE Journal on Selected Areas in Communication, pp 833-846.
2.) Heffes H. and Lucantoni D. M. (1986): “A Markov Modulated Characterization of
Packetized Voice and Data Traffic and Related Statistical Multiplexer Performance”, IEEE Journal on Selected Areas in Communication, vol. 4, No. 6, pp856—868.
3.) Gusella R. (1991): “Characterizing the variability of Arrival Processes with indexes of
Dispersion”, IEEE Journal on Selected Areas in Communication, vol. 9, No. 2, pp203—211.
4.) Feldman A. (2000): “Characteristics of TCP Connection”, in Self-Similar Network
Traffic and Performance Evaluation, K. Park and W. Willinger, Eds. New York: Wiley. 5.) Kukuia G. (2005): “Modeling a Superposition of Renewal Arrival Processes”,
Unpublished MSc. Thesis, University of Dalarna, Sweden. 6.) Nordström E. (2005): “CAC and routing for MMPP call arrival process”, Unpublished
working paper, University of Dalarna, Sweden. 7.) Nagarajan R., Kurose J. F., Towsley D. (1991): “Approximation Techniques for
computing packet loss in finite-buffered voice multiplexers”, IEEE Journal on Selected Areas in Communications, Vol. 9, No. 3, pp 368--377.
8.) Baiocchi A. et al (1991): “Loss Performance Analysis of an ATM Multiplexer loaded
with High Speed ON-OFF Sources”, IEEE Journal on Selected Areas in Communications, Vol. 9, No. 3, pp 388--393.
9.) Whitt W. (1982): “Approximating a Point Process by a Renewal Process: Two Basic
Methods”, Operations Research, Vol. 30, pp 125 - 147. 10.) Niyato D., Hossain E., Alfa A. (2005): “Performance Analysis and Adaptive CAC in
Cellular Mobile Networks with time varying traffic”, Proceedings of the IEEE International Conference on Communications, Vol. 5, pp 3324-3328.
11.) Yavuz E. A., Leung V. C. M. (2005): “A Practical Method of Estimating Performance
Metrics of CAC Schemes in Wireless Mobile Networks”, Proceedings of the IEEE Wireless Communications and Networking Conference, Vol. 2, pp 1254-1259.
12.) http://www.cs.virginia.edu/~mngroup/projects/mpls/documents/thesis/node8.html 13.) http://www.cisco.com/univercd/cc/td/doc/cisintwk/ito_doc/atm.htm