modeling a distance-based preferential fare scheme for
TRANSCRIPT
sustainability
Article
Modeling a Distance-Based Preferential Fare Scheme forPark-and-Ride Services in a Multimodal Transport Network
Xinyuan Chen 1, Ruyang Yin 2,*, Qinhe An 3 and Yuan Zhang 4
�����������������
Citation: Chen, X.; Yin, R.; An, Q.;
Zhang, Y. Modeling a Distance-Based
Preferential Fare Scheme for
Park-and-Ride Services in a
Multimodal Transport Network.
Sustainability 2021, 13, 2644.
https://doi.org/10.3390/su13052644
Academic Editors: Richard Tay, Long
T. Truong and Samuel Chng
Received: 8 February 2021
Accepted: 25 February 2021
Published: 2 March 2021
Publisher’s Note: MDPI stays neutral
with regard to jurisdictional claims in
published maps and institutional affil-
iations.
Copyright: © 2021 by the authors.
Licensee MDPI, Basel, Switzerland.
This article is an open access article
distributed under the terms and
conditions of the Creative Commons
Attribution (CC BY) license (https://
creativecommons.org/licenses/by/
4.0/).
1 Department of Logistics and Maritime Studies, The Hong Kong Polytechnic University,Hung Hom, Hong Kong, China; [email protected]
2 Institute of Transport Studies, Department of Civil Engineering, Monash University,Clayton, VIC 3800, Australia
3 Jiangsu Key Laboratory of Urban ITS, Jiangsu Province Collaborative Innovation Center of Modern UrbanTraffic Technologies, School of Transportation, Southeast University, Nanjing 211189, China;[email protected]
4 School of Cyber Science and Engineering, Southeast University, Nanjing 211189, China;[email protected]
* Correspondence: [email protected]
Abstract: This paper investigates a distance-based preferential fare scheme for park-and-ride (P&R)services in a multimodal transport network. P&R is a sustainable commuting approach in largeurban areas where the service coverage rate of conventional public transport modes (e.g., train andbus) is poor/low. However, P&R services in many cities are less attractive compared to auto andother public transport modes, especially for P&R facilities sited far away from the city center. Toaddress this issue, this paper proposes a distance-based preferential fare scheme for P&R services inwhich travelers who choose the P&R mode get a discount. The longer the distance they travel bytrain, the better the concessional price they get. A multimodal transport network equilibrium modelwith P&R services is developed to evaluate the impacts of the proposed distance-based fare scheme.The travelers’ mode choice behavior is modeled by the multinomial logit (MNL) discrete choicemodel, and their route choice behavior is depicted by the user equilibrium condition. A mathematicalprogramming model is then built and subsequently solved by the outer approximation method.Numerical simulations demonstrate that the proposed distance-based preferential fare scheme caneffectively motivate travelers to use a P&R service and significantly enhance the transport network’sperformance.
Keywords: park-and-ride; congestion pricing; convex programming problem; combined modal splitand traffic assignment
1. Introduction
Public transport is widely acknowledged as a sustainable solution to traffic congestionsin urban areas. Many strategies have been proposed to promote the usage of publictransport services, such as optimizing the transit fare, itinerary, and service frequency [1],and offering flexible demand-responsive transit services [2]. However, public transport isstill less attractive compared to private vehicles, mainly because it has to balance the publictravel requirements. In other words, individual travel needs are difficult completely satisfy.Therefore, it is inevitable that public transport passengers will suffer low bus frequency,tortuous bus itinerary, longer travel time, and lack of door-to-door services [3], more or less.For instance, in Sydney, approximately 320,000 commuters travel to the central businessdistrict (CBD) each day, with an average commuting distance of 16.5 km [4]. People livingin suburbs, like Nowra (Bomaderry) and Wollongong, have to take approximately 1 h and50 min and 1 h and 30 min to get to the Sydney CBD, respectively, which requires thepassengers to wake up very early to be on time for work [5].
Sustainability 2021, 13, 2644. https://doi.org/10.3390/su13052644 https://www.mdpi.com/journal/sustainability

Sustainability 2021, 13, 2644 2 of 14
P&R services—which allow commuters to drive from home/outer suburbs where thetraffic is free, park their cars in a P&R parking site when they approach the city center, andride the rails/buses to the CBD or other downtown areas—have become a potential solutionto reduce individuals’ travel time, improve their travel quality, and meanwhile promotepublic transport services [3]. P&R services can be generally categorized into two types:bus-based and rail-based. Bus-based P&R services are widely applied in areas withoutrail lines, such as small cities in the UK and the US. In a metropolis with an advancedrail system, rail-based P&R is superior to bus-based P&R due to a higher level of safety,comfortability, and reliability. Therefore, this study focuses on rail-based P&R services.Existing studies mainly focus on the sitting and sizing of rail-based P&R facilities. However,constructing new P&R sites is only suitable for a developing city without sufficient P&Rfacilities. For an urban area with developed P&R facilities, a more feasible and sustainablesolution is providing fare incentives for P&R users.
A widely adopted economic incentive strategy is exempting parking fees for P&Rusers. However, this strategy is still inflexible and may result in the overutilization of P&Rsites in the outer edges of the city center, and poor utilization of P&R facilities in outersuburb areas. We note that this phenomenon is not sustainable because the majority of tripsof P&R users are still made by driving. To motivate P&R users to choose upstream P&Rfacilities and increase the usage of the “ride” component, this paper proposes and examinesa distance-based preferential fare scheme for P&R services. Namely, a train fare discountscheme is provided for P&R users. The longer a P&R user rides, the more of a concessionalprice he/she will get. Existing surveys and studies reveal that P&R schemes should becarefully planned and managed, since arbitrarily planned and implemented P&R incentiveschemes may increase the total travel time or total vehicle miles in the network. Theinfluence of P&R schemes should be systematically analyzed and predicted over the wholetransport network. Network analysis of P&R schemes endogenously involves the modalsplit as well as traffic assignment [3]. Therefore, this paper aims to build a multimodaltransport network equilibrium model with a P&R system and a distance-based preferentialfare charge scheme.
In summary, the purpose of this work is to investigate the distance-based preferentialfare scheme for P&R services in an urban transport network. To quantitatively evaluatethe influences of P&R schemes over the whole transport network, this study builds amultimodal network equilibrium model, which is formulated as a convex programmingproblem and solved by the outer approximation method. Two specific distanced-basedpreferential fare schemes are considered and evaluated in the numerical simulations.
The remainder of this paper is organized as follows. Section 2 summarizes the relatedliterature. In Section 3, the specific distance-based preferential fare charge scheme isintroduced. A mathematical optimization model and its solution algorithm are proposedand explained in Section 4. Section 5 presents two illustrative examples to validate theproposed model and solution method. Section 6 concludes this study.
2. Literature Review
Promoting sustainable transport modes and analysis tools is a significant researchfield in transportation [6–9]. P&R is proposed to mitigate traffic congestion in the citycenter, reduce vehicle miles traveled, and promote sustainable public transport modes.Meanwhile, from the perspective of individual travelers, it also reduces their travel costs byfacilitating modal shifts. P&R is expected to expand the catchment of transit, concentratethe transit travel demand, and alleviate parking demand in the city center. However, thepotential of P&R has not been comprehensively understood. Some studies show that P&Rmay also bring some negative effects on the urban transport system [10]. Previous studiesof P&R can be generally classified into two categories.
The first type of existing studies mainly focuses on single or multiple P&R facilities,such as identifying the influence factors of modal/P&R site choice [11–13] and the uti-lization of P&R facilities [14–16]. Cornejo and Perez [11] evaluated the potential of P&R

Sustainability 2021, 13, 2644 3 of 14
facilities based on the site location, bus service reliability, user demand, and cost estima-tion. Pang and Khani [12] focused on commuters’ P&R location choices by using mixedlogit models and adding interaction terms in the utility functions. Webb and Khani [13]estimated a nested logit discrete choice model from on-board survey data for P&R users’station choice. Stieffenhofer and Barton [15] proposed a person-efficiency measure of P&Rsites, which is claimed as a more straightforward method compared to the occupancy ofparked vehicles. Zhao and Chen [16] explored the influence factors of utilization ratesof P&R facilities, including the land-use features, roadway design features, transit rider-ship, sociodemographic attributes, travel characteristics, policy tools, gasoline prices, andweather conditions. Huang and Zhu [14] studied the pertinent factors of traveler choicein Melbourne, Australia, with the assistance of a cumulative logistic regression model.Ying and Xiang [17] surveyed 524 drivers in Shanghai and concluded that road congestionand parking policies were the main factors of concern to residents. Another group ofstudies explored the influence of income, job, age, gender, and environmental awareness,and concluded that income, job, age, and gender are major factors influencing travel deci-sions [18,19]. A common methodology of their studies is to collect data from surveys andquestionnaires and apply statistical methods, like logit-based discrete choice models. Theinfluence factors of P&R sites are various, depending on specific environments.
Another class of research is that estimating the influence of P&R services on thetransport network, where a network equilibrium model is established [3,10,20–22]. Com-muters’ travel choice behavior on the transport network is explicitly considered in thistype of study [23,24]. Fernandez and Cea [25] proposed an initial work to evaluate P&Rservices over the whole transport network. Later, Li and Lam [10] and Lam and Li [26]extended this to a stochastic case where a logit-based discrete choice model was adopted.Liu and Chen [3] further made use of the recent advance in discrete choice models, wherea cross-nest-logit model was adopted to measure the heavy overlap between travel modes.Chen and Kim [27] considered environmental protection requirements and analyzed theimpact of P&R with the nonlinear capacity-constrained multimodal network equilibriummodel. With regards to some other studies (e.g., Wang and Yang [28], Liu and Huang [21],Wang and Du [29], Du and Wang [30]), their focus was on P&R schemes in a linear corri-dor/network. Wang and Yang [28] investigated the optimal location and pricing of a P&Rfacility in a linear city where residences are uniformly distributed from the center to theexogenous city boundary, and all trips are from home to the center. Liu and Huang [21]proposed a deterministic continuum equilibrium model to characterize commuters’ modalchoices and park-and-ride transfer behaviors. Wang and Du [29] studied travelers’ modalchoice in a railway–highway system with single park-and-ride service on a linear travelcorridor. Du and Wang [30] further extended their previous work to more general situa-tions in a linear travel corridor with continuous P&R facilities. Heterogeneous commutersand travel time reliability are considered in model formulation.
Most of the previous studies based on the urban transport network focus on estimatingand optimizing sitting, sizing, and parking fees of P&R facilities (e.g., Chen and Liu [31],Liu and Chen [3], Song and He [32], Wang and Yang [28], Liu and Huang [21], Wang andMeng [33], Wang and Meng [34]). Wang and Yang [28] considered the location and pricingof P&R facilities in a linear monocentric city. Liu and Huang [21] studied the relationshipbetween travelers’ behavior and P&R parking pricing strategy in a linear monocentriccity. Wang and Meng [33] and Wang and Meng [34] studied the optimal parking feescheme over a whole transport network in which the travelers’ behavior was modeled by adynamic transport equilibrium model. Chen and Liu [31] considered the optimal locationand capacity design problem of rail-based P&R services. Liu and Chen [3] proposed ageneral P&R service mode (i.e., remote P&R) and optimize the location and capacity ina multimodal transport network. Song and He [32] proposed an integrated planningapproach for P&R facilities and transit services. Compared with the aforementionedstudies, this paper aims to investigate the impact of a distance-based fare discount schemefor P&R users over the whole transport network.

Sustainability 2021, 13, 2644 4 of 14
3. Problem Statement
In this section, we briefly introduce the mathematical formulations and discuss somenecessary properties of the model. To analyze the impact of a distance-based concessionalpricing scheme, we first build a mathematical model for the multimodal equilibriumflows. For readers’ convenience, the major symbols used in the model can be found inAppendix A.
Consider a strongly connected multimodal transport network G = (N, A), where Ndenotes the set of nodes and A denotes the set of directed links. The origin and destination(OD) pair in the network is denoted as (o, d) and the set of OD pairs is denoted as W. Letva denote the flow on link a, f od,m
k denote the flow on path k under mode m between ODpair (o, d), and qod denote the total travel demand between OD pair (o, d), which is a non-negative value. Travelers will choose various travel modes; therefore, they can be furthercategorized into three types: (i) travelers who will use private cars only, (ii) travelers whowill take rail only, and (iii) travelers who will choose P&R services. Let qod,c, qod,r, and qod,p
represent the travel demands of the above three categories, respectively. Then, accordingto the demand conservation condition, we have qod,c + qod,r + qod,p = qod. Let Mod denotethe set of all potential travel modes between OD pair (o, d) (e.g., Mod = {a, r, p}), and wehave the following:
∑m∈Mod
qod,m = qod, ∀od ∈W. (1)
∑m∈Mod
qod,m = qod, ∀od ∈W. (2)
After choosing their travel mode, travel demands should also satisfy the flow conser-vation condition. Let Kod,m denote the set of paths under mode m between OD pair (o, d).We then have the following:
∑k∈Kod,m
f od,mk = qod,m, ∀od ∈W, m ∈ Mod. (3)
When the path flows accumulate on the network links, we can get the link flow whichis expressed as the following:
∑od∈W
∑m∈Mm
∑k∈Kod,m
f od,mk δod,m
a,k = va, ∀a ∈ A (4)
where δod,ma,k = 1 if path k passes link a, and δod,m
a,k = 0 otherwise. Meanwhile, travel demand
qod,m and path flow f od,mk are non-negative:
qod,m ≥ 0, ∀od ∈W, m ∈ Mod (5)
f od,mk ≥ 0, ∀od ∈W, m ∈ Mod, k ∈ Kod,m. (6)
3.1. Travel Time, Train Fare, and Generalized Path Travel Time
The set of links A consists of three sub-sets: set of road links Aa, set of rail links Ar,and set of P&R links Ap. The multimodal transport network can be further divided into aroad subnetwork Ga(Na, Aa) and a rail subnetwork Gr(Nr, Ar), where Na and Nr denotethe node set on the auto and rail sub-network, respectively. The P&R links are used toconnect the road links and rail links, so that the travelers can transfer to the urban railsystem and go to their workplace in the morning, and switch back to their private cars inthe evening.
The travel impedance of travelers includes the time-based value (the travel time onroad links, the in-carriage travel time, and the transfer time from driving to riding) and themonetary-based value (train fare) which can be converted into time-based value throughthe parameter of the value of time.

Sustainability 2021, 13, 2644 5 of 14
3.1.1. Generalized Travel Cost of Private Vehicles
The travel impedance of travelers who choose private cars is the travel time spent onroad a ∈ Aa, which is flow dependent. We assume that the link travel time ta, ∀a ∈ Aa is acontinuously differentiable and monotonically increasing function of the link flow va. Inthis section, we make the following assumptions: (i) The link travel time functions on autolinks are separable. Namely, ta is a function of its own flow va. (ii) The path travel time ck
is additive to its links. Namely, ck = ∑a∈Aa taδod,ca,k , where δod,c
a,k = 1 if path k uses link a, and
δod,ca,k = 0 otherwise.
The path travel impedance cod,ck of private vehicle drivers can be expressed as
cod,ck = ∑
a∈Aata(va)δ
od,ca,k , ∀od ∈W, k ∈ Kod,c. (7)
In many urban areas, drivers have to pay for parking in the CBD or downtown areas.Let τp denote the parking fare; then, the generalized travel impedance cod,c
k of privatevehicle drivers can be expressed as
cod,ck = ∑
a∈Aata(va)δ
od,ca,k +
τp
µ, ∀od ∈W, k ∈ Kod,c (8)
where µ represents the value of time, which is usually assumed to be a random variableacross the whole population of travelers.
3.1.2. Generalized Travel Cost of Rail Services
The travel time ta, ∀a ∈ Ar on rail links is more stable and reliable than the traveltime on roads. However, during peak hours, excessively high-demand board/light in thecarriage may cause boarding/lighting congestion [4]. Therefore, in this study, we assumethat ta, ∀a ∈ Ar is also a continuously differentiable and monotonically increasing functionof its link flow va. The train fares are usually distance-based. Let dod,r
k denote the length ofa path k under the rail mode and it can be express as
dod,rk = ∑
a∈Arlaδod,r
a,k , ∀od ∈W, k ∈ Kod,r (9)
where la is the length of link a.The distance-based train fare scheme can be represented by a function of the traveled
distance of a traveler, denoted by φ(d). The specific expression of φ(d) may be variousin the real world. However, some general properties should be held (i.e., φ(d) should bepositive and non-decreasing [31]). In this study, we consider the kilometer-based train farescheme which is a specific case of φ(d).
φ(d) = ρd (10)
where ρ is the slope of the kilometer-based train fare function.The overall travel impedance of rail riders can be expressed as a combination of travel
time and train fare:
cod,rk = ∑
a∈Arta(va)δ
od,ra,k +
ρdod,rkµ
, ∀od ∈W, k ∈ Kod,r (11)
where cod,rk is a generalized travel cost on path k under rail mode between OD pair (o, d).
3.1.3. Generalized Travel Cost of P&R Services
The travel impedance of P&R services includes the travel time on the road, the timespent on parking, waiting, boarding of a train, in-vehicle travel time, as well as the train

Sustainability 2021, 13, 2644 6 of 14
fares. In this study, we assume that the parking fee for P&R users is exempted, which isa common case in the majority of P&R services. The time spent on parking, waiting, andboarding a train is flow dependent. Therefore, the link travel time ta(va), ∀a ∈ Ap on P&Rlinks is assumed to be a continuously differentiable and monotonically increasing functionof the link flow. When the travelers switch to the train system, P&R users will pay for thetrain fares. Therefore, the general travel cost of a P&R user between OD pair (o, d) whochoose path k can be expressed as
cod,pk = ∑
a∈Ata(va)δ
od,pa,k +
ρdod,prkµ
, ∀od ∈W, k ∈ Kod,p (12)
where dod,prk denotes the length of path segments on the rail lines.
In many situations, to motivate travelers using P&R facilities, transport authoritiesmay provide a fare discount for P&R users. However, arbitrary implementation of fareexempting or discounting scheme for all P&R users may result in over-congestion of P&Rspace in some sites and a lower utilization rate of parking space in other spots. In this study,to better promote the P&R services, we propose a new fare scheme (i.e., a distance-basedP&R preferential fare scheme). The concessional price depends on the distance of P&Rsites to the city center, which could address the uneven utilization rate of P&R sites. Thespecific expression of the integrated fare scheme can be expressed as follows:
cod,pk = ∑
a∈Ata(va)δ
od,pa,k +
β(
dod,prk
)µ
, ∀od ∈W, k ∈ Kod,p (13)
where β(
dod,prk
)is the distance-based P&R preferential fare function. Travelers who choose
the P&R scheme can have monetary amenities. The longer the distance they travel by train,the better the concessional price they will get. In this way, P&R users will be encouraged toutilize the P&R spots in outer suburbs.
4. Combined Modal Split and Traffic Assignment
The travel decisions of transport network users include mode choice and route choice.Therefore, to systematically evaluate the impact of the integrated fare scheme over thewhole urban transport network, a multimodal transport network equilibrium model isrequired. In the literature, various transport network equilibrium models have been appliedto access the P&R facilities over the transport network, such as the probit-based stochasticuser equilibrium model [18], and dynamic user equilibrium model [24]. However, thesestudies mainly focus on modeling network users’ route choice behavior. In this study, weadopt a combined modal split and traffic assignment model (CMSTA) to better depict thenetwork users’ mode and route choice behavior. We apply the multinomial logit (MNL)discrete choice model to reflect the randomness of travelers’ mode choice behavior. Thedistance-based train fare scheme is generally non-additive to its links. Considering the railnetwork has a very limited size, it is easy to enumerate all the simple paths between theP&R sites to destinations and the simple path of the train mode. Meng et al. [31] proposeda network transformation method that uses dummy links to replace these paths. In thissection, we apply their method. Then, the CMSTA can be formulated as a link-basedmathematical programming problem, which can be written as follows:
minZ = ∑a∈A
∫ va0 ta(x)dx + ∑
od∈W∑
m∈Mod
1θ qod,m ln
(qod,m
)+ ∑
a∈Arva(ρda,r)/µ+ ∑
a∈Apva β(da,pr)/µ
(14)
subject to constraints (1)–(5), where Ar is the set of dummy links to replace the paths of trainmode, Ap is a set of dummy links to replace the paths between P&R sites to destinations,
Sustainability 2021, 13, 2644 7 of 14
da,r denotes the travel distance on link a ∈ Ar by rail mode, and da,pr denotes the traveldistance on link a ∈ Ap by P&R mode.
We note that the nonlinear terms in the proposed model can be approximated/linearizedby the tangent lines and tangent planes and then transformed into a linear programmingproblem which can be solved by state-of-the-art solvers [32]. Therefore, we use the com-bined tangent lines and tangent planes approximation method to address this model.
5. Numerical Simulations
In this section, we perform several numerical simulations to verify the applicabilityand effectiveness of the proposed model and solution method.
5.1. A Linear Corridor
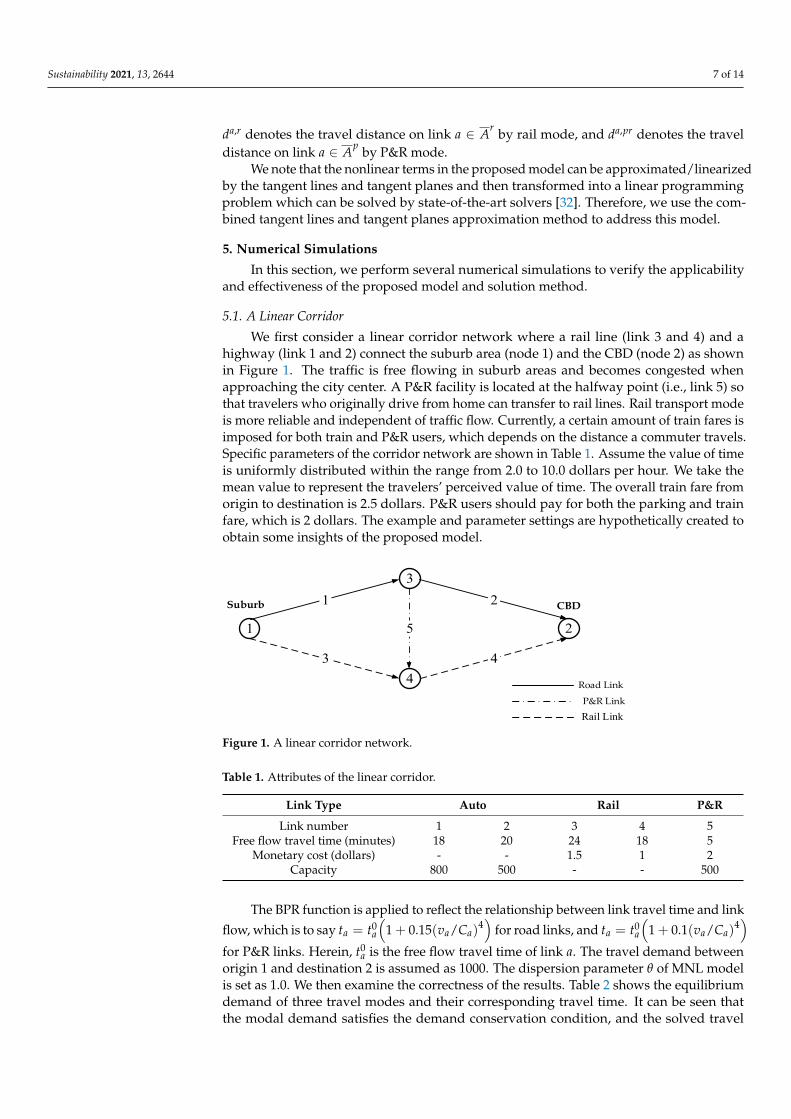
We first consider a linear corridor network where a rail line (link 3 and 4) and ahighway (link 1 and 2) connect the suburb area (node 1) and the CBD (node 2) as shownin Figure 1. The traffic is free flowing in suburb areas and becomes congested whenapproaching the city center. A P&R facility is located at the halfway point (i.e., link 5) sothat travelers who originally drive from home can transfer to rail lines. Rail transport modeis more reliable and independent of traffic flow. Currently, a certain amount of train fares isimposed for both train and P&R users, which depends on the distance a commuter travels.Specific parameters of the corridor network are shown in Table 1. Assume the value of timeis uniformly distributed within the range from 2.0 to 10.0 dollars per hour. We take themean value to represent the travelers’ perceived value of time. The overall train fare fromorigin to destination is 2.5 dollars. P&R users should pay for both the parking and trainfare, which is 2 dollars. The example and parameter settings are hypothetically created toobtain some insights of the proposed model.
Sustainability 2021, 13, x FOR PEER REVIEW 7 of 15
( ) ( )( ) ( )
, ,
0
, ,
1min + ln
+
θρ μ β μ
∈ ∈ ∈
∈ ∈
=
+
a
od
r p
v od m od ma
a A od W m M
a r a pra a
a A a A
Z t x dx q q
v d v d (14)
subject to constraints (1)–(5), where rA is the set of dummy links to replace the paths of train mode, pA is a set of dummy links to replace the paths between P&R sites to desti-nations, ,a rd denotes the travel distance on link ra A∈ by rail mode, and ,a prd denotes the travel distance on link pa A∈ by P&R mode.
We note that the nonlinear terms in the proposed model can be approximated/line-arized by the tangent lines and tangent planes and then transformed into a linear pro-gramming problem which can be solved by state-of-the-art solvers [32]. Therefore, we use the combined tangent lines and tangent planes approximation method to address this model.
5. Numerical Simulations In this section, we perform several numerical simulations to verify the applicability
and effectiveness of the proposed model and solution method.
5.1. A Linear Corridor We first consider a linear corridor network where a rail line (link 3 and 4) and a high-
way (link 1 and 2) connect the suburb area (node 1) and the CBD (node 2) as shown in Figure 1. The traffic is free flowing in suburb areas and becomes congested when ap-proaching the city center. A P&R facility is located at the halfway point (i.e., link 5) so that travelers who originally drive from home can transfer to rail lines. Rail transport mode is more reliable and independent of traffic flow. Currently, a certain amount of train fares is imposed for both train and P&R users, which depends on the distance a commuter travels. Specific parameters of the corridor network are shown in Table 1. Assume the value of time is uniformly distributed within the range from 2.0 to 10.0 dollars per hour. We take the mean value to represent the travelers’ perceived value of time. The overall train fare from origin to destination is 2.5 dollars. P&R users should pay for both the parking and train fare, which is 2 dollars. The example and parameter settings are hypothetically cre-ated to obtain some insights of the proposed model.
1 2
3
4
1 2
3 4
5
Suburb CBD
Road Link
P&R Link
Rail Link Figure 1. A linear corridor network.
Table 1. Attributes of the linear corridor.
Link Type Auto Rail P&R Link number 1 2 3 4 5
Free flow travel time (minutes) 18 20 24 18 5 Monetary cost (dollars) - - 1.5 1 2
Capacity 800 500 - - 500
Figure 1. A linear corridor network.
Table 1. Attributes of the linear corridor.
Link Type Auto Rail P&R
Link number 1 2 3 4 5Free flow travel time (minutes) 18 20 24 18 5
Monetary cost (dollars) - - 1.5 1 2Capacity 800 500 - - 500
The BPR function is applied to reflect the relationship between link travel time and linkflow, which is to say ta = t0
a
(1 + 0.15(va/Ca)
4)
for road links, and ta = t0a
(1 + 0.1(va/Ca)
4)
for P&R links. Herein, t0a is the free flow travel time of link a. The travel demand between
origin 1 and destination 2 is assumed as 1000. The dispersion parameter θ of MNL modelis set as 1.0. We then examine the correctness of the results. Table 2 shows the equilibriumdemand of three travel modes and their corresponding travel time. It can be seen thatthe modal demand satisfies the demand conservation condition, and the solved travel
Sustainability 2021, 13, 2644 8 of 14
time satisfies the MNL modal choice condition. The modal split pattern can be taken as abenchmark to reflect the influence of distance-based preferential fare scheme.
Table 2. Equilibrium modal travel demand time.
Modes Travel Demand Equilibrium Travel Time
Auto 544.51 43.298Rail 163.81 44.5P&R 91.68 26.0
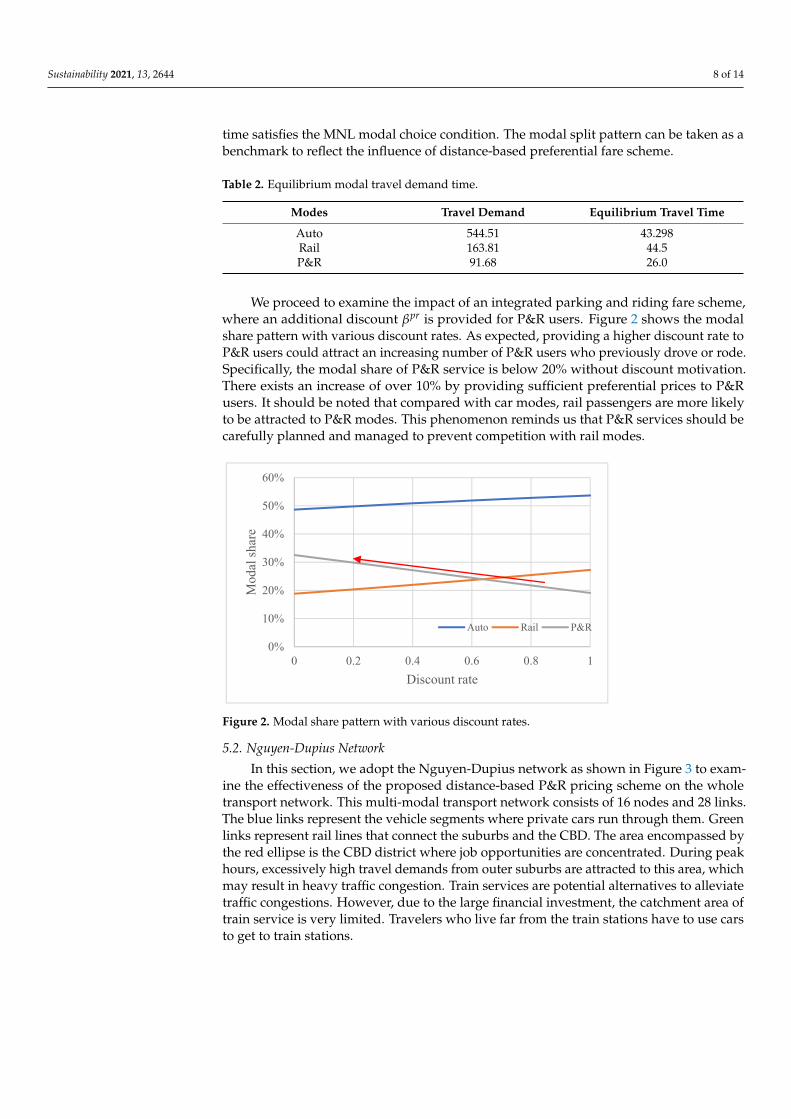
We proceed to examine the impact of an integrated parking and riding fare scheme,where an additional discount βpr is provided for P&R users. Figure 2 shows the modalshare pattern with various discount rates. As expected, providing a higher discount rate toP&R users could attract an increasing number of P&R users who previously drove or rode.Specifically, the modal share of P&R service is below 20% without discount motivation.There exists an increase of over 10% by providing sufficient preferential prices to P&Rusers. It should be noted that compared with car modes, rail passengers are more likelyto be attracted to P&R modes. This phenomenon reminds us that P&R services should becarefully planned and managed to prevent competition with rail modes.
Sustainability 2021, 13, x FOR PEER REVIEW 8 of 15
The BPR function is applied to reflect the relationship between link travel time and
link flow, which is to say ( )( )40 1 0.15a a a at t v C= + for road links, and
( )( )40 1 0.1a a a at t v C= + for P&R links. Herein, 0at is the free flow travel time of link a .
The travel demand between origin 1 and destination 2 is assumed as 1000. The dispersion parameter θ of MNL model is set as 1.0. We then examine the correctness of the results. Table 2 shows the equilibrium demand of three travel modes and their corresponding travel time. It can be seen that the modal demand satisfies the demand conservation con-dition, and the solved travel time satisfies the MNL modal choice condition. The modal split pattern can be taken as a benchmark to reflect the influence of distance-based pref-erential fare scheme.
Table 2. Equilibrium modal travel demand time.
Modes Travel Demand Equilibrium Travel Time Auto 544.51 43.298 Rail 163.81 44.5 P&R 91.68 26.0
We proceed to examine the impact of an integrated parking and riding fare scheme, where an additional discount prβ is provided for P&R users. Figure 2 shows the modal share pattern with various discount rates. As expected, providing a higher discount rate to P&R users could attract an increasing number of P&R users who previously drove or rode. Specifically, the modal share of P&R service is below 20% without discount motiva-tion. There exists an increase of over 10% by providing sufficient preferential prices to P&R users. It should be noted that compared with car modes, rail passengers are more likely to be attracted to P&R modes. This phenomenon reminds us that P&R services should be carefully planned and managed to prevent competition with rail modes.
Figure 2. Modal share pattern with various discount rates.
5.2. Nguyen-Dupius Network In this section, we adopt the Nguyen-Dupius network as shown in Figure 3 to exam-
ine the effectiveness of the proposed distance-based P&R pricing scheme on the whole transport network. This multi-modal transport network consists of 16 nodes and 28 links. The blue links represent the vehicle segments where private cars run through them. Green links represent rail lines that connect the suburbs and the CBD. The area encompassed by the red ellipse is the CBD district where job opportunities are concentrated. During peak hours, excessively high travel demands from outer suburbs are attracted to this area,
0%
10%
20%
30%
40%
50%
60%
0 0.2 0.4 0.6 0.8 1
Mod
al sh
are
Discount rate
Auto Rail P&R
Figure 2. Modal share pattern with various discount rates.
5.2. Nguyen-Dupius Network
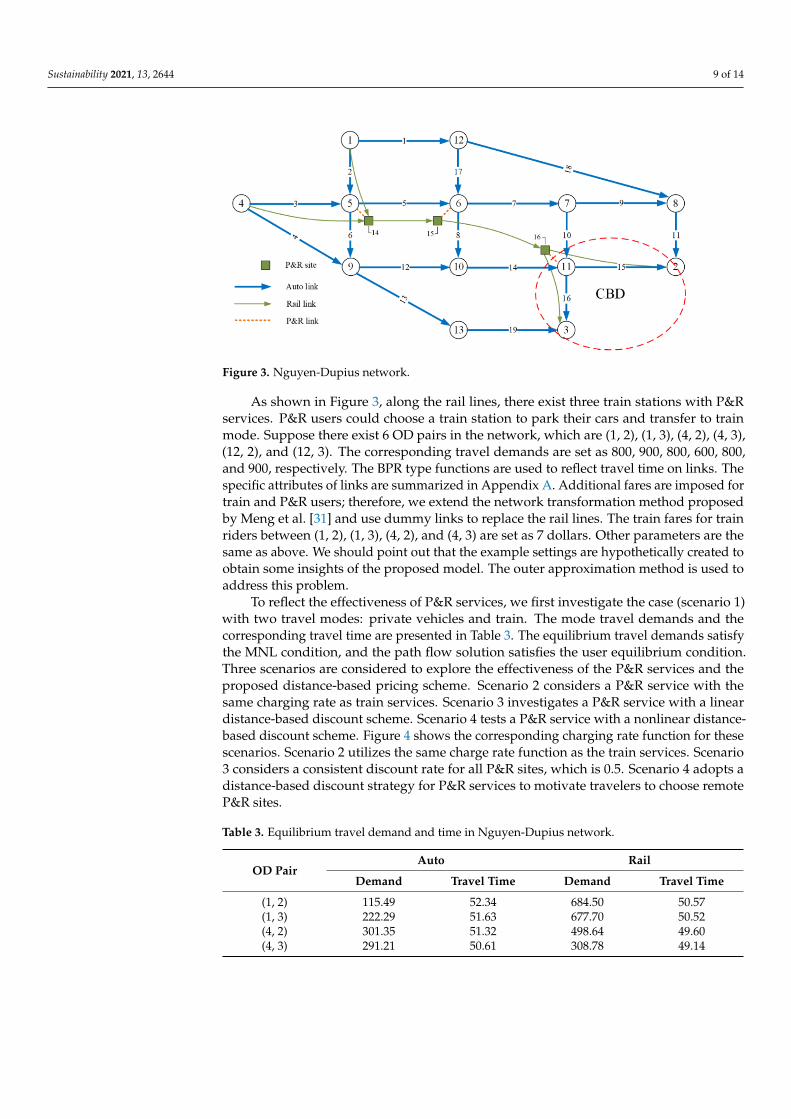
In this section, we adopt the Nguyen-Dupius network as shown in Figure 3 to exam-ine the effectiveness of the proposed distance-based P&R pricing scheme on the wholetransport network. This multi-modal transport network consists of 16 nodes and 28 links.The blue links represent the vehicle segments where private cars run through them. Greenlinks represent rail lines that connect the suburbs and the CBD. The area encompassed bythe red ellipse is the CBD district where job opportunities are concentrated. During peakhours, excessively high travel demands from outer suburbs are attracted to this area, whichmay result in heavy traffic congestion. Train services are potential alternatives to alleviatetraffic congestions. However, due to the large financial investment, the catchment area oftrain service is very limited. Travelers who live far from the train stations have to use carsto get to train stations.
Sustainability 2021, 13, 2644 9 of 14
Sustainability 2021, 13, x FOR PEER REVIEW 9 of 15
which may result in heavy traffic congestion. Train services are potential alternatives to alleviate traffic congestions. However, due to the large financial investment, the catch-ment area of train service is very limited. Travelers who live far from the train stations have to use cars to get to train stations.
Figure 3. Nguyen-Dupius network.
As shown in Figure 3, along the rail lines, there exist three train stations with P&R services. P&R users could choose a train station to park their cars and transfer to train mode. Suppose there exist 6 OD pairs in the network, which are (1, 2), (1, 3), (4, 2), (4, 3), (12, 2), and (12, 3). The corresponding travel demands are set as 800, 900, 800, 600, 800, and 900, respectively. The BPR type functions are used to reflect travel time on links. The specific attributes of links are summarized in Appendix A. Additional fares are imposed for train and P&R users; therefore, we extend the network transformation method pro-posed by Meng et al. [31] and use dummy links to replace the rail lines. The train fares for train riders between (1, 2), (1, 3), (4, 2), and (4, 3) are set as 7 dollars. Other parameters are the same as above. We should point out that the example settings are hypothetically cre-ated to obtain some insights of the proposed model. The outer approximation method is used to address this problem.
To reflect the effectiveness of P&R services, we first investigate the case (scenario 1) with two travel modes: private vehicles and train. The mode travel demands and the cor-responding travel time are presented in Table 3. The equilibrium travel demands satisfy the MNL condition, and the path flow solution satisfies the user equilibrium condition. Three scenarios are considered to explore the effectiveness of the P&R services and the proposed distance-based pricing scheme. Scenario 2 considers a P&R service with the same charging rate as train services. Scenario 3 investigates a P&R service with a linear distance-based discount scheme. Scenario 4 tests a P&R service with a nonlinear distance-based discount scheme. Figure 4 shows the corresponding charging rate function for these scenarios. Scenario 2 utilizes the same charge rate function as the train services. Scenario 3 considers a consistent discount rate for all P&R sites, which is 0.5. Scenario 4 adopts a distance-based discount strategy for P&R services to motivate travelers to choose remote P&R sites.
Table 3. Equilibrium travel demand and time in Nguyen-Dupius network.
OD Pair Auto Rail
Demand Travel Time Demand Travel Time (1, 2) 115.49 52.34 684.50 50.57 (1, 3) 222.29 51.63 677.70 50.52 (4, 2) 301.35 51.32 498.64 49.60
Figure 3. Nguyen-Dupius network.
As shown in Figure 3, along the rail lines, there exist three train stations with P&Rservices. P&R users could choose a train station to park their cars and transfer to trainmode. Suppose there exist 6 OD pairs in the network, which are (1, 2), (1, 3), (4, 2), (4, 3),(12, 2), and (12, 3). The corresponding travel demands are set as 800, 900, 800, 600, 800,and 900, respectively. The BPR type functions are used to reflect travel time on links. Thespecific attributes of links are summarized in Appendix A. Additional fares are imposed fortrain and P&R users; therefore, we extend the network transformation method proposedby Meng et al. [31] and use dummy links to replace the rail lines. The train fares for trainriders between (1, 2), (1, 3), (4, 2), and (4, 3) are set as 7 dollars. Other parameters are thesame as above. We should point out that the example settings are hypothetically created toobtain some insights of the proposed model. The outer approximation method is used toaddress this problem.
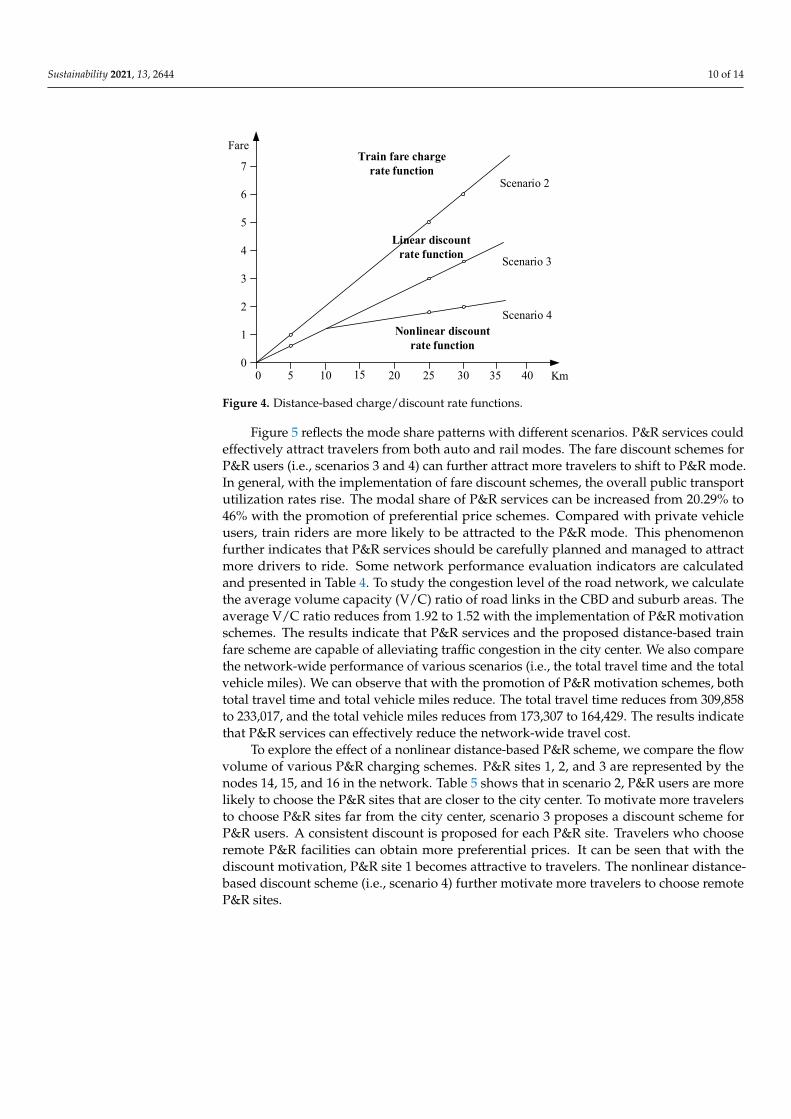
To reflect the effectiveness of P&R services, we first investigate the case (scenario 1)with two travel modes: private vehicles and train. The mode travel demands and thecorresponding travel time are presented in Table 3. The equilibrium travel demands satisfythe MNL condition, and the path flow solution satisfies the user equilibrium condition.Three scenarios are considered to explore the effectiveness of the P&R services and theproposed distance-based pricing scheme. Scenario 2 considers a P&R service with thesame charging rate as train services. Scenario 3 investigates a P&R service with a lineardistance-based discount scheme. Scenario 4 tests a P&R service with a nonlinear distance-based discount scheme. Figure 4 shows the corresponding charging rate function for thesescenarios. Scenario 2 utilizes the same charge rate function as the train services. Scenario3 considers a consistent discount rate for all P&R sites, which is 0.5. Scenario 4 adopts adistance-based discount strategy for P&R services to motivate travelers to choose remoteP&R sites.
Table 3. Equilibrium travel demand and time in Nguyen-Dupius network.
OD PairAuto Rail
Demand Travel Time Demand Travel Time
(1, 2) 115.49 52.34 684.50 50.57(1, 3) 222.29 51.63 677.70 50.52(4, 2) 301.35 51.32 498.64 49.60(4, 3) 291.21 50.61 308.78 49.14
Sustainability 2021, 13, 2644 10 of 14
Sustainability 2021, 13, x FOR PEER REVIEW 10 of 15
(4, 3) 291.21 50.61 308.78 49.14
Km
Fare
5 15 20 25 30 3500
1
2
3
4
5
6
7Train fare charge
rate function
Linear discount rate function
Nonlinear discount rate function
10
Scenario 2
Scenario 3
Scenario 4
40 Figure 4. Distance-based charge/discount rate functions.
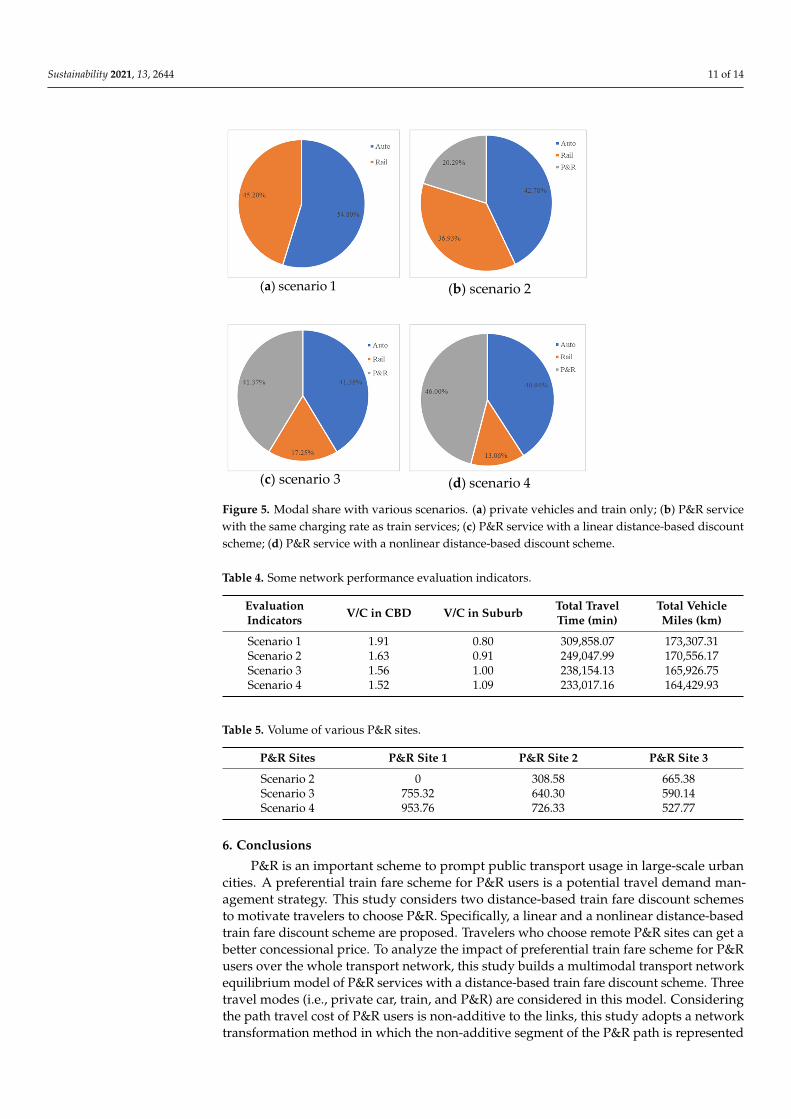
Figure 5 reflects the mode share patterns with different scenarios. P&R services could effectively attract travelers from both auto and rail modes. The fare discount schemes for P&R users (i.e., scenarios 3 and 4) can further attract more travelers to shift to P&R mode. In general, with the implementation of fare discount schemes, the overall public transport utilization rates rise. The modal share of P&R services can be increased from 20.29% to 46% with the promotion of preferential price schemes. Compared with private vehicle users, train riders are more likely to be attracted to the P&R mode. This phenomenon fur-ther indicates that P&R services should be carefully planned and managed to attract more drivers to ride. Some network performance evaluation indicators are calculated and pre-sented in Table 4. To study the congestion level of the road network, we calculate the average volume capacity (V/C) ratio of road links in the CBD and suburb areas. The aver-age V/C ratio reduces from 1.92 to 1.52 with the implementation of P&R motivation schemes. The results indicate that P&R services and the proposed distance-based train fare scheme are capable of alleviating traffic congestion in the city center. We also compare the network-wide performance of various scenarios (i.e., the total travel time and the total vehicle miles). We can observe that with the promotion of P&R motivation schemes, both total travel time and total vehicle miles reduce. The total travel time reduces from 309,858 to 233,017, and the total vehicle miles reduces from 173,307 to 164,429. The results indicate that P&R services can effectively reduce the network-wide travel cost.
Figure 4. Distance-based charge/discount rate functions.
Figure 5 reflects the mode share patterns with different scenarios. P&R services couldeffectively attract travelers from both auto and rail modes. The fare discount schemes forP&R users (i.e., scenarios 3 and 4) can further attract more travelers to shift to P&R mode.In general, with the implementation of fare discount schemes, the overall public transportutilization rates rise. The modal share of P&R services can be increased from 20.29% to46% with the promotion of preferential price schemes. Compared with private vehicleusers, train riders are more likely to be attracted to the P&R mode. This phenomenonfurther indicates that P&R services should be carefully planned and managed to attractmore drivers to ride. Some network performance evaluation indicators are calculatedand presented in Table 4. To study the congestion level of the road network, we calculatethe average volume capacity (V/C) ratio of road links in the CBD and suburb areas. Theaverage V/C ratio reduces from 1.92 to 1.52 with the implementation of P&R motivationschemes. The results indicate that P&R services and the proposed distance-based trainfare scheme are capable of alleviating traffic congestion in the city center. We also comparethe network-wide performance of various scenarios (i.e., the total travel time and the totalvehicle miles). We can observe that with the promotion of P&R motivation schemes, bothtotal travel time and total vehicle miles reduce. The total travel time reduces from 309,858to 233,017, and the total vehicle miles reduces from 173,307 to 164,429. The results indicatethat P&R services can effectively reduce the network-wide travel cost.
To explore the effect of a nonlinear distance-based P&R scheme, we compare the flowvolume of various P&R charging schemes. P&R sites 1, 2, and 3 are represented by thenodes 14, 15, and 16 in the network. Table 5 shows that in scenario 2, P&R users are morelikely to choose the P&R sites that are closer to the city center. To motivate more travelersto choose P&R sites far from the city center, scenario 3 proposes a discount scheme forP&R users. A consistent discount is proposed for each P&R site. Travelers who chooseremote P&R facilities can obtain more preferential prices. It can be seen that with thediscount motivation, P&R site 1 becomes attractive to travelers. The nonlinear distance-based discount scheme (i.e., scenario 4) further motivate more travelers to choose remoteP&R sites.
Sustainability 2021, 13, 2644 11 of 14Sustainability 2021, 13, x FOR PEER REVIEW 11 of 15
Figure 5. Modal share with various scenarios. (a) private vehicles and train only; (b) P&R service with the same charging rate as train services; (c) P&R service with a linear distance-based discount scheme; (d) P&R service with a nonlinear distance-based discount scheme.
Table 4. Some network performance evaluation indicators.
Evaluation Indicators V/C in CBD V/C in Suburb Total Travel Time (min) Total Vehicle Miles (km) Scenario 1 1.91 0.80 309,858.07 173,307.31 Scenario 2 1.63 0.91 249,047.99 170,556.17 Scenario 3 1.56 1.00 238,154.13 165,926.75 Scenario 4 1.52 1.09 233,017.16 164,429.93
To explore the effect of a nonlinear distance-based P&R scheme, we compare the flow volume of various P&R charging schemes. P&R sites 1, 2, and 3 are represented by the nodes 14, 15, and 16 in the network. Table 5 shows that in scenario 2, P&R users are more likely to choose the P&R sites that are closer to the city center. To motivate more travelers to choose P&R sites far from the city center, scenario 3 proposes a discount scheme for P&R users. A consistent discount is proposed for each P&R site. Travelers who choose remote P&R facilities can obtain more preferential prices. It can be seen that with the dis-count motivation, P&R site 1 becomes attractive to travelers. The nonlinear distance-based discount scheme (i.e., scenario 4) further motivate more travelers to choose remote P&R sites.
Table 5. Volume of various P&R sites.
P&R Sites P&R Site 1 P&R Site 2 P&R Site 3 Scenario 2 0 308.58 665.38 Scenario 3 755.32 640.30 590.14 Scenario 4 953.76 726.33 527.77
6. Conclusions
(d) scenario 4 (c) scenario 3
(b) scenario 2 (a) scenario 1
Figure 5. Modal share with various scenarios. (a) private vehicles and train only; (b) P&R servicewith the same charging rate as train services; (c) P&R service with a linear distance-based discountscheme; (d) P&R service with a nonlinear distance-based discount scheme.
Table 4. Some network performance evaluation indicators.
EvaluationIndicators V/C in CBD V/C in Suburb Total Travel
Time (min)Total VehicleMiles (km)
Scenario 1 1.91 0.80 309,858.07 173,307.31Scenario 2 1.63 0.91 249,047.99 170,556.17Scenario 3 1.56 1.00 238,154.13 165,926.75Scenario 4 1.52 1.09 233,017.16 164,429.93
Table 5. Volume of various P&R sites.
P&R Sites P&R Site 1 P&R Site 2 P&R Site 3
Scenario 2 0 308.58 665.38Scenario 3 755.32 640.30 590.14Scenario 4 953.76 726.33 527.77
6. Conclusions
P&R is an important scheme to prompt public transport usage in large-scale urbancities. A preferential train fare scheme for P&R users is a potential travel demand man-agement strategy. This study considers two distance-based train fare discount schemesto motivate travelers to choose P&R. Specifically, a linear and a nonlinear distance-basedtrain fare discount scheme are proposed. Travelers who choose remote P&R sites can get abetter concessional price. To analyze the impact of preferential train fare scheme for P&Rusers over the whole transport network, this study builds a multimodal transport networkequilibrium model of P&R services with a distance-based train fare discount scheme. Threetravel modes (i.e., private car, train, and P&R) are considered in this model. Consideringthe path travel cost of P&R users is non-additive to the links, this study adopts a networktransformation method in which the non-additive segment of the P&R path is represented
Sustainability 2021, 13, 2644 12 of 14
by a dummy link. The travelers’ mode choice behavior is assumed to follow the MNLcondition, and route choice behavior is assumed to follow the user equilibrium condition.The proposed model is then solved by the outer approximation method. Numerical exam-ples indicate that distanced-based P&R train fare pricing schemes could efficiently shifttravel demands to the P&R mode and alleviate traffic congestion in the downtown area.Distance-based P&R fare schemes could effectively increase the utilization rate of P&R sitesfar from the city center. This study represents an initial work towards the impact analysisof rail-based P&R systems. Future research can be extended to more general situations,such as tram-based/involved P&R systems.
Author Contributions: Conceptualization, X.C. and R.Y.; methodology, R.Y. and Y.Z.; validation, Q.A.and X.C.; formal analysis, X.C. and Y.Z.; investigation, Y.Z. and X.C.; writing—original draft prepara-tion, R.Y. and X.C. All authors have read and agreed to the published version of the manuscript.
Funding: This research was supported by the General Projects (No. 71771050) of the National NaturalScience Foundation of China, and the MOE (Ministry of Education in China) Project of Humanitiesand Social Sciences (Project No. 20YJAZH083).
Institutional Review Board Statement: Not applicable.
Informed Consent Statement: Not applicable.
Conflicts of Interest: The authors declare no conflict of interest.
Appendix A
Table A1. Notations and Explanations.
SetsA Set of links in the transport networkN Set of nodes in the transport networkW Set of OD pairs in the transport networkAa Set of auto links in the transport networkAp Set of P&R links in the transport networkAr Set of rail links in the transport networkMod Set of all modes between OD pair (o, d)Kod,m Set of paths between OD pair (o, d) under mode mParametersqod Travel demand between OD pair (o, d)δod,m
a,k Link-path incidence relation between OD pair (o, d) under mode mτp Parking feeµ Value of timela Length of link adod,r
k Travel distance of path k between OD pair (o, d) under train mode
dod,prk
Travel distance of path k on the rail lines between OD pair (o, d) under P&R modeVariablesva Traffic flow on link ata Travel time on link af od,mk Traffic flow of path k between OD pair (o, d) under mode m
qod,m Demand of mode m between OD pair (o, d)cod,m
k Generalized travel cost of path k between OD pair (o, d) under mode m

Sustainability 2021, 13, 2644 13 of 14
Table A2. Link Attributes of Nguyen-Dupius network.
Link ID Tail Head Free Flow Time (min) Length (km) Capacity Link Type
1 1 12 5 8 800 12 1 5 6 9 800 13 4 5 5 8 800 14 4 9 9 12 500 15 5 6 6 9 550 16 5 9 8 11 450 17 6 7 7 10 400 18 6 10 7 10 500 19 7 8 5 8 400 1
10 7 11 8 11 500 111 8 2 8 11 350 112 9 10 6 9 500 113 9 13 10 13 350 114 10 11 7 10 450 115 11 2 6 9 300 116 11 3 6 9 300 117 12 6 6 9 550 118 12 8 14 18 400 119 13 3 9 12 300 120 1 2 35 35 1000 221 1 3 35 35 1000 222 4 2 35 35 1000 223 4 3 35 35 1000 224 5 14 5 1 800 325 6 15 4 0.5 750 326 11 16 3 0.3 700 327 14 2 23 23 1000 328 14 3 23 23 1000 329 15 2 13 13 1000 330 15 3 13 13 1000 331 16 2 5 5 1000 332 16 3 5 5 1000 3
References1. Huang, D.; Liu, Z.; Liu, P.; Chen, J. Optimal transit fare and service frequency of a nonlinear origin-destination based fare
structure. Transp. Res. Part E Logist. Transp. Rev. 2016, 96, 1–19. [CrossRef]2. Huang, D.; Gu, Y.; Wang, S.; Liu, Z.; Zhang, W. A two-phase optimization model for the demand-responsive customized bus
network design. Transp. Res. Part C Emerg. Technol. 2020, 111, 1–21. [CrossRef]3. Liu, Z.; Chen, X.; Meng, Q.; Kim, I. Remote park-and-ride network equilibrium model and its applications. Transp. Res. Part B
Methodol. 2018, 117, 37–62. [CrossRef]4. Wang, S.; Zhang, W.; Qu, X. Trial-and-error train fare design scheme for addressing boarding/alighting congestion at CBD
stations. Transp. Res. Part B Methodol. 2018, 118, 318–335. [CrossRef]5. Wang, S.; Qu, X. Station choice for Australian commuter rail lines: Equilibrium and optimal fare design. Eur. J. Oper. Res. 2017,
258, 144–154. [CrossRef]6. Gao, K.; Yang, Y.; Li, A.; Li, J.; Yu, B. Quantifying economic benefits from free-floating bike-sharing systems: A trip-level inference
approach and city-scale analysis. Transp. Res. Part A Policy Pract. 2021, 144, 89–103. [CrossRef]7. Gao, K.; Yang, Y.; Sun, L.; Qu, X. Revealing psychological inertia in mode shift behaviorand its quantitative influences on
commuting trips. Transp. Res. Part F Traffic Psychol. Behav. 2020, 71, 272–287. [CrossRef]8. Xu, Y.; Zheng, Y.; Yang, Y. On the movement simulations of electric vehicles: A behavioral model-based approach. Appl. Energy
2021, 283, 116356. [CrossRef]9. Gu, Y.; Fu, X.; Liu, Z.; Xu, X.; Chen, A. Performance of transportation network under perturbations: Reliability, vulnerability, and
resilience. Transp. Res. Part E Logist. Transp. Rev. 2020, 133, 101809. [CrossRef]10. Li, Z.-C.; Lam, W.H.K.; Wong, S.C.; Zhu, D.-L.; Huang, H.-J. Modeling park-and-ride services in a multimodal transport network
with elastic demand. Transp. Res. Rec. J. Transp. Res. Board 2007, 1994, 101–109. [CrossRef]11. Cornejo, L.; Perez, S.; Cheu, R.L.; Hernandez, S. An approach to comprehensively evaluate potential Park-and-Ride facilities. Int.
J. Transp. Sci. Technol. 2014, 3, 1–18. [CrossRef]

Sustainability 2021, 13, 2644 14 of 14
12. Pang, H.; Khani, A. Modeling park-and-ride location choice of heterogeneous commuters. Transportation 2018, 45, 71–87.[CrossRef]
13. Webb, A.; Khani, A. Park-and-Ride choice behavior in a multimodal network with overlapping routes. Transp. Res. Rec. J. Transp.Res. Board 2020, 2674, 150–160. [CrossRef]
14. Huang, K.; Liu, Z.; Zhu, T.; Kim, I.; An, K. Analysis of the acceptance of park-and-ride by users. J. Transp. Land Use 2019, 12,637–647. [CrossRef]
15. Stieffenhofer, K.E.; Barton, M.; Gayah, V.V. Assessing park-and-ride efficiency and user reactions to parking managementstrategies. J. Public Transp. 2016, 19, 5. [CrossRef]
16. Zhao, X.; Chen, P.; Jiao, J.; Chen, X.; Bischak, C. How does ‘park and ride’ perform? An evaluation using longitudinal data. Transp.Policy 2019, 74, 15–23.
17. Ying, H.; Xiang, H. Study on influence factors and demand willingness of Park and Ride. In Proceedings of the 2009 SecondInternational Conference on Intelligent Computation Technology and Automation, Changsha, China, 10–11 October 2009; IEEE:Piscataway, NJ, USA, 2009.
18. Clayton, W.H.; Ben-Elia, E.; Parkhurst, G.; Ricci, M. Where to park? A behavioural comparison of bus Park and Ride and citycentre car park usage in Bath, UK. J. Transp. Geogr. 2014, 36, 124–133. [CrossRef]
19. Qin, H.; Guan, H.; Wu, Y.-J. Analysis of park-and-ride decision behavior based on Decision Field Theory. Transp. Res. Part F TrafficPsychol. Behav. 2013, 18, 199–212. [CrossRef]
20. Li, Z.C.; Lam, H.K.W.; Wong, S.C.; Zhu, D.L. Modeling travel choice problems in a multimodal elastic demand transportation net-work with park-and-ride trips. In Proceedings of the Eleventh International Conference of Hong Kong Society for TransportationStudies, Hong Kong, China, 8–10 December 2006.
21. Liu, T.-L.; Huang, H.-J.; Yang, H.; Zhang, X. Continuum modeling of park-and-ride services in a linear monocentric city withdeterministic mode choice. Transp. Res. Part B Methodol. 2009, 43, 692–707. [CrossRef]
22. Liu, Z.; Meng, Q. Bus-based park-and-ride system: A stochastic model on multimodal network with congestion pricing schemes.Int. J. Syst. Sci. 2014, 45, 994–1006. [CrossRef]
23. Liu, Y.; Li, Y.; Hu, L. Departure time and route choices in bottleneck equilibrium under risk and ambiguity. Transp. Res. Part BMethodol. 2018, 117, 774–793. [CrossRef]
24. Liu, Y.; Nie, Y. A credit-based congestion management scheme in general two-mode networks with multiclass users. Netw. Spat.Econ. 2017, 17, 681–711. [CrossRef]
25. Fernández, E.; De Cea, J.; Florian, M.; Cabrera, E. Network equilibrium models with combined modes. Transp. Sci. 1994, 28,182–192. [CrossRef]
26. Lam, W.H.K.; Li, Z.; Wong, S.C.; Zhu, D. Modeling an elastic-demand bimodal transport network with Park-and-Ride trips.Tsinghua Sci. Technol. 2007, 12, 158–166. [CrossRef]
27. Chen, X.; Kim, I. Modelling rail-based park and ride with environmental constraints in a multimodal transport network. J. Adv.Transp. 2018, 2018, 15. [CrossRef]
28. Wang, J.Y.T.; Yang, H.; Lindsey, R. Locating and pricing park-and-ride facilities in a linear monocentric city with deterministicmode choice. Transp. Res. Part B Methodol. 2004, 38, 709–731. [CrossRef]
29. Wang, D.Z.W.; Du, B. Reliability-based modeling of Park-and-Ride service on linear travel corridor. Transp. Res. Rec. J. Transp.Res. Board 2013, 2333, 16–26. [CrossRef]
30. Du, B.; Wang, D.Z.W. Continuum modeling of park-and-ride services considering travel time reliability and heterogeneouscommuters–A linear complementarity system approach. Transp. Res. Part E Logist. Transp. Rev. 2014, 71, 58–81. [CrossRef]
31. Chen, X.; Liu, Z.; Currie, G. Optimizing location and capacity of rail-based Park-and-Ride sites to increase public transport usage.Transp. Plan. Technol. 2016, 39, 507–526. [CrossRef]
32. Song, Z.; He, Y.; Zhang, L. Integrated planning of park-and-ride facilities and transit service. Transp. Res. Part C Emerg. Technol.2017, 74, 182–195. [CrossRef]
33. Wang, H.; Meng, Q.; Zhang, X.-N. Park-and-ride network equilibrium with heterogeneous commuters and parking spaceconstraint. Transp. Res. Rec. J. Transp. Res. Board 2014, 2466, 87–97. [CrossRef]
34. Wang, H.; Meng, Q.; Zhang, X.-N.; Information, R. Optimal parking pricing in many-to-one Park-and-Ride network with parkingspace constraints. Transp. Res. Rec. J. Transp. Res. Board 2015, 2498, 99–108. [CrossRef]