model validation & verification i jon zelner [email protected] university of michigan dept. of...
TRANSCRIPT

Model Validation Model Validation & Verification I& Verification I
Jon ZelnerJon [email protected]@umich.edu
University of MichiganUniversity of MichiganDept. of SociologyDept. of Sociology
Gerald R. Ford School of Public PolicyGerald R. Ford School of Public PolicyCenter for the Study of Complex SystemsCenter for the Study of Complex Systems
ICPSR Summer 2009ICPSR Summer 2009
ValidationValidation‘‘Fitting the model’ to dataFitting the model’ to data
This can be labor and processor-intensive This can be labor and processor-intensive under the best of circumstancesunder the best of circumstancesAgent-based and many other computational Agent-based and many other computational models often do not fit assumptions models often do not fit assumptions associated with most standard social associated with most standard social statistics and econometrics:statistics and econometrics:
LinearityLinearity
HomoskedasticityHomoskedasticity
Typically resort to running the model many Typically resort to running the model many times ortimes orMaking reasonable approximations to the Making reasonable approximations to the mechanics of the model.mechanics of the model.

VerificationVerificationOften skipped over on the way to validation.Often skipped over on the way to validation.
Assumptions:Assumptions:Are they well thought-out? Are they well thought-out? Do they reflect the phenomenon of interest?Do they reflect the phenomenon of interest?
Mechanics:Mechanics:What does it do?What does it do?Is the thing it does what you want it to do?Is the thing it does what you want it to do?
If not, is there a bug or is it conceptual?If not, is there a bug or is it conceptual?
Parameters:Parameters:Abstract or meant to be measurable?Abstract or meant to be measurable?Do they have the expected association with Do they have the expected association with model output?model output?

Shigella in Shigella in ChicagoChicago
2002 Outbreak2002 OutbreakGrowth within Growth within neighborhood clustersneighborhood clustersAppears to be driven Appears to be driven by daycare centersby daycare centersDifferentiated from Differentiated from typical years by typical years by explosiveness of explosiveness of outbreak:outbreak:Motivating question:Motivating question:
Why did normally Why did normally endemic endemic S. Sonnei S. Sonnei exhibit epidemic exhibit epidemic behavior in 2002?behavior in 2002?

Motivating the Motivating the Shigellosis ModelShigellosis Model

Shigella Social Shigella Social Epidemiology Epidemiology
Three strongest Three strongest predictors:predictors:
% under 5 years% under 5 years
% below poverty line% below poverty line
100-%unemployed100-%unemployed
i.e., higher i.e., higher unemployment rate unemployment rate associated with lower associated with lower level of shigellosis level of shigellosis infectioninfection
May show importance May show importance of workplaces as of workplaces as bridges between bridges between household infectionshousehold infections
Black bars indicate infection in counties > 50% urban.
Source: Chang, Groseclose et al., 2009

Shigella in Shigella in ChicagoChicago
First step is to come up First step is to come up with a conceptual model with a conceptual model that makes sense for that makes sense for the question.the question.
Agents are Agents are neighborhoods:neighborhoods:
AttributesAttributes% Black% Black
Number of susceptible Number of susceptible and infectious and infectious individualsindividuals
Parameters:Parameters:InfectiousnessInfectiousness
Black->White Black->White HeterophilyHeterophily
White->Black White->Black HeterophilyHeterophily
Spatial CouplingSpatial Coupling
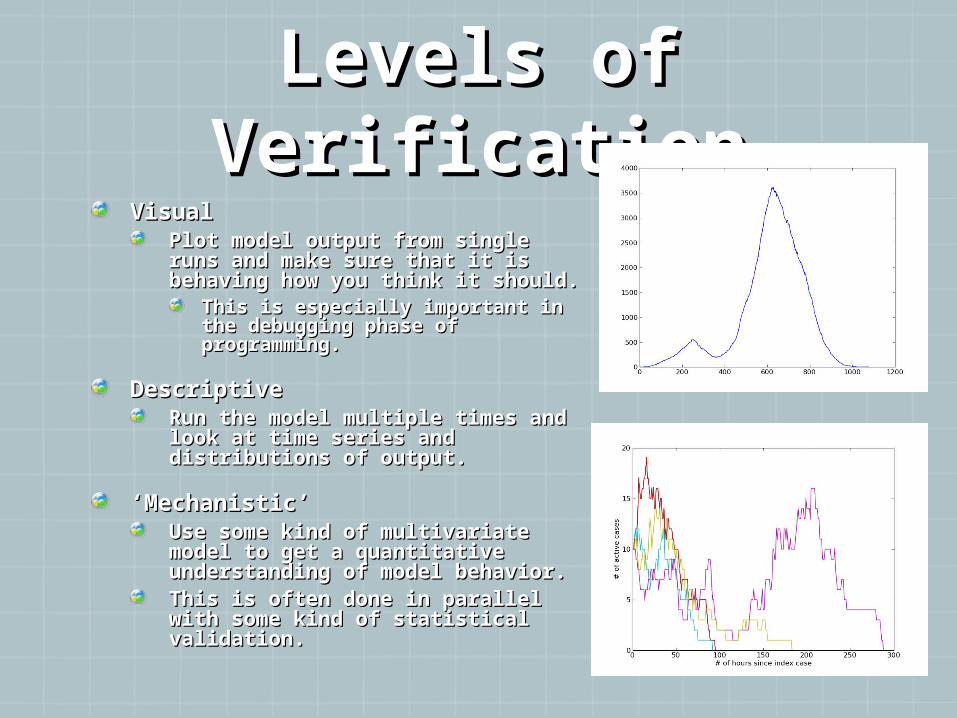
Levels of Levels of VerificationVerification
VisualVisualPlot model output from single Plot model output from single runs and make sure that it is runs and make sure that it is behaving how you think it should.behaving how you think it should.
This is especially important in the This is especially important in the debugging phase of debugging phase of programming.programming.
DescriptiveDescriptiveRun the model multiple times and Run the model multiple times and look at time series and look at time series and distributions of output.distributions of output.
‘‘Mechanistic’Mechanistic’Use some kind of multivariate Use some kind of multivariate model to get a quantitative model to get a quantitative understanding of model behavior.understanding of model behavior.This is often done in parallel with This is often done in parallel with some kind of statistical some kind of statistical validation.validation.

Mechanics of Mechanics of VerificationVerification
Pick output variablesPick output variablesFor Shigellosis model, we’ll pick For Shigellosis model, we’ll pick number of infected individualsnumber of infected individualsFor a model like the shelling For a model like the shelling segregation model, you might want segregation model, you might want to pick at the index of dissimilarity.to pick at the index of dissimilarity.
Get model output into a usable Get model output into a usable format:format:
Comma-separated values tend to be Comma-separated values tend to be the most common and portablethe most common and portable
Import into statistical framework of Import into statistical framework of your choice:your choice:
R, Stata, MatlabR, Stata, MatlabPython Python

Understanding Understanding the Shigellosis the Shigellosis
ModelModelInitial run:Initial run:375 Runs, sweeping 375 Runs, sweeping parameter values:parameter values:
betaVals = betaVals = [.5,1.0,1.5,2.0,2.5][.5,1.0,1.5,2.0,2.5]gwVals = [0.0, -1, -2, -3, -gwVals = [0.0, -1, -2, -3, -4]4]scVals = [.1,.3,.5,.7,.9]scVals = [.1,.3,.5,.7,.9]
What is noticeable about What is noticeable about the output of these the output of these parameter values?parameter values?What does this (maybe) What does this (maybe) say about the model?say about the model?

CClassification lassification AAnd nd RRegression egression TTrees rees (CART)(CART)
Machine learning tool Machine learning tool that doesn’t rely on that doesn’t rely on strong distributional strong distributional assumptions:assumptions:
Available as the R Available as the R package rpartpackage rpartImplementations Implementations also exist for STATA also exist for STATA and Matlaband MatlabRegression tree Regression tree when the outcome when the outcome variable is variable is continuouscontinuousClassification tree Classification tree for level-valued for level-valued variablesvariables

Model BehaviorModel BehaviorFairly predictable:Fairly predictable:
Most runs die out Most runs die out and the few that and the few that persist seem to do persist seem to do so as a function of so as a function of the infectivity the infectivity parameter. parameter. Potential solutions:Potential solutions:
Maybe most of the Maybe most of the interesting behavior interesting behavior is outside of the set is outside of the set of parameters we’re of parameters we’re trying to look at.trying to look at.Maybe not running Maybe not running the model enough the model enough times to see times to see interesting interesting behavior.behavior.

Model BehaviorModel BehaviorFix beta @ .5 (very small) and run 20 Fix beta @ .5 (very small) and run 20 times for each setup; see how model times for each setup; see how model behavior changes:behavior changes:
# Infections Duration of Outbreak (hrs)

Model BehaviorModel BehaviorIncrease Beta Again:Increase Beta Again:
# Infections (Beta = 1.0) # Infections (Beta = 1.5)# Infections (Beta = .5)

Running TimeRunning Time

Model Model AssumptionsAssumptions
Make model assumptions explicit:Make model assumptions explicit:Pseudocode and comments are your friendPseudocode and comments are your friend
Whenever possible, write out the mathematical Whenever possible, write out the mathematical and logical basis of your model as comments and logical basis of your model as comments within the codewithin the code
Avoid “magic numbers”Avoid “magic numbers”
Avoid strongly correlated parameters wherever Avoid strongly correlated parameters wherever possiblepossible

Simulation Simulation StrategyStrategy
PLANNING!PLANNING!Simulation can be costly in terms of effort and Simulation can be costly in terms of effort and time, so an explicit strategy can save you time time, so an explicit strategy can save you time and hours of your life.and hours of your life.It’s never too early to do batch runs:It’s never too early to do batch runs:
Start small:Start small:Small # of Runs over a coarse-grained set of Small # of Runs over a coarse-grained set of parametersparameters
Explore areas of interest in greater depthExplore areas of interest in greater depth
DATA!DATA!Computational models generate a lot of outputComputational models generate a lot of output
How are you going to preserve work you did in How are you going to preserve work you did in earlier simulations?earlier simulations?

Getting Data Into Getting Data Into RR
Output as comma-separated values (CSV) Output as comma-separated values (CSV) file from Netlogofile from Netlogo
Use R’s read.csv command to bring data in:Use R’s read.csv command to bring data in:read.csv(‘/Users/jzelner/Desktop/read.csv(‘/Users/jzelner/Desktop/testData.csv’) on Mac/LinuxtestData.csv’) on Mac/Linuxread.csv(‘c:/Documents/testData.csv’) on pcread.csv(‘c:/Documents/testData.csv’) on pc
Download and install rpart package:Download and install rpart package:> install.packages(‘rpart’)> install.packages(‘rpart’)>library(rpart) to load>library(rpart) to load>help(rpart) to see usage>help(rpart) to see usage
Can also use built-in functions:Can also use built-in functions:hist()hist()plot(x,y)plot(x,y)
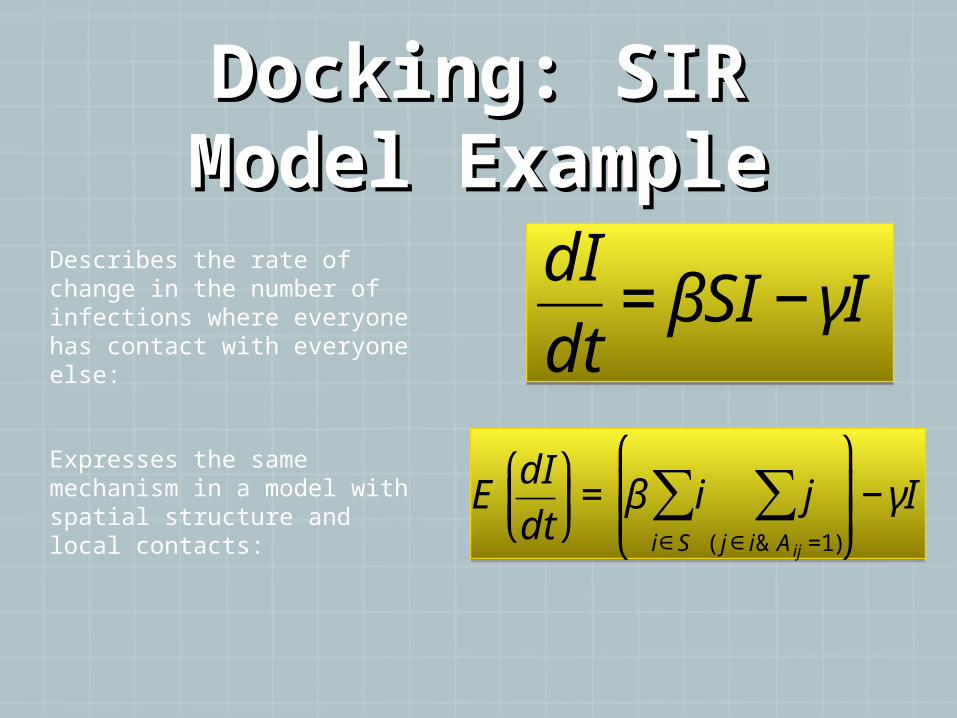
Docking: SIR Docking: SIR Model ExampleModel Example
€
dI
dt= βSI − γI
Describes the rate of change in the number of infections where everyone has contact with everyone else:
€
EdI
dt
⎛
⎝ ⎜
⎞
⎠ ⎟= β i j
( j∈i& A ij =1)
∑i∈S
∑ ⎛
⎝ ⎜ ⎜
⎞
⎠ ⎟ ⎟− γI
Expresses the same mechanism in a model with spatial structure and local contacts:

Active Nonlinear Active Nonlinear Tests (ANT)Tests (ANT)
Framework for understanding behavior and Framework for understanding behavior and robustness of simulation models, outlined by robustness of simulation models, outlined by Miller.Miller.– Let MLet Mhh((pp) give the implication of the model for ) give the implication of the model for
some hypothesis some hypothesis hh under assumptions under assumptions pp. . • Let Let p-hat p-hat represent original model assumptionsrepresent original model assumptions
– Let represent some Let represent some objective function that describes the model’s objective function that describes the model’s performance with respect to performance with respect to hh..Use an optimization algorithm to maximize the Use an optimization algorithm to maximize the objective function over all where objective function over all where is the allowable set of is the allowable set of perturbations to the model perturbations to the model
€
Mh (p),Mh ( ˆ p )( )∏
€
p∈ Δp
€
Δp

Objective Objective FunctionsFunctions
• For segregation and Shigellosis model:For segregation and Shigellosis model:– Find some parameter range that Find some parameter range that
corresponds to behavior we’re looking for – corresponds to behavior we’re looking for – a first peak inside a segregated a first peak inside a segregated neighborhood followed by a travelling wave neighborhood followed by a travelling wave out into the rest of the city - using known out into the rest of the city - using known model parametersmodel parameters
– Search for changes to parameter values and Search for changes to parameter values and model components that break this patternmodel components that break this pattern
• What other objective functions?What other objective functions?
• Other less-technical ways of doing this?Other less-technical ways of doing this?
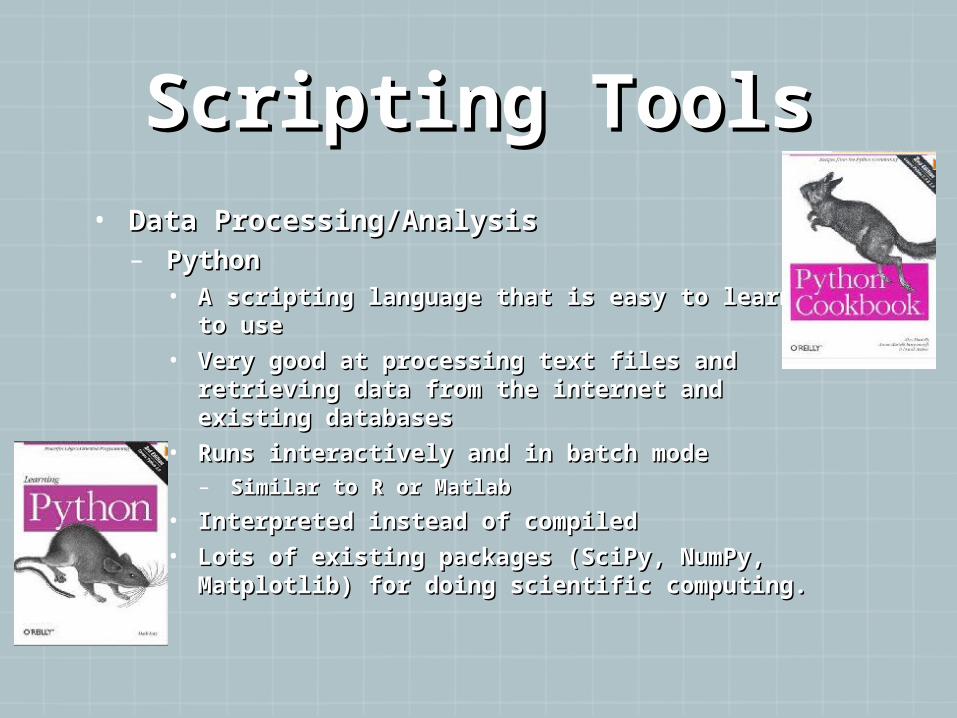
Scripting ToolsScripting Tools• Data Processing/AnalysisData Processing/Analysis
– PythonPython• A scripting language that is easy to learn A scripting language that is easy to learn
to useto use• Very good at processing text files and Very good at processing text files and
retrieving data from the internet and retrieving data from the internet and existing databasesexisting databases
• Runs interactively and in batch modeRuns interactively and in batch mode– Similar to R or MatlabSimilar to R or Matlab
• Interpreted instead of compiledInterpreted instead of compiled• Lots of existing packages (SciPy, NumPy, Lots of existing packages (SciPy, NumPy,
Matplotlib) for doing scientific computing.Matplotlib) for doing scientific computing.

Model ValidationModel Validation• Axtell, Epstein and Axtell, Epstein and
Dean. (2002). Dean. (2002). Population Population growth and collapse in a growth and collapse in a multiagent model of the multiagent model of the Kayenta Anasazi in Long Kayenta Anasazi in Long House Valley. House Valley. PNASPNAS– Big question: What kind Big question: What kind
of agent behavior led to of agent behavior led to spatiotemporal spatiotemporal patterning of patterning of settlements and settlements and eventual abandonment eventual abandonment of settlements?of settlements?

Components and Components and Initial ConditionsInitial Conditions

OptimizationOptimization

Theoretical Approaches Theoretical Approaches to ABM Validationto ABM Validation
• Likelihood-basedLikelihood-based– ExactExact
• Good Luck!Good Luck!• Caveat to this is if you are willing or able to Caveat to this is if you are willing or able to
make a statistical approximation to your make a statistical approximation to your model.model.
– Computation-basedComputation-based• Particle filter (Ionides, Breto & King, 2006) Particle filter (Ionides, Breto & King, 2006) • Monte Carlo IntegrationMonte Carlo Integration• Markov Chain Monte Carlo (MCMC)Markov Chain Monte Carlo (MCMC)
• Distance-basedDistance-based– One popular framework for this is called One popular framework for this is called
“Approximated Bayesian Computation”“Approximated Bayesian Computation”

Techniques for Techniques for ValidationValidation
• Brute force:Brute force:– Pick parameters and try all combinationsPick parameters and try all combinations– Decide on level of granularity to sweep over Decide on level of granularity to sweep over
model rangesmodel ranges
• Machine learning:Machine learning:– Markov Chain Monte Carlo (MCMC)Markov Chain Monte Carlo (MCMC)
• Simulated AnnealingSimulated Annealing– Genetic AlgorithmsGenetic Algorithms
• Gradient/Hybrid MethodsGradient/Hybrid Methods– Use estimates of objective function along with Use estimates of objective function along with
interpolation to speed up convergence.interpolation to speed up convergence.

• Prior distribution:Prior distribution:– What you use to generate candidate parameters What you use to generate candidate parameters
fromfrom– Can contain assumptions about the importance of Can contain assumptions about the importance of
some parameters as opposed to others:some parameters as opposed to others:• i.e., Normal with a small SD vs. Uniform i.e., Normal with a small SD vs. Uniform
distributiondistribution– Most conservative approach is to use a “non-Most conservative approach is to use a “non-
informative” priorinformative” prior
• Posterior distribution:Posterior distribution:– For MCMC, this is the For MCMC, this is the joint distributionjoint distribution of of
parameters and the likelihood.parameters and the likelihood.– Posterior mode approximates MLEPosterior mode approximates MLE
Some ‘priors’ on Some ‘priors’ on Bayesian MethodsBayesian Methods

MCMCMCMC• Given data Given data DD and model and model M(p)M(p)
• Generate initial parameters from some prior Generate initial parameters from some prior distribution:distribution:– Assess the Assess the likelihoodlikelihood of data given the model: of data given the model:
• L(D | M(p))L(D | M(p))
• Generate another set of parameters by moving a small Generate another set of parameters by moving a small distance from the original parameters, re-assess distance from the original parameters, re-assess likelihood:likelihood:– If these have higher likelihood than the original, accept If these have higher likelihood than the original, accept
them into your them into your posteriorposterior sample sample– If the value is of If the value is of lesserlesser likelihood, accept the new likelihood, accept the new
parameters w/probability proportional to the likelihood parameters w/probability proportional to the likelihood ratio:ratio:• L(p2) / L(p1)L(p2) / L(p1)

MCMC Using Approximate MCMC Using Approximate Bayesian Computation Bayesian Computation
(ABC)(ABC)• Generate random parameters, Generate random parameters, pp, from prior , from prior
distributiondistribution
• Run model once @ Run model once @ pp. .
• Measure distance from Measure distance from DD..
• If model run is within some tolerance of data, accept If model run is within some tolerance of data, accept parameters, otherwise keep last parameters and parameters, otherwise keep last parameters and jump to new ones from there.jump to new ones from there.
• Can either have the MCMC sampler draw samples Can either have the MCMC sampler draw samples directly from your model or import a large run into R directly from your model or import a large run into R and sample from the dataset.and sample from the dataset.– Be sure to constrain the sampler to only the parameter Be sure to constrain the sampler to only the parameter
values you have already sampled.values you have already sampled.– Requires thorough parameter sweeps.Requires thorough parameter sweeps.

Another approachAnother approach• Another less technical way to get Another less technical way to get
similar results is to write a program in similar results is to write a program in R, Stata, etc., that will look through R, Stata, etc., that will look through your model output and record the your model output and record the parameter values inside of your parameter values inside of your prespecified tolerance.prespecified tolerance.– Can do this in a multidimensional way for Can do this in a multidimensional way for
several parameters or look for a value of several parameters or look for a value of a single parameter that optimizes net of a single parameter that optimizes net of all other parameters. all other parameters.