model study of multiple polar cap arcs: occurrence and spacing
TRANSCRIPT

Utah State UniversityDigitalCommons@USU
All Physics Faculty Publications Physics
1994
Model Study of Multiple Polar Cap Arcs:Occurrence and SpacingLie ZhuUtah State University
Jan Josef SojkaUtah State University
Robert W. SchunkUtah State University
D. J. CrainUtah State University
Follow this and additional works at: http://digitalcommons.usu.edu/physics_facpub
Part of the Physics Commons
This Article is brought to you for free and open access by the Physics atDigitalCommons@USU. It has been accepted for inclusion in All PhysicsFaculty Publications by an authorized administrator ofDigitalCommons@USU. For more information, please [email protected].
Recommended CitationZhu, L., J. J. Sojka, R. W. Schunk, and D. J. Crain (1994), Model study of multiple polar cap arcs: Occurrence and spacing, Geophys.Res. Lett., 21(8), 649–652, doi:10.1029/94GL00562.
GEOPHYSICAL RESEARCH LETTERS, VOL. 21, NO.8, PAGES 649-652, APRIL 15,1994
~odel study of multiple polar cap arcs: Occurrence and spacing L. Zhu, J. J. Sojka, R. W. Schunk, and D. J. Crain Center for Atmospheric and Space Science, Utah State University, Logan, Utah
Abstract. A new scenario 'for the formation of multiple polar a arcS is proposed based on the results from a time~e~ndent electrodynamic model of polar cap arcs developed by Zhu et af. [1993]. The results suggest that the appearance of multiple polar cap arcs may not be due to multiple structures 'n the magnetospheric source region, but instead, may I rimarily be deter~ined. by th~ coupled magnetospherefonosphere system In WhICh the IOnosphere plays an acti ve role. It was found that with the same magnetospheric driver, a strong ionospheric background convection and an ionospheric background Hall conductance in the range of from 0.5 to 1.5 mho favor the occurrence of multiple polar cap arcs. It was also found that the spacing between individual arcs is highly correlated with the ratio of the enhanced Hall and Pedersen conductances (i.e., the hardness of the primary magnetospheric precipitation), which is allowed to vary in the model runs. A harder precipitation causes a wider spacing. In the modelings , the spacing ranged from about 20 kilometers to about 60 kilometers when the precipitation hardness increased.
Introduction
The polar cap arcs are the auroral arcs seen at very high geomagnetic latitudes (> 80°) that extend approximately 10 -15 degree in the sun-aligned direction. Some of these arcs are very bright and may extend across the polar cap from the dayside to the nightside of the auroral oval to form a pattern that resembles the Greek letter "theta" when observed from space [Frank et af., 1986]. However, polar cap arcs can be con~ned i.n the polar cap and be relatively weak, can have multiple. dIscrete structures, or can occur in either the evening or morrung sectors of the polar cap [Weber and Buchau, 1981].
Compared to the observations, the theoretical understanding of polar cap arcs is still in its infancy. Most of the theoretical models of polar cap arcs [e.g., Burke et al., 1982] are either qualitative, semiquantitative, or steady state models. In these theoretical studies, the emphasis was on the magnetospheric role and the active role of the ionosphere in the magnetosphere-ionosphere (M-I) coupling processes of po.lar cap arcs was ignored. The main concerns were on the bng~t transpolar arcs, with little attention paid to the relatively weak polar cap arcs that exhibit multiple structures. c Zhu et ,at. [1 ?93] developed a time-dependent model of polar ap arcs III WhICh the electrodynamics of the polar cap arcs is
treated self-consistently in the frame of the coupled M-I system and the active role of the ionosphere is specifically stressed. Based on their modeling results, Zhu et al. [1993] ~oposed that t~e observed mul.tiple polar cap arcs might not re .due to multIple structures In the magnetospheric source ocgIon. Instead, they suggested that such striations naturally co cu~ as a result of the dynamical processes that operate in the th uP
r ed M-I system, with the ionosphere playing a key role in S~d orma.tion of multiple polar cap arcs. In a subsequent Oc y, SOj ka et al. [1993] found a strong dependence of the io~urrenc~ of multiple polar cap arcs on the large-scale pro o~phertc background convection. These studies have rev;11ed a new !nsight for the f?rmation Of. polar cap arcs and
a ed the actIve role of the IOnosphere In the dynamics of
Cop . ynght 1994 by the American Geophysical Union.
PIpe o r number 94GL00562 094-8534/94/94GL-00562S03 .00
polar cap arcs. The work presented in this paper is a follow-on to the Zhu et al. [1993] and Sojka et af. [1993] studies. The goal of the paper is to provide a more complete theoretical picture of the formation of multiple polar cap arcs by combining the key results from these previous studies and the results from the new model simulations into an integrated theoretical picture. One of the major features in the new model simulations is that the ratio of the Hall and Pedersen conductances is a variable, instead of a constant as in the previous work.
2. Theoretical Model
The key aspect in the model of polar cap arcs developed by Zhu et af. [1993] is that the arcs are not treated as phenomena merely controlled by the magnetosphere, with the ionosphere only acting as a passive load. Instead, the polar cap arcs are treated as features which are coherently determined by the dynamics in both the ionosphere and magnetosphere. Our scenario for simulating polar cap arcs is briefly summarized as follows. Initially, a magnetospheric shear flow carried by Alfven waves propagates towards the ionosphere. The significance of the assumed initial magnetospheric shear flow in the model has been discussed by Zhu et af. [1993] and is not repeated here. The downward propagating Alfven waves are partially reflected from the ionosphere, and then bounce back and forth between the ionosphere and magnetosphere. The nature of the wave reflections depends on both the conditions in the ionosphere and magnetosphere. At the present stage of the model, the wave reflection at the magnetospheric side is simplified by using a reflection coefficient which can vary from -1 to + 1, depending on the magnetic configuration in the magnetospheric source regions. In this work the reflection coefficient is -1 everywhere in the calculation domain representing an open magnetopause. The propagating Alfve~ waves carry both upward and downward field-aligned currents. The precipitating electrons associated with upward fieldaligned currents enhance the conductivity in the ionosphere. The modified ionospheric conductivity launches secondary Alfven waves towards the magnetosphere. The upward propagating Alfven waves, which consist of the reflected waves and the secondary Alfven waves launched by the temporal change of the ionospheric conductivity, carry the ionospheric information back to the magnetosphere, thus reflecting the active ionospheric role in the dynamics of the M-I coupling process. The whole process is transient, during which all physical quantities in the ionosphere change selfconsistently in time, and subsequently, polar cap arcs develop. Due to the finite conductivity in the ionosphere, the temporal variation of the Alfven waves in the coupled M-I system diminishes with time, and the M-I system, as well as the development of polar cap arcs, approach an asymptotic steady state after several bounce periods.
The main initial inputs to the model include: the ionospheric background conductivity defined by the solar and seasonal conditions; the large-scale ionospheric background convection; and the small-scale magnetospheric shear flow associated with polar cap arcs. For the details of the model formulation and calculation procedure, the reader is referred to Zhu et al. [1993].
3. Occurrence of Multiple Polar Cap Arcs
By usin.g a shear flow of magnetospheric origin, which extends umform1y along the sun-aligned direction (x direction) and has a "single" precipitation channel, as the initial driver
649

650 ZHU ET AL.: MODEL STUDY OF MULTIPLE POLAR CAP ARCS
for the model, Zhu et al. [1993] found that the simulated polar cap arcs can have "multiple" structures in the asymptotic state. The top panel in Figure 1 shows the dawn-dusk (y direction) profile of the field-aligned current distribution associated with the initial shear flow carried by a downward propagating Alfven wave. This field-aligned current distribution has an upward field-aligned current in the center and downward fieldaligned currents at the two edges. If the ionosphere is just a passive load, as assumed in most of the previous theoretical models of polar cap arcs, a single arc is expected to appear in the ionosphere, since the precipitating electrons associated with the upward current can only produce ionization and emission with a single peak in the center. When the active role of the ionosphere in the M-I coupling processes is included, the features of the simulated polar cap arcs can be different. The remaining panels in Figure I show the dawndusk distributions of the field-aligned current, enhanced Hall conductance, and louIe heating rate at the asymptotic state. The negative value in the field-aligned current profile means an upward field-aligned current. Obviously, from the two upward current channels we would infer two polar cap arcs. The spacing of the arcs (the width of the downward current region between the two upward current sheets) in this case is around 50 kilometers, which is different than the characteristic spatial scale of the initial shear flow (about 200 kilometers). Zhu et al. [1993] also found from their simulations that in the development of multiple polar cap arcs, a single arc is seen first and this arc is directly associated with the initial magnetospheric precipitation (we call it the primary arc). After a few minutes, a second arc appears at a distance of tens of kilometers from the first one (we call it a secondary arc), which results from the M-I coupling processes.
The next question is what are the key parameters controlling the occurrence of multiple polar cap arcs in the M-I system. By using the model developed by Zhu et al. [1993] , Sojka et al. [1993] found that the appearance of multiple polar cap arcs has a strong dependence on the magnitude of the large-scale ionospheric background convection (E). With the same initial magnetospheric driver, they found that the number of the arcs increased with an increase in the strength of the ionospheric background convection, while the spacing between the arcs remained constant. The degree of striation, or multiple
DAWN DUSK
~ ~05 :il~1.0 j n:.: :~~:~~~~~~~~--~····~··--.,..=_·_· ··· ... ·····_····_··· - .'I"'" .... -.... -... ..,.....-..__--,.--~
·500 -400 -300 -200 -100 100 200 300 400 500
i!~t-~. I ~i' u:a -4_ ~+-~---..----.---..--~---..----.---'I"'"I--... I--~
W -500 -400 -300 -200 -100 100 200 300 400 500
li'!1 0 0 0 !j 0 ,I -500 -400 .3OQ -200 -100 0 100 200 300 400 500
-200 -100 100 200 300 400 500
Y(km)
Figtire 1. Field-aligned current distribution associated with the initial magnetospheric shear flow (top) and the asymptotic distributions of the field-aligned currents (second), Hall conductance (third), and louIe heating rate (bottom) along the dawn-dusk cross-section.
ro~----------------------------__
~ 15 DAWN -:; 10 -« 1= z ill
b 0 n. ~ -5 I-
~ -1 0 ill
-15 DUSK
-ro +---.---.-~~~--..---..---..,.....~--~~ -500 -400 -300 -roo -100 0 100 roo 300 400 500
Y(km)
INITIAL PERTURBATION
1.0 ~----------------------------__ 30
DAWN DUSK 5' 0.5
~ . o.o+----_ < ~ -0.5 ill
b -1.0
20
._-----1" I n.
... - ......... . o :!J
6 ~ -1.5
~ -2.0 -10 'i
ill -2.5 -20
j
-3.0 -30 -500 . -400 -300 -200 -100 0 100 200 300 400 soo
Y(km)
Figure 2. Main initial inputs for the model runs. The top panel shows the ionospheric background potentia. distribution in the dawn-dusk cross-section (solid curve) &lid the potential perturbation associated with the initial magnetospheric shear flow (dashed curve). The bottom p" shows the potential distribution associated with the initial magnetospheric shear flow (solid curve) and the correspondina electric field distribution (dashed curve).
character, of the arcs increases rapidly from a single arc at B < 20 m V 1m to 5 arcs at 30 m V 1m. These results further indi~ that the ionosphere plays an active role in the formation of multiple polar cap arcs and that the ionosphere dynamicallJ responds to the magnetospheric driving.
From our new simulations , we also found that ionospheric background "conductivity" influences the occurrence of multiple polar cap arcs. Figure 2 shows initial inputs adopted for the simulations. The large-scale ionospheric convection shown in the top panel represents ,' uniform antisunward convection. The initial magnetospheriC shear flow carried by a downward propagating Alfven wave represented by a Gaussian potential distribution, as shown the solid line in the bottom panel of Figure 2. The dashed represents the corresponding electric field.
Figure 3 shows the asymptotic field-aligned curreat distribution for the case when the ionospheric backgroulid
FIELD·AlIGNED CURRENT ("AIM' )
2OO r--------------------------------, DUSK
ISO
100
· 100
· 150 DAWN
·200 +-~--_.._--..,.....--.._____r--.....__--...._.......,.-....._---.
300 600 900 1200 1500 1800 2100 2400 2700 3000 X (km)
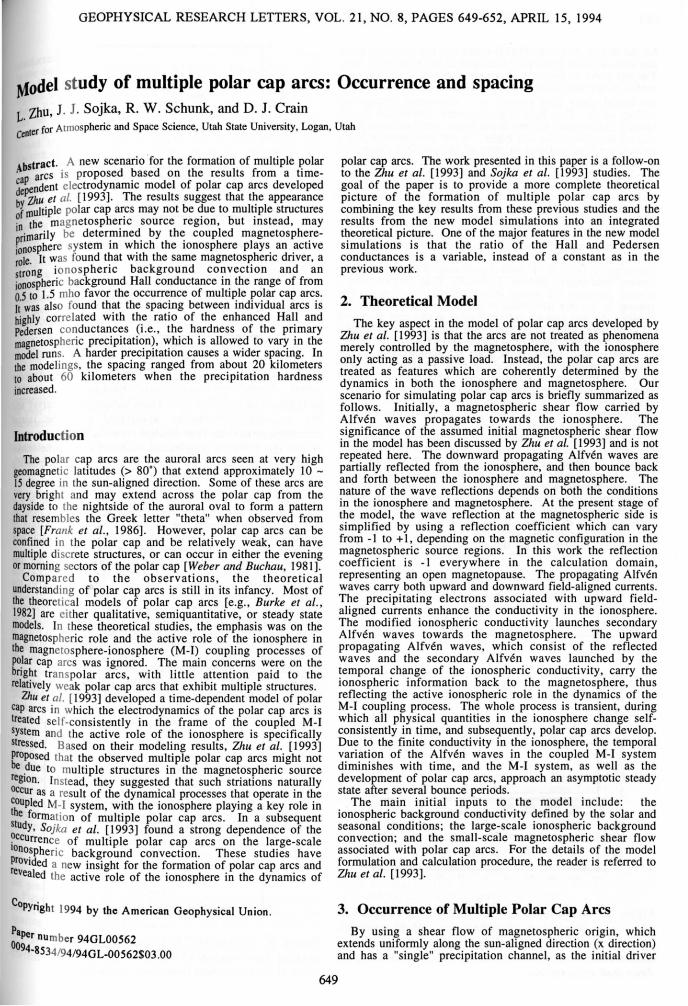
Figure 3. Asymptotic field-aligned current distributi: showing the occurrence of multiple polar cap arcs due to effect of the background ionospheric conductance.
ZHU ET AL.: MODEL STUDY OF MULTIPLE POLAR CAP ARCS 651
ductance, which is merely due to solar radiation, is uniform ~°dte dawn-dusk direction and decreases from 2.5 mho on the ~ yside to 0.5 mho on the nightside. It can be seen that in the agions where the ionospheric background Hall conductance is
rebOve 1.5 mho, only a single bright polar cap arc exists. This a n be explained by the fact that the high ionospheric ca nductance allows the magnetospheric current to be freely cfosed in the ionosphere, which acts to smooth localized ~'screte structures. In the regions where the ionospheric Hall ~nductanCe is in the range of from 0.5 to 1.5 mho, there are ~ultiple polar cap arcs. A simulation for an extreme situation howed that when the ionospheric Hall conductance is below ~ 5 mho, no arcs form in the polar cap. This is because the ' ~nosphere has a very large resistivity and the magnetospheric ~urrents cannot close in the ionosphere; hence, the current floW is cut off in the M-I circuit. These results may explain the observed variety of polar cap arcs , including single bright ares, mul tip le arcs, .and singl~ arcs with bifurc~tion at one end. The change of the IOnosphenc background conductance in the polar cap is mainly due to the variation of solar EUV and UV radiations. The details of how the features of multiple polar cap arcs depend on the solar and seasonal variations will not be discussed in this short paper.
4. Spacing of Multiple Polar Cap Arcs
Based on the image data from an all-sky camera, Valladares (private communication, 1993) found that the spatial separation between the arcs can range from tens of kilometers to over one hundred kilometers. In the preceding section, we indicated that the characteristic spatial scale of the spacing of multiple polar cap arcs is different from the characteristic spatial scale of the initial magnetospheric driver. We also noted that the ionospheric background convection and the ionospheric background conductance only influence the occurrence of the multiple polar cap arcs, not their spacing. Therefore, other parameters in the M-I system must determine the spacing of multiple polar cap arcs.
To explore this specific aspect of multiple polar cap arcs, we have made a systematic parametric study using the model developed by Zhu et ai. [1993]. We found that the characteri stic spatial scale of the initial magnetospheric shear flow does not influence the spacing of multiple polar cap arcs. It only affec ts the width of the primary arc associated with the initial preci pitation. However, we did find an ionospheric para~eter that the spacing of the multiple polar cap arcs is sensItive to, that is, the ratio of the Hall and Pedersen conductances, which is an adjustable parameter in the model.
It is commonlr known that the Hall-to-Pedersenconductance ratio (l.H /Lp) is an indicator of the hardness of the electron precipitation. A higher conductance ratio reflects a h~rder electron precipitation. In our new simulations, we vaned the conductance ratio while keeping the other parameters unchanged to see the effect of the hardness of the precipitation on the multiple polar cap arcs. The rationale for ~hese parametric runs is based on the observational fact that or .a. given field-aligned current the hardness of the prec~pItation can vary markedly. The variation of the relah?nship of the field-aligned current and the hardness of the ~ssocI~ted precipitation should be largely determined by the yna!IDcal processes in the magnetospheric source regions. ~e lonos~heric ~ackgr?und convection and the initial shear F?W used In the SImulatIOns were the same as those shown in t Igure 2 .. The ionospheric background Hall conductance for h~ new Si mulations was uniform in the dawn-dusk direction ~ d~creased from 1.5 mho on the dayside to 0.5 mho on the c ghtSIde. The ratio of the "background" Hall and Pedersen t~n~uctances was a constant (1.5) for all runs, but the ratio of are e~anced" Hall and Pedersen conductances caused by the
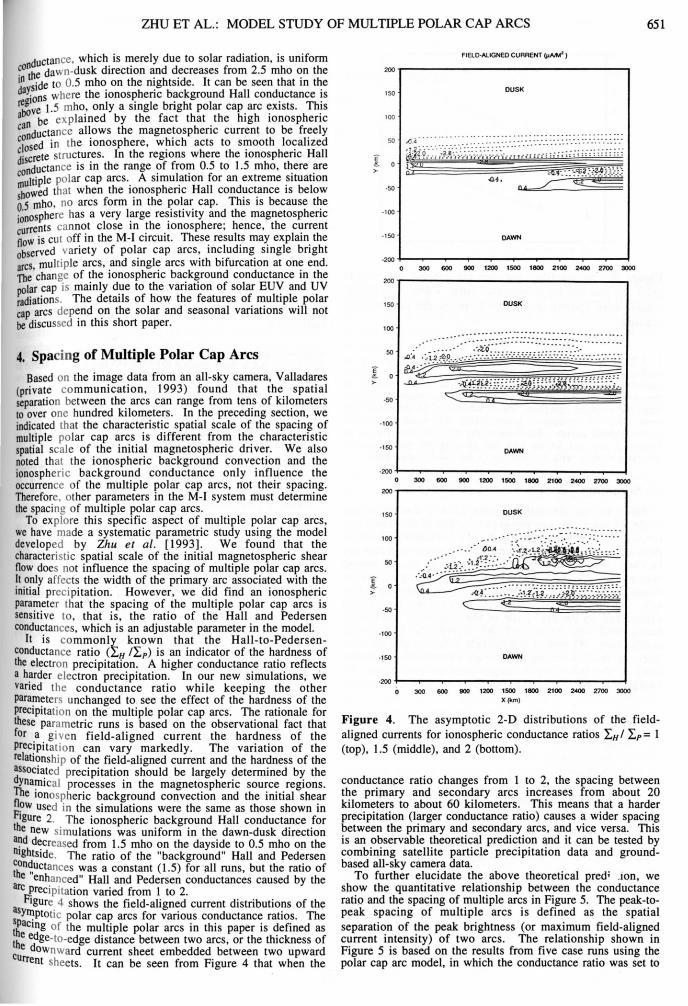
c ~recl pitation varied from 1 to 2. as Figure. 4 shows the field-aligned current distributions of th~ sPy~PtOtIC polar cap arcs for various conductance ratios. The th acmg of the multiple polar arcs in this paper is defined as th~ ~dge-to-edge distance between two arcs, or the thickness of cu own ward current sheet embedded between two upward
rrent sheets. It can be seen from Figure 4 that when the
FIELD-AlIGNED CURRENT (jtAIM2 )
200
ISO DUSK
100
50
~ >-
-SO
-100
-ISO OAWN
-200 300 600 900 1200 1500 1800 2100 2~ 2700 3000
200
ISO DUSK
100 .. -------- -- ....... _- .. .. -.. _----- -- -.
-100
-150 DAWN
-200 300 600 900 1200 1500 1800 2100 2~ 2700 3000
200
ISO DUSK
100
50 : ••• : :,~; ::~,~;: •• •• ·~;_~-:=:i1:1~ ~:$-.--~::liIII~:::::::~:..:.
~ ~ >-
-50
-100
-ISO DAWN
-200 300 600 900 1200 1500 1800 2100 2~ 2700 3000
X (km)
Figure 4. The asymptotic 2-D distributions of the fieldaligned currents for ionospheric conductance ratios LH / Lp = 1 (top), 1.5 (middle), and 2 (bottom).
conductan~e ratio changes from 1 to 2, the spacing between the primary and secondary arcs increases from about 20 kilometers to about 60 kilometers. This means that a harder precipitation (larger conductance ratio) causes a wider spacing between the primary and secondary arcs, and vice versa. This is an observable theoretical prediction and it can be tested by combining satellite particle precipitation data and groundbased all-sky camera data.
To further elucidate the above theoretical pred; .ion, we show the quantitative relationship between the conductance ratio and the spacing of multiple arcs in Figure 5. The peak-topeak spacing of multiple arcs is defined as the spatial separation of the peak brightness (or maximum field-aligned current intensity) of two arcs. The relationship shown in Figure 5 is based on the results from five case runs using the polar cap arc model, in which the conductance ratio was set to

652 ZHU ET AL.: MODEL STUDY OF MULTIPLE POLAR CAP ARCS
110 ,--------------------,
100
90
60
;[ 70
.§ 60
~ 50
40
30
20
10 +-~-~~~--~~~~~~--~~~ 0.9 1.0 1.1 1.2 1.3 1.4 1.5 1.6 1.7 1.8 1.9 2.0 2.1
CondUC1ance Ralio
Figure 5. Relationship between the spacing of multiple polar cap arcs and the conductance ratio . Curve A is for the edge-to-edge spacing and curve B is for the peak-to-peak spacing.
1, 1.25, 1.5, 1.75, and 2, respectively. Since the spacing of multiple arcs in the simulation has a small noon-night variation, a numerical algorithm was used to determine both the average spacing for each case and the maximum deviations from the average spacings, which were used to determine the error bars. A numerical interpolation was used to connect these discrete points. Obviously, the relationships shown in Figure 5 are not linear and the spacing of multiple arcs increases rapidly with an increase in the co'nductance ratio.
5. Summary
Based on the simulation results from a time-dependent model of polar cap arcs developed by Zhu et al. [1993], we propose the following scenario for the formation of multiple polar cap arcs. The observed multiple polar cap arcs may not be due to multiple structures in the magnetosphere, but instead may primarily be determined by the coupled magnetosphereionosphere system in which the ionosphere plays an active role. The occurrence of the multiple polar cap arcs has a strong dependence on the magnitude of the large-scale ionospheric background convection and the ionospheric background conductance. We predict that multiple polar cap arcs are more likely to occur when the large-scale ionospheric convection field in the polar cap is larger than 20 m V 1m and the background ionospheric Hall conductance is in the range of
from 0.5 to 1.5 mho. When the large-scale convection is weak and the ionospheric conductance is high, a single arc is In likely to be seen in the polar cap. With a variable conduc~rt ratio, it was found that the spacing of multiple polar cap arcs c:e mainly determined by the hardness of the prima·1
magnetospheric precipitation. A harder precipitation causes ry wider spacing between individual arcs, and vice versa. ~ edge-to-edge spacing between arcs varies from about 20 krn to about 60 km when the ratio of the enhanced Hall and Pedersen conductances changes from 1 to 2.
It should be noted that the above theoretical predictions are only based on numerical simulations, and they need further physical explanation and a detailed experimental verification A follow-up study along this line is being undertaken, which consists of both theory and model-observation comparisons The latter is a component of the NSF/CEDAR(Couplinj Energetics and Dynamics of Atmospheric Regions)/HLPS(High Latitude Plasma Structures) campaign in which ground-based optical image data anq DMSP satellite data will be used for the model-observation comparisons and model validations.
Acknowledgments. This research was supported by NASA grut NAG5-1484 and by NSF grants ATM-93-08163 and ATM-93-0216S to Utah State University.
REFERENCES
Burke, W. J ., M. S. Gussenhoven, M. C. Kelley, D. A. Hardy, and P. J. Rich, Electric and magnetic characteristics of discrete arcs in the polar cap, J. Geophys. Res. , 87, 2431 , 1982.
Frank, L. A. , J. D. Craven, D. A. Gurnett, S. D. Shawhan, D. R. Weimer, J. L. Burch, J. D. Winningham, C. R. Chappell, 1. H. Waite, R. A. Heelis, N. C. Maynard, M. Sugiura, W. K. Peterson, and E. G. Shelley, The theta aurora, J . Geophys. Res .. 91, 3177, 1986.
Sojka, J. J., L. Zhu, D. J. Crain, and R. W. Schunk, Effect of high latitude ionospheric convection on sun-aligned polar cap arcs, J. GtOP""'. Res. , in press, 1993.
Weber, E. J., and J. Buchau, Polar cap F-layer auroras, Geophys. Rtl. Lett., 8, 125, 1981.
Zhu., L., J. J. Sojka, R. W. Schunk, and D. J. Crain, A time-dependcllt model of polar cap arcs, J. Geophys. Res., 98, 6139, 1993.
D. J. Crain, R. W. Schunk, J . J. Sojka, and L. Zhu, Center for Atmospheric and Space Sciences, Utah State University, Logan, U1Ib 84322-4405 (e-mail: [email protected])
(Received: November 5,1993; revised: January 19, 1994; accepted: February 9, 1994)