model selection in machine learning + predicting gene expression from chip-seq signals 1
TRANSCRIPT
1
Model Selection in Machine Learning+
Predicting Gene Expression from ChIP-Seq signals
https://twitter.com/nature

2
Review and warm-up questions
Andrew Ng

3
Training vs. Cross-Validation
• Fit model to example data points
• Evaluate model on separate set of data points
https://chrisjmccormick.wordpress.com/2013/07/31/k-fold-cross-validation-with-matlab-code/

4
Bias vs. VarianceModel too complexModel too simple
What’s the
problem?
Adapted from Andrew Ng – https://www.youtube.com/watch?v=DYCv5e0Isow, http://see.stanford.edu/materials/aimlcs229/ML-advice.pdf

5
What’s the problem? – Bias
Adapted from Andrew Ng – https://www.youtube.com/watch?v=DYCv5e0Isow, http://see.stanford.edu/materials/aimlcs229/ML-advice.pdf

6
Learning curve – Bias
Bias
Model too simple
Adapted from Andrew Ng – https://www.youtube.com/watch?v=DYCv5e0Isow, http://see.stanford.edu/materials/aimlcs229/ML-advice.pdf

7
What’s the problem? – Variance
Adapted from Andrew Ng – https://www.youtube.com/watch?v=DYCv5e0Isow, http://see.stanford.edu/materials/aimlcs229/ML-advice.pdf

8
Learning curve – Variance
Variance
Model too complex
Adapted from Andrew Ng – https://www.youtube.com/watch?v=DYCv5e0Isow, http://see.stanford.edu/materials/aimlcs229/ML-advice.pdf

9
What is the next step?
Bias Variance
Adapted from Andrew Ng – https://www.youtube.com/watch?v=DYCv5e0Isow, http://see.stanford.edu/materials/aimlcs229/ML-advice.pdf
10
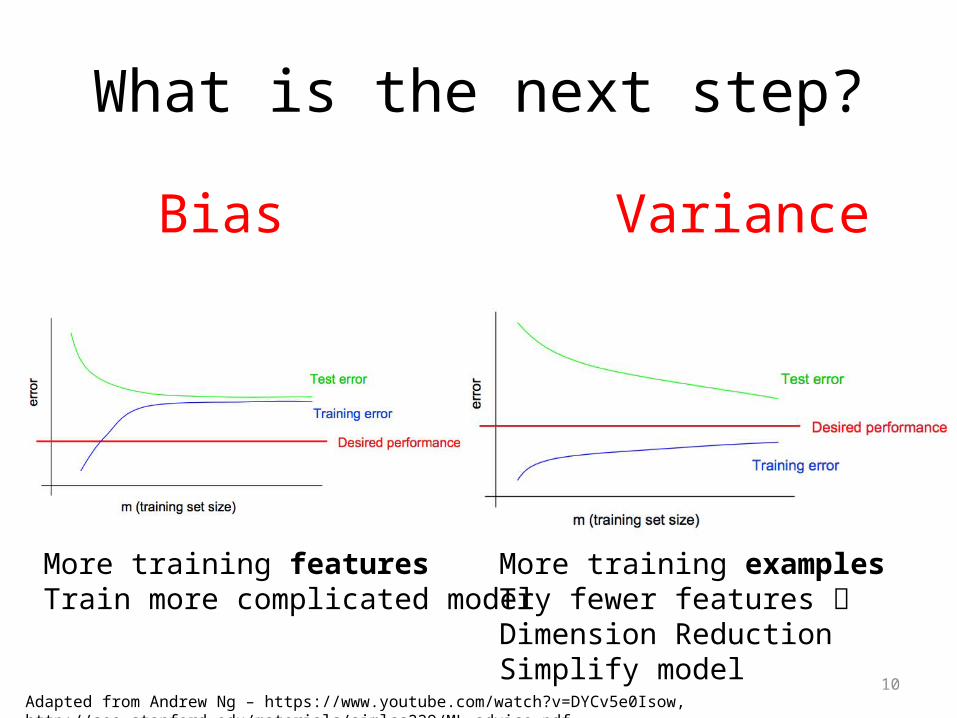
What is the next step?
Bias Variance
More training featuresTrain more complicated model
More training examplesTry fewer features Dimension ReductionSimplify model
Adapted from Andrew Ng – https://www.youtube.com/watch?v=DYCv5e0Isow, http://see.stanford.edu/materials/aimlcs229/ML-advice.pdf

11
Practical Application:Predicting gene expression from ChIP-Seq
signals

12
Where should we start?
Bin 120-81(TTS-4kb to TTS)
TSS (transcription start site) TTS (transcription terminal site)Gene k
Bin 121-160(TTS to TTS+4kb)
Bin 41-80(TSS to TSS+4kb)
Bin 40-1(TSS-4kb to TSS)
40 14 … 41 ….44 80 120 81 121 160
Park et al Nature Reviews Genetics 2009, Rozowsky et al Nature Biotech 2009, http://images.nigms.nih.gov/imageRepository/2484/RNA_pol_II_medium.jpg, Cheng et al Genome Biology 2011
13
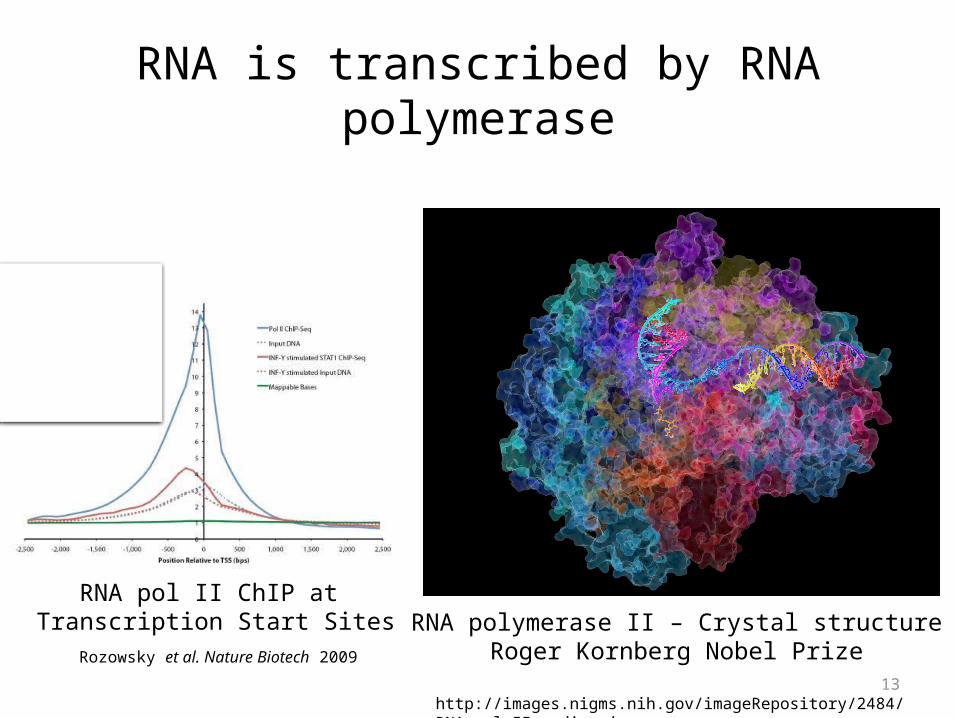
RNA is transcribed by RNA polymerase
RNA polymerase II – Crystal structureRoger Kornberg Nobel Prize
http://images.nigms.nih.gov/imageRepository/2484/RNA_pol_II_medium.jpg
RNA pol II ChIP at Transcription Start SitesRozowsky et al. Nature Biotech 2009

Relating Genomic Inputs to Outputs
0.5 1 1.5 2 2.5 3 3.5 4 4.5 5 5.50
1
2
3
4
5
6
7
8
RNA pol II
Ex
pre
ss
ion
Cell Type 1
Cell Type 2
Mark Gerstein/Mengting Gu

15
Initial model
log2(RNA-Seq RPKM) = a + b*log2(RNA Pol II ChIP)
TSS-4000 +4000
Sum pol II ChIP signal across 8000 bp centered around transcription start site.
Why log scale??
data from K562 cell line, ENCODE consortium
16
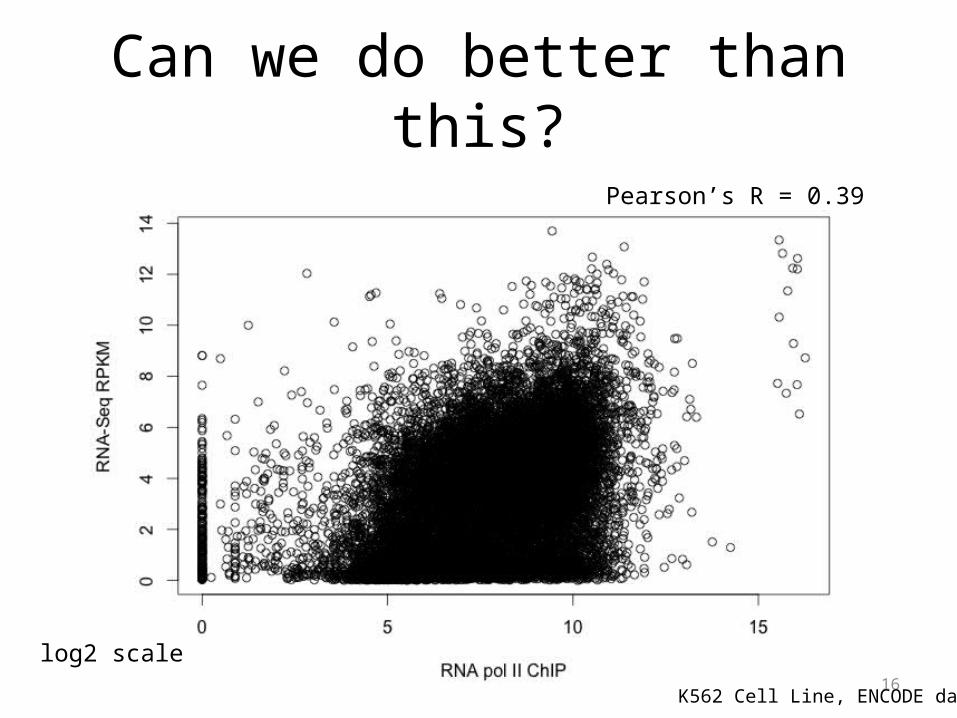
Can we do better than this?
K562 Cell Line, ENCODE data
Pearson’s R = 0.39
log2 scale

17
Can we do better than this?
K562 Cell Line, ENCODE data
Pearson’s R = 0.39
HOW?
log2 scale
18
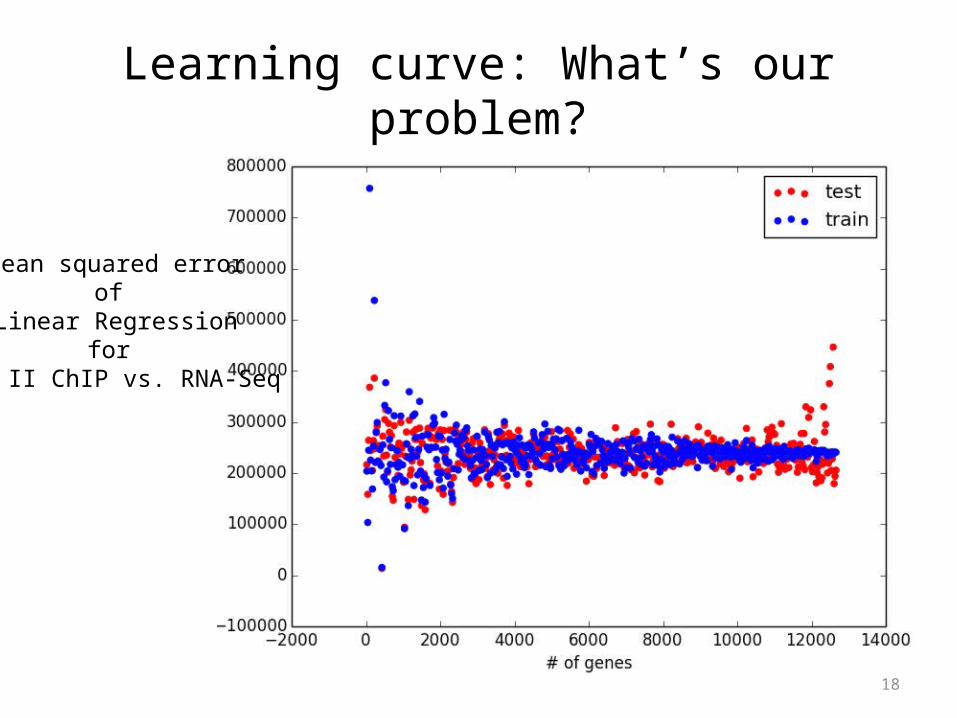
Learning curve: What’s our problem?
Mean squared errorof
Linear Regressionfor
pol II ChIP vs. RNA-Seq

19
Learning curve: What’s our problem?
Mean squared errorof
Linear Regressionfor
pol II ChIP vs. RNA-SeqThis is BIAS
More training features and/orMore complicated model
20
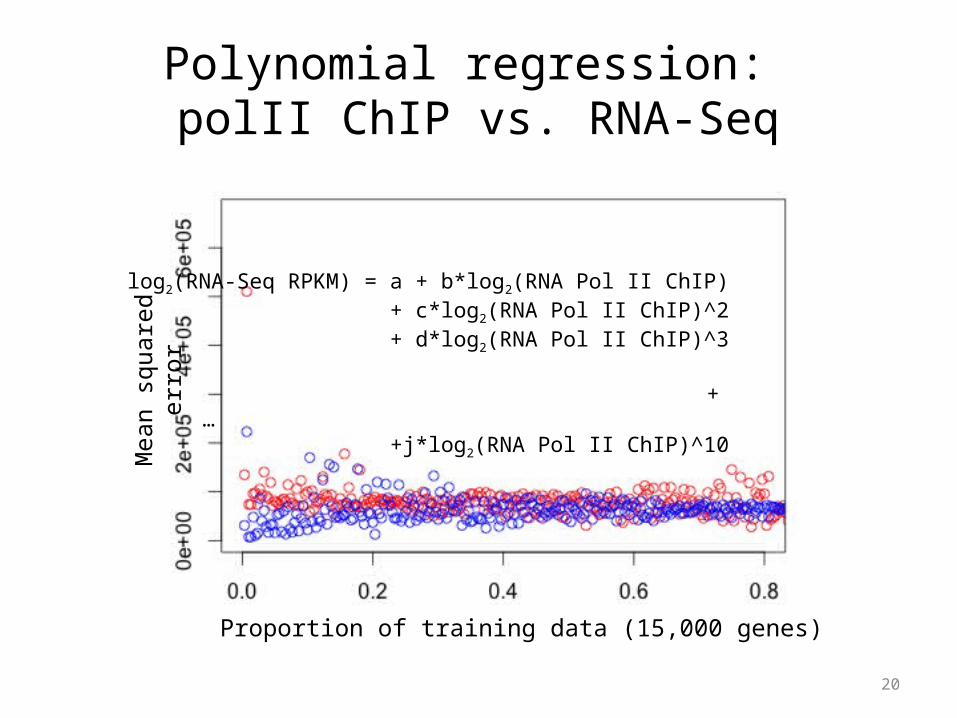
Proportion of training data (15,000 genes)
Mea
n sq
uare
d er
ror
Polynomial regression: polII ChIP vs. RNA-Seq
log2(RNA-Seq RPKM) = a + b*log2(RNA Pol II ChIP) + c*log2(RNA Pol II ChIP)^2+ d*log2(RNA Pol II ChIP)^3
+ … +j*log2(RNA Pol II ChIP)^10

21
Proportion of training data (15,000 genes)
Mea
n sq
uare
d er
ror
Polynomial regression: polII ChIP vs. RNA-Seq
Still BIASED!
More training features and/orMore complicated model
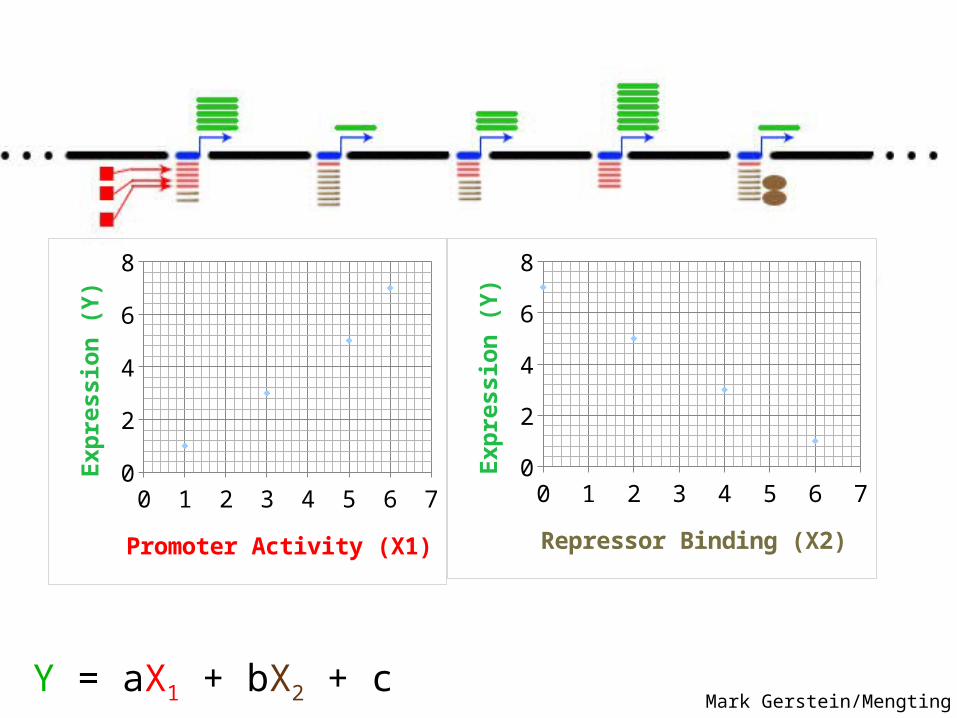
0 1 2 3 4 5 6 7012345678
Promoter Activity (X1)
Expr
essi
on (Y
)
0 1 2 3 4 5 6 7012345678
Repressor Binding (X2)
Expr
essi
on (Y
)
Y = aX1 + bX2 + c Mark Gerstein/Mengting Gu

23
Adding more signals
Total signal from Promoter RNA-Seq
Gene 1Gene 2
…
…
Gene N
H3K
27m
e3
H3K
9me3
H3K
36m
e3
H3K
4me1
H3K
27Ac
RNA
polII
H3K
4me1
H3K
4me3
10 900 29
340 99100
12135
624135
592272
22 94
125224
293
Take log2 of each element
24
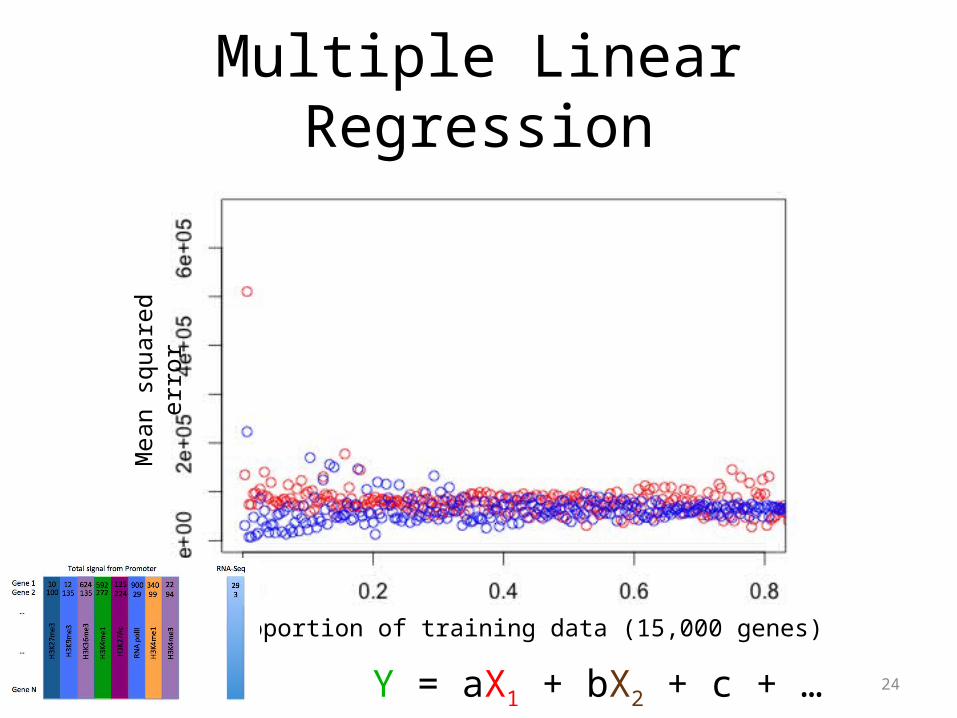
Multiple Linear Regression
Y = aX1 + bX2 + c + …
Proportion of training data (15,000 genes)
Mea
n sq
uare
d er
ror

25
Multiple Linear Regression
Still BIASED!
More training features and/orMore complicated model
Proportion of training data (15,000 genes)
Mea
n sq
uare
d er
ror

26
Random Forest Regression
Training correlation: 0.93Test correlation: 0.52
Log-transformed
Training correlation: 0.95Test correlation: 0.16
Not Log-transformed

27
Training: R = 0.95 Test: R = 0.52
Predicted log2(RPKM+1)Predicted log2(RPKM+1)
Obs
erve
d lo
g2(R
PKM
+1)
Obs
erve
d lo
g2(R
PKM
+1)
Random Forest Regression
Candy:What’s the problem – Bias or Variance?What should we do now?
28
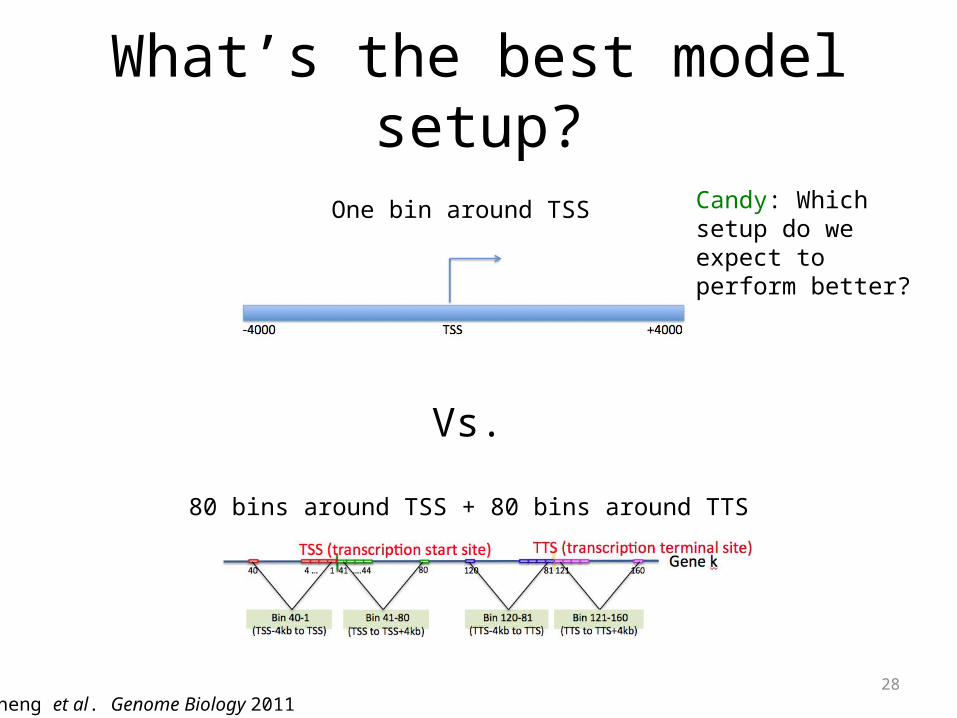
What’s the best model setup?
One bin around TSS
Vs.
80 bins around TSS + 80 bins around TTS
Cheng et al. Genome Biology 2011
Candy: Which setup do we expect to perform better?

29
Effects of signal depend on Location!START STO
P
Gerstein*,…, Cheng* et al. 2010, Science
TTS
Correlation between Signal and expression Slid
e by
Cha
o Ch
eng
30
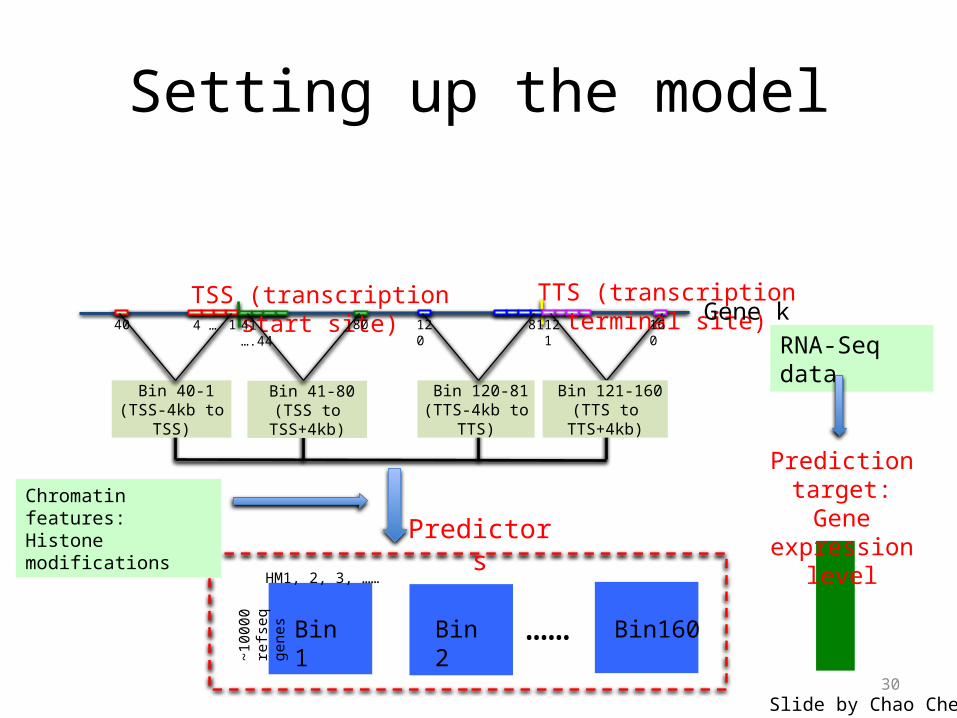
Setting up the model
~100
00 r
efse
q ge
nes Bin 1 Bin 2 Bin160
Chromatin features:Histone modifications
HM1, 2, 3, ……
……
Predictors
Bin 120-81(TTS-4kb to TTS)
TSS (transcription start site) TTS (transcription terminal site)Gene k
Bin 121-160(TTS to TTS+4kb)
Bin 41-80(TSS to TSS+4kb)
Bin 40-1(TSS-4kb to TSS)
40 14 … 41 ….44 80 120 81 121 160
RNA-Seq data
Prediction target:Gene expression level
Slide by Chao Cheng
31
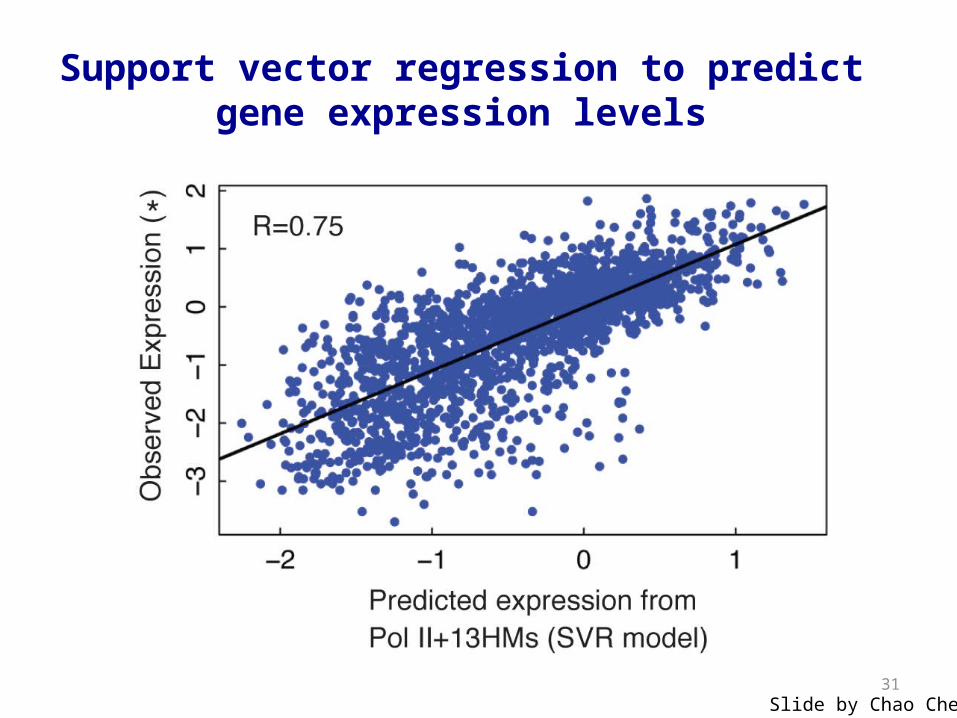
Support vector regression to predict gene expression levels
Slide by Chao Cheng

32
Context (TA bias)
• My implementation:– Train correlation = 0.95– Test correlation = 0.58

33
Support vector machine to classify genes with high, medium and low expression
Areas close to TSS predict expression betterAdapted from Chao Cheng
Candy: Describe a ROC curve!

34
Predicting Gene Expression with Transcription Factor ChIP-Seq signals
| R = 0.81
Cheng et al. Genome Research 2012

35
Predicting Gene Expression with Transcription Factor ChIP-Seq signals
Cheng et al. Genome Research 2012

36
Modeling Transcription Between Organisms
Gerstein et al. Nature 2014

37
Why do we care?
• What are the benefits of a quantitative model?
• Does this model help us understand the mechanism of transcription?

38
For discussion
• Will the prediction model perform accurately in cells with a transcription factor knocked out?
Gerstein et al. Nature 2014