model engine performance measurement from force …model engine performance measurement from force...
TRANSCRIPT

NASA / TMm1998-208486
Model Engine PerformanceFrom Force
AIAA-98-3112
Balance
Measurement
Instrumentation
Robert J. Jeracki
Lewis Research Center, Cleveland, Ohio
Prepared for the
34th Joint Propulsion Conference
cosponsored by AIAA, ASME, SAE, and ASEE
Cleveland, Ohio, July 12-15, 1998
National Aeronautics and
Space Administration
Lewis Research Center
July 1998
https://ntrs.nasa.gov/search.jsp?R=19980211443 2020-03-28T23:41:24+00:00Z
NASA Center for Aerospace Information7121 Standard Drive
Hanover, MD 21076Price Code: A03
Available from
National Technical Information Service
5287 Port Royal Road
Springfield, VA 22100Price Code: A03
MODEL ENGINE PERFORMANCE MEASUREMENTFROM FORCE BALANCE INSTRUMENTATION
Robert J. JerackiNASA Lewis Research Center
Cleveland, Ohio
AIAA-98-3112
Abstract
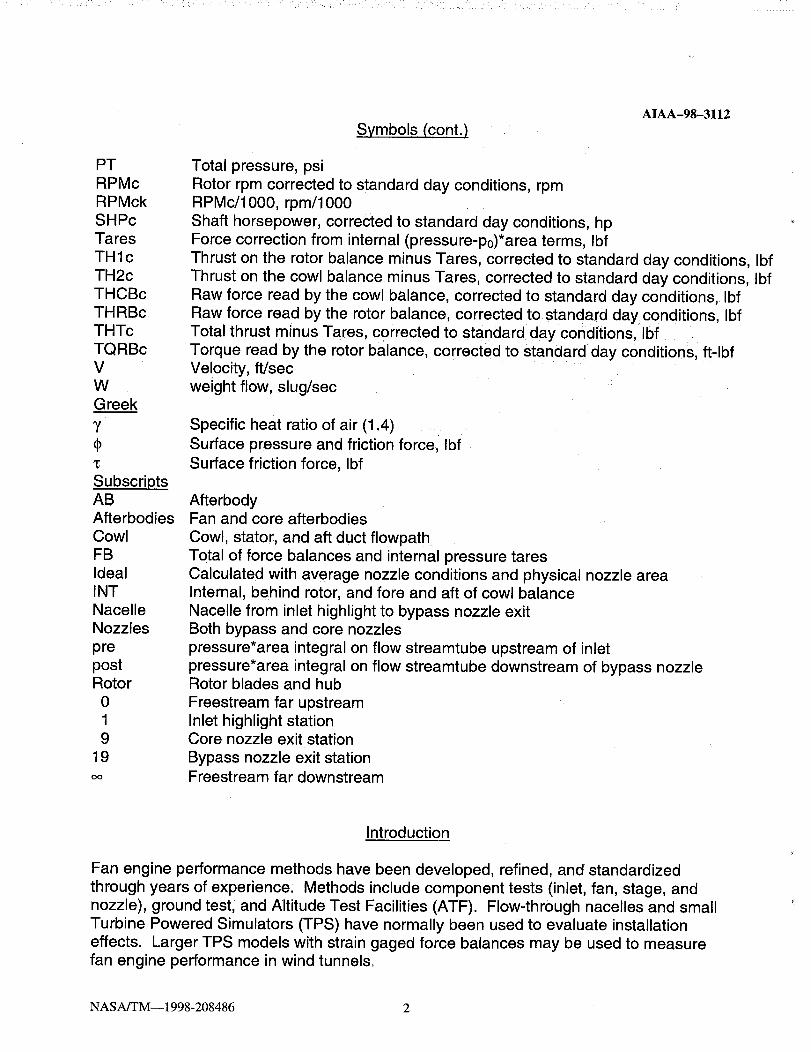
A large scale model representative of a low-noise, high bypass ratio turbofan engine was
tested for acoustics and performance in the NASA Lewis 9- by 15-Foot Low-Speed Wind
Tunnel. This test was part of NASA's continuing Advanced Subsonic Technology Noise
Reduction Program. The low tip speed fan, nacelle, and an un-powered core passage(with core inlet guide vanes) were simulated. The fan blades and hub are mounted on a
rotating thrust and torque balance. The nacelle, bypass duct stators, and core passageare attached to a six component force balance. The two balance forces, when corrected
for internal pressure tares, measure the total thrust-minus-drag of the engine simulator.
Corrected for scaling and other effects, it is basically the same force that the enginesupports would feel, operating at similar conditions. A control volume is shown and
discussed, identifying the various force components of the engine simulator thrust and
definitions of net thrust. Several wind tunnel runs with nearly the same hardware
installed are compared, to identify the repeatability of the measured thrust-minus-drag.
Other wind tunnel runs, with hardware changes that affected fan performance, arecompared to the baseline configuration, and the thrust and torque effects are shown.
Finally, a thrust comparison between the force balance and nozzle gross thrust methods
is shown, and both yield very similar results.
A
CD
CvF
FG
FN
FN'
FN
FNBc
FNCc
FNTc
P
Symbols
Area, ft 2
Nozzle exit discharge coefficient, W/VVldeal
Nozzle exit velocity or thrust coefficient, V/VldealForce, Ibf
Gross thrust, Ibf
Standard net thrust (between station 0 and nozzle exits), Ibf
Basic overall net thrust (Woo*Voo - W0*V0), Ibf
Modified net thrust (defined to exclude the %ost streamline integral), Ibf
Bypass flow net thrust (station 0 to 19) corrected to standard day conditions, Ibf
Core flow net thrust (station 0 to 9) corrected to standard day conditions, IbfTotal flow net thrust (station 0 to 9 & 19) corrected to standard day conditions, IbfStatic pressure, psi
NASA/TM--1998-208486 1
PTRPMcRPMckSHPcTaresTHlcTH2c
THCBcTHRBcTHTcTQRBcVWGreek
Y
"c
SubscriptsABAfterbodiesCowlFBIdealINTNacelleNozzles
prepostRotor
019
19
Symbols (cont.)AIAA-98-3112
Total pressure, psiRotor rpm corrected to standard day conditions, rpmRPMc/1000, rpm/1000
Shaft horsepower, corrected to standard day conditions, hpForce correction from internal (pressure-p0)*area terms, IbfThrust on the rotor balance minus Tares, corrected to standard day conditions, IbfThrust on the cowl balance minus Tares, corrected to standard day conditions, IbfRaw force read by the cowl balance, corrected to standard day conditions, IbfRaw force read by the rotor balance, corrected to standard day conditions, IbfTotal thrust minus Tares, corrected to standard day conditions, Ibf
Torque read by the rotor balance, corrected to standard day conditions, ft-lbfVelocity, ft/secweight flow, slug/sec
Specific heat ratio of air (1.4)
Surface pressure and friction force, IbfSurface friction force, Ibf
AfterbodyFan and core afterbodies
Cowl, stator, and aft duct flowpathTotal of force balances and internal pressure taresCalculated with average nozzle conditions and physical nozzle areaInternal, behind rotor, and fore and aft of cowl balance
Nacelle from inlet highlight to bypass nozzle exitBoth bypass and core nozzlespressure*area integral on flow streamtube upstream of inletpressure*area integral on flow streamtube downstream of bypass nozzleRotor blades and hub
Freestream far upstreamInlet highlight stationCore nozzle exit station
Bypass nozzle exit stationFreestream far downstream
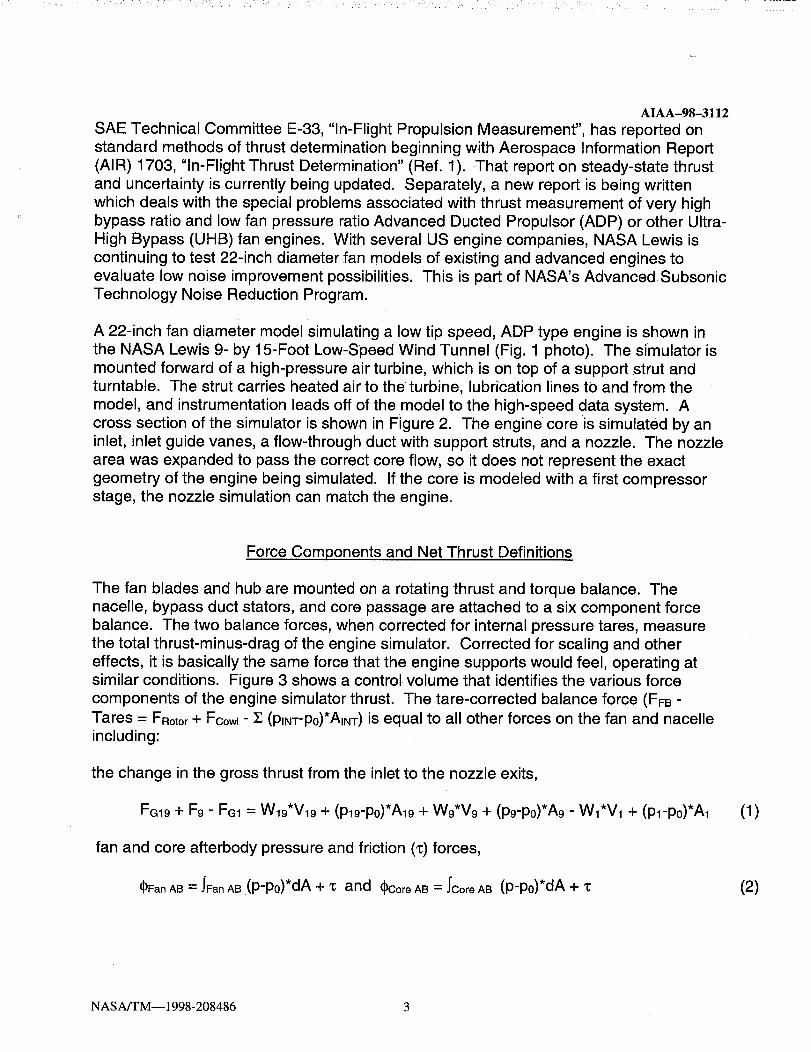
Introduction
Fan engine performance methods have been developed, refined, and standardizedthrough years of experience: Methods include component tests (inlet, fan, stage, andnozzle), ground test, and Altitude Test Facilities (ATF). Flow-through nacelles and smallTurbine Powered Simulators (TPS) have normally been used to evaluate installationeffects. Larger TPS models with strain gaged force balances may be used to measurefan engine performance in wind tunnels.
NASA/TM--1998-208486 2
AIAA-98-3112
SAE Technical Committee E-33, "In-Flight Propulsion Measurement", has reported on
standard methods of thrust determination beginning with Aerospace Information Report
(AIR) 1703, "In-Flight Thrust Determination" (Ref. 1). That report on steady-state thrust
and uncertainty is currently being updated. Separately, a new report is being written
which deals with the special problems associated with thrust measurement of very high
bypass ratio and low fan pressure ratio Advanced Ducted Propulsor (ADP) or other Ultra-
High Bypass (UHB) fan engines. With several US engine companies, NASA Lewis iscontinuing to test 22-inch diameter fan models of existing and advanced engines to
evaluate low noise improvement possibilities. This is part of NASA's Advanced Subsonic
Technology Noise Reduction Program.
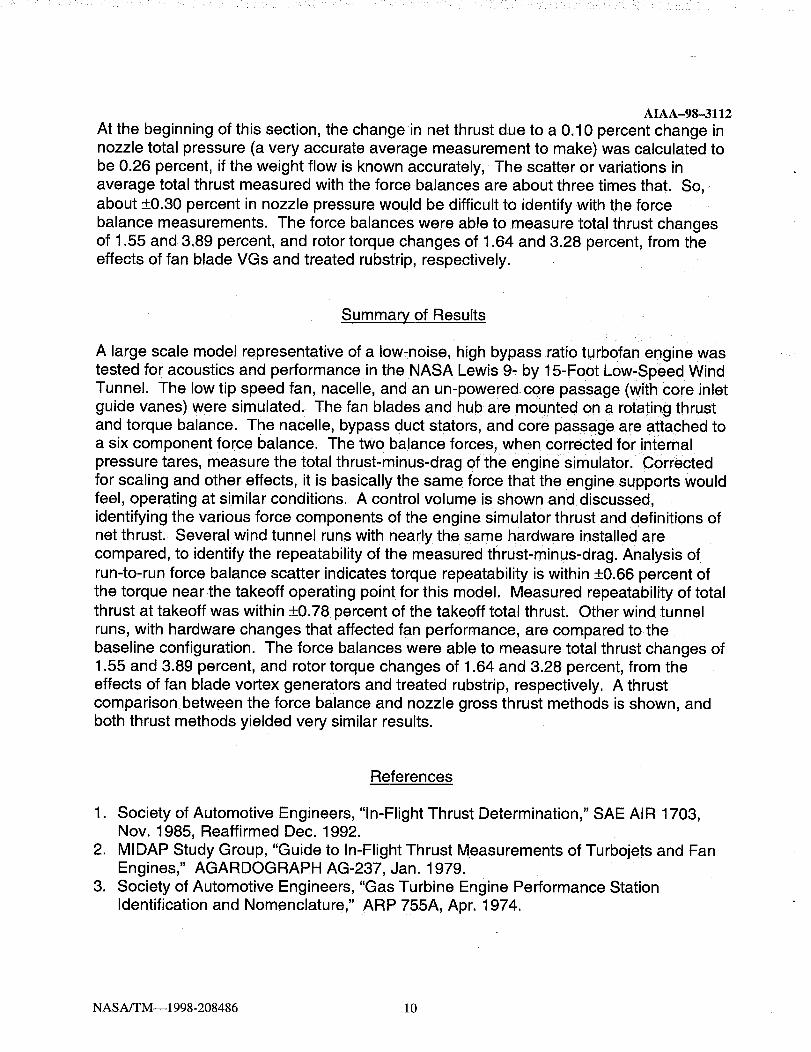
A 22-inch fan diameter model simulating a low tip speed, ADP type engine is shown in
the NASA Lewis 9- by 15-Foot Low-Speed Wind Tunnel (Fig. 1 photo). The simulator is
mounted forward of a high-pressure air turbine, which is on top of a support strut andturntable. The strut carries heated air to the turbine, lubrication lines to and from the
model, and instrumentation leads off of the model to the high-speed data system. A
cross section of the simulator is shown in Figure 2. The engine core is simulated by aninlet, inlet guide vanes, a flow-through duct with support struts, and a nozzle. The nozzle
area was expanded to pass the correct core flow, so it does not represent the exact
geometry of the engine being simulated. If the core is modeled with a first compressor
stage, the nozzle simulation can match the engine.
Force Components and Net Thrust Definitions
The fan blades and hub are mounted on a rotating thrust and torque balance. The
nacelle, bypass duct stators, and core passage are attached to a six component forcebalance. The two balance forces, when corrected for internal pressure tares, measure
the total thrust-minus-drag of the engine simulator. Corrected for scaling and other
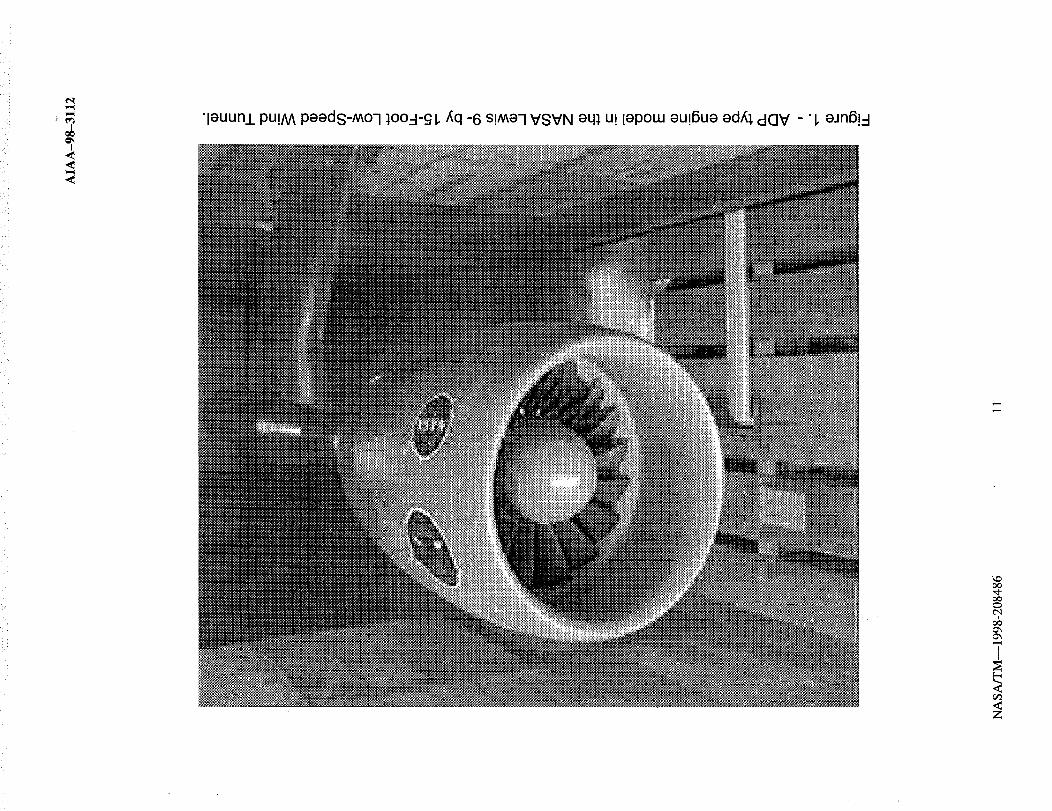
effects, it is basically the same force that the engine supports would feel, operating atsimilar conditions. Figure 3 shows a control volume that identifies the various force
components of the engine simulator thrust. The tare-corrected balance force (FFB -
Tares = FRotor + Fcowl - T_ (PlNT'P0)*AINT) is equal to all other forces on the fan and nacelle
including:
the change in the gross thrust from the inlet to the nozzle exits,
*A *AFG19 + F9 - FG1 = Wig*V19 + (Pig-P0) 19 + Wg*V9 + (Pg-P0) 9 - Wl*V1 + (pl-p0)*A1
fan and core afterbody pressure and friction (_) forces,
(_Fan AB "" J'Fan AB (p-p0)*dA + x and _Core AB -" J'Core AB (p-p0)*dA + x
(1)
(2)
NASA/TM--1998-208486 3
AIAA-98-3112
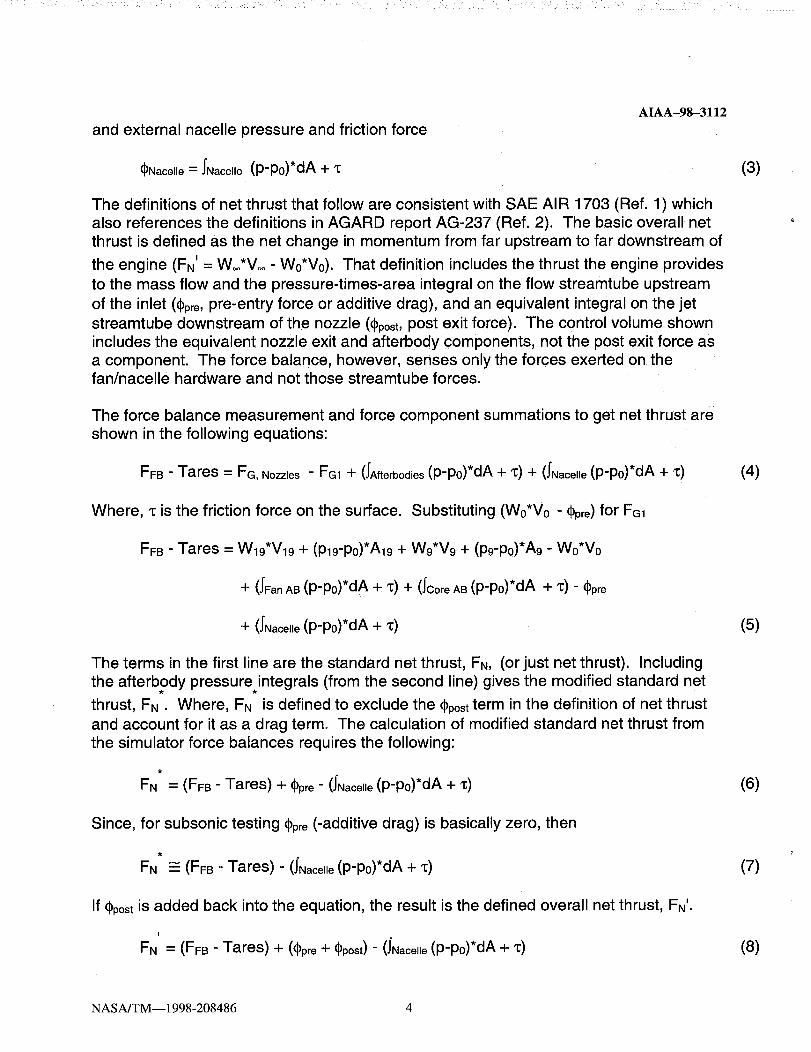
and external nacelle pressure and friction force
CNacelle = INacelle (p-po)*dA + I:
The definitions of net thrust that follow are consistent with SAE AIR 1703 (Ref. 1) which
also references the definitions in AGARD report AG-237 (Ref. 2). The basic overall netthrust is defined as the net change in momentum from far upstream to far downstream of
the engine (FN' = W_*Voo - W0*V0). That definition includes the thrust the engine provides
to the mass flow and the pressure-times-area integral on the flow streamtube upstream
of the inlet (_pre, pre-entry force or additive drag), and an equivalent integral on the jet
streamtube downstream of the nozzle (_post, post exit force). The control volume shownincludes the equivalent nozzle exit and afterbody components, not the post exit force as
a component. The force balance, however, senses only the forces exerted on thefan/nacelle hardware and not those streamtube forces.
The force balance measurement and force component summations to get net thrust are
shown in the following equations:
FEB" Tares = FG, Nozzles - FG1 + (IAfterbodies (p-po)*dA + 1:) + (INacelle (p-p0)*dA + I:)
Where, 1: is the friction force on the surface. Substituting (Wo*Vo - _pre) for FG1
*AFEB - Tares = Wig*V19 + (Plg-Po) 19 + Wg*V9 + (pg-p0)*A9 - Wo*V0
÷ (IFan AB(p-po)*dA ÷ x) + (SCoreAB(p-po)*dA + X)- (_pre
÷ (INacelle (p-p0)*dA + _)
The terms in the first line are the standard net thrust, FN, (or just net thrust). Including
the afterbody pressure, integrals (from the second line) gives the modified standard net
thrust, FN . Where, FN is defined to exclude the Cpostterm in the definition of net thrust
and account for it as a drag term. The calculation of modified standard net thrust from
the simulator force balances requires the following:
FN = (FEB- Tares) + _pre- (INacelle (p-p0)*dA + "_)
Since, for subsonic testing _pre (-additive drag) is basically zero, then
FN _ (FEB- Tares)- (INacelle (p-p0)*dA + x)
If _post is added back into the equation, the result is the defined overall net thrust, FN'.
I
FN = (FEB- Tares) + ((_pre÷ _post) - (INacelle (p-p0)*dA + x)
(3)
(4)
(5)
(6)
(7)
(8)
NASA/TM--1998-208486 4
• : : :::: i • : : : :ii: :_ ::i• • :_ : :::_ :i:i: ¸•_¸¸¸• :, i_: ¸• • :,:::: : :_!: :: ::::!•: i:. _ : : : ! : : i :
AIAA-98-3112
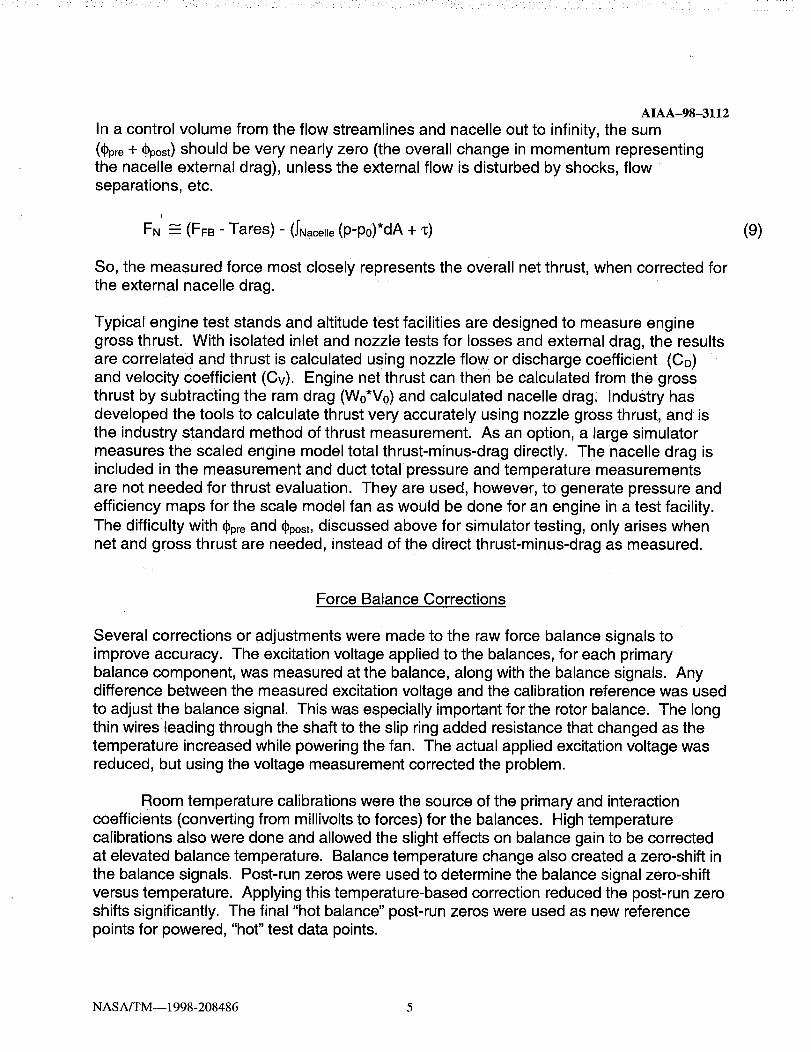
In a control volume from the flow streamlines and nacelle out to infinity, the sum
((l)pre + _post) should be very nearly zero (the overall change in momentum representingthe nacelle external drag), unless the external flow is disturbed by shocks, flow
separations, etc.
I
FN _ (FEB- Tares)- (fNacelle (p-po)*dA + "0
So, the measured force most closely represents the overall net thrust, when corrected for
the external nacelle drag.
Typical engine test stands and altitude test facilities are designed to measure engine
gross thrust. With isolated inlet and nozzle tests for losses and external drag, the results
are correlated and thrust is calculated using nozzle flow or discharge coefficient (Co)
and velocity coefficient (Cv). Engine net thrust can then be calculated from the grossthrust by subtracting the ram drag (W0*V0) and calculated nacelle drag. Industry has
developed the tools to calculate thrust very accurately using nozzle gross thrust, and is
the industry standard method of thrust measurement. As an option, a large simulator
measures the scaled engine model total thrust-minus-drag directly. The nacelle drag isincluded in the measurement and duct total pressure and temperature measurements
are not needed for thrust evaluation. They are used, however, to generate pressure and
efficiency maps for the scale model fan as would be done for an engine in a test facility.
The difficulty with _pre and Cpost,discussed above for simulator testing, only arises whennet and gross thrust are needed, instead of the direct thrust-minus-drag as measured.
(9)
Force Balance Corrections
Several corrections or adjustments were made to the raw force balance signals to
improve accuracy. The excitation voltage applied to the balances, for each primary
balance component, was measured at the balance, along with the balance signals. Any
difference between the measured excitation voltage and the calibration reference was used
to adjust the balance signal. This was especially important for the rotor balance. The longthin wires leading through the shaft to the slip ring added resistance that changed as the
temperature increased while powering the fan. The actual applied excitation voltage was
reduced, but using the voltage measurement corrected the problem.
Room temperature calibrations were the source of the primary and interaction
coefficients (converting from millivolts to forces) for the balances. High temperature
calibrations also were done and allowed the slight effects on balance gain to be correctedat elevated balance temperature. Balance temperature change also created a zero-shift in
the balance signals. Post-run zeros were used to determine the balance signal zero-shift
versus temperature. Applying this temperature-based correction reduced the post-run zeroshifts significantly. The final "hot balance" post-run zeros were used as new reference
points for powered, "hot" test data points.
NASA/TM--1998-208486 5
AIAA-98-3112
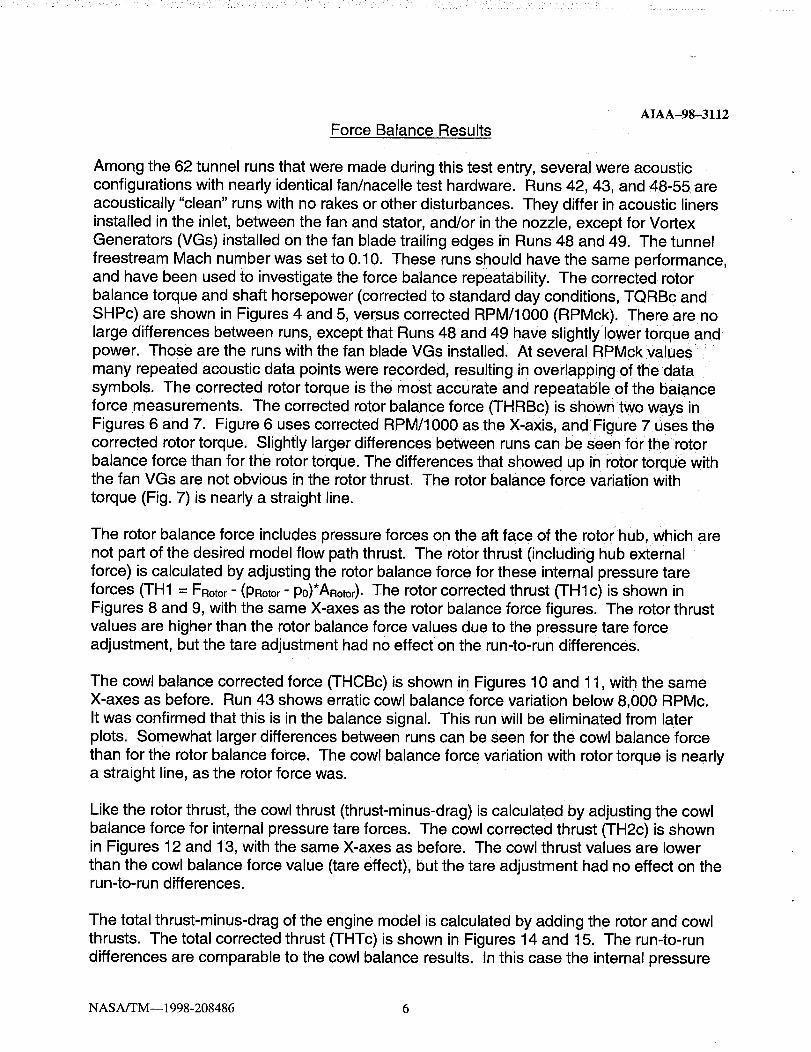
Force Balance Results
Among the 62 tunnel runs that were made during this test entry, several were acoustic
configurations with nearly identical fan/nacelle test hardware. Runs 42, 43, and 48-55 are
acoustically "clean" runs with no rakes or other disturbances. They differ in acoustic liners
installed in the inlet, between the fan and stator, and/or in the nozzle, except for VortexGenerators (VGs) installed on the fan blade trailing edges in Runs 48 and 49. The tunnel
freestream Mach number was set to 0.10. These runs should have the same performance,
and have been used to investigate the force balance repeatability. The corrected rotor
balance torque and shaft horsepower (corrected to standard day conditions, TQRBc and
SHPc) are shown in Figures 4 and 5, versus corrected RPM/1000 (RPMck). There are no
large differences between runs, except that Runs 48 and 49 have slightly lower torque andpower. Those are the runs with the fan blade VGs installed. At several RPMck values
many repeated acoustic data points were recorded, resulting in overlapping of the data
symbols. The corrected rotor torque is the most accurate and repeatable of the balance
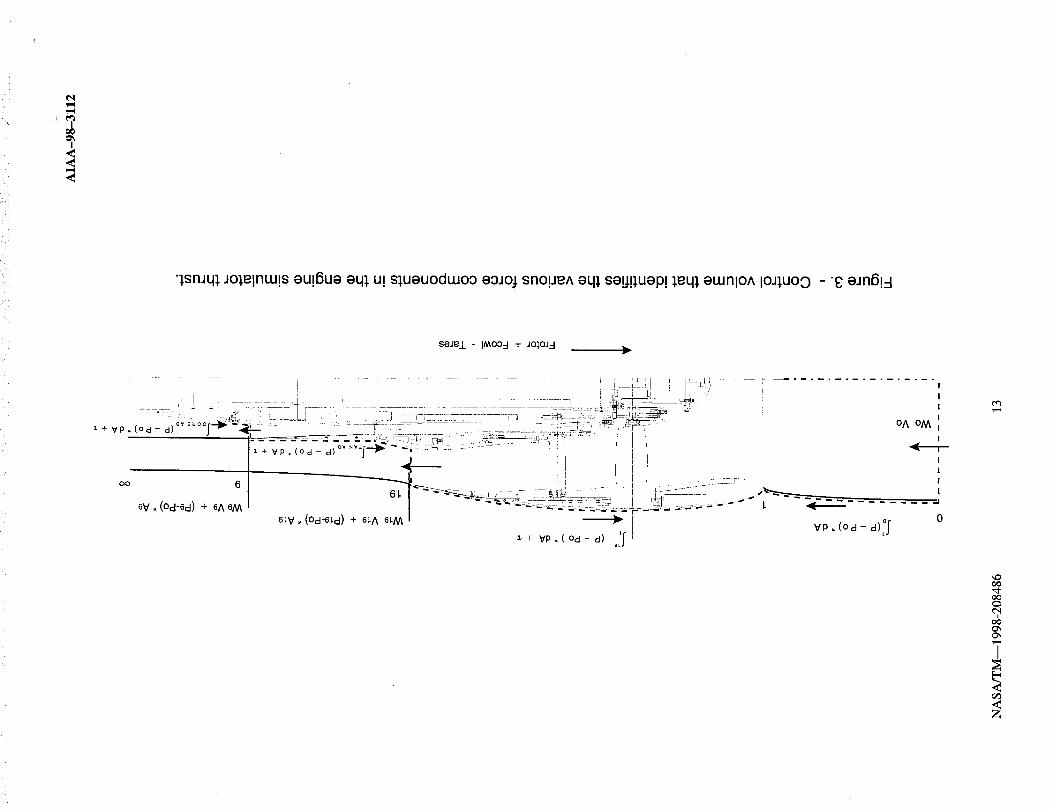
force measurements. The corrected rotor balance force (THRBc) is shown two ways in
Figures 6 and 7. Figure 6 uses corrected RPM/1000 as the X-axis, and Figure 7 uses thecorrected rotor torque. Slightly larger differences between runs can be seen for the rotor
balance force than for the rotor torque. The differences that showed up in rotor torque withthe fan VGs are not obvious in the rotor thrust. The rotor balance force variation with
torque (Fig. 7) is nearly a straight line.
The rotor balance force includes pressure forces on the aft face of the rotor hub, which are
not part of the desired model flow path thrust. The rotor thrust (including hub external
force) is calculated by adjusting the rotor balance force for these internal pressure tare
forces (TH1 = Faotor - (Paotor " P0)*Aaotor). The rotor corrected thrust (THlc) is shown in
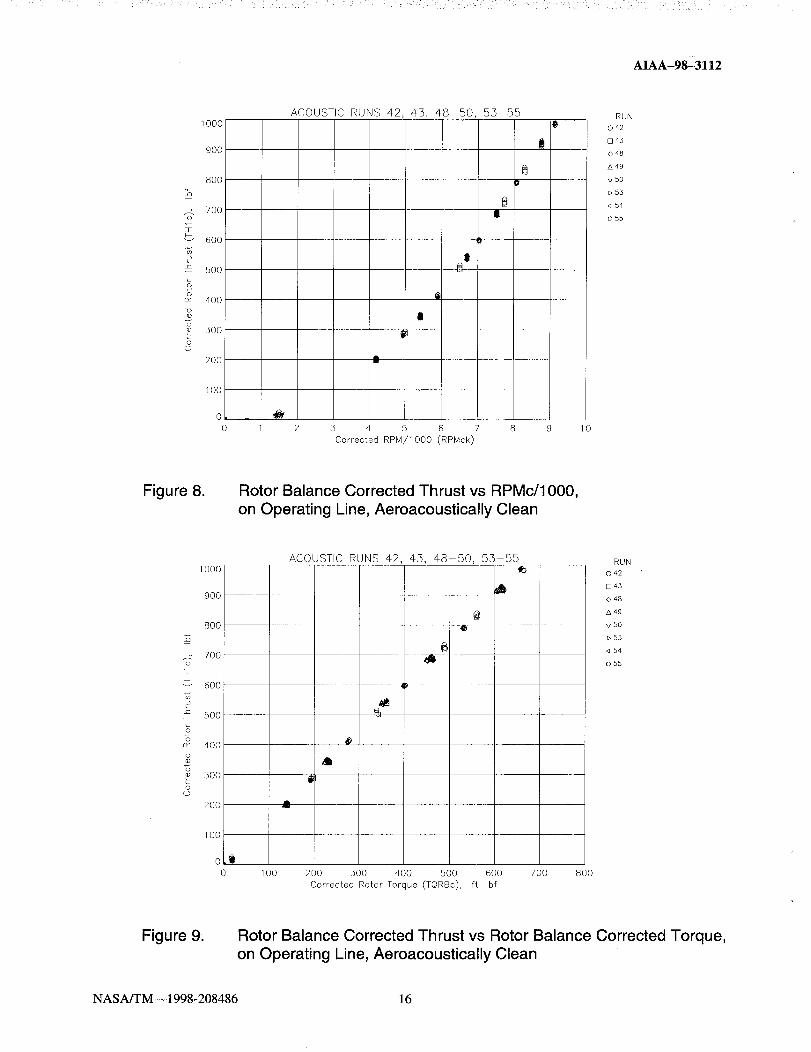
Figures 8 and 9, with the same X-axes as the rotor balance force figures. The rotor thrust
values are higher than the rotor balance force values due to the pressure tare forceadjustment, but the tare adjustment had no effect on the run-to-run differences.
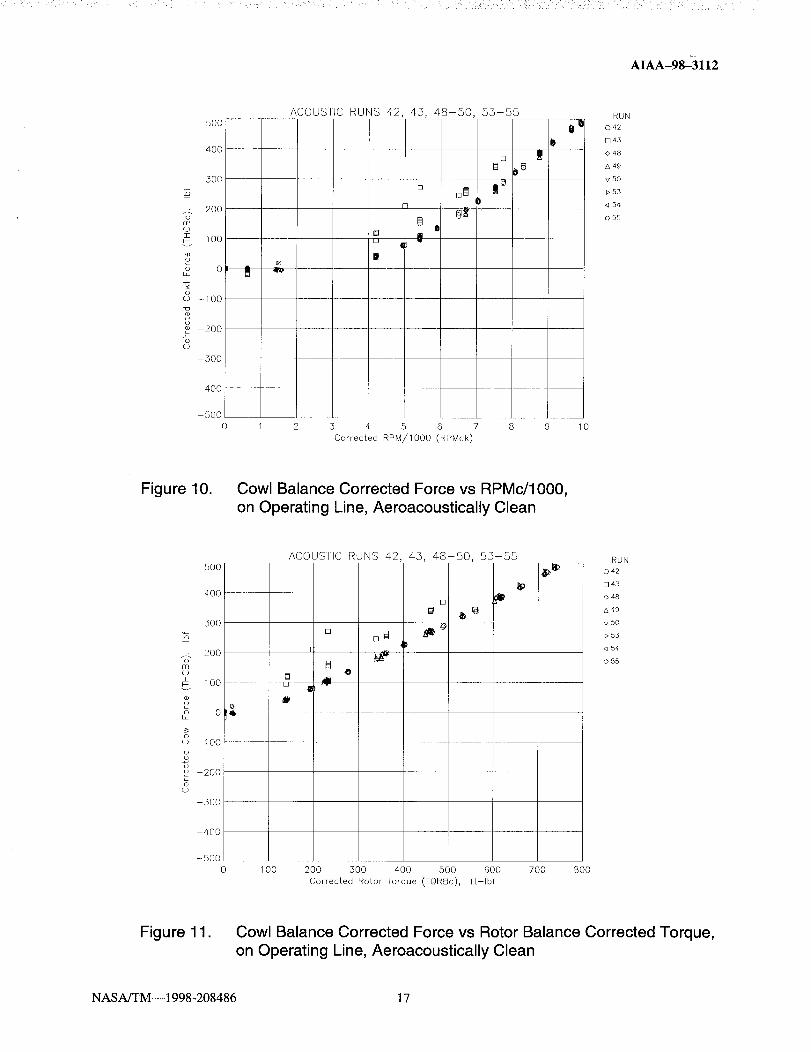
The cowl balance corrected force (THCBc) is shown in Figures 10 and 11, with the same
X-axes as before. Run 43 shows erratic cowl balance force variation below 8,000 RPMc.
It was confirmed that this is in the balance signal. This run will be eliminated from laterplots. Somewhat larger differences between runs can be seen for the cowl balance force
than for the rotor balance force. The cowl balance force variation with rotor torque is nearlya straight line, as the rotor force was.
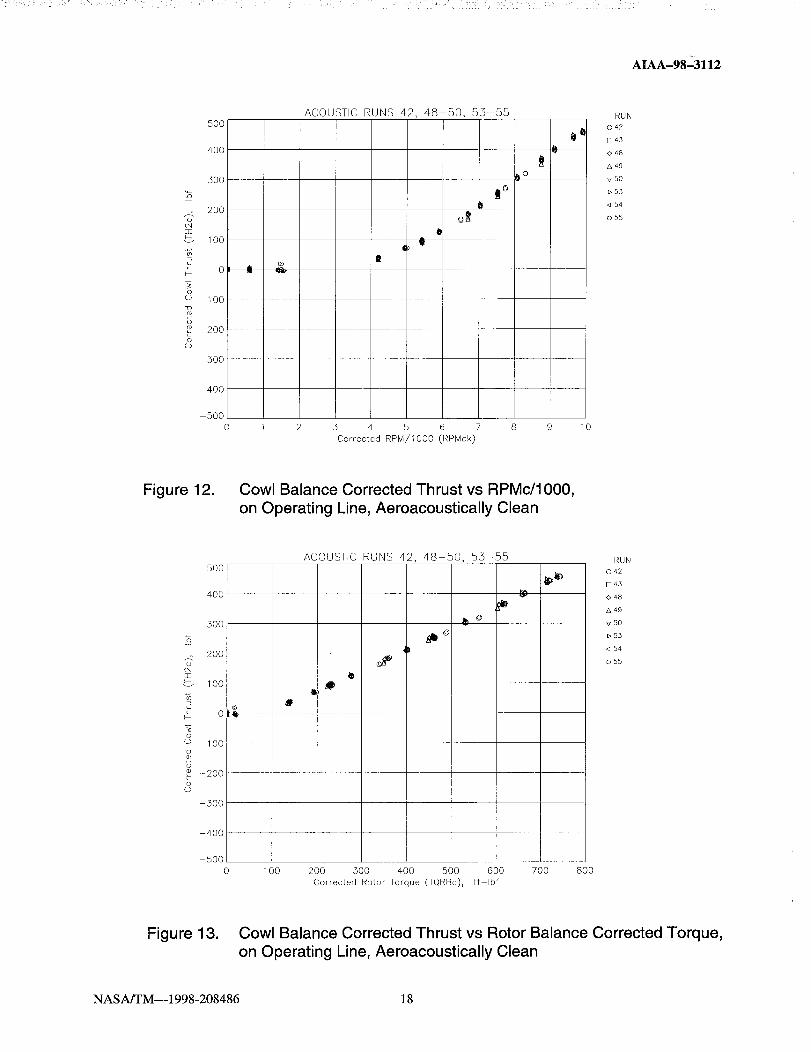
Like the rotor thrust, the cowl thrust (thrust-minus-drag) is calculated by adjusting the cowl
balance force for internal pressure tare forces. The cowl corrected thrust (TH2c) is shownin Figures 12 and 13, with the same X-axes as before. The cowl thrust values are lower
than the cowl balance force value (tare effect), but the tare adjustment had no effect on therun-to-run differences.
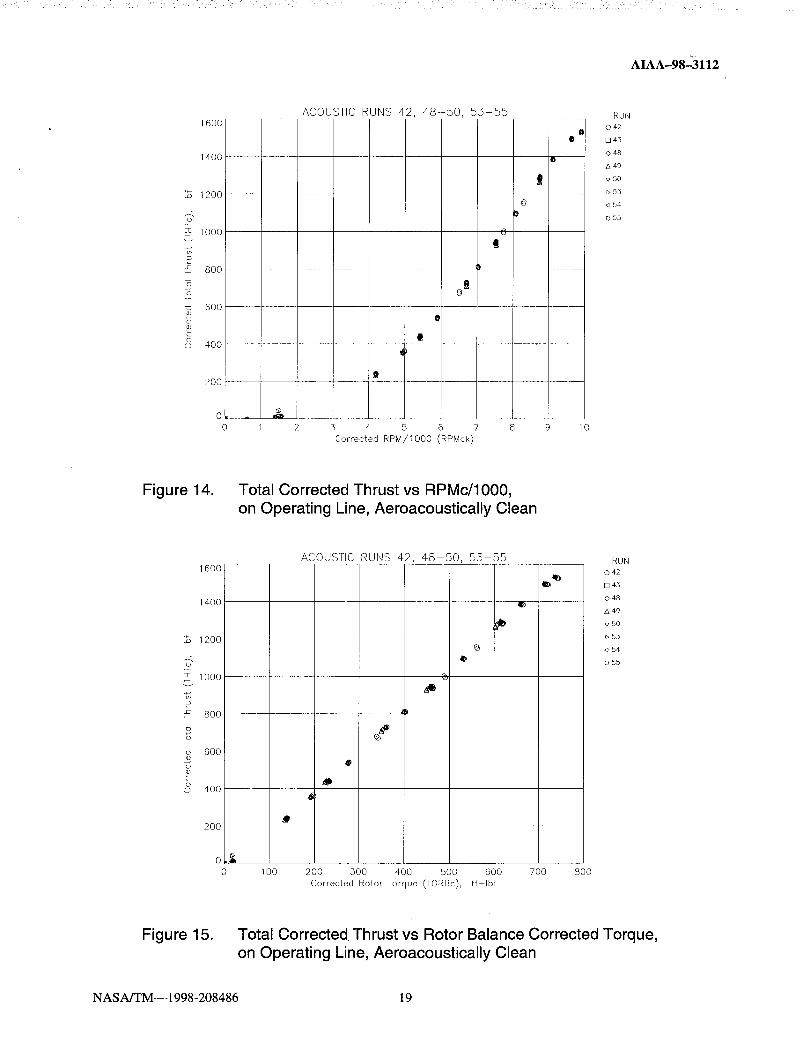
The total thrust-minus-drag of the engine model is calculated by adding the rotor and cowlthrusts. The total corrected thrust (THTc)is shown in Figures 14 and 15. The run-to-run
differences are comparable to the cowl balance results. In this case the internal pressure
NASA/TM--1998-208486 6
AIAA-98-3112
tare forces are reduced because a large portion of the tare acts in one direction on the aft
rotor face and in the opposite direction on the cowl balance forward face.
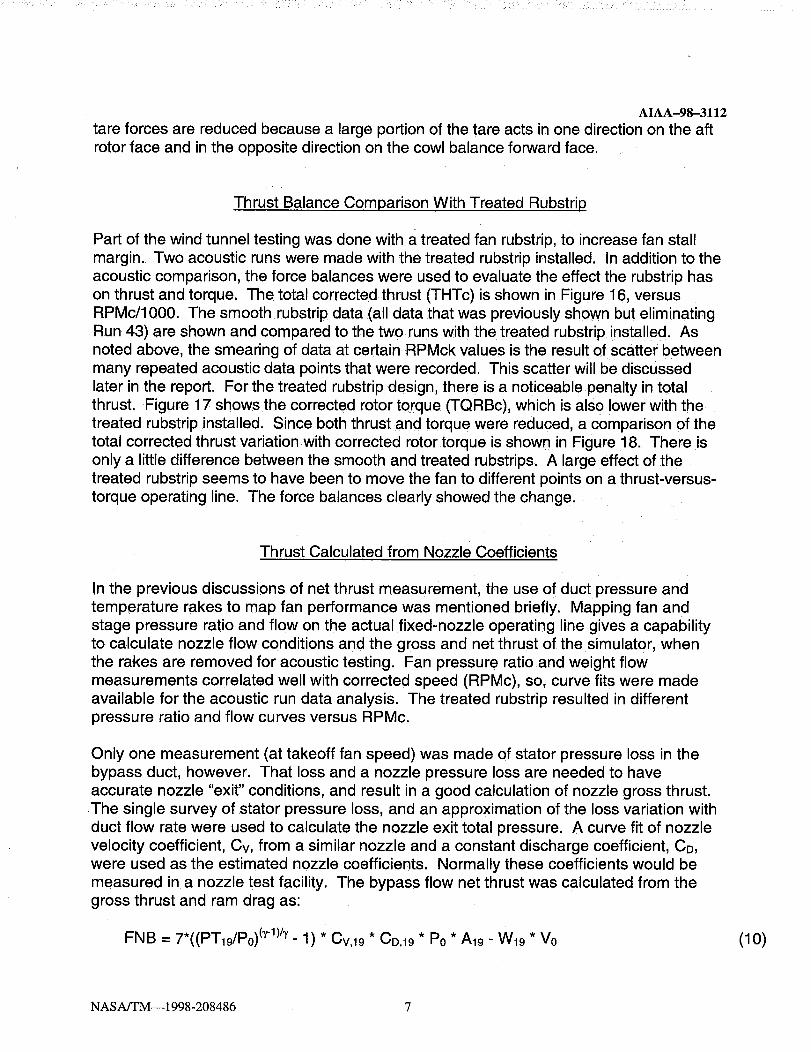
Thrust Balance Comparison With Treated Rubstrip
Part of the wind tunnel testing was done with a treated fan rubstrip, to increase fan stall
margin. Two acoustic runs were made with the treated rubstrip installed. In addition to the
acoustic comparison, the force balances were used to evaluate the effect the rubstrip has
on thrust and torque. The total corrected thrust (THTc) is shown in Figure 16, versus
RPMc/1000. The smooth rubstrip data (all data that was previously shown but eliminating
Run 43) are shown and compared to the two runs with the treated rubstrip installed. As
noted above, the smearing of data at certain RPMck values is the result of scatter betweenmany repeated acoustic data points that were recorded. This scatter will be discussed
later in the report. For the treated rubstrip design, there is a noticeable penalty in total
thrust. Figure 17 shows the corrected rotor torque (TQRBc), which is also lower with the
treated rubstrip installed. Since both thrust and torque were reduced, a comparison of the
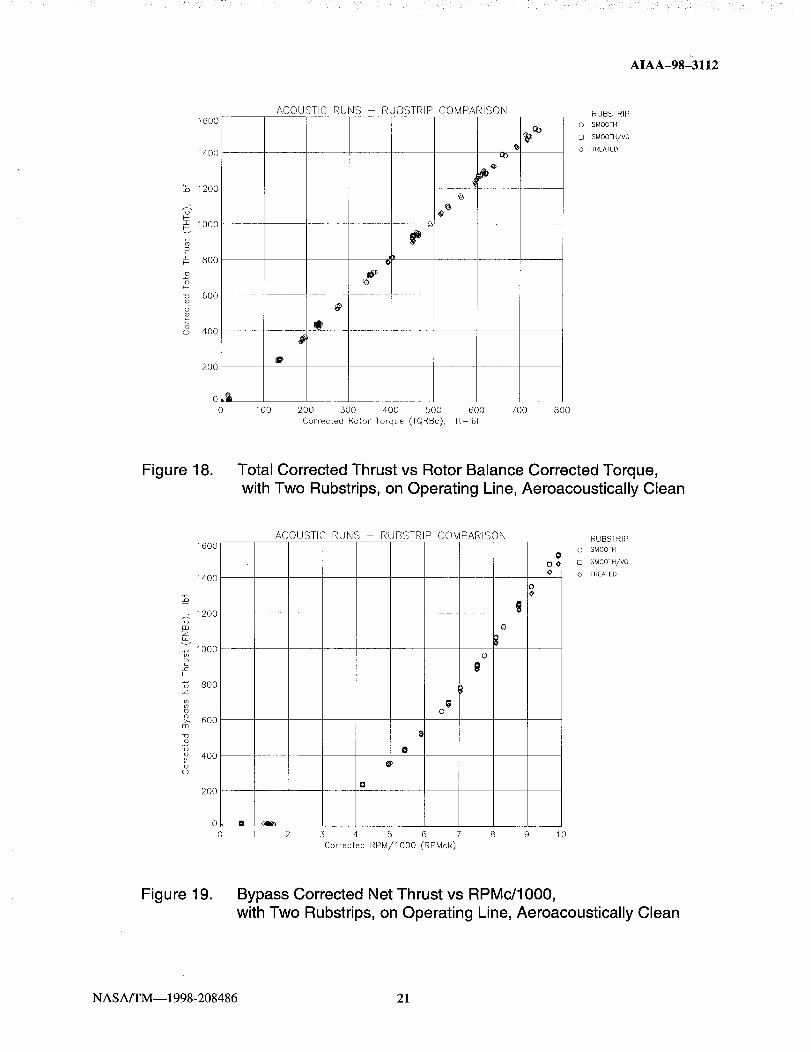
total corrected thrust variation with corrected rotor torque is shown in Figure 18. There isonly a little difference between the smooth and treated rubstrips. A large effect of the
treated rubstrip seems to have been to move the fan to different points on a thrust-versus-
torque operating line. The force balances clearly showed the change.
Thrust Calculated from Nozzle Coefficients
In the previous discussions of net thrust measurement, the use of duct pressure and
temperature rakes to map fan performance was mentioned briefly. Mapping fan and
stage pressure ratio and flow on the actual fixed-nozzle operating line gives a capabilityto calculate nozzle flow conditions and the gross and net thrust of the simulator, when
the rakes are removed for acoustic testing. Fan pressure ratio and weight flow
measurements correlated well with corrected speed (RPMc), so, curve fits were made
available for the acoustic run data analysis. The treated rubstrip resulted in differentpressure ratio and flow curves versus RPMc.
Only one measurement (at takeoff fan speed) was made of stator pressure loss in the
bypass duct, however. That loss and a nozzle pressure loss are needed to have
accurate nozzle "exit" conditions, and result in a good calculation of nozzle gross thrust.The single survey of stator pressure loss, and an approximation of the loss variation with
duct flow rate were used to calculate the nozzle exit total pressure. A curve fit of nozzle
velocity coefficient, Cv, from a similar nozzle and a constant discharge coefficient, CD,
were used as the estimated nozzle coefficients. Normally these coefficients would be
measured in a nozzle test facility. The bypass flow net thrust was calculated from thegross thrust and ram drag as:
FNB = 7*((PT19/P0) (xl)/_ -1) * Cv,10 * CD,19 * P0 * A19 - W19 * V0 (10)
NASA/TM--1998-208486 7

AIAA-98-3112
The core nozzle design was nearly a cylinder, with pressure and temperature rakes
installed just before the nozzle. Little loss would be expected, so high core nozzle Cvand CD coefficients were estimated and used for calculating core gross thrust. The core
flow net thrust was calculated from the gross thrust and ram drag as:
FNC = 7*((PTg/P0) (_1)/_- 1) * Cv.9 * CD,9 * P0 *AI_ - W9 * Vo
The total net thrust was calculated as the sum of the bypass and core net thrusts.
The freestream Much number was 0.10 for the acoustic runs. As a result, the nacelle
external drag was estimated to be small (less than 5 Ibf, compared to total thrust scatter
of about +10 Ibf). No attempt has been made to include this small drag adjustment to thesummary results shown in the figures showing net thrust.
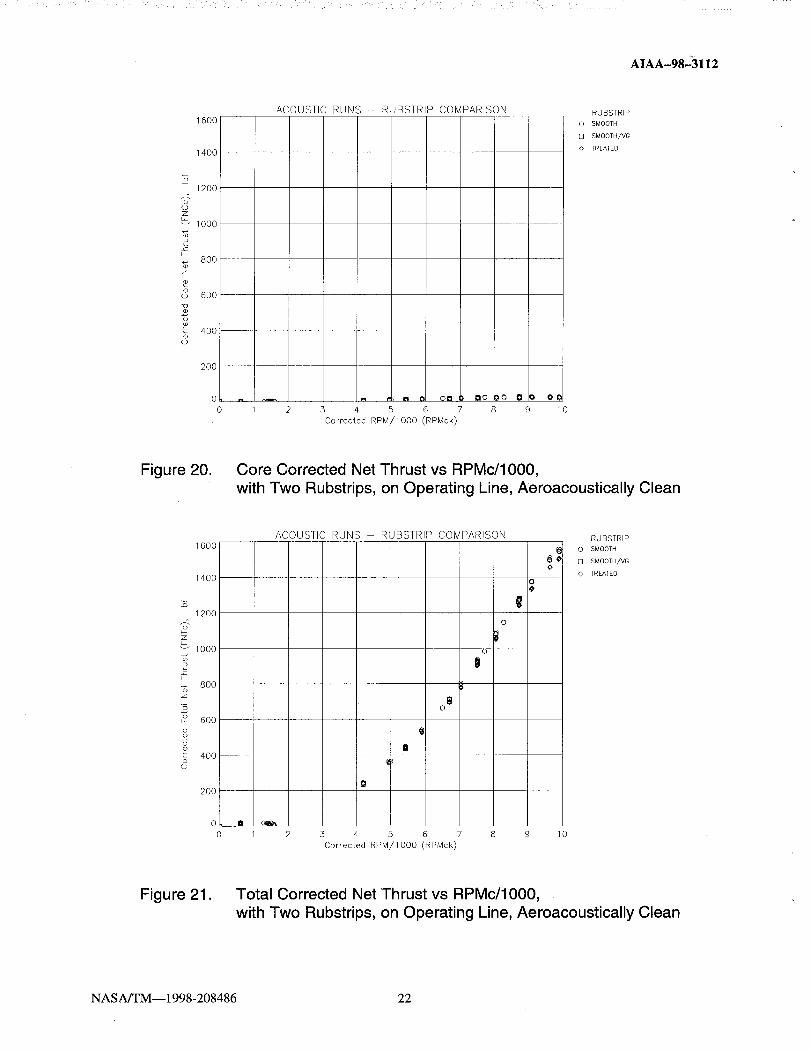
The gross and net thrust calculations were done for the acoustic wind tunnel runs
compared above. The bypass, core, and total corrected net thrust values (from nozzle
gross thrust calculations) are shown in Figures 19 to 21, versus RPMc/1000. The corenet thrust (Fig. 20) is nearly zero, so bypass net thrust is almost total net thrust for this
un-powered core simulation.
The total corrected net thrust (Fig. 21) shows very similar characteristics to the total
corrected thrust from the balance forces (Fig. 16). Both thrust methods show the treated
rubstrip with a thrust (operating line) reduction. A direct comparison of the total thrust-
minus-drag from the balance forces and the total corrected net thrust is shown Figure 22.A perfect agreement would be all data points falling along a diagonal line from zero to
1600 Ibf. The agreement is actually quite good. Most points appear shifted in the lower
net thrust direction, some of which should be the effect of the external nacelle drag.
Where there are many repeated data points (e.g. about 1250 Ibf) the total correctedthrust (Y-axis) shows a drift or scatter. This appears to be the limit of the force balance
repeatability, with run-to-run and thermal variations, and will be discussed in the next
section. The net thrust does not scatter much because it is mostly based on thepressure ratio and flow curve fits.
(11)
Performance and Repeatability Near Takeoff
The previous figures show the force balance values for thrust to be reasonably accurate
and repeatable. The plot scales are large, and do not allow evaluation of the error bandof the measurements. Figures 23 to 29 show the details of the force balance
measurements; using expanded scales centered around the takeoff operating point(8,750 RPMc). The bypass net thrust equation can be used with the nozzle conditions
near takeoff, to get a sense of the accuracy needed to measure small changes in duct
pressure loss. If a 0.10 percent error or change in nozzle total pressure is assumed
(about 0.0185 psi), slightly over 6.4 Ibf change in bypass net thrust results (0.52 percent
change in net thrust). If the weight flow is known accurately, the change in net thrust isreduced to 3.1 Ibf (0.26 percent change).
NASA/TM--1998-208486 8

AIAA-98-3112
Rotor balance corrected torque is shown in Figure 23. For each of the three test
configurations shown, the variation between runs is about +4 ft-lbf. That is +0.66 percent
of the average torque (about 610 ft-lbf), and +0.26 percent of the 1,530 ft-lbf full scale
torque for the rotating balance. The overall torque accuracy from the balance calibration
at room temperature was +0.25 percent of full scale. The few points of smooth rubstripdata with fan blade VGs on the fan blades can be seen at about 10 ft-lbf (1.64 percent)
below the baseline, smooth rubstrip data. The treated rubstrip torque is about 20 ft-lbf
(3.28 percent) below the baseline smooth rubstrip.
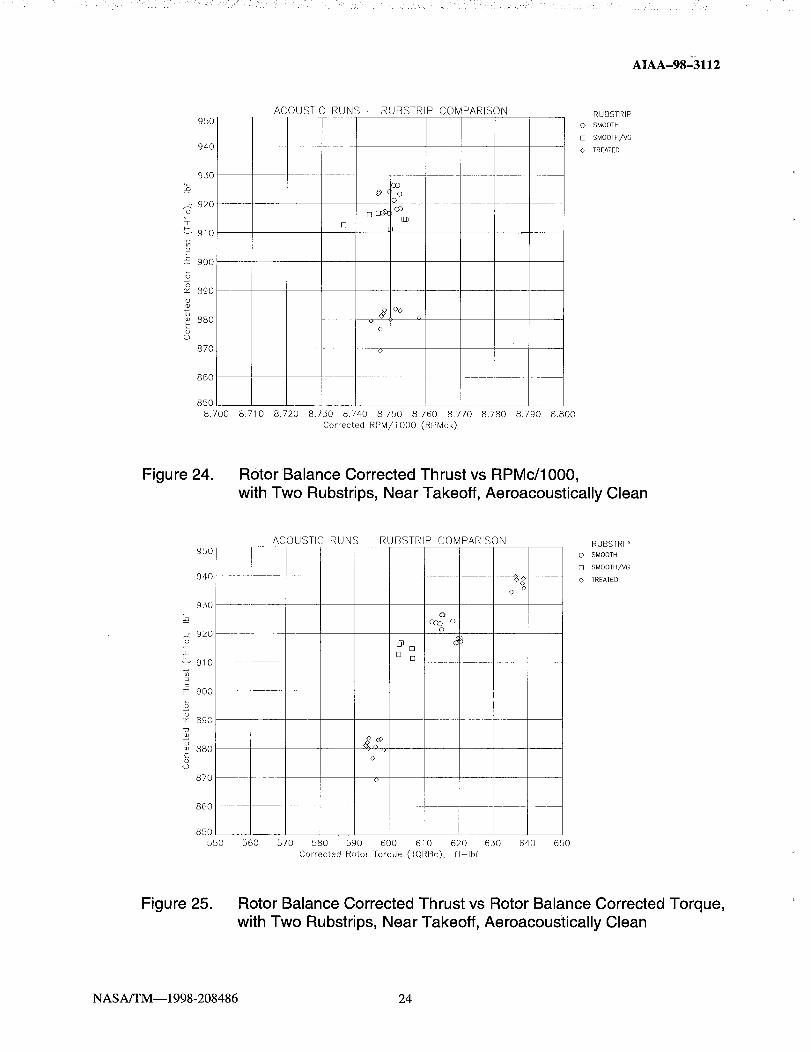
Rotor balance corrected thrust is shown in Figures 24 and 25. Figure 25 used the rotor
balance corrected torque as the X-axis to show any effect an operating line change mighthave on the indicated scatter. For the test configurations shown, the variation between
runs is about +6 Ibf. That is +0.67 percent of the average thrust (about 900 Ibf), and
+0.30 percent of the 2,000 Ibf full scale thrust for the rotating balance. The overall thrust
accuracy from the balance calibration at room temperature was _+0.23 percent of full
scale. The smooth rubstrip with fan VGs on the fan blades is only 4 Ibf below the smooth
rubstrip configuration. That shows up best on Figure 25 because the torque (X-axis)
changed enough to make the data points stand out. The treated rubstrip thrust is about40 Ibf below the baseline smooth rubstrip data. However, Figure 25 shows the source of
most of the thrust loss is the lower operating torque. At about 640 ft-lbf torque, a second
set of treated rubstrip data appears on this plot (a higher RPMc), Interpolating at the
same torque level, the treated rubstrip rotor thrust is only about 15 ft-lbf below that of the
smooth rubstrip. That would be the penalty if the fan speed were increased tocompensate for the treated rubstrip.
Cowl balance corrected thrust is shown in Figures 26 and 27. As done for the rotor
thrust, Figure 27 used the rotor balance corrected torque as the X-axis. For the test
configurations shown, the variation between runs is about +8 Ibf. That is_+2.22 percent
of the average thrust (about 360 Ibf), and +0.40 percent of the 2,000 Ibf full scale thrust
for the cowl balance. The overall thrust accuracy from the balance calibration at room
temperature was +0.10 percent of full scale. The fan VG thrust data is about 10 Ibf lower
than the baseline smooth rubstrip data. That shows up best on Figure 27, again
because of the torque change. Surprisingly, the treated rubstrip thrust is about the same
level as that of the baseline smooth rubstrip. Figure 27 shows there is some thrust loss
from the lower operating torque, but some data points with the treated rubstrip jumped upabout 10 Ibf.
Total corrected thrust is shown in Figures 28 and 29. As done for the individual thrusts,
Figure 29 used the rotor balance corrected torque as the X-axis. For the three
configurations, the variation between runs is about +10 Ibf. That is +0.78 percent of the
average total thrust (about 1,290 Ibf for the baseline), and +0.25 percent of the total4,000 Ibf full scale thrust for the balances. The fan VG data is about 20 Ibf
(1.55 percent) lower than the baseline. The treated rubstrip thrust is about the 50 Ibf
(3.89 percent) lower than that of the baseline smooth rubstrip. Figure 29 shows most ofthat thrust loss is from the lower operating torque.
NASA/TM--1998-208486 9
AIAA-98-3112
At the beginning of this section, the change in net thrust due to a 0.10 percent change in
nozzle total pressure (a very accurate average measurement to make) was calculated to
be 0.26 percent, if the weight flow is known accurately, The scatter or variations inaverage total thrust measured with the force balances are about three times that. So,
about +0.30 percent in nozzle pressure would be difficult to identify with the force
balance measurements. The force balances were able to measure total thrust changes
of 1.55 and 3.89 percent, and rotor torque changes of 1.64 and 3.28 percent, from the
effects of fan blade VGs and treated rubstrip, respectively.
Summary of Results
A large scale model representative of a low-noise, high bypass ratio turbofan engine was
tested for acoustics and performance in the NASA Lewis 9- by 15-Foot Low-Speed Wind
Tunnel. The low tip speed fan, nacelle, and an un-powered core passage (with core inlet
guide vanes) were simulated. The fan blades and hub are mounted on a rotating thrustand torque balance. The nacelle, bypass duct stators, and core passage are attached toa six component force balance. The two balance forces, when corrected for internal
pressure tares, measure the total thrust-minus-drag of the engine simulator. Corrected
for scaling and other effects, it is basically the same force that the engine supports wouldfeel, operating at similar conditions. A control volume is shown and discussed,
identifying the various force components of the engine simulator thrust and definitions of
net thrust. Several wind tunnel runs with nearly the same hardware installed are
compared, to identify the repeatability of the measured thrust-minus-drag. Analysis of
run-to-run force balance scatter indicates torque repeatability is within +0.66 percent ofthe torque near the takeoff operating point for this model. Measured repeatability of total
thrust at takeoff was within +0.78 percent of the takeoff total thrust. Other wind tunnel
runs, with hardware changes that affected fan performance, are compared to the
baseline configuration. The force balances were able to measure total thrust changes of
1.55 and 3.89 percent, and rotor torque changes of 1.64 and 3.28 percent, from theeffects of fan blade vortex generators and treated rubstrip, respectively. A thrust
comparison between the force balance and nozzle gross thrust methods is shown, andboth thrust methods yielded very similar results.
References
1. Society of Automotive Engineers, "In-Flight Thrust Determination," SAE AIR 1703,Nov. 1985, Reaffirmed Dec. 1992.
2. MIDAP Study Group, "Guide to In-Flight Thrust Measurements of Turbojets and FanEngines," AGARDOGRAPH AG-237, Jan. 1979.
3. Society of Automotive Engineers, "Gas Turbine Engine Performance Station
Identification and Nomenclature," ARP 755A, Apr. 1974.
NASA/TM--1998-208486 10
I
"leuun_L puiM peeds-_aoq loo-I-£_ _q -6 s!Meq VSVN eq_ u! lepouJ eu!6ue ed_; d(]V - _ eJn6!-i
_Doo
oo
cq
OxOx
I

.iI
•seoueleq eoJoj pe6e6 UleJ],s op,e},s pue 6u!},e},oJ uo pelunow lepow dOV ue _to uo!_oes ssoJo - "E eJn6!-I
-- - "L 7- _ _
t",l
eJeMpJeH isel elleOeN/ue4 qoul-_:/V_d/VSVN
OO
oO
Cq
o_O_
I
I
•],snJq:_ JOlelnuJ!s eu!Bue eql u! s_uauodwoo eoJo_ sno!Jeh eq_ seu!_uep! leql ewnloA IOJJ,UOO - _ eJnB!-I
saJej_ - IMO0=I + JOlOJ_-I
VP.(Od- d)°f
OA oM
-I
o
o_
I

AIAA-98-3112
8OO
700
ACOUSTIC RUNS 42, 43, 48 50, 53 55
i 600
o500 Q
400$
300
h 200
8
!
lOO
0
0 1 2 3 4 5 6 7 8 9
Correc[ed RPM/IO00 (RPMck)
10
RUN
0 42
[] 43
o48
z_ 49
50
53
q 54
o55
Figure 4. Rotor Balance Corrected Torque vs RPMc/1000,
on Operating Line, Aeroacoustically Clean
_o
(/3
g_d®
oo
140,
12@
1O@
80O
6OO
40O
2OO
0
0
ACOUSTIC RUNS 42, 43, 48-50, 53-55
u_
0
n
rl
!
rl
0
n
1 2 3 4 5 6 7 8 9 lO
Correc[ed RPM/IO00 (RPMck)
RUNI!
o 42[] 43
048
A 49
v 50
_, 53
,I 54
o 55
Figure 5. Rotor Balance Corrected Shaft Horsepower vs RPMc/1000,
on Operating Line, Aeroacoustically Clean
NASA/TM--1998-208486 14
AIAA-983112
Cd
£
¥o_
8
lOOO
900----
8oo
7oo
6oo
5o0
4oo
3oo
200--
lOO
o
o
ACOUSTIC RUNS 42, 43, 48-50, 53 55
|
Q
1 2 3 4. 5 6 7 8
Corrected RPM/IO00 (RPMck)
0
J
RUNo 42
[] 43
o 48
A 49
v50
c>53
.s 54
055
10
Figure 6. Rotor Balance Corrected Force vs RPMc/1000,on Operating Line, Aeroacoustically Clean
F_
QE
z
¥o
oo
lOOO
9oo
800 ----
7oo
6oo
5oo
4oo
3oo
2oo
lOO
o
ACOUSTIC RUNS 42, 4.5, 48-50, 5.5--55
8
0
J
1oo 200 3oo 400 500 600 700 800
Corrected Rotor Torque (TQRBc), ft-lbf
RUN
0 42
[3 43
0 48
A 49
v50
D53
•s 54
o55
Figure 7. Rotor Balance Corrected Force vs Rotor Balance Corrected Torque,on Operating Line, Aeroacoustically Clean
NASA/TM--1998-208486 15
AIAA-98-3112
o
o
E
lOOO
900 ---
8oo
7oo
6oo
5oo
4oo
5oo
20o
lOO
oo 1
ACOUSTIC RUNS 42, 45, 48 50, 55 55
O
|8
2 .5 4 5 6 7 8 9
Corrected RPM/IO00 (RPMck)
0
A
lO
RUN
o 42
[1143
o 48
A 49
v50
_.55
< 54
0 55
Figure 8. Rotor Balance Corrected Thrust vs RPMc/1000,on Operating Line, Aeroacoustically Clean
o
F_+
o
oo
lOOO
900 --
800 --
7o0
600
500 --
4oo
5oo
2oo
lOO
O,ib
0
ACOUSTIC RUNS 42, 45, 48-50, 55 55_b
8
#
dll
A
1oo 200 500 400 500 600 700 800
Corrected Rotor Torque (TQRBc), ft Ibf
RUN
o 42
0 43
o 48
A 49
v50
c>5.5
•154
0 55
Figure 9, Rotor Balance Corrected Thrust vs Rotor Balance Corrected Torque,on Operating Line, Aeroacoustically Clean
NASA/TM--1998-208486 16
AIAA-98-3112
5OO
400
300 ----
._< 200
<9
100
o 0
c_ -100
o -200
8-300
4OO
-SO0
0
ACOUSTIC RUNS 42, 43, 48 50, 53-55
rlu
@
[] ol_
BI
I¢
om
I io
Do
1 2 3 4 5 6 7 8 9 10
Corrected RPM/IO00 (RPMck)
RUN
0 42
[] 43
048
A49
vSO
_>53
,a 54
0 55
Figure 10. Cowl Balance Corrected Force vs RPMc/IO00,
on Operating Line, Aeroacoustically Clean
oZ_J
o
oo
48oL
8
5OO
4OO
300
20O
100 --
0
100 --
2OO
-300
400
-500
0
[]u
D
ACOUSTIC RUNS 42, 45, 48-50, 55-55
[]
@
[]D
1 O0 200 300 400 500 600 700 800
Corrected Rotor Torque (TQRBc), ft-lbf
RUN
_[_ 0 42
[] 43
<>48
A49
V 50
53
<_54
055
Figure 11. Cowl Balance Corrected Force vs Rotor Balance Corrected Torque,on Operating Line, Aeroacoustically Clean
NASA/TM--1998-208486 17
! :,:_ _ <h _ i _ , i : ¸ / i :: • - r •
AIAA-98±3112
%
oo
5O0
400
5OO
200
IO0
0 e---I--
IO0
-200
-.500
4O0
-500
0
ACOUSTIC RUNS 42, 48-50, 55-55
¢
@
8
O
o2
_0
2 5 4 5 6 7 8 9 10
Corrected RPM/IO00 (RPMck)
RUN
o 42
E] 45
048
A49
,750
55
<_54
0 55
Figure 12. Cowl Balance Corrected Thrust vs RPMc/1000,
on Operating Line, Aeroacoustically Clean
%
oL_
ooh
5OO
4OO
5OO
2OO
IO0
o_
-100
-200
500
4O0
-500
0
ACOUSTIC RUNS 42, 48-50, 55-55
¢1
o
1 O0 200 500 400 500 600 700 800
Corrected Rotor Torque (TQRBc), ft Ibf
RUN
_ o 42[] 43
_) 0 48
z_ 49
v 50
D 55
<_ 54
0 55
Figure 13. Cowl Balance Corrected Thrust vs Rotor Balance Corrected Torque,on Operating Line, Aeroacoustically Clean
NASA/TM--1998-208486 18
AIAA-98-_3112
16OO
1 400
1200
1000
x_ 800k-
_ 60000J
cO) 400
ACOUSTIC RUNS 42, 48--50, 5.3 55
0
|
0
Ii
200 /--
0 1 2 5 4 5 6 7 8
Corrected RPM/IO00 (RPMck)
!
0
II
RUN
o 42
[] 43
o 48
A 49
v 50
b53
<154
o 55
10
Figure 14. Total Corrected Thrust vs RPMc/1000,on Operating Line, Aeroacoustically Clean
1600
1400
1200
1000
8OO
6OO
4OO
2OO
O,lh
0
ACOUSTIC RUNS 42, 48 50, 5.3 55
#
IB
11_)-
D
1O0 200 ,300 400 500 600 700 800
Corrected Rotor Torque (TQRBc), ft Ibf
RUN
o 42
43
o 48
A 49
,750
b 53
<_54
o 55
Figure 15. Total Corrected Thrust vs Rotor Balance Corrected Torque,on Operating Line, Aeroacoustically Clean
NASA/TM--1998-208486 19

AIAA-98L3112
1600
1400
1200
1000
8oo
g 6o0g
400
2OO
ACOUSTIC RUNS - RUBSTRIP COMPARISON
0
o
(3
0
I
0
0 1 2 ,3 4 5 6 7 8 9 10
Corrected RPM/IO00 (RPMck)
RUBSIRIP
o SMOOTII{
0 _ [] SMOOTH/VGO TREATED
Figure 16. Total Corrected Thrust vs RPMc/1000,with Two Rubstrips, on Operating Line, Aeroacoustically Clean
Cd
o
o
¥
8OO
700
6OO
50O
4OO
500
2OO
1DO
0
0
ACOUSTIC RUNS - RUBSTRIP COMPARISON
|
o
g
o
1
88e¢,
8e
2 5 4 5 6 7 8 9 10
Corrected RPM/IO00 (RPMck)
RUBSTRIP
o SMOOTH
[] SMOOTH/VG
O TREATED
Figure 17. Rotor Balance Corrected Torque vs RPMc/1000,with Two Rubstrips, on Operating Line, Aeroacoustically Clean
NASA/TM--1998-208486 20
' ' : •• • :" • i : : / /:•! : :: :5 !i_ : • /:
AIAA-98-3112
L
g
oc)
1600
1400----
1200
1000
800
6OO
4OO
2OO
0,_
0
ACOUSTIC RUNS RUBSTRIP COMPARISON
@
O
@(b
#
,@
¢)
i__
1O0 200 300 400 500 600 700 800
Corrected Rotor ]orque (TQRBc), ft-lbf
RUBSTRIP0 SMOOTH
_[_ [] SMOOTH/VG
o TREATED
Figure 18. Total Corrected Thrust vs Rotor Balance Corrected Torque,with Two Rubstrips, on Operating Line, Aeroacoustically Clean
16oo
1400
o 1200u13o
1000
800z
o0_
_, 60o
48'_ 400
200 --
00
ACOUSTIC RUNS RUBSTRIP COMPARISON
0
0
El
o
II
11
o
fl
1 2 3 4 5 6 7 8 9 10
Corrected RPM/IO00 (RPMck)
RUBSTRIP
0 SMOOTHoq [] SMOOIH/VG
0 0 TREATED
Figure 19. Bypass Corrected Net Thrust vs RPMc/1000,with Two Rubstrips, on Operating Line, Aeroacoustically Clean
NASA/TM--1998-208486 21
AIAA-98-3112
8E
2
z
8
8
8
1600
1400
1200
1000
800 ------
600 ----
4OO
2OO
0
0
ACOUSTIC RUNS - RUBSTRIP COMPARISON
1 2 5 4 5 6 7 8 9 10
Corrected RPM/IO00 (RPMck)
RUBSTRIP
o SMOOTH
[] SMOOTH/VG
0 TREATED
Figure 20. Core Corrected Net Thrust vs RPMc/1000,with Two Rubstrips, on Operating Line, Aeroacoustically Clean
#E
"d
#
z
o
o£p
1600
1400
1200
1000
8O0
6O0
400 --
2OO
ACOUSTIC RUNS RUBSTRIP COMPARISON
II
lilo
o
It
o
1
OO
g
2 5 4 5 6 7 8 9 10
Corrected RPM/IO00 (RPMck)
RUBSTRIP
o SMOOTH
'_ [] SMOOTH/VG0
O TREATED
Figure 21. Total Corrected Net Thrust vs RPMc/1000,with Two Rubstrips, on Operating Line, Aeroacoustically Clean
NASA/TM--1998-208486 22

AIAA-98-3112
_2
£%
gg
8
60O
1400
1200
1000
800
600 .....
400
02OO
O_
0 200
ACOUSTIC RUNS - RUBSTRIP COMPARISON
0
@
6
0
400 600 800 1000 1200
Corrected Totol Net Thrust (FNTc), Ibf
1400 1600
RUBSTRIP
O SMOOTH
[] SMOOTH/VD
O TREATED
Figure 22. Balance Total Corrected Thrust vs Total Corrected Net Thrust
with Two Rubstrips, on Operating Line, Aeroacoustically Clean
I
o3
5
o-
o
o
gb_o
o
ACOUSTIC RUNS RUBSTRIP COMPARISON650
640
65O
62O
610
6OO
59O
58O
570
0 co
:6
o
[] (3 [3
56O
55O
8.700 8.710 8.720 8.750 8.740 8.750 8.760 8.770
Corrected RPM/IO00 (RPMck)
8.780 8.790 8,800
RUBSTRIP
o SMOOTH
[] SMOOTH/VG
O TREATED
Figure 23. Rotor Balance Corrected Torque vs RPMc/1000,with Two Rubstrips, Near Takeoff, Aeroacoustically Clean
NASA/TM--1998-208486 23
AIAA-98±3112
950
940
ACOUSTIC RUNS - RUBSTRIP COMPARISON
930
_q 920o
F-910
B
900
s890
o 880
oo
3o
@( o3
[]
0 _'_
0
87O
86O
85O8.700 8.710 8.720 8.750 8.740 8.750 8.760 8.770 8.780 8.790 8.800
Corrected RPM/IO00 (RPMck)
RUBSTRIP0 SMOOTH
[] SMOOTH/VG
0 TREATED
Figure 24. Rotor Balance Corrected Thrust vs RPMc/1000,with Two Rubstrips, Near Takeoff, Aeroacoustically Clean
o
IF--
L
¥@b_o(3
95O
94O
950
92O
910
9OO
89O
88O
87O
86O
85O550 560
ACOUSTIC RUNS RUBSTRIP COMPARISON
(}
coo oo
6rl
[][]
0¢,
©o
0
570 580 590 600 610 620 6.30 640 650
Corrected Rotor Torque (TQRBc), ft-lbf
RUBSTRIP0 SMOOTH
[] SMOOTH/VG
0 TREATED
Figure 25. Rotor Balance Corrected Thrust vs Rotor Balance Corrected Torque,with Two Rubstrips, Near Takeoff, Aeroacoustically Clean
NASA/TM--1998-208486 24

:/ " . = L 4 : • ":: • • :: • : " ¸::!¸¸¸¸:2"¸::¸!¸ ¸ : -T:: :• ::: i <• :
AIAA-98-3112 "
ACOUSTIC RUNS - RUBSTRIP COMPARISON RUBSTRIP4OO
o SMOOTH
[] SMOOTH/VG
590 o TREATED
580
o 570%"
I_- 560
55o
340-
8
oo
n°o_ o
o o
o
530
320
510
500
8.700 8,710 8.720 8.730 8.740 8.750 8.760 8.770 8.780 8.790
Corrected RPM//O00 (RPMck)
8,800
Figure 26. Cowl Balance Corrected Thrust vs RPMc/1000,
with Two Rubstrips, Near Takeoff, Aeroacoustically Clean
400
590
380
. 370%"o4i
360v
L__35o
o© 340
g 35o
832O
310
300
550
ACOUSTIC RUNS - RUBSTRIP COMPARISON
,$o_o o
[]o [] _ cc
%o
©
o
560 570 580 590 600 610 620 630 640 650
Corrected Rotor Torque (TQRBc), ft Ibf
RUBSTRIP
o SMOOTH
[] SMOOTH/VG
0 TREATED
Figure 27. Cowl Balance Corrected Thrust vs Rotor Balance Corrected Torque,with Two Rubstrips, Near Takeoff, Aeroacoustically Clean
NASA/TM--1998-208486 25

• ::L _ j ! J :: •:- }: :: }i-::':::: ::•. " "if: : ': ? : i• !'J< : :}':} ::: • " // i •:i!::.:: L:
AIAA-98-3112
1300
1290 ------
1280
1270
_-_ 1260
125o
1240
o1230
oo
1220
ACOUSTIC RUNS RUBSTRIP COMPARISON RUBSTRrPDO 0 SMOOTH
0 [] SMOOTH/VG
_C_ 0 TREATED
0
_0
G
o oo
4>
oo
<3o
1210
1200
8.700 8.710 8.720 8.730 8.740 8.750 8.760 8.770 8.780 8.790 8.800
Corrected RPM/IO00 (RPMck)
Figure 28. Total Corrected Thrust vs RPMc/1000,with Two Rubstrips, Near Takeoff, Aeroacoustically Clean
D
E-
o
go
1500
1290
1280
1270
1260
1250
1240
1230
1220
1210
1200
55O
ACOUSTIC RUNS RUBSTRIP COMPARISON RUBSTRIP
(_ O SMOOTH
o [] SMOOTH/VG
O TREATED
oO o(c
I3 c
[]
[]
o
o
560 570 580 590 600 610 620 630 640 650
Corrected Rotor Torque (TQRBc), ft Ibf
Figure 29. Cowl Balance Corrected Thrust vs Rotor Balance Corrected Torque,with Two Rubstrips, Near Takeoff, Aeroacoustically Clean
NASA/TM--1998-208486 26

REPORT DOCUMENTATION PAGE Form ApprovedOMB No. 0704-0188
Public reportingburden for this collectionof informationis estimated to average 1 hour per response, includingthe time for reviewing instructions,searchingexistingdata sources,gatheringand maintainingthe data needed, and completingand reviewingthe collectionof information. Send comments regarding this burdenestimateor any other aspect of thiscollection of information,includingsuggestionsfor reducingthis burden, to WashingtonHeadquartersServices, Directoratefor InformationOperationsand Reports,1215 JeffersonDavis Highway, Suite 1204, Arlington,VA 22202-4302, and to the Office of Management and Budget, Paperwork ReductionProject (0704-0188), Washington,DC 20503.
1. AGENCY USE ONLY (Leave blank) 2. REPORT DATE 13. REPORT TYPE AND DATES COVERED
July 1998 Technical Memorandum4. TITLE AND SUBTITLE
Model Engine Performance Measurement From Force Balance Instrumentation
6. AUTHOR(S)
Robert J. Jeracki
7. PERFORMING ORGANIZATION NAME(S) AND ADDRESS(ES)
National Aeronautics and Space Administration
Lewis Research Center
Cleveland, Ohio 44135-3191
9. SPONSORING/MONITORING AGENCY NAME(S) AND ADDRESS(ES)
National Aeronautics and Space Administration
Washington, DC 20546- 0001
5. FUNDING NUMBERS
WU-538--03-11-00
8. PERFORMING ORGANIZATIONREPORTNUMBER
E-11263
10. SPONSORING/MONITORINGAGENCY REPORT NUMBER
NASA TM--1998-208486
AIAA-98-3112
11. SUPPLEMENTARY NOTES
Prepared for the 34th Joint Propulsion Conference cosponsored by AIAA, ASME, SAE, and ASEE, Cleveland, Ohio,
July 12-15, 1998. Responsible person, Robert J. Jeracki, organization code 5940, (216) 433-3917.
12a. DISTRIBUTION/AVAILABILITY STATEMENT
Unclassified - Unlimited
Subject Categories: 02 and 07 Distribution: Nonstandard
This publication is available from the NASA Center for AeroSpace Information, (301) 621-0390.
12b. DISTRIBUTION CODE
13. ABSTRACT (Maximum 200 words)
A large scale model representative of a low-noise, high bypass ratio turbofan engine was tested for acoustics and perfor-
mance in the NASA Lewis 9- by 15-Foot Low-Speed Wind Tunnel. This test was part of NASA's continuing Advanced
Subsonic Technology Noise Reduction Program. The low tip speed fan, nacelle, and an un-powered core passage (with
core inlet guide vanes) were simulated. The fan blades and hub are mounted on a rotating thrust and torque balance. The
nacelle, bypass duct stators, and core passage are attached to a six component force balance. The two balance forces,
when corrected for internal pressure tares, measure the total thrust-minus-drag of the engine simulator. Corrected for
scaling and other effects, it is basically the same force that the engine supports would feel, operating at similar conditions.
A control volume is shown and discussed, identifying the various force components of the engine simulator thrust and
definitions of net thrust. Several wind tunnel runs with nearly the same hardware installed are compared, to identify the
repeatability of the measured thrust-minus-drag. Other wind tunnel runs, with hardware changes that affected fan perfor-
mance, are compared to the baseline configuration, and the thrust and torque effects are shown. Finally, a thrust compari-
son between the force balance and nozzle gross thrust methods is shown, and both yield very similar results.
14. SUBJECT TERMS
Ducted fans; Thrust; Performance; Turbofan; Simulator
17. sECURITY CLASSIFICATION 18. SECURITY CLASSIFICATION
OF REPORT OF THIS PAGE
Unclassified Unclassified
19. SECURITY CLASSIFICATIONOF ABSTRACT
Unclassified
15. NUMBER OF PAGES
3216. PRICE CODE
A0320. LIMITATION OF ABSTRACT
NSN 7540-01-280-5500 Standard Form 298 (Rev. 2-89)
Prescribed by ANSI Std. Z39-18298-102