model-based systems engineering approach to managing mass
TRANSCRIPT
Model-Based Systems Engineering Approach to Managing Mass Margin
5th International Workshop on Systems & Concurrent Engineering for Space Applications
- SECESA 2012 -
17–19 October 2012
Alameda Campus of IST / Technical University of LisbonLisbon, Portugal
Seung H. Chung, Todd J. Bayer, Bjorn Cole, Brian Cooke, Frank Dekens, Christopher Delp, Doris Lam
Jet Propulsion Laboratory, California Institute of TechnologyPasadena, CA 91109, U.S.A.
Email: [email protected]
INTRODUCTION
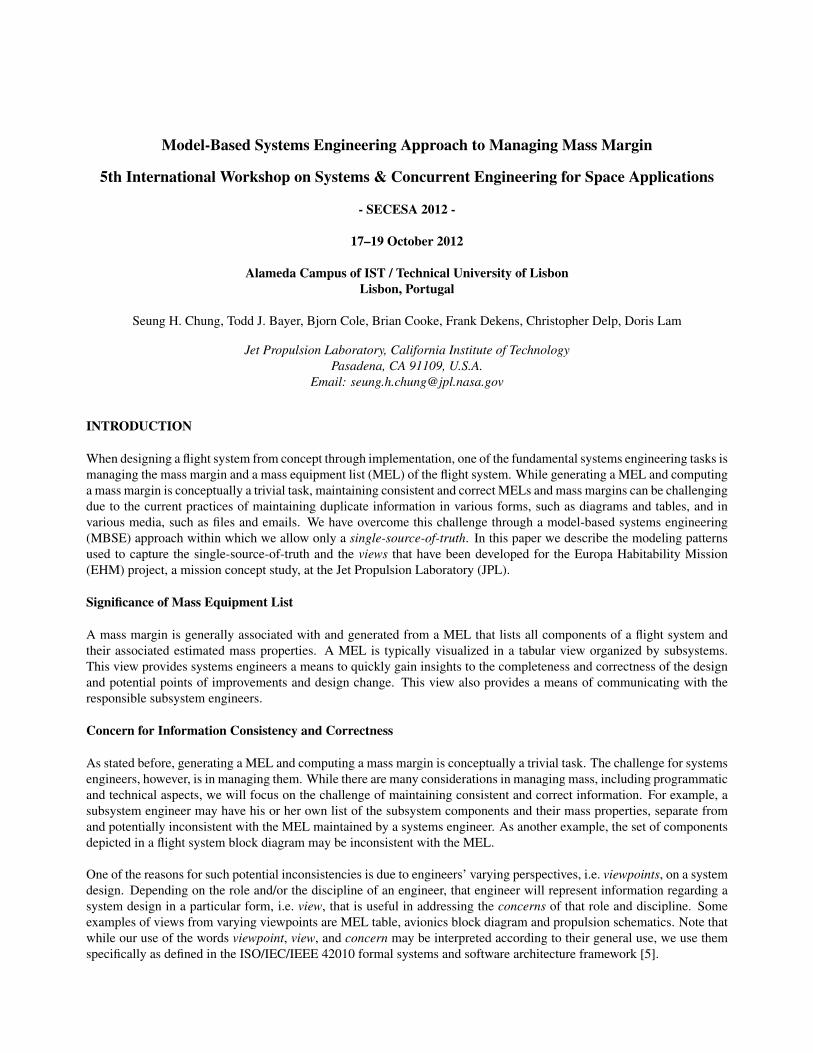
When designing a flight system from concept through implementation, one of the fundamental systems engineering tasks ismanaging the mass margin and a mass equipment list (MEL) of the flight system. While generating a MEL and computinga mass margin is conceptually a trivial task, maintaining consistent and correct MELs and mass margins can be challengingdue to the current practices of maintaining duplicate information in various forms, such as diagrams and tables, and invarious media, such as files and emails. We have overcome this challenge through a model-based systems engineering(MBSE) approach within which we allow only a single-source-of-truth. In this paper we describe the modeling patternsused to capture the single-source-of-truth and the views that have been developed for the Europa Habitability Mission(EHM) project, a mission concept study, at the Jet Propulsion Laboratory (JPL).
Significance of Mass Equipment List
A mass margin is generally associated with and generated from a MEL that lists all components of a flight system andtheir associated estimated mass properties. A MEL is typically visualized in a tabular view organized by subsystems.This view provides systems engineers a means to quickly gain insights to the completeness and correctness of the designand potential points of improvements and design change. This view also provides a means of communicating with theresponsible subsystem engineers.
Concern for Information Consistency and Correctness
As stated before, generating a MEL and computing a mass margin is conceptually a trivial task. The challenge for systemsengineers, however, is in managing them. While there are many considerations in managing mass, including programmaticand technical aspects, we will focus on the challenge of maintaining consistent and correct information. For example, asubsystem engineer may have his or her own list of the subsystem components and their mass properties, separate fromand potentially inconsistent with the MEL maintained by a systems engineer. As another example, the set of componentsdepicted in a flight system block diagram may be inconsistent with the MEL.
One of the reasons for such potential inconsistencies is due to engineers’ varying perspectives, i.e. viewpoints, on a systemdesign. Depending on the role and/or the discipline of an engineer, that engineer will represent information regarding asystem design in a particular form, i.e. view, that is useful in addressing the concerns of that role and discipline. Someexamples of views from varying viewpoints are MEL table, avionics block diagram and propulsion schematics. Note thatwhile our use of the words viewpoint, view, and concern may be interpreted according to their general use, we use themspecifically as defined in the ISO/IEC/IEEE 42010 formal systems and software architecture framework [5].


EUROPA STUDY 2012 REPORT EUROPA LANDER MISSION
D-106 Copyright 2012. All rights reserved. Government sponsorship acknowledged.
diameter of the Propulsion Module. It was decided not to mount the component plates to an interior wall of the Propulsion Module because of limited accessibility during ATLO.
A single ME, mounted using struts at the bottom of the Propulsion Module and protrud-ing through the Power Source Module, pro-vides for primary 'V. The RCS and TVC thrusters are mounted on four TCAs, which in turn are mounted on struts extending away from the spacecraft. This configuration is very similar to that of the Cassini RCS. Each TCA contains four RCS thrusters (two primary and two redundant) and a pair of TVC thrusters (one primary and one redundant). The RCS
thrusters are block-redundant, in that there are two strings of eight thrusters. Each string of eight thrusters is isolated by a single latch valve. The RCS thruster configuration pro-vides for coupled thrust about the Z-axis (roll) and uncoupled thrust in pitch and yaw, identi-cal to the Cassini configuration. The spacecraft can be turned to align this axis with the reac-tion wheel momentum vector in order to min-imize 'V during momentum management. The ME is currently envisioned to be single-string, as has been the case for many previous plane-tary missions (Galileo, Odyssey, Messenger, etc.). This risk posture will be revisited in Phase A.
Figure D.2.4-10. Dual-mode, bipropellant Propulsion Subsystem design operates after one failure. Fig. 5: The propulsion schematic of the Carrier from the Europa Lander Mission Study [3, pg. D-106].
MagicDraw UML, 1-1 Untitled1 WorkPackages Oct 4, 2012 12:17:50 PM
WorkPackages[Package] bdd [ ]
«Work Package»
Spacecraft System
«Work Package»
Power Subsystem
«Work Package»
Project
«Work Package»
C&DH Subsystem
«Work Package»
Payload System
«authorizes»
«authorizes»«authorizes»
«authorizes»
Fig. 6: The modeling pattern in SysML for specifying the Work Breakdown Structure (WBS).
MagicDraw UML, 1-1 Untitled1 WorkPackage Supplied Products Oct 4, 2012 12:22:03 PM
WorkPackage Supplied Products[Package] bdd [ ]
«Work Package»
Payload System«Work Package»
Spacecraft System
«Work Package»
Power Subsystem«Work Package»
C&DH Subsystem
«Work Package»
Project
«Hardware Product»
Product-1
«Hardware Product»
Product-5«Hardware Product»
Product-3
«Hardware Product»
Product-6«Hardware Product»
Product-2
«Hardware Product»
Product-4
«Hardware Product»
Flight System«supplies»
«supplies»
«supplies»
«supplies»
Fig. 7: A SysML representation for the �supplies� relationships between the work packages and the products.
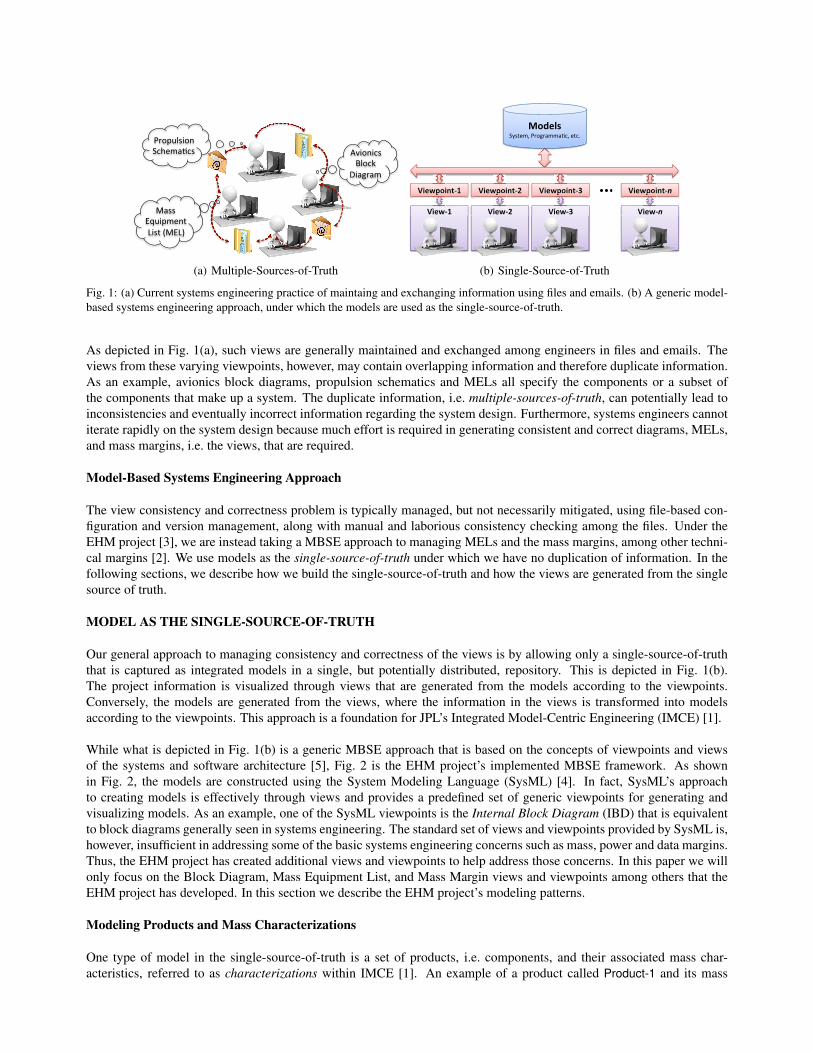
Table 1: The bill of materials table of the Flight System shown in Fig. 3(b) grouped by the WorkBreakdown Structure shown in Fig. 6.
CBE$(kg) $Cont. MEV$(kg) CBE$(kg) $Cont. MEV$(kg)Project 106.4 0.28 136.00000Payload0System 7.4 0.27 9.4
Product;1 2.5 0.25 3.1 2 5.0 0.25 6.3Product;3 1.2 0.30 1.6 2 2.4 0.30 3.1
0000Spacecraft0System 0 99.0 0.28 126.600000000C&DH 0 41.6 0.25 52.0
Product;4 10.4 0.25 13.0 4 41.6 0.25 52.000000000Power 57.4 0.30 74.6
Product;5 25.5 0.30 33.2 2 51.0 0.30 66.3Product;6 3.2 0.30 4.2 2 6.4 0.30 8.3
Mass$per$Unit Total$MassWorkPackages Products
Num$ofUnits
Model Correctness
Because all of the models are integrated and formal, we are able to check for correctness of the model. As an example,wecan check that the following correctness conditions are satisfied:
• Every hardware product has exactly one mass characterization• Every mass characterization has exactly one mass contingency, CBE and MEV• Every product is supplied by exactly one work package• Every work package is authorized by at most one work package.
These are some of the correctness properties that are automatically checked within the EHM modeling workflow.
MEL AND MASS MARGIN ANALYSIS VIEWS
In this section we describe how the models are used to generate views and how models can be updated through views.Because models are specified in SysML, models can be viewed and edited using SysML views. In addition, JPL hascreated a framework called DocGen [6] that is capable of creating customized views from models and is capable ofupdating models through the customized views.
MEL Views and Viewpoints
The MEL is one of our customized views. For the MEL, we have created two views: a bill-of-materials table and adeployment table. The bill-of-materials table view is a traditional MEL view. An example of this view is shown inTable 1. This view organizes the “leaf-level” products, i.e. the products that are not assemblies, by the work packagehierarchy. This view provides the total and per unit mass. It also provides the total mass of the products that are associatedwith each work package. To an experienced engineer, this view provides a sense of correctness of the system design andalso a sense for targets for improvements. Note that in the MEL table views shown in Table 1 and Table 2, the boldednumbers represent the user specified values, while unbolded numbers represent derived or calculated values.
The deployment table view is a not a traditional MEL. However, it provides information that the bill-of-materials tablecannot. An example of a deployment table is shown in Table 2. A deployment table shows the assemblies into whichthe products are deployed. The first column of indented products portrays the product deployment hierarchy. This viewprovides the total and per unit mass of the assemblies. Unlike the bill-of-materials table, this view allows an engineer togain insights into the mass characteristics of the assemblies and their makeup. This view also shows which work packagesupplies each of the products, thus providing a means to check that all products are supplied by some work package. Notethat the WorkPackage column could be displayed in a separate view since it does not address a concern relating to mass.
The DocGen capability provides a means to generate and edit the aforementioned views through viewpoint specificationand view modeling. In DocGen, a viewpoint is modeled in SysML. Then, once a SysML view conforms to the desiredviewpoint and imports the necessary model, the desired view can be automatically generated. As an example, Fig. 8 showsa view model that generates Table 1. Once this view is modeled, the table can be viewed and edited in a Java-based windowand published to a Portable Document Format (PDF) or HyperText Markup Language (HTML). Given a view of interest,DocGen provides this capability first by searching (through the dependency stereotyped �conform�) the viewpoint that

Table 2: The deployment table of the Flight System shown in Fig. 3(b).
CBE$(kg) $Cont. MEV$(kg) CBE$(kg) $Cont. MEV$(kg)Flight'System 106.4 0.28 136.0 Flight'System''''Product;1 2.5 0.25 3.1 2 5 0.25 6.25 Payload'System''''Product;2 47.5 0.28 60.7 2 95 0.28 121.42 C&DH''''''''Product;3 1.2 0.30 1.6 1 1.2 0.30 1.56 Payload'System''''''''Product;4 10.4 0.25 13.0 2 20.8 0.25 26 C&DH''''''''Product;5 25.5 0.30 33.2 1 25.5 0.30 33.15 Power''''Product;6 3.2 0.30 4.2 2 6.4 0.30 8.32 Power
Mass$per$Unit Total$MassNum$ofUnitsProducts WorkPackage
MagicDraw UML, 1-1 Untitled1 MEL: Bill of Materials Oct 4, 2012 9:24:35 AM
MEL: Bill of MaterialsDocGen3View [view] [ ]
«Hardware Product»
Flight System«viewpoint»
Bill Of Materials Table
«view»
MEL: Bill of Materials
«Work Package»
Project«import»
«import»
«conform»
Fig. 8: The view model for the bill of materials table.
the view conforms. DocGen also searches (through the dependency stereotyped �import�) for all of the imported models.Then, DocGen executes the behavior of the viewpoint (specified using SysML Activity) with the imported models as theinputs to the behavior. The result of the behavior execution is a view, such as the bill-of-materials table in Table 1.
Mass Margin Analysis View
Although EHM has yet to implement this view, the same approach used to generate the MEL table views will be used toautomatically generate a Mass Margin Analysis and Report view, simply by implementing the behavior of the associatedviewpoint. For now, we are using the MEL views for the dry mass, and we compute the mass margin separately basedon the dry mass, the expected maximum ∆V , and the launch vehicle’s maximum payload mass capacity. As we plan onimplementing this capability, we need to develop the modeling patterns for ∆V , the propulsion system type, and launchvehicle payload mass capacity characterizations. The Mass Margin viewpoint must implement the rocket equation tocompute the wet mass and the mass margin equation to finally compute the margin. We expect the final view to resembleTable 3.
CONCLUSION
Under the EHM project, a mission concept study, we are taking a MBSE approach to manage the MEL and the massmargin, among other technical margins. We use models as the single-source-of-truth under which we have no duplicateinformation. Because of the model-based nature of the single-source-of-truth, we are able to check for the correctnessof the models. Because the views are generated from a single-source-of-truth, we are able to ensure consistency of theinformation that are duplicated across the views. Based on our experience in this work, we were able to proceed withimplementing other technical resource management-related viewpoints and views, including power equipment list (PEL)viewpoints, power/energy margin analysis and report viewpoints, and data margin analysis and report viewpoints..
Due to the efficiency of this approach, EHM was able to create block diagrams/schematics, MEL and mass marginsfor three different Europa mission concepts in just three months with a high degree of confidence in the consistency,correctness and even completeness. This represent a significant contribution to the state of the practice in development ofNASA mission concept study reports, and to systems engineering of complex space systems in general. The result of thiseffort can be found in the final report describing the EHM studies [3].
ACKNOWLEDGMENTS
This work was carried out at the Jet Propulsion Laboratory, California Institute of Technology, under a contract with theNational Aeronautics and Space Administration. c© 2012 California Institute of Technology. Government sponsorshipacknowledged.

Table 3: The mass margin table from the EuropaMultiple-Flyby Mission study [3, pg. C-109]
EUROPA STUDY 2012 REPORT EUROPA MULTIPLE-FLYBY MISSION
C-109 Copyright 2012. All rights reserved. Government sponsorship acknowledged.
The approach to technical resources in this study has been to model what is well under-stood, and then include conservative margin based on past experience to account for items not known well enough to model. To minimize cost and schedule risk, we have striven to achieve high levels of technical margin wherever possible.
C.2.4.7.1 MEL and Mass Margins
Mass margin follows the defini-tions and conventions specified in the JPL Design Principles, Sec-tion 6.3.2 (JPL 2010a). The earli-est milestone at which the Design Principles specify a mass margin, however, is the Project Mission System Review (PMSR), when at least 30% is required. In consid-eration of the fact that the Europa Multiple-Flyby Mission concept is in a study phase, we have set a more conservative policy of �40% mass margin for this report. This is consistent with the expected evolu-tion of JPL’s institutional guid-ance. The method of calculating the Design Principles margin is shown in Table C.2.4-7.
The dry mass current best estimate (CBE) includes tanks sized to car-ry the maximum propellant load, plus radiation shielding, and the launch vehicle adapter (LVA). Each of these is discussed in more detail below. Use of “Max Propellant”
The Design Principles explicitly require that the propellant load as-sumed for the margin calculation be that amount of propellant need-ed to provide the required 'V for the maximum possible launch mass on that launch vehicle (LV), given 'V requirements for the
chosen trajectory. In addition, the dry mass of the propellant tanks reflects tanks sized for this maximum propellant load. This approach gives an accurate reading of the overall dry mass margin, assuming that the flight system grows
Table C.2.4-7. Europa Multiple-Flyby Mission mass margin.
T. Bayer 24 Apr 2012 LAUNCHFlyby�Model �Ͳ�Final �Report�Update
CBE Cont.* MEV Ion & Neutral Mass Spectrometer 24 50% 36 Ice Penetrating Radar 33 50% 50 ShortWave IR Spectrometer 21 50% 31 Topographical Imager 7 50% 11Payload 85 50% 127 Power 59 21% 72 C&DH 39 30% 51 Telecom 98 29% 126 Structures 529 27% 673 Thermal Control 44 30% 57 Propulsion 175 28% 224 GN&C 68 23% 84 Harness 70 50% 105 Radiation Monitor 8 30% 10 ASRGs (4) 174 45% 252Spacecraft 1264 31% 1655Flight System Total Dry 1349 32% 1782 Max�Prop Bipropellant 860 1277 1711 TVC Monopropellant 75 75 75 ACS Monopropellant 40 40 40 Pressurant 6 6 6 Residual and Holdup 24 35 46Propellant 1005 1432 1877Flight System Total Wet 2354 3214Capability (21-Nov-21 VEEGA) 4494
48%
Total payload shielding 48 42% 68Total spacecraft shielding 170 29% 220LV adapter 89 25% 111
Flyby Mass Margin
Flight System Mass, kg
*Using�ANSI/AIAA�Guide�GͲ020Ͳ1992,�"Estimating�and�Budgeting�Weight�and�Power�Contingencies�for�Spacecraft�Systems",�applied�at�the�component�level.
Atlas V 551:
System MarginsJPL DVVP(Capability - Max Prop - CBE Dry) / (Capability - Max Prop)
REFERENCES
[1] T. J. Bayer, M. B. Bennett, C. L. Delp, D. Dvorak, J. S. Jenkins, and S. Mandutianu. Update - concept of operations forintegrated model-centric engineering at JPL. In Proceedings of Aerospace Conference, 2011 IEEE, Big Sky, Montana,March 5–12 2011.
[2] T. J. Bayer, S. Chung, B. Cole, B. Cook, F. Dekens, C. Delp, I. Gontijo, K. Lewis, M. Moshir, R. Rasmussen, andD. Wagner. Early formulation model-centric engineering on NASA’s Europa mission concept study. In Proceedingsof 22nd Annual International Symposium (IS2012), Roma, Italy, July 9–12 2012.
[3] Europa Study Team. Europa study 2012 report. National Aeronautics and Space Administration, JPL D-71990, May1 2012.
[4] S. Friedenthal, A. Moore, and R. Steiner. A Practical Guide to SysML: The Systems Modeling Language. MorganKaufmann OMG Press, 2009.
[5] ISO/IEC/IEEE. Systems and software engineering — architecture description. ISO/IEC/IEEE 42010:2011, December1 2011.
[6] M. Jackson, C. L. Delp, D. L. Bindschadler, M. A. Sarrel, R. Wollaeger, and D. Lam. Dynamic gate product andartifact generation from system models. In Proceedings of Aerospace Conference, 2011 IEEE, Big Sky, Montana,March 5–12 2011.