mock p2 for 'examplain' hydrochloride - gmpeye by design... · mock p2 for...
TRANSCRIPT
Mock P2 for "Examplain" Hydrochloride - Draft Discussion Paper-
1
2 3 4 5 6 7 8 9
10 11 12 13 14 15 16 17 18 19 20 21 22 23 24 25 26 27 28 29 30 31 32 33 34 35 36 37 38 39 40 41 42 43 44 45 46 47 48 49
Overall Objective The overall objective of this ‘Mock P2’ Draft Discussion Paper is to facilitate a scientific and regulatory dialogue between the Industry Association, EFPIA and Regulatory Authorities on the presentation of enhanced product and process understanding in regulatory dossiers, as suggested by ICH Q8 guideline, Pharmaceutical Development (Step 2) and how this could provide “…opportunities…to develop more flexible regulatory approaches”(ICH Q8). In addition, the document attempts to illustrate how the principles of Quality Risk Management as outlined in ICH Q9, Quality Risk Management (Step 2) are applied during the development process and how these principles could be presented in a P.2. section of the CTD format. The discussion paper serves as a draft of current industry thinking and to promote discussion and learning between companies, and between EFPIA and Regulatory Authority reviewers and inspectors. This document is not intended to be taken as the standard for future applications. Key Aspects This draft discussion paper attempts to illustrate the following key aspects relating to ICH Q8 and Q9 principles • Enhanced Process Understanding/Quality by Design
- To exemplify how modern in- or at-line analytical technologies can assist with process understanding
- To illustrate the type and extent of information that would constitute “…other pharmaceutical development studies that lead to an enhanced knowledge of product performance…” (ICH Q8)
- To illustrate the use of Design of Experiments (DOE) in process development - To exemplify how multivariate models can be generated and used for
prediction • Design Space
- How it is established through scientific understanding, including use of multivariant models
- How it could be represented in regulatory submissions - How it could be linked to process control strategies
• Quality Risk Management
- Approach to risk assessment throughout the development process - Approach to risk management in the design of the control strategy - Presentation of risk management in a regulatory submission
Version 3 24 Jan 06 Page 1 of 69
‘Mock P.2’ – Roadmap 50 51
This document is not a complete P2 Pharmaceutical Development section. Some sections of the manufacturing process design are only briefly described, and some sections not described at all, which may give rise to perception of incoherence of the technical arguments in parts. The focus has been on those section which are key to the scope of the proposed discussion.
52 53 54 55 56 57 58 59 60 61 62 63 64 65 66 67
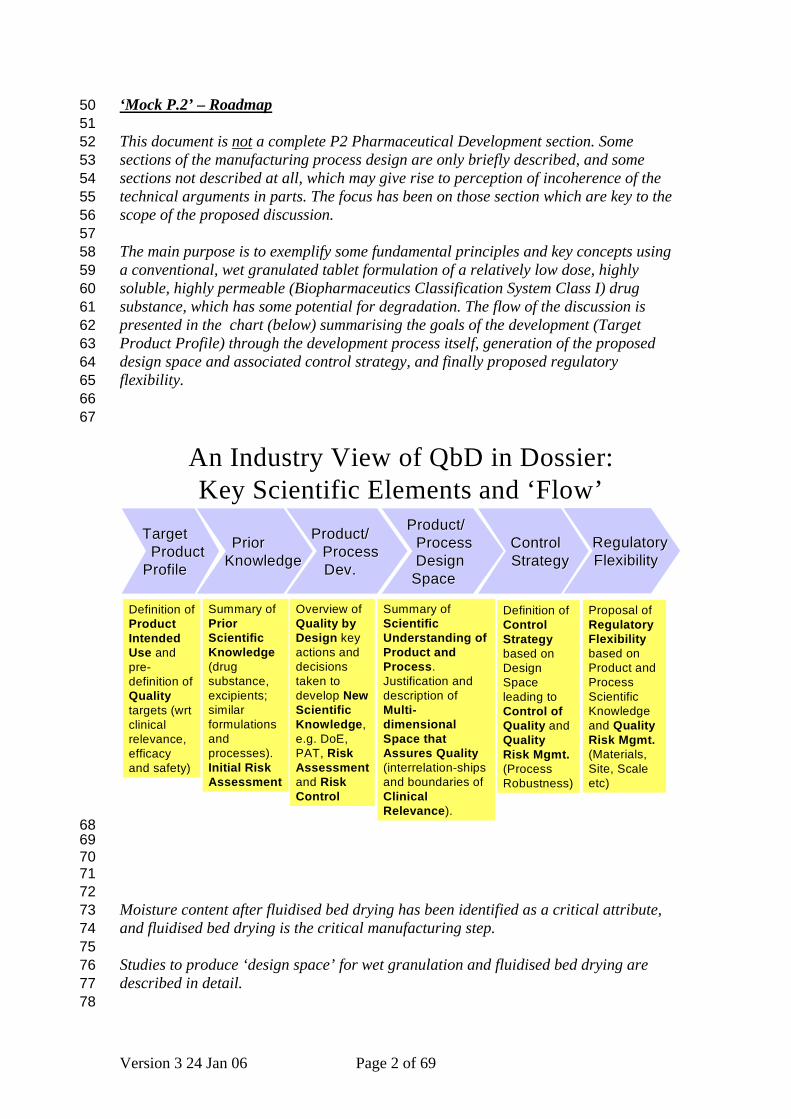
The main purpose is to exemplify some fundamental principles and key concepts using a conventional, wet granulated tablet formulation of a relatively low dose, highly soluble, highly permeable (Biopharmaceutics Classification System Class I) drug substance, which has some potential for degradation. The flow of the discussion is presented in the chart (below) summarising the goals of the development (Target Product Profile) through the development process itself, generation of the proposed design space and associated control strategy, and finally proposed regulatory flexibility.
An Industry View of QbD in Dossier: Key Scientific Elements and ‘Flow’
TargetTargetProductProduct
ProfileProfile
ControlControlStrategyStrategy
PriorPriorKnowledgeKnowledge
Product/Product/ProcessProcessDev.Dev.
Product/Product/ProcessProcessDesignDesign
Space Space
Definition of Product Intended Use and pre-definition of Qualitytargets (wrt clinical relevance, efficacy and safety)
Summary of Scientific Understanding of Product andProcess.Justification and description of Multi-dimensional Space that Assures Quality(interrelation-ships and boundaries of Clinical Relevance).
Definition ofControl Strategybased on Design Space leading to Control of Quality and Quality Risk Mgmt.(Process Robustness)
Overview ofQuality by Design key actions and decisions taken to develop New Scientific Knowledge, e.g. DoE, PAT, Risk Assessmentand Risk Control
Summary ofPrior Scientific Knowledge(drug substance, excipients; similar formulations and processes). Initial Risk Assessment
RegulatoryRegulatoryFlexibilityFlexibility
Proposal of Regulatory Flexibility based on Product and Process Scientific Knowledgeand Quality Risk Mgmt.(Materials, Site, Scale etc)
68 69 70 71 72 73 74 75 76 77 78
Moisture content after fluidised bed drying has been identified as a critical attribute, and fluidised bed drying is the critical manufacturing step. Studies to produce ‘design space’ for wet granulation and fluidised bed drying are described in detail.
Version 3 24 Jan 06 Page 2 of 69
The description of other unit operations and the impact of all unit operations on some quality attributes have not been described.
79 80 81 82 83 84 85 86 87 88 89 90 91 92 93 94 95
Additionally and deliberately not all data and risk management steps are presented. These data and records of risk management process would be available at a site for inspection if so desired. The ‘Mock’ P.2 is complemented by a ‘Mock’ P.3.3 excerpt outlining the process control strategy proposed for routine manufacture. It is designed based on the process understanding and risk assessment data generated during the development process. Section numbering as given in ICH M4Q, The Common Technical Document for the Registration of Pharmaceuticals for Human Use: Quality is followed as far as possible but perhaps not completely accurately. Science and Risk Based Regulatory Approach - Discussion Points 96
97 98 99
100 101 102 103 104 105 106 107 108 109 110 111 112
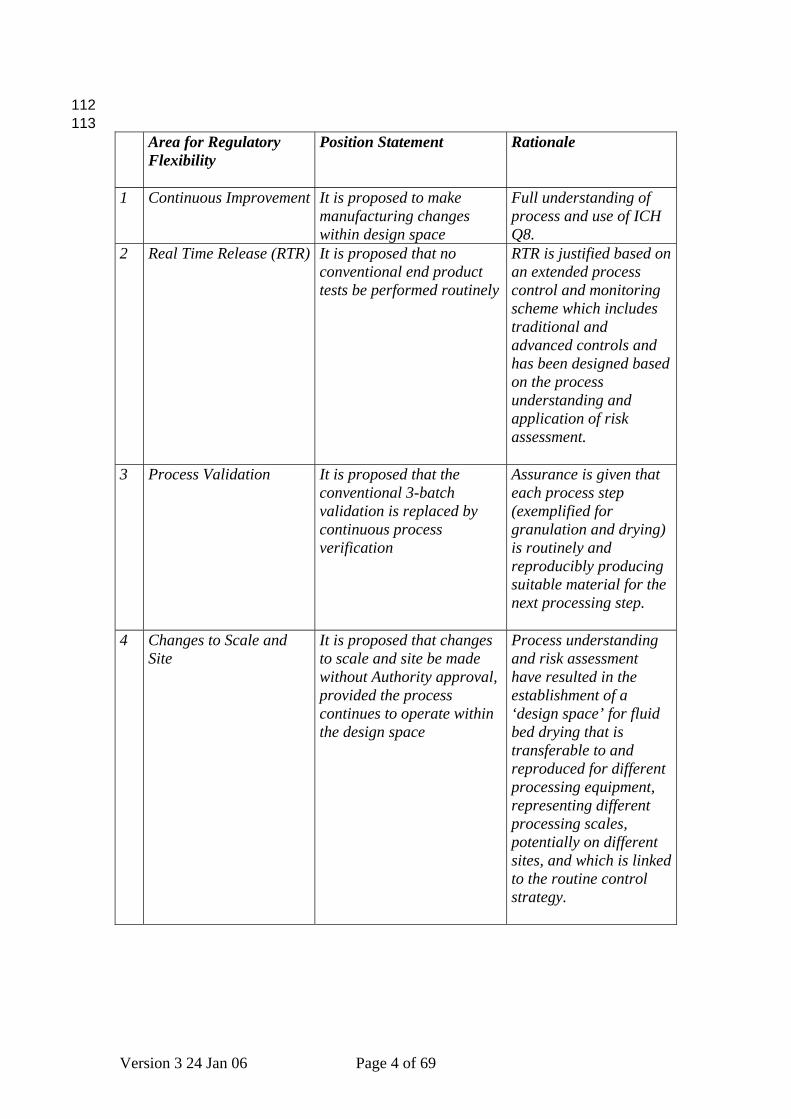
ICH Q8 (step 2) outlines that demonstration of a high level of formulation and process understanding can provide for maximum regulatory flexibility in the areas of:
- risk-based regulatory decisions (reviews and inspections) - manufacturing process improvements within the design space described in the
dossier without further regulatory review - “real time” quality control, leading to a reduction of end-product release
testing
In this context, the EFPIA PAT Topic Group is seeking feedback and discussion on the following proposals for regulatory flexibility based on the design space, knowledge and understanding exemplified for the granulation and fluid bed drying operations in the ‘Examplain’ Mock P.2: and summarized as follows:
Version 3 24 Jan 06 Page 3 of 69
112 113
Area for Regulatory Flexibility
Position Statement Rationale
1 Continuous Improvement It is proposed to make manufacturing changes within design space
Full understanding of process and use of ICH Q8.
2 Real Time Release (RTR) It is proposed that no conventional end product tests be performed routinely
RTR is justified based on an extended process control and monitoring scheme which includes traditional and advanced controls and has been designed based on the process understanding and application of risk assessment.
3 Process Validation It is proposed that the conventional 3-batch validation is replaced by continuous process verification
Assurance is given that each process step (exemplified for granulation and drying) is routinely and reproducibly producing suitable material for the next processing step.
4 Changes to Scale and Site
It is proposed that changes to scale and site be made without Authority approval, provided the process continues to operate within the design space
Process understanding and risk assessment have resulted in the establishment of a ‘design space’ for fluid bed drying that is transferable to and reproduced for different processing equipment, representing different processing scales, potentially on different sites, and which is linked to the routine control strategy.
Version 3 24 Jan 06 Page 4 of 69

5 Confirmatory Stability Studies
It is proposed not to conduct confirmatory stability studies: a) after changes of equipment, scale or site provided the process continues to operate within the design space b) for cGMP maintenance purposes c) after drug substance manufacturing changes, provided the drug substance has been characterized adequately and complies with the established quality criteria Instead, use of product development and process understanding knowledge, linked with risk assessment, will be used to decide what studies to conduct
The proposal is based on in-depth scientific understanding of how rate of production of des-ethyl examplain is related to moisture content of tablets at time of manufacture, underpinned by knowledge of water uptake and degradation rates, control of storage of bulk product prior to packing, design of the packaging, long-term stability data on pilot batches and long term data on the first 3 production batches.
114 115 116 117 118 119 120 121 122 123 124 125 126 127 128 129 130 131
Developed by EFPIA Topic Group (members) Chris Potter AstraZeneca Chairman, contact details: [email protected] Alastair Coupe Pfizer Rafael Beerbohm Boehringer-Ingelheim Fritz Erni Novartis Gerd Fischer Sanofi-Aventis Staffan Folestad AstraZeneca Gordon Muirhead GSK Stephan Rönninger F. Hoffman-La Roche Alistair Swanson Pfizer
Version 3 24 Jan 06 Page 5 of 69

Table of Contents 131
132
133 134 135 136 137 138 139 140 141 142 143 144 145 146 147 148 149 150 151 152 153 154 155 156 157 158 159 160 161 162 163 164 165 166 167 168 169 170 171 172 173 174 175 176 177 178 179 180 181 182 183 184 185 186 187 188
Mock P2 for "Examplain" Hydrochloride - Draft Discussion Paper- .................................................................................................. 1
Overall Objective .................................................................................................................................... 1 Key Aspects ....................................................................................................................................... 1
‘Mock P.2’ – Roadmap ........................................................................................................................... 2 Science and Risk Based Regulatory Approach - Discussion Points...................................................... 3 3.2.P.2 Pharmaceutical Development .................................................................................................... 8
INTRODUCTION................................................................................................................................ 8 3.2.P.2.1 Components of the Drug Product ....................................................................................... 9
3.2.P.2.1.1 Drug Substance........................................................................................................... 9 Salt Selection 9 Solubility 10 Solid State Properties ........................................................................................................... 12 Chemical Stability.................................................................................................................. 12 Excipient Compatibility ............................................................................................................ 13
3.2.P.2.1.2 Excipients .................................................................................................................. 13 Mannitol 13 Microcrystalline cellulose (MCC) ............................................................................................. 14 Povidone 14 Croscarmellose sodium........................................................................................................... 14 Magnesium stearate ................................................................................................................ 14
3.2.P.2.2 Drug Product..................................................................................................................... 14 Initial Quality Risk Management for Examplain ........................................................................... 14 3.2.P.2.2.1 Formulation Development ......................................................................................... 19 3.2.P.2.2.2 Overages ................................................................................................................... 23 3.2.P.2.2.3 Physicochemical and Biological Properties............................................................... 23
Dissolution and Disintegration................................................................................................. 23 3.2.P.2.3 Manufacturing Process Development............................................................................... 25
3.2.P.2.3.1 Unit operations in the manufacture of examplain hydrochloride tablets ................... 26 3.2.P.2.3.1.1 Mixing ......................................................................................................... 26 3.2.P.2.3.1.2 Wet Granulation ......................................................................................... 26
3.2.P.2.3.1.2.1 Development of wet granulation process understanding - impact on manufacturability and dissolution and disintegration.................... 27
3.2.P.2.3.1.2.2 Development of Design Space and Control Strategy for the wet granulation operation .............................................................................. 35
3.2.P.2.3.1.3 Fluid bed drying.......................................................................................... 40 3.2.P.2.3.1.3.1 Summary ................................................................................................. 40 3.2.P.2.3.1.3.2 Quality attributes of the dried granule and impact on
manufacturability and tablet quality – development of process understanding................................................................................................ 42
Filter sock cycle................................................................................................................................ 42 3.2.P.2.3.1.3.3 Quality attributes of the wet granulate (from the previous unit
operation) ...................................................................................................... 44 3.2.P.2.3.1.3.4 Granule water content after drying ............................................................. 44 3.2.P.2.3.1.3.5 Impact of the time course of the drying process......................................... 45 3.2.P.2.3.1.3.6 Development of Design Space and Control Strategy for the
drying operation............................................................................................. 47 3.2.P.2.3.1.3.7 Impact of process understanding for the fluid bed drying
operation on the quality control of examplain hydrochloride tablets. ........................................................................................................... 50
3.2.P.2.3.1.4 Granulation / lubrication ............................................................................. 51 3.2.P.2.3.1.5 Compression .............................................................................................. 51
3.2.P.2.3.2 Conclusion.................................................................................................. 53 3.2.P.2.4 Container Closure System................................................................................................ 53
Protection 54 Compatibility 54 Safety 54
Version 3 24 Jan 06 Page 6 of 69
Performance 54 189 190 191 192 193 194 195 196 197 198 199 200 201 202 203 204 205 206 207 208 209 210 211 212 213 214 215 216 217 218 219 220
Design space for packaging materials .................................................................................... 54 3.2.P.2.5 Microbiological Attributes.................................................................................................. 54 3.2.P.2.6 Compatibility ..................................................................................................................... 55
3.3 Control Strategy as result of the quality risk management............................................................. 56 Critical to Quality Attributes (CQA) .............................................................................................. 56 Quality Risk Management............................................................................................................ 56 Proposed Controls ....................................................................................................................... 57 Dispensing ................................................................................................................................... 57 Granulation .................................................................................................................................. 58 Drying........................................................................................................................................... 59 Blending ....................................................................................................................................... 60 Tableting ...................................................................................................................................... 60
3.3.1 Impact of the control strategy to end product quality specification ......................................... 62 Dissolution – Disintegration ......................................................................................................... 62 Hardness...................................................................................................................................... 62 Assay and Unit Dose Uniformity .................................................................................................. 62 Degradation ................................................................................................................................. 62 Stability......................................................................................................................................... 63
3.3.2 Conclusions: Proposal for real time release ........................................................................... 63 3.3.3 Monitoring program ................................................................................................................. 64
Continuous Improvement............................................................................................................. 65 Scale ............................................................................................................................................ 65
Site ................................................................................................................................................... 65 Process Validation ....................................................................................................................... 65 Real Time Release ...................................................................................................................... 66 Reduction in Confirmatory Stability Studies................................................................................. 66 Drug Substance Manufacturing Changes (only limited data given in this mock document) .................................................................................................................................... 66
APPENDIX............................................................................................................................................ 68
Version 3 24 Jan 06 Page 7 of 69
3.2.P.2 Pharmaceutical Development 221 222 223 224 225 226 227 228 229 230 231 232 233 234 235 236 237 238 239 240 241 242 243 244 245 246 247 248 249 250 251 252 253 254 255 256 257 258 259 260 261 262 263 264 265 266 267
INTRODUCTION Examplain hydrochloride is being developed for the treatment of acute anxiety following regulatory submissions. The proposed commercial formulation for examplain hydrochloride is an uncoated immediate release tablet. A single strength (20 mg as free base) is proposed for commercialisation. Tablet formulations, of strengths 1, 10 and 20 mg, were initially developed for clinical trials. The low bulk density of the drug substance precluded a directly compressible formulation and consequently a non-complex, high shear wet granulation process followed by compression has been developed. Film coating is not required to improve subjective properties of the tablet, or to provide any additional protection of the product. Extensive development and process qualification studies have been carried out to evaluate the significance of changing process parameters on the quality and performance of the tablet formulation. These are described in detail in 3.2.P.2.2.1 Formulation Development and 3.2.P.2.3 Manufacturing Process Development. The development of the examplain hydrochloride, 20 mg tablet and the associated manufacturing process used prior knowledge from previous products and process development projects. This comprised prior knowledge on the variability with respect to physicochemical and functional properties in all excipients used in the formulation design. In addition, complementary mechanistic understanding of the manufacturing process was obtained through application of PAT (process analytical technology) during process development. A risk analysis (Failure Mode and Effect Analysis, FMEA), in accordance with ICH Q9, was used to establish those process parameters that are likely to have the greatest impact on product quality. Appropriate multivariate experimental plans were designed based on the prior knowledge and the risk analysis. Processing experience has been gained by manufacturing three batches, at a scale of 25 kg (10% proposed commercial scale), in Tabs’R’Us commercial production site in Pilltown. All batches met the predetermined acceptance criteria. Data from stability studies performed in accordance with ICH guidelines show good stability of the product at intermediate and long-term storage conditions. The proposed commercial packaging for examplain hydrochloride tablets is clear Aclar UltRx 2000 unit dose blisters. Further information on the packaging is provided in 3.2.P.2.4 Container Closure System. A target product profile for an examplain hydrochloride tablet, 20 mg is given in (Table 1)
Version 3 24 Jan 06 Page 8 of 69

Table 1. Target product profile for examplain hydrochloride tablets 267 268
Description Round normal convex uncoated tablet
Identification Positive for examplain hydrochloride
Assay 20 mg ± 5% examplain free base at time of manufacture
Degradation products Less than 2% des-ethyl examplain at end of shelf life
Dissolution Immediate release
Uniformity of dosage units Meets pharmacopoeial acceptance criteria
Microbiological limits Meets pharmacopoeial acceptance criteria
269 270 271 272 273 274 275 276 277 278 279 280 281 282 283 284 285 286 287 288 289 290 291 292 293 294 295 296 297 298 299 300 301 302 303 304 305 306 307 308
This target product profile summarises the quality attributes of the product required to meet the needs for safety and efficacy of the patient. Safety is assured primarily by ensuring that the degradation product, des-ethyl examplain, is less than 2% at the end of shelf life. This limit has been qualified in toxicological studies (reference to Safety section of application) up to a level of 10%. Additionally, application of limits for assay and uniformity of dosage units assure excess drug substance is not administered. The pharmacopoeial ranges for acceptable uniformity of content are much less than that seen for variability of plasma levels seen in patients in Phase 2 and Phase 3 clinical studies, (see Clinical section of this application). Safety is not compromised by administration of a tablet at the highest content allowed by the pharmacopoeial limit since higher doses were administered without safety findings in earlier Phase 1 and Phase 2 clinical studies. Meeting globally-agreed limits for any microbiological contamination, and application of appropriate GMP standards during manufacture assure microbiological quality of this orally administered drug. Efficacy is assured for this BCS Class I drug substance by application of a dissolution test during development. There is extensive biopharmaceutical literature, which led to the FDA Guidance for Industry-‘Biowaver Guidance’, CDER 2000, and this work concludes that in vivo availability in patients can be assured by studying in vitro release over the physiological pH range and typically looking for equal to or greater than 85% of drug substance released in 30 minutes. Similar to the safety justification, efficacy is assured by application of a lower limit for uniformity of dosage units. 3.2.P.2.1 Components of the Drug Product 3.2.P.2.1.1 Drug Substance <This section outlines properties of the drug substance with the potential to influence the manufacture or performance of the drug product.> Salt Selection Examplain free base and a range of salts with pharmaceutically acceptable counterions (including acetate, bromide, chloride and tartrate) were studied to determine the optimum form for development. The hydrochloride salt was selected as it is anhydrous and crystalline with a high melting point and low hygroscopicity. It is also highly water soluble, crystallised with high chemical purity and demonstrated good stability in the solid state.
Version 3 24 Jan 06 Page 9 of 69
Solubility 309 310 311 312 313 314 315 316 317 318 319 320 321
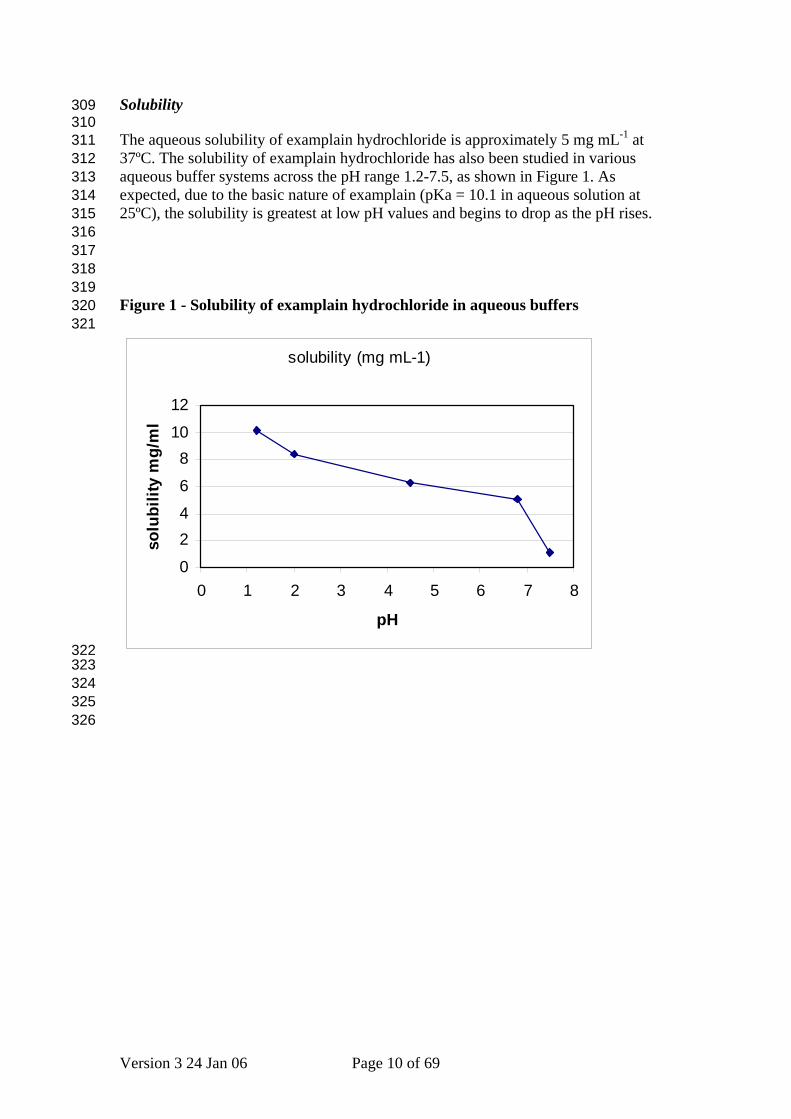
The aqueous solubility of examplain hydrochloride is approximately 5 mg mL-1 at 37ºC. The solubility of examplain hydrochloride has also been studied in various aqueous buffer systems across the pH range 1.2-7.5, as shown in Figure 1. As expected, due to the basic nature of examplain (pKa = 10.1 in aqueous solution at 25ºC), the solubility is greatest at low pH values and begins to drop as the pH rises. Figure 1 - Solubility of examplain hydrochloride in aqueous buffers
solubility (mg mL-1)
0
24
6
810
12
0 1 2 3 4 5 6 7 8
pH
solu
bilit
y m
g/m
l
322 323 324 325 326
Version 3 24 Jan 06 Page 10 of 69
326 327 328 329 330 331 332 333 334 335
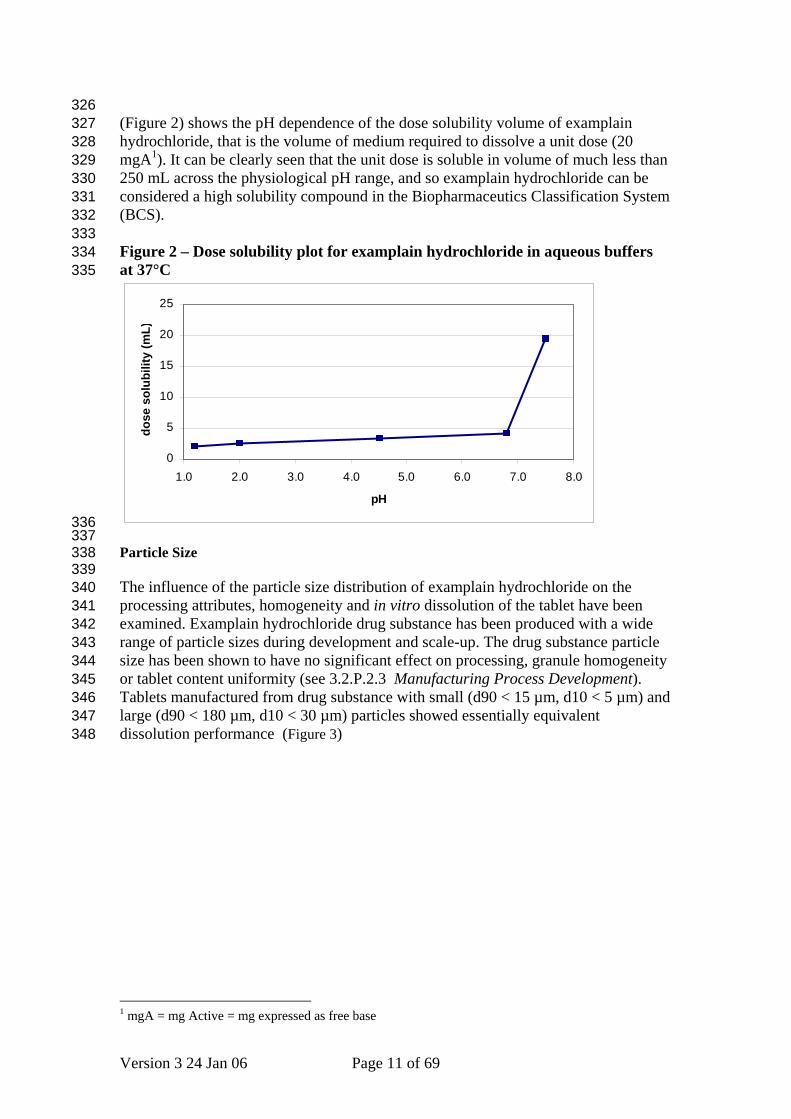
(Figure 2) shows the pH dependence of the dose solubility volume of examplain hydrochloride, that is the volume of medium required to dissolve a unit dose (20 mgA1). It can be clearly seen that the unit dose is soluble in volume of much less than 250 mL across the physiological pH range, and so examplain hydrochloride can be considered a high solubility compound in the Biopharmaceutics Classification System (BCS). Figure 2 – Dose solubility plot for examplain hydrochloride in aqueous buffers at 37°C
0
5
10
15
20
25
1.0 2.0 3.0 4.0 5.0 6.0 7.0 8.0
pH
dose
sol
ubili
ty (m
L)
336 337 338 339 340 341 342 343 344 345 346 347 348
Particle Size The influence of the particle size distribution of examplain hydrochloride on the processing attributes, homogeneity and in vitro dissolution of the tablet have been examined. Examplain hydrochloride drug substance has been produced with a wide range of particle sizes during development and scale-up. The drug substance particle size has been shown to have no significant effect on processing, granule homogeneity or tablet content uniformity (see 3.2.P.2.3 Manufacturing Process Development). Tablets manufactured from drug substance with small (d90 < 15 µm, d10 < 5 µm) and large (d90 < 180 µm, d10 < 30 µm) particles showed essentially equivalent dissolution performance (Figure 3)
1 mgA = mg Active = mg expressed as free base
Version 3 24 Jan 06 Page 11 of 69

349 350 351 352 353 354
Figure 3 - Dissolution profiles for examplain hydrochloride tablets made from drug substance with different particle size distributions (pH 6.8, 50 rpm, paddles) [DS = Drug substance]
0
20
40
60
80
100
120
0 10 20 30 40 50
time (min)
% d
isso
lved
"small" DS "large" DS
355 356 357 358 359 360 361 362 363 364 365 366 367 368 369 370 371 372 373 374 375 376 377 378
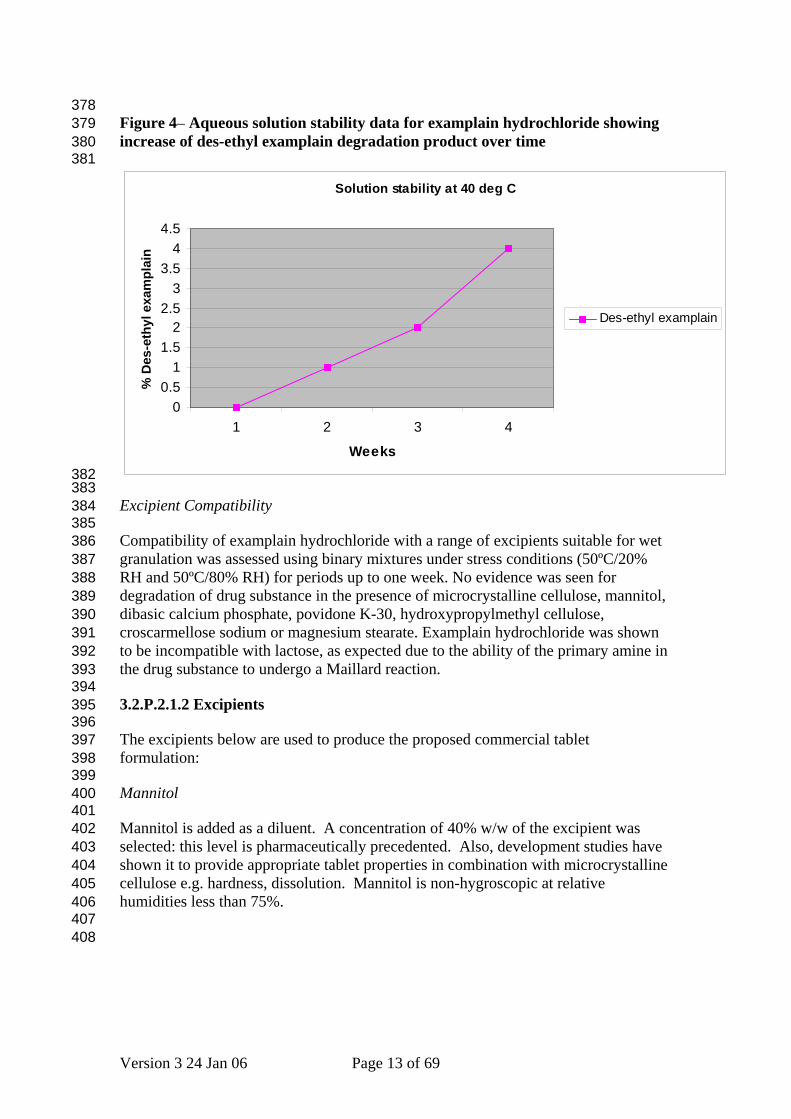
Solid State Properties After extensive screening of a wide variety of solvents and conditions, only a single anhydrous solid form of examplain hydrochloride has been identified. The material is a highly crystalline, non-hygroscopic, high melting solid. Characterisation of this material is described in 3.2.S.1.3 General Properties. No evidence has been found for any hydrates or solvates of examplain hydrochloride. Due to the needle-like morphology of the examplain hydrochloride crystals, the bulk density of the solid is low (<0.2 g cm-3). A wet granulation process was selected to densify and promote powder flow. Examplain hydrochloride has only one polymorphic form. Chemical Stability As described in section 3.2.S.7 Stability, examplain hydrochloride drug substance exhibits good chemical stability in the solid state when protected from extremes of temperature and humidity. Under stressed conditions in aqueous solution, examplain hydrochloride undergoes hydrolytic cleavage of the ethyl ester moiety to des-ethyl examplain (Figure 4). This is also the major metabolite of examplain hydrochloride in man, and has been qualified in toxicology studies up to a level of 10%.
Version 3 24 Jan 06 Page 12 of 69
378 379 380 381
Figure 4– Aqueous solution stability data for examplain hydrochloride showing increase of des-ethyl examplain degradation product over time
Solution stability at 40 deg C
00.5
11.5
22.5
33.5
44.5
1 2 3 4
Weeks
% D
es-e
thyl
exa
mpl
ain
Des-ethyl examplain
382 383 384 385 386 387 388 389 390 391 392 393 394 395 396 397 398 399 400 401 402 403 404 405 406 407 408
Excipient Compatibility Compatibility of examplain hydrochloride with a range of excipients suitable for wet granulation was assessed using binary mixtures under stress conditions (50ºC/20% RH and 50ºC/80% RH) for periods up to one week. No evidence was seen for degradation of drug substance in the presence of microcrystalline cellulose, mannitol, dibasic calcium phosphate, povidone K-30, hydroxypropylmethyl cellulose, croscarmellose sodium or magnesium stearate. Examplain hydrochloride was shown to be incompatible with lactose, as expected due to the ability of the primary amine in the drug substance to undergo a Maillard reaction. 3.2.P.2.1.2 Excipients The excipients below are used to produce the proposed commercial tablet formulation: Mannitol Mannitol is added as a diluent. A concentration of 40% w/w of the excipient was selected: this level is pharmaceutically precedented. Also, development studies have shown it to provide appropriate tablet properties in combination with microcrystalline cellulose e.g. hardness, dissolution. Mannitol is non-hygroscopic at relative humidities less than 75%.
Version 3 24 Jan 06 Page 13 of 69
Microcrystalline cellulose (MCC) 408 409 410 411 412 413 414 415 416 417 418 419 420 421 422 423 424 425 426 427 428 429 430 431 432 433 434 435 436 437 438 439 440 441 442 443
MCC is added as a diluent. A concentration of 39% w/w of the excipient was selected: this level is precedented and also development studies have shown it to provide appropriate tablet properties in combination with mannitol e.g. hardness, dissolution. Povidone Povidone K-30 is added as a binder at a pharmaceutically precedented level of 5% w/w. It is added as a 25% w/w aqueous solution during granulation. Previous experience has demonstrated the suitability in essentially similar formulations. Croscarmellose sodium The croscarmellose sodium is added as a disintegrant at a pharmaceutically precedented level. A total concentration of 3% w/w is used to impart rapid disintegration. Half of the disintegrant is added intra-granularly and half added extra-granularly. Magnesium stearate The magnesium stearate is used as a tablet lubricant at a level of 2% w/w. This level is higher than typical but is necessary for lubrication of this mannitol-based formulation. 3.2.P.2.2 Drug Product Initial Quality Risk Management for Examplain
Based on the target product profile (Table 1), initial evaluation of
• physical and chemical properties of the drug substance and other components • scientific knowledge • prior knowledge from previous products and process development projects,
the following manufacturing process (Figure 5) was suggested.
Version 3 24 Jan 06 Page 14 of 69
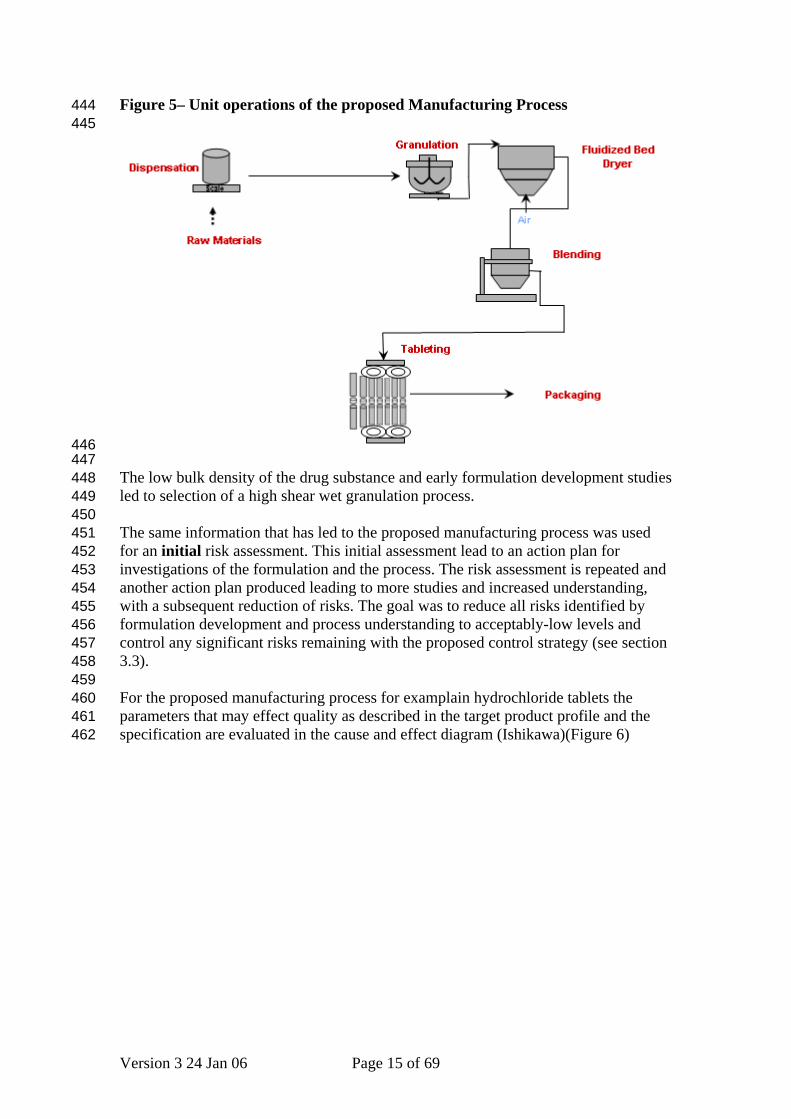
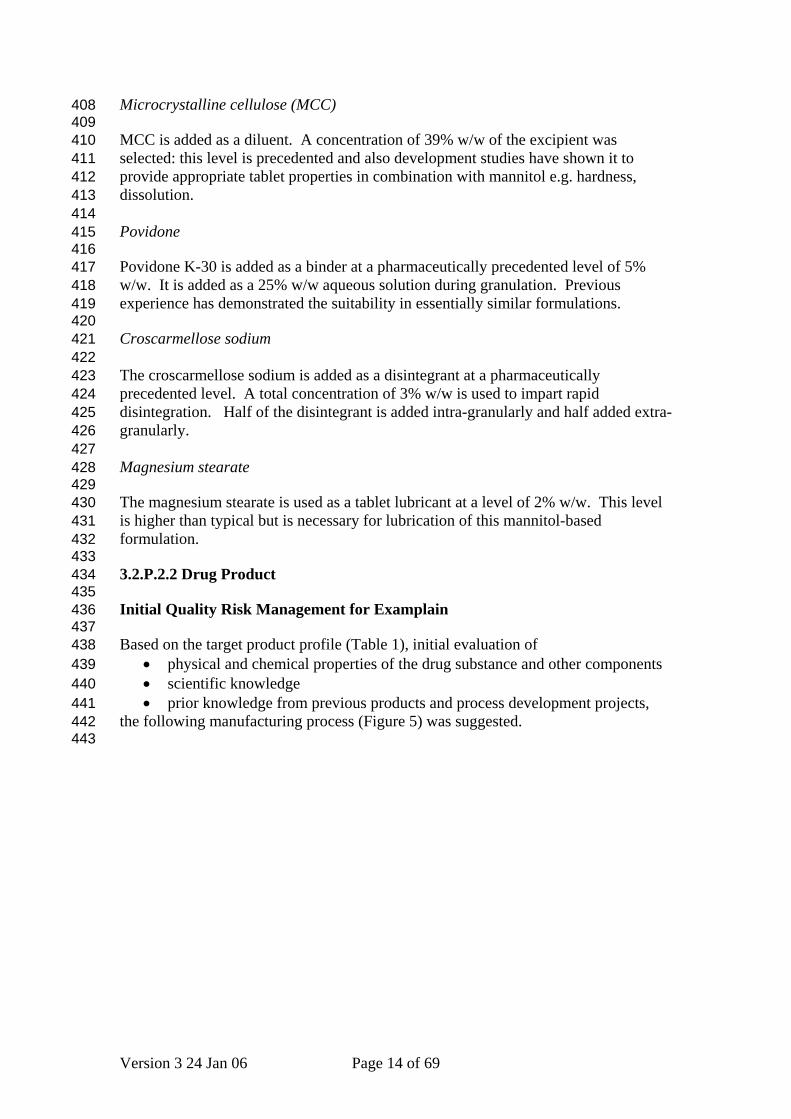
Figure 5– Unit operations of the proposed Manufacturing Process 444 445
446 447 448 449 450 451 452 453 454 455 456 457 458 459 460 461 462
The low bulk density of the drug substance and early formulation development studies led to selection of a high shear wet granulation process. The same information that has led to the proposed manufacturing process was used for an initial risk assessment. This initial assessment lead to an action plan for investigations of the formulation and the process. The risk assessment is repeated and another action plan produced leading to more studies and increased understanding, with a subsequent reduction of risks. The goal was to reduce all risks identified by formulation development and process understanding to acceptably-low levels and control any significant risks remaining with the proposed control strategy (see section 3.3). For the proposed manufacturing process for examplain hydrochloride tablets the parameters that may effect quality as described in the target product profile and the specification are evaluated in the cause and effect diagram (Ishikawa)(Figure 6)
Version 3 24 Jan 06 Page 15 of 69
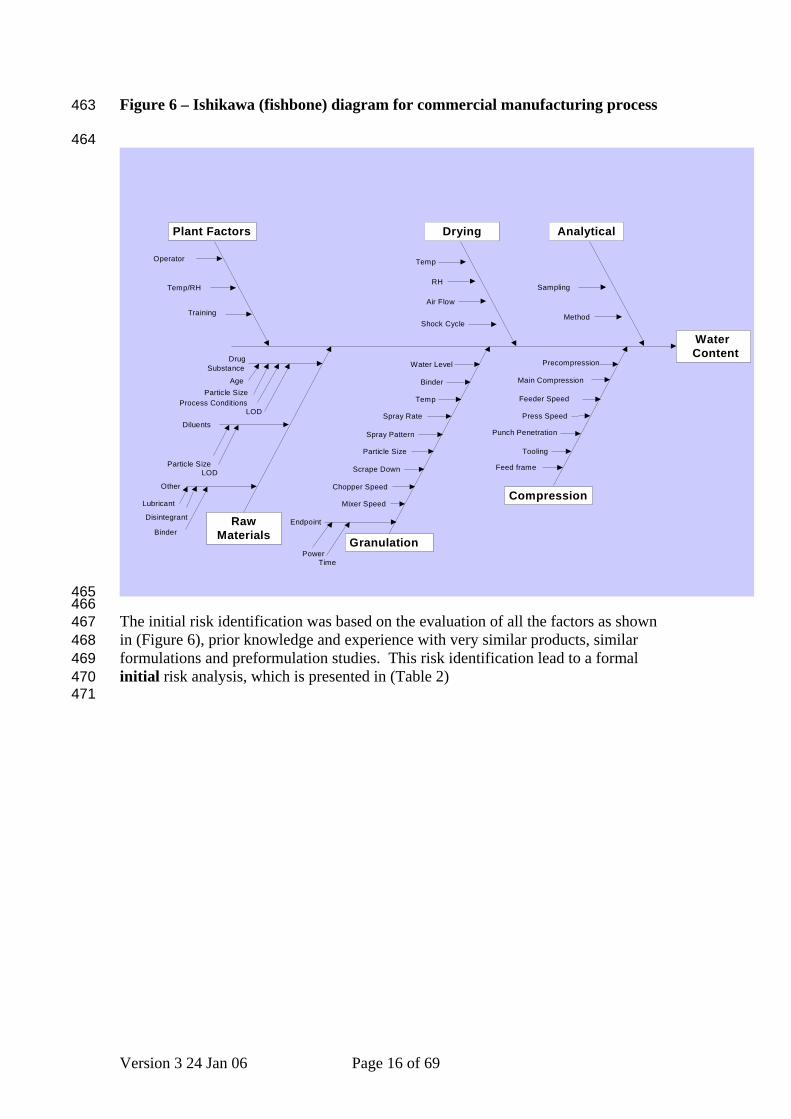
Figure 6 – Ishikawa (fishbone) diagram for commercial manufacturing process 463
464
WaterContent
Drying
Temp
RH
Air Flow
Shock Cycle
RawMaterials
DrugSubstance
Particle SizeProcess Conditions
LOD
Diluents
Particle SizeLOD
Other
Lubricant
Disintegrant
Binder
Age
Analytical
Method
Sampling
Compression
Precompression
Main Compression
Feeder Speed
Press Speed
Punch Penetration
Tooling
Feed frame
Operator
Temp/RH
Training
Plant Factors
Power
Water Level
Binder
Temp
Spray Rate
Spray Pattern
Particle Size
Scrape Down
Chopper Speed
Mixer Speed
Endpoint
Time
Granulation
465 466 467 468 469 470 471
The initial risk identification was based on the evaluation of all the factors as shown in (Figure 6), prior knowledge and experience with very similar products, similar formulations and preformulation studies. This risk identification lead to a formal initial risk analysis, which is presented in (Table 2)
Version 3 24 Jan 06 Page 16 of 69

471 472 473 474
Table 2. Initial classification of importance of unit operation to have an impact on quality
Unit operations Quality attributes
Dispensing (Raw
Material Properties) Granulation Drying
Blending (Magnesium
Stearate) Tableting
Packaging
Dissolution
Prior knowledge
Prior knowledge
Disintegration
Prior knowledge
Prior knowledge
Hardness Prior knowledge Prior knowledge
Prior knowledge
Prior knowledge
Assay Prior knowledge
Prior knowledge Prior knowledge
Prior knowledge
Prior knowledge
Content uniformity Prior knowledge
Prior knowledge
Degradation Prior knowledge
Prior knowledge
Prior knowledge Prior knowledge
Stability Prior knowledge
Prior knowledge
Prior knowledge
Prior knowledge Prior knowledge
Appearance Prior knowledge
Prior knowledge
Prior knowledge
Prior knowledge
Identification Prior knowledge Prior
knowledge Prior knowledge
Prior knowledge Prior knowledge
Water Prior knowledge
Prior knowledge
Prior knowledge
Prior knowledge Prior knowledge
Microbiology Prior
knowledge Prior knowledge
Prior knowledge Prior knowledge
Influence: high low
475 476 477 478 479 480 481 482 483 484 485 486 487 488 489 490 491 492 493 494 495 496 497 498
Time elements related to storage and transportation are included as a part of the unit operation. All unit operations in (Table 2)are assessed for their importance in terms of impact on quality attributes of the finished product (essentially the target product profile).Those with a possibility of having an impact on quality are coloured dark blue.Those with low possibility of having an impact on quality based on the prior knowledge are coded in light blue. The goal of the development summarised in the following sections is to reduce the number of dark blue sections and control the remaining risk to an acceptable level (see Control Strategy 3.3). As a conclusion from this initial risk evaluation the following interactions and parameters require experimental investigation to define the criticality of them: - raw material variability for dissolution/disintegration and microbiology - impact of granulation on dissolution/disintegration, homogeneity and degradation - drying on content uniformity, degradation, stability, appearance, water content
and microbiology - blending on content uniformity, dissolution/disintegration and hardness - tableting on dissolution/disintegration, content uniformity, hardness, assay, and
appearance
Version 3 24 Jan 06 Page 17 of 69

499 500 501 502 503 504 505
Normally all these attributes and parameters would be discussed intensively in the Formulation development (see 3.2.P.2.2.1) and the Manufacturing Process Development (see 3.2.P.2.3) sections, however, for the purpose of this mock submission the unit operations of granulation and fluid bed drying are discussed in detail as they exemplify concepts for discussion.
Version 3 24 Jan 06 Page 18 of 69

505 506 507 508 509 510 511 512 513 514 515 516 517 518 519 520 521 522 523 524 525 526 527
3.2.P.2.2.1 Formulation Development The development of the proposed commercial formulation is described in this section. The qualitative and quantitative compositions of the proposed commercial formulation and the formulations used in clinical development are presented in Attachment A. In early clinical trials, tablet formulations of 1, 10 and 20mg were used but only one strength, 20mg, is proposed for commercialisation. Examplain hydrochloride is a primary amine and undergoes a Maillard reaction with lactose. Consequently, mannitol was chosen as the diluent at pharmaceutically precedented levels. The low bulk density of the drug substance precluded a directly compressible formulation and a high shear wet granulation process was developed using povidone K30 as the binder. Mannitol is well precedented as a diluent for wet granulation formulations. Microcrystalline cellulose was chosen as the other diluent as it exhibits appropriate compression properties in combination with mannitol (see Figure 7). Figure 7– Compression profiles for examplain hydrochloride tablets made at different tableting speeds
Compression Force (kN) vs Crushing Strength (kP)Effect of Tablet Production Rate
0.00
2.00
4.00
6.00
8.00
10.00
12.00
14.00
16.00
0 5 10 15 20 25 30 35
Compression Force (kN)
Cru
shin
g St
reng
th (k
P)
20mg Examplain Hydrochloride @100K TPH
20mg Examplain Hydrochloride @200K TPH
528 529 530 531 532 533 534 535 536 537
(TPH = tablets per hour) Magnesium stearate is included as the lubricant as precedented for mannitol based formulations (Handbook of Pharmaceutical Excipients p376 4th Edition (2003), Pharmaceutical Press, edited by R C Rowe, P J Sheskey and P J Weller). In the range of 1% to 3% no significant effects on compression or dissolution at this level have been demonstrated (see Figure 8and Figure 9). Hardness above or equal 4 kp produces acceptable tablets.
Version 3 24 Jan 06 Page 19 of 69

Figure 8 – Compression profiles for examplain hydrochloride tablets made with different lubricant levels
538 539 540
Compression Force (kN) vs Crushing Strength (kP)Effect of Lubricant Level
0.00
2.00
4.00
6.00
8.00
10.00
12.00
14.00
16.00
0 5 10 15 20 25 30 35
Compression Force (kN)
Cru
shin
g St
reng
th (K
p)
20mg Examplain Hydrochloride @1% MgSt20mg Examplain Hydrochloride @2% MgSt20mg Examplain Hydrochloride @3% MgSt
541 542 543 544 545 546
Figure 9 – Dissolution profiles for examplain hydrochloride tablets made with different lubricant levels
Dissolution profiles of examplain hydrochloride tablets - effect of lubrication level pH 6.8
0
20
40
60
80
100
120
0 5 10 15 20 25 30 45
Time (minutes)
Mea
n %
dis
solu
tion
1% Mg St2% Mg St3% Mg St
547 548 549 550
The effects of varying excipient quantities on disintegration and dissolution for this finalised formulation were assessed by development studies, that product quality and
Version 3 24 Jan 06 Page 20 of 69
performance is unaffected by small changes. Tablets from these studies also gave acceptable assay values and uniformity of content, and good appearance.
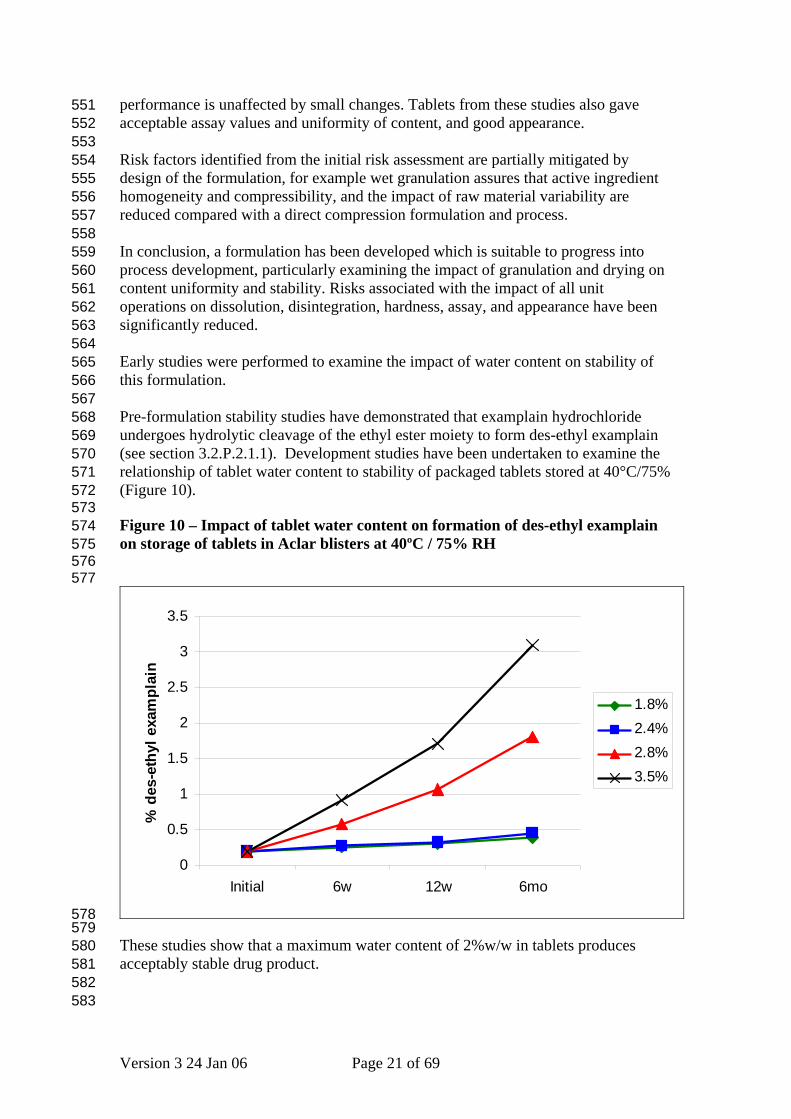
551 552 553 554 555 556 557 558 559 560 561 562 563 564 565 566 567 568 569 570 571 572 573 574 575 576 577
Risk factors identified from the initial risk assessment are partially mitigated by design of the formulation, for example wet granulation assures that active ingredient homogeneity and compressibility, and the impact of raw material variability are reduced compared with a direct compression formulation and process. In conclusion, a formulation has been developed which is suitable to progress into process development, particularly examining the impact of granulation and drying on content uniformity and stability. Risks associated with the impact of all unit operations on dissolution, disintegration, hardness, assay, and appearance have been significantly reduced. Early studies were performed to examine the impact of water content on stability of this formulation. Pre-formulation stability studies have demonstrated that examplain hydrochloride undergoes hydrolytic cleavage of the ethyl ester moiety to form des-ethyl examplain (see section 3.2.P.2.1.1). Development studies have been undertaken to examine the relationship of tablet water content to stability of packaged tablets stored at 40°C/75% (Figure 10). Figure 10 – Impact of tablet water content on formation of des-ethyl examplain on storage of tablets in Aclar blisters at 40ºC / 75% RH
0
0.5
1
1.5
2
2.5
3
3.5
Initial 6w 12w 6mo
% d
es-e
thyl
exa
mpl
ain
1.8%2.4%2.8%3.5%
578 579 580 581 582 583
These studies show that a maximum water content of 2%w/w in tablets produces acceptably stable drug product.
Version 3 24 Jan 06 Page 21 of 69
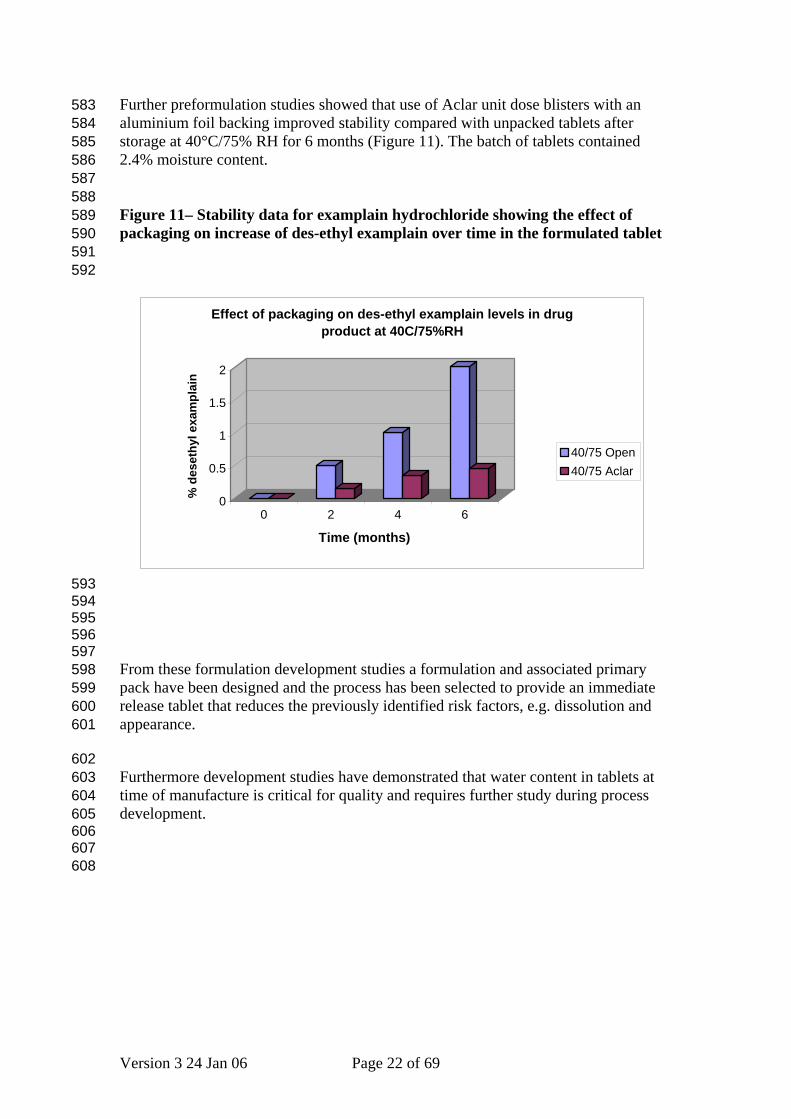
Further preformulation studies showed that use of Aclar unit dose blisters with an aluminium foil backing improved stability compared with unpacked tablets after storage at 40°C/75% RH for 6 months (Figure 11). The batch of tablets contained 2.4% moisture content.
583 584 585 586 587 588 589 590 591 592
593 594 595 596 597 598 599 600 601
602 603 604 605 606 607 608
Figure 11– Stability data for examplain hydrochloride showing the effect of packaging on increase of des-ethyl examplain over time in the formulated tablet
0
0.5
1
1.5
2
% d
eset
hyl e
xam
plai
n
0 2 4 6
Time (months)
Effect of packaging on des-ethyl examplain levels in drug product at 40C/75%RH
40/75 Open40/75 Aclar
From these formulation development studies a formulation and associated primary pack have been designed and the process has been selected to provide an immediate release tablet that reduces the previously identified risk factors, e.g. dissolution and appearance.
Furthermore development studies have demonstrated that water content in tablets at time of manufacture is critical for quality and requires further study during process development.
Version 3 24 Jan 06 Page 22 of 69

608 609 610 611 612 613 614 615 616 617 618 619 620 621 622 623 624 625 626 627 628 629 630 631 632 633 634 635 636 637 638 639 640 641 642 643 644 645 646 647 648 649 650 651
3.2.P.2.2.2 Overages There are no overages used in the manufacturing of examplain hydrochloride tablets. 3.2.P.2.2.3 Physicochemical and Biological Properties Summary of pharmacokinetic studies:
- single dose PK study - multiple dose PK study - fed-fasted PK study - 1, 10 and 20mg PK study
Examplain hydrochloride is a non-hygroscopic white to off-white powder, and has a molecular weight of 536.5 (the free base has a molecular weight of 500). Examplain, the free base, has a pKa of 10.1 in aqueous solution at 25ºC. Examplain hydrochloride demonstrates solubility in excess of 1.0 mg mL-1 across the pH range 1.2-7.5 (see section 3.2.P.2.1.1.). It has a high trans-membrane absorptive permeability value of 30cm/s x 10-6 per hour (stirred) in a Caco-2 model of human intestinal absorption and is rapidly absorbed following oral administration (Tmax is 2 hours), with oral bioavailability estimated to be 95% in man. Given the solubility, in vitro permeability and pharmacokinetic information examplain can be considered as a BCS Class 1 high solubility, high permeability compound. The absolute bioavailability of examplain hydrochloride drug product, 20 mg tablet formulation was obtained from a comparison with an intravenous formulation. In addition, a blood level study in man has shown that bioavailability achieved with the 20 mg clinical trial formulation is at least as good as that given by an oral solution. This study also demonstrated that food has no effect on bioavailability. Dissolution and Disintegration Absorption and bioavailability of examplain hydrochloride 20 mg tablet is not affected by drug dissolution as verified by the similar bioavailability for the tablet as with the oral solution. Therefore maintaining the rapid dissolution characteristics of the tablet during formulation and process development should guarantee consistent bioavailability. A dissolution test was therefore developed as an indicator of the performance of examplain hydrochloride drug product tablets and used during the formulation and process development programme. The dissolution characteristics of the examplain hydrochloride 20 mg tablet in three different dissolution media are shown in (Figure 12).
Version 3 24 Jan 06 Page 23 of 69

Figure 12– Dissolution for Examplain hydrochloride 20 mg tablet at different pH values
652 653
0
20
40
60
80
100
120
0 10 20 30 40 50
time (min)
% d
isso
lved 0.1 M HCl
pH 4.5pH 6.8
654 655 656 657 658 659 660 661 662 663 664 665 666 667 668 669 670 671 672 673 674 675 676 677 678 679 680 681
The detailed discussion to justify omission of the dissolution test from the finished product specification is given section P5.4. The compendial test was used for disintegration time in water (37oC). The disintegration test was used throughout the development programme to monitor the performance of the examplain hydrochloride tablet manufacturing process. Details of the respective unit operations with impact on disintegration are described in 3.2.P.2.3. The details of the strategy to control disintegration and hence dissolution is described in 3.2.P.3. Conclusions from formulation development studies are:
-a suitable formulation and primary package have been developed for further process development work. -a suitable dissolution test has been developed, which is an excellent surrogate for in vivo absorption. -risks associated with in vitro dissolution have been reduced to the level where consideration can be given to using disintegration as a surrogate for dissolution -water content in tablets is a critical to quality attribute and requires further study during process development -insufficient data have been generated for content uniformity, however, the formulation and process appear satisfactory to warrant extensive process development studies.
Version 3 24 Jan 06 Page 24 of 69

682 683 684 685 686 687 688 689 690 691 692 693 694 695 696 697 698 699 700 701 702 703 704 705 706 707 708 709
3.2.P.2.3 Manufacturing Process Development From the initial risk evaluation and formulation development studies described in section 3.2.P.2.2, above, a formulation and associated wet granulation process were proposed (Appendix Table 7, Figure 5). The process consists of an initial mixing step of the drug substance, the diluents (mannitol and microcrystalline cellulose) and the intra-granular disintegrant in the high shear granulator. The blend is granulated with an aqueous solution of povidone. The wet mass is transferred to a fluid bed drier and dried to a water content between 1.5 and 2% w/w. The granules produced are then blended with the extra granular quantity of croscarmellose sodium and lubricated with the magnesium stearate. The final blend is tableted. Further studies were conducted during manufacturing process development to understand better and mitigate all identified remaining high risk factors. Detailed description is given of studies to understand and mitigate risk factors in unit operations of granulation and fluidised bed drying. In each case there is a risk assessment, action plan with development, usually DOE, studies, an assessment of the results leading to a proposed design space and then control strategy.
Version 3 24 Jan 06 Page 25 of 69
3.2.P.2.3.1 Unit operations in the manufacture of examplain hydrochloride tablets
709 710 711 712 713 714 715 716 717 718 719 720 721 722 723 724 725 726 727 728 729 730 731
3.2.P.2.3.1.1 Mixing 3.2.P.2.3.1.2 Wet Granulation All parameters relevant to wet granulation were identified from the Ishikawa diagram (Figure 6) and were introduced into a detailed risk assessment (FMEA), in accordance with ICH Q9, to establish those process parameters that are likely to have the greatest impact on the quality of the product and be associated with a critical to quality attribute, water content (Figure 13), and hence were incorporated in Design of Experiments (DOE) studies .
Version 3 24 Jan 06 Page 26 of 69
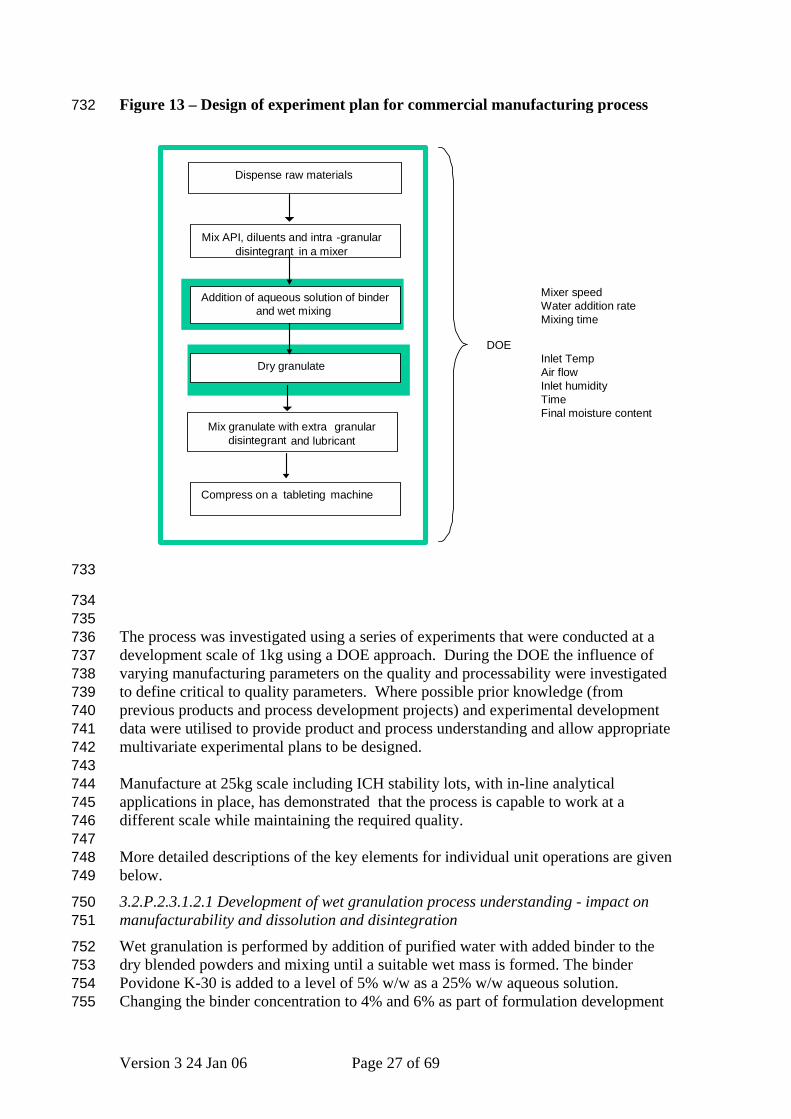
Figure 13 – Design of experiment plan for commercial manufacturing process 732
Mix API, diluents and intra -granular disintegrant in a mixer
Addition of aqueous solution of binderand wet mixing
Dry granulate
Mix granulate with extra granulardisintegrant and lubricant
Compress on a tableting machine
Dispense raw materials
DOE
Mixer speed
Mixing timeWater addition rate
Inlet Temp
Inlet humidityAir flow
Final moisture contentTime
733
734 735 736 737 738 739 740 741 742 743 744 745 746 747 748 749
750 751
752 753 754 755
The process was investigated using a series of experiments that were conducted at a development scale of 1kg using a DOE approach. During the DOE the influence of varying manufacturing parameters on the quality and processability were investigated to define critical to quality parameters. Where possible prior knowledge (from previous products and process development projects) and experimental development data were utilised to provide product and process understanding and allow appropriate multivariate experimental plans to be designed. Manufacture at 25kg scale including ICH stability lots, with in-line analytical applications in place, has demonstrated that the process is capable to work at a different scale while maintaining the required quality. More detailed descriptions of the key elements for individual unit operations are given below.
3.2.P.2.3.1.2.1 Development of wet granulation process understanding - impact on manufacturability and dissolution and disintegration
Wet granulation is performed by addition of purified water with added binder to the dry blended powders and mixing until a suitable wet mass is formed. The binder Povidone K-30 is added to a level of 5% w/w as a 25% w/w aqueous solution. Changing the binder concentration to 4% and 6% as part of formulation development
Version 3 24 Jan 06 Page 27 of 69

studies showed no significant effect on tablet dissolution or disintegration. The formulation design work showed that the formulated tablet exhibits rapid dissolution properties. In 0.1 M HCl no difference could be observed between the drug substance, dried granules or the tablet whereas at pH 6.8 it was evident that the formulated product and the dried granules had slightly faster dissolution characteristics than the drug substance, (see Figure 14) below. This confirms the rapid dissolution properties of the examplain hydrochloride 20 mg tablet. The similar dissolution results in the two dissolution media are consistent with the FDA guidance for industry for determining drug product dissolution characteristics and dissolution profile similarity (“Waiver of in vivo bioavailability and bioequivalence studies for IR solid dosage forms based on a Biopharmaceutics Classification System (2000)”). This is further evidence that dissolution is unaffected by formulation and processing variables.
756 757 758 759 760 761 762 763 764 765 766 767 768 769 770
Figure 14 - Comparison of dissolution characteristics at pH 6.8: Examplain 20 mg tablet, dried granules and the API (examplain hydrochloride drug)
0
20
40
60
80
100
120
0 10 20 30 40 50
time (min)
% d
isso
lved Dried granule
20 mg tabletAPI
771 772 773 774 775 776 777 778
Because of the high capability of the wet granulation process in the initial process design studies to improve homogeneity and compressibility, and reduce the impact of raw material variability compared with direct compression, the Design of Experiments approach was tailored to evaluate the robustness of the process with respect to key process variables as listed in (Table 3)
Version 3 24 Jan 06 Page 28 of 69

Table 3 – Key process variables for the wet granulation operation 778 779
Wet granulation parameters Input material attributes Mixing speed API particle size Water addition rate Mannitol particle size Mixing time
Throughout the development of the manufacturing process the dry mixing and wet granulation steps were monitored in line by power consumption, (see Figure 15)
780 781 782 783 784 785 786 787 788 789 790 791 792 793 794 795 796 797 798 799 800 801 802 803 804 805 806
807 808 809 810 811 812
813
Figure 15 – Key process parameters for the wet granulation operation Mixing speed
Mixing time Water addition rate
Wet GranulationDry mix
Wet granule Power
Tablet Disintegration
wet
mass
Red – input variables Blue – in-line measurements Green – derived parameters
A summary of the results of the wet granulation DOE studies is described below.
The development DOE studies conducted by spanning out the processing conditions within a wide range show that dissolution at 15 minutes is insensitive to the conditions used for the wet granulation process, whereas granulation conditions have a small effect on disintegration, which however still remains within acceptable limits. The design space for disintegration with respect to wet granulation mixing speed and water addition rate is shown in Figure 16.
Version 3 24 Jan 06 Page 29 of 69

813
814 815 816 817
818 819 820 821 822 823 824 825 826 827 828 829 830 831 832 833 834 835 836 837 838 839 840 841
Figure 16 - Effect of wet granulation mixing speed and water addition rate on disintegration, as shown by the DOE (yellow = meets Pharmacopoeial quality requirements for an immediate release dosage form)
D isinteg ration
M ixing sp eed
Wat
er a
dditi
on ra
te
D isin teg ration
Faster
These DOE studies also showed the relative importance of the various factors (Figure 17) on disintegration with mixing speed and water addition rate being the most important.
Version 3 24 Jan 06 Page 30 of 69
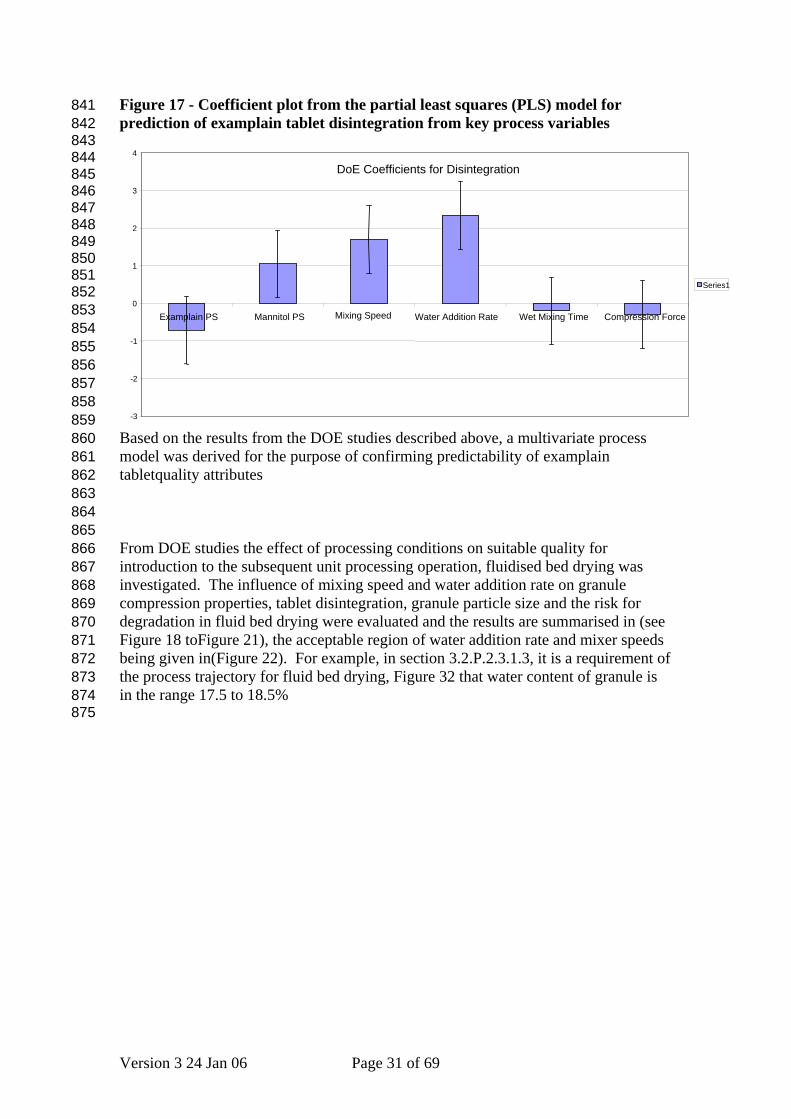
Figure 17 - Coefficient plot from the partial least squares (PLS) model for prediction of examplain tablet disintegration from key process variables
841 842 843 844 845 846 847 848 849 850 851 852 853 854 855 856 857 858 859 860 861 862 863 864 865 866 867 868 869 870 871 872 873 874 875
Based on the results from the DOE studies described above, a multivariate process model was derived for the purpose of confirming predictability of examplain tabletquality attributes
DoE Coefficients for Disintegration
Compression ForceWet Mixing TimeWater Addition RateMixing SpeedMannitol PS Examplain PS
-3 -2 -1 0 1 2 3 4
Series1
From DOE studies the effect of processing conditions on suitable quality for introduction to the subsequent unit processing operation, fluidised bed drying was investigated. The influence of mixing speed and water addition rate on granule compression properties, tablet disintegration, granule particle size and the risk for degradation in fluid bed drying were evaluated and the results are summarised in (see Figure 18 toFigure 21), the acceptable region of water addition rate and mixer speeds being given in(Figure 22). For example, in section 3.2.P.2.3.1.3, it is a requirement of the process trajectory for fluid bed drying, Figure 32 that water content of granule is in the range 17.5 to 18.5%
Version 3 24 Jan 06 Page 31 of 69

Figure 18 – Effect of water addition rate and mixer speed on disintegration (red does not meet quality requirements)
876 877
Disintegration
Mixer speed
Wat
er a
dditi
on ra
teDisintegration
Faster
878
879 880
Figure 19 – Effect of water addition rate and mixer speed on degradation in tablet (red does not meet quality requirements)
Pass
FAIL
Degradation (tablet)
Wat
er a
dditi
on ra
te
Mixer speed
Increased risk ofdegradation in tablet
881
Version 3 24 Jan 06 Page 32 of 69
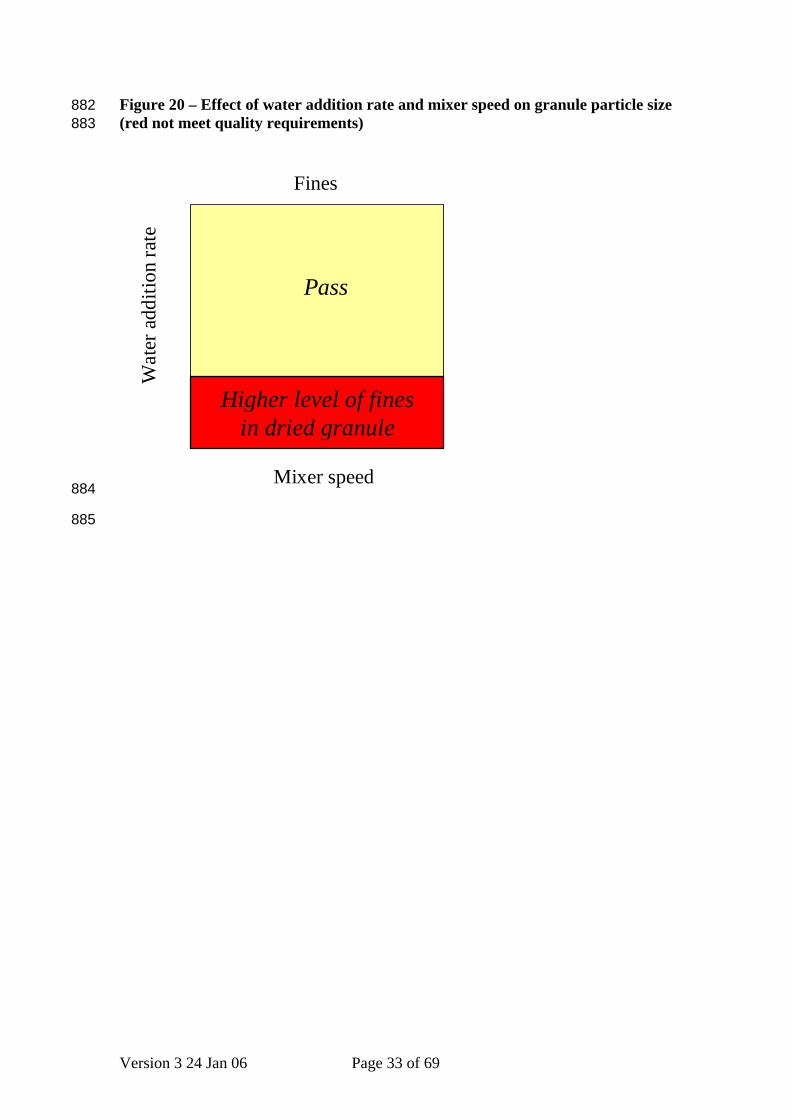
Figure 20 – Effect of water addition rate and mixer speed on granule particle size (red not meet quality requirements)
882 883
FAIL
Pass
Fines
Higher level of finesin dried granule
Wat
er a
dditi
on ra
te
Mixer speed 884
885
Version 3 24 Jan 06 Page 33 of 69

Figure 21 – Interaction of water addition rate and mixer speed with all attributes 886 887
Pass
FAIL
All attributes
Wat
er a
dditi
on ra
te
Mixer speed
Increased risk ofdegradation in tablet
Higher level of finesin dried granule
Disintegration Acceptable
888
889 890 891 892 893 894
895
896
The relationship of water addition time and water addition rate on disintegration, degradation and granule particle size is given in (Figure 22. This shows that for a limited range of mixer speeds there is a range of combinations of water addition time and water addition rate that give acceptable granule for progressing to the next unit processing operation of fluidised bed drying. This acceptable region is considered as the design space for water addition rate and time
Version 3 24 Jan 06 Page 34 of 69

Figure 22 – Process operating region for water addition time and rate – all attributes
897 898
log
(wat
er a
dditi
on ti
me)
Disintegration acceptable
Log (Water addition rate)
Fines
Bad Degradation
High level of fines
in dried granule
Increased risk of
degradation in tablets
Good = 17.5%-18.5%
water content
899
900 901
902 903 904 905 906 907 908 909 910 911 912 913 914
3.2.P.2.3.1.2.2 Development of Design Space and Control Strategy for the wet granulation operation
Monitoring the high shear mixing process by power consumption or other techniques such as acoustics offers PAT opportunities for better process understanding and advanced control, e.g. of end-point. As shown previously, process parameters of water addition rate and time can be continuously adjusted within the design space to obtain highly consistent granule properties mainly with respect to flowability, compressibility, degradation, and suitability as input to the next processing step. Process trajectories based on power consumption monitoring are shown in (Figure 23). Solid lines show a range that gives acceptable tablet properties within time window (green dashed lines). Blue dotted lines show process trajectories where tablet manufacturability is affected.
Version 3 24 Jan 06 Page 35 of 69

915 916 917
Figure 23 – Process trajectories for the wet granulation operation. Process evolution by power consumption monitoring (1 kg scale)
918
919
920
921 922 923 924
925
The region bounded by the solid green line is the design space for the wet granulation unit operation, and it is the region between acceptable power consumption trajectories, and within an acceptable time range. Using this information it is possible to control the wet granulation operation as proposed in (Figure 24)
Version 3 24 Jan 06 Page 36 of 69

925
926 927 928 929
Figure 24 Process trajectories for the wet granulation operation (1kg) – end point of granulation
Pow
er c
onsu
mpt
ion
(kW
)
Wet mixing time (min)
Disintegration OK but difficult to obtain sufficient hardness, and some potential for degradation
Disintegration OK but flowability of dry granule low
End-point: 6 Min. after peak
Design Space - Product quality assured
930 931 932 933 934 935 936 937 938 939 940 941
The wet granulation design space can be used as part of the control strategy to provide additional assurance of satisfactory granulation even with varying raw material input and set an optimal end point of mixing time after completion of water addition. The effect of scale was studied. The design space established by the DOE approach for 1 kg scale was subsequently verified at larger development scale. At 25 kg scale, a reduced DOE programme was performed to produce the water addition rate and time relationship and power consumption trajectory. (Figure 25)
Version 3 24 Jan 06 Page 37 of 69
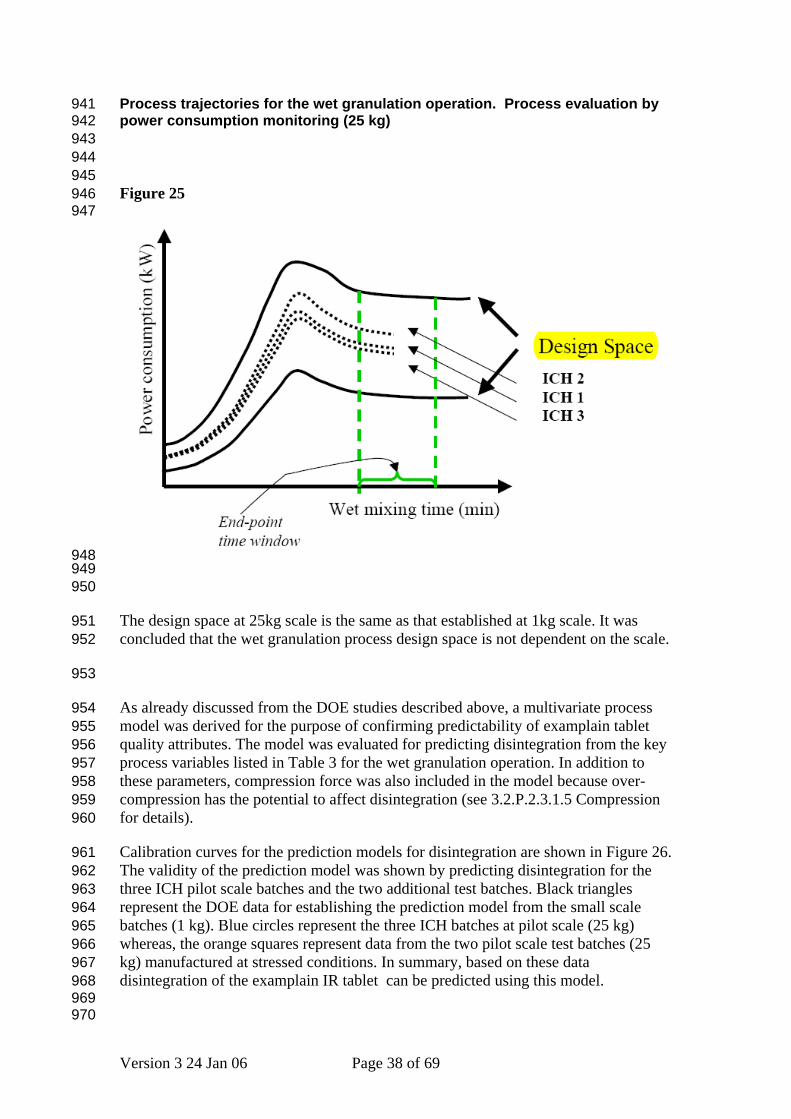
Process trajectories for the wet granulation operation. Process evaluation by power consumption monitoring (25 kg)
941 942 943 944 945 946 947
Figure 25
948 949 950
951 952
953
954 955 956 957 958 959 960
961 962 963 964 965 966 967 968 969 970
The design space at 25kg scale is the same as that established at 1kg scale. It was concluded that the wet granulation process design space is not dependent on the scale.
As already discussed from the DOE studies described above, a multivariate process model was derived for the purpose of confirming predictability of examplain tablet quality attributes. The model was evaluated for predicting disintegration from the key process variables listed in Table 3 for the wet granulation operation. In addition to these parameters, compression force was also included in the model because over-compression has the potential to affect disintegration (see 3.2.P.2.3.1.5 Compression for details).
Calibration curves for the prediction models for disintegration are shown in Figure 26. The validity of the prediction model was shown by predicting disintegration for the three ICH pilot scale batches and the two additional test batches. Black triangles represent the DOE data for establishing the prediction model from the small scale batches (1 kg). Blue circles represent the three ICH batches at pilot scale (25 kg) whereas, the orange squares represent data from the two pilot scale test batches (25 kg) manufactured at stressed conditions. In summary, based on these data disintegration of the examplain IR tablet can be predicted using this model.
Version 3 24 Jan 06 Page 38 of 69

971 972 973 974 975
Figure 26 – Predicted values (% released) versus reference values for the disintegration model.
2
8
15
2 8 15Predicted
Examplain DOE DisintegrationDis_DOEDis_PS ICH
Obs
erve
d
Dis_PS Test
976 977 978 979 980 981 982 983 984 985 986 987 988 989 990 991 992 993 994 995 996 997 998 999
1000
Using the wet granulation design space a control strategy for the granulation step is proposed whereby wet massing is finished after a preset time interval (6 min.) following maximum power consumption, and ensuring that the power trajectory is within the acceptable range. Extensive processing studies have produced a high level of understanding of the wet granulation unit operation with the following conclusions within the ranges studied: - measuring release at 15 minutes, dissolution is not affected (there is a small
change in disintegration always within acceptance limits) - granulation progress can be monitored and end point controlled by power
consumption trajectory - output from the granulation step in terms of water content range (17.5 to 18.5%
w/w) is designed to meet input criteria for the next unit operation, fluidised bed drying
- a multivariate model has been established to understand and predict disintegration which incorporates factors from the wet granulation step
- change of scale has been introduced into process understanding - a design space for the wet granulation unit operation is described - mixing speed and water addition rate are the most important factors - drug substance particle size is of low importance - a control strategy for the wet granulation unit operation is proposed based on use
of the design space
Version 3 24 Jan 06 Page 39 of 69

- combination of application of the control strategy for the wet granulation step and prediction of tablet disintegration is part of the control strategy for the assuring tablet quality
1001 1002 1003 1004 1005 1006 1007 1008 1009
1010
1011 1012 1013 1014 1015 1016 1017 1018 1019
1020 1021
- all these studies have reduced the risk associated with dissolution, disintegration, content uniformity and degradation such that operating within the design space, all are now low risk
3.2.P.2.3.1.3 Fluid bed drying
3.2.P.2.3.1.3.1 Summary
Based on an FMEA risk management approach, the fluid bed drying performance was identified as a possible critical process step for the manufacture of examplain hydrochloride tablets with respect to meeting the target water content at the end of the drying and ensure less than 2% des-ethyl examplain at the end of shelf life, and to ensure that uniform tablets with appropriate disintegration and dissolution characteristics are produced. A detailed, science-based understanding of the relationship between the process parameters of the drying step, the properties of the in-going wet granulate, downstream processability and the quality attributes of the finished examplain hydrochloride tablets has been developed.
The key parameters for the drying operation are shown in Figure 27
Version 3 24 Jan 06 Page 40 of 69
1022 1023 1024 1025
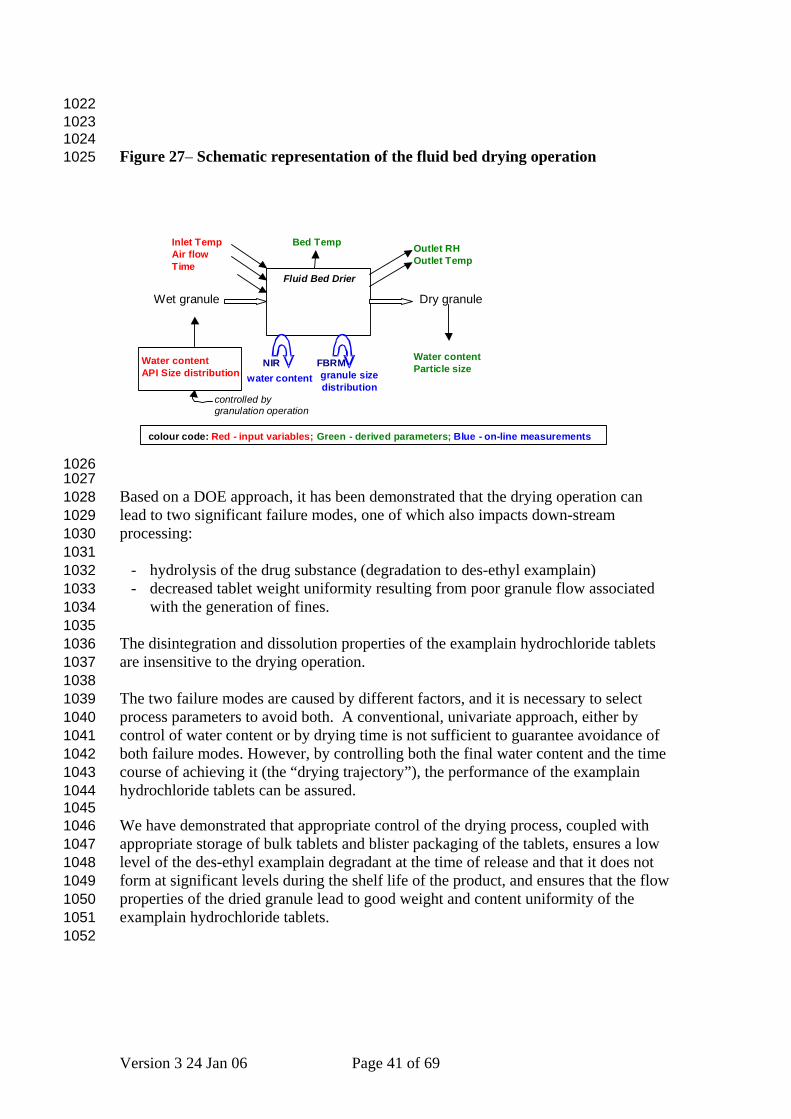
Figure 27– Schematic representation of the fluid bed drying operation
Wet granule Dry granule
Water contentParticle size
Water contentAPI Size distribution
Air flowTime
Inlet Temp Outlet RHOutlet Temp
Bed Temp
NIR FBRMgranule size distribution
water content
Fluid Bed Drier
colour code: Green - derived parameters; Blue - on-line measurements
controlled bygranulation operation
Red - input variables;
1026 1027 1028 1029 1030 1031 1032 1033 1034 1035 1036 1037 1038 1039 1040 1041 1042 1043 1044 1045 1046 1047 1048 1049 1050 1051 1052
Based on a DOE approach, it has been demonstrated that the drying operation can lead to two significant failure modes, one of which also impacts down-stream processing:
- hydrolysis of the drug substance (degradation to des-ethyl examplain) - decreased tablet weight uniformity resulting from poor granule flow associated
with the generation of fines. The disintegration and dissolution properties of the examplain hydrochloride tablets are insensitive to the drying operation. The two failure modes are caused by different factors, and it is necessary to select process parameters to avoid both. A conventional, univariate approach, either by control of water content or by drying time is not sufficient to guarantee avoidance of both failure modes. However, by controlling both the final water content and the time course of achieving it (the “drying trajectory”), the performance of the examplain hydrochloride tablets can be assured. We have demonstrated that appropriate control of the drying process, coupled with appropriate storage of bulk tablets and blister packaging of the tablets, ensures a low level of the des-ethyl examplain degradant at the time of release and that it does not form at significant levels during the shelf life of the product, and ensures that the flow properties of the dried granule lead to good weight and content uniformity of the examplain hydrochloride tablets.
Version 3 24 Jan 06 Page 41 of 69
3.2.P.2.3.1.3.2 Quality attributes of the dried granule and impact on manufacturability and tablet quality – development of process understanding
1053 1054
1055 1056 1057 1058 1059 1060 1061 1062 1063 1064 1065 1066 1067 1068
As part of our risk management approach, relationships were established between process variables (including equipment settings and attributes of the input wet granules) and the desired quality attributes of the dried granule, incorporating a Design of Experiments approach at a 1 kg scale. In addition to monitoring the conventional equipment parameters (inlet, bed and outlet temperatures, air flow etc), appropriately validated on-line NIR spectroscopy and Lasentec FBRM methods were used to measure the water content and particle size distribution of the granule during drying. Granules from the DOE were converted to tablets to assess impact on manufacturability and tablet quality. The range of potential process variables and the granule and tablet quality attributes considered are shown in Table 4. Table 4 – Process variables and quality attributes for the fluid bed drying operation Process variables
Drying parameters Input material attributes Inlet air temperature Water content Inlet air humidity Granule particle size distribution Air flow rate Fill level Filter sock cycle Heating rate Cooling rate Quality attributes
Dried granule Tablet Particle size distribution (fines) Disintegration Water content Dissolution Degradation (des-ethyl examplain) Weight uniformity Content uniformity
1069 1070 1071 1072 1073 1074 1075 1076 1077 1078 1079 1080 1081 1082 1083 1084 1085
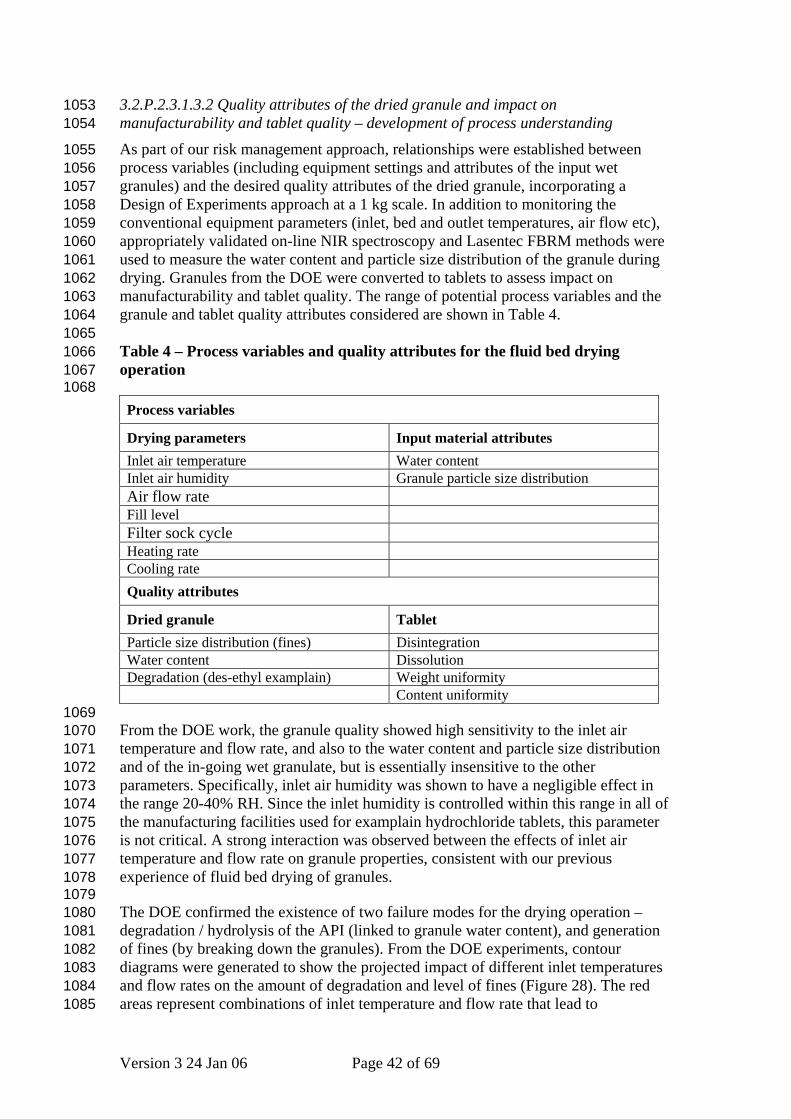
From the DOE work, the granule quality showed high sensitivity to the inlet air temperature and flow rate, and also to the water content and particle size distribution and of the in-going wet granulate, but is essentially insensitive to the other parameters. Specifically, inlet air humidity was shown to have a negligible effect in the range 20-40% RH. Since the inlet humidity is controlled within this range in all of the manufacturing facilities used for examplain hydrochloride tablets, this parameter is not critical. A strong interaction was observed between the effects of inlet air temperature and flow rate on granule properties, consistent with our previous experience of fluid bed drying of granules. The DOE confirmed the existence of two failure modes for the drying operation – degradation / hydrolysis of the API (linked to granule water content), and generation of fines (by breaking down the granules). From the DOE experiments, contour diagrams were generated to show the projected impact of different inlet temperatures and flow rates on the amount of degradation and level of fines (Figure 28). The red areas represent combinations of inlet temperature and flow rate that lead to
Version 3 24 Jan 06 Page 42 of 69

unacceptable product quality. From these plots, it can be seen that different combinations of these parameters are required to avoid each failure mode.
1086 1087 1088 1089 1090 1091 1092 1093 1094 1095
(Figure 29)shows the intersection of the two plots, and describes the sets of parameter values that avoid both failure modes. Figure 28 - Effect of inlet temperature and air flow on degradation and generation of fines, as shown by the DOE (red = does not meet quality requirements)
Air flow
Inle
t tem
pera
ture
Fines
Air flow
Inle
t tem
pera
ture
Degradation
Air flow
Inle
t tem
pera
ture
Fines
Air flow
Inle
t tem
pera
ture
Fines
Air flow
Inle
t tem
pera
ture
Degradation
Air flow
Inle
t tem
pera
ture
Degradation
1096 1097 1098 1099 1100 1101 1102
Version 3 24 Jan 06 Page 43 of 69
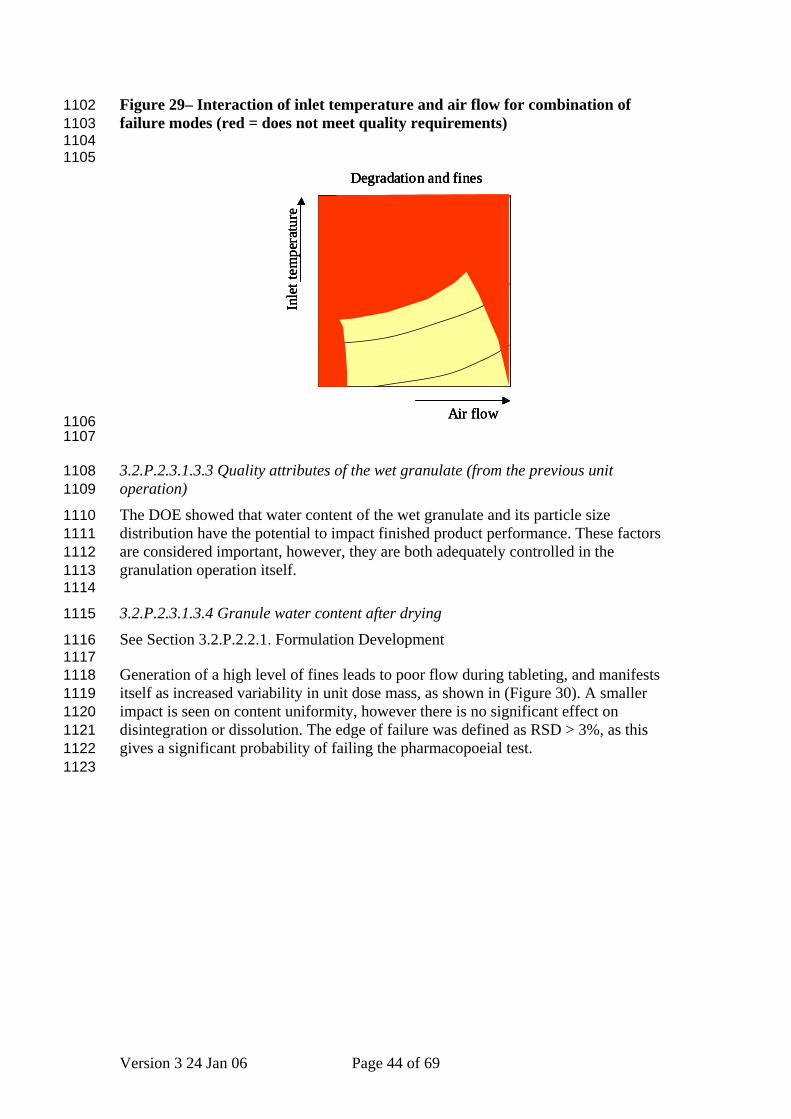
Figure 29– Interaction of inlet temperature and air flow for combination of failure modes (red = does not meet quality requirements)
1102 1103 1104 1105
Air flow
Inle
t tem
pera
ture
Degradation and fines
Air flow
Inle
t tem
pera
ture
Degradation and fines
Air flow
Inle
t tem
pera
ture
Degradation and fines
1106 1107
1108 1109
1110 1111 1112 1113 1114
1115
1116 1117 1118 1119 1120 1121 1122 1123
3.2.P.2.3.1.3.3 Quality attributes of the wet granulate (from the previous unit operation)
The DOE showed that water content of the wet granulate and its particle size distribution have the potential to impact finished product performance. These factors are considered important, however, they are both adequately controlled in the granulation operation itself.
3.2.P.2.3.1.3.4 Granule water content after drying
See Section 3.2.P.2.2.1. Formulation Development Generation of a high level of fines leads to poor flow during tableting, and manifests itself as increased variability in unit dose mass, as shown in (Figure 30). A smaller impact is seen on content uniformity, however there is no significant effect on disintegration or dissolution. The edge of failure was defined as RSD > 3%, as this gives a significant probability of failing the pharmacopoeial test.
Version 3 24 Jan 06 Page 44 of 69
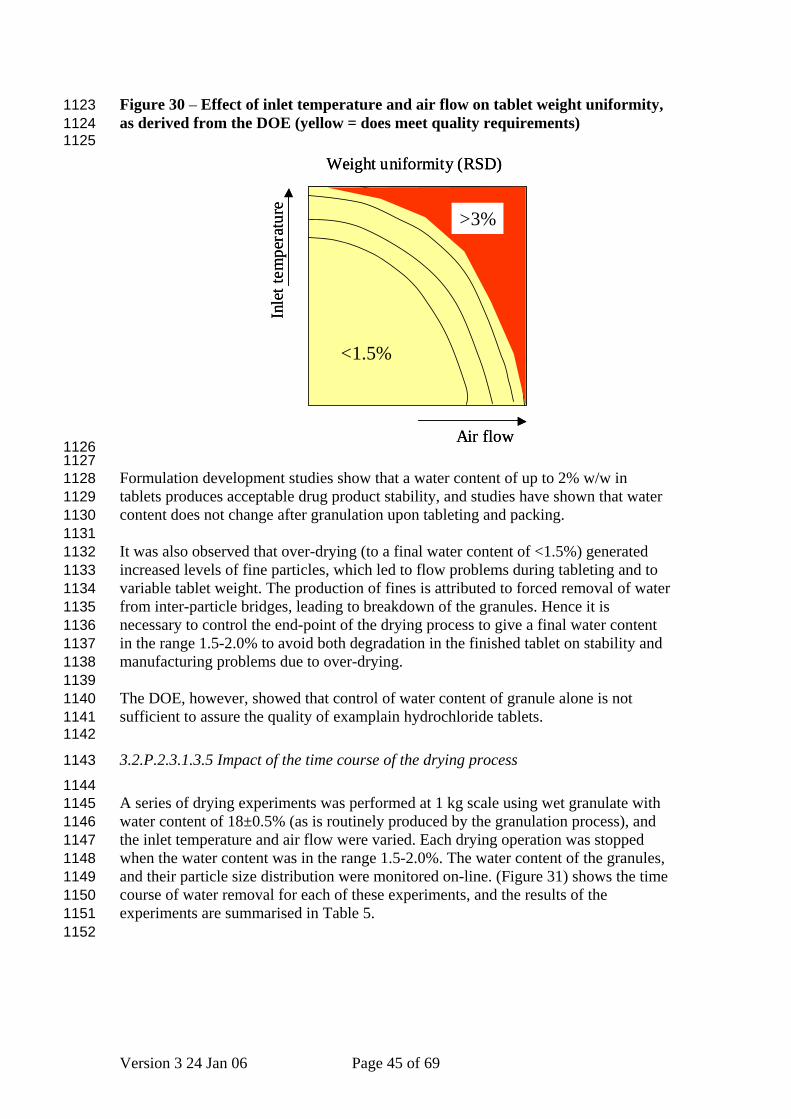
Figure 30 – Effect of inlet temperature and air flow on tablet weight uniformity, as derived from the DOE (yellow = does meet quality requirements)
1123 1124 1125
Air flow
Inle
t tem
pera
ture
Weight uniformity (RSD)
>3%
<1.5%
Air flow
Inle
t tem
pera
ture
Weight uniformity (RSD)
>3%
<1.5%
1126 1127 1128 1129 1130 1131 1132 1133 1134 1135 1136 1137 1138 1139 1140 1141 1142
1143
1144 1145 1146 1147 1148 1149 1150 1151 1152
Formulation development studies show that a water content of up to 2% w/w in tablets produces acceptable drug product stability, and studies have shown that water content does not change after granulation upon tableting and packing. It was also observed that over-drying (to a final water content of <1.5%) generated increased levels of fine particles, which led to flow problems during tableting and to variable tablet weight. The production of fines is attributed to forced removal of water from inter-particle bridges, leading to breakdown of the granules. Hence it is necessary to control the end-point of the drying process to give a final water content in the range 1.5-2.0% to avoid both degradation in the finished tablet on stability and manufacturing problems due to over-drying. The DOE, however, showed that control of water content of granule alone is not sufficient to assure the quality of examplain hydrochloride tablets.
3.2.P.2.3.1.3.5 Impact of the time course of the drying process A series of drying experiments was performed at 1 kg scale using wet granulate with water content of 18±0.5% (as is routinely produced by the granulation process), and the inlet temperature and air flow were varied. Each drying operation was stopped when the water content was in the range 1.5-2.0%. The water content of the granules, and their particle size distribution were monitored on-line. (Figure 31) shows the time course of water removal for each of these experiments, and the results of the experiments are summarised in Table 5.
Version 3 24 Jan 06 Page 45 of 69

Figure 31 - Process trajectories for drying of examplain hydrochloride wet granulate (see text for description)
1152 1153 1154
% H2O
2.0%1.5%
18.5%
Drying time
17.5% 12
34
5
6789
% H2O
2.0%1.5%
18.5%
Drying time
17.5% 12
34
5
6789
by NIR
1155 1156 1157
Table 5– Summary of results of varying drying process trajectory
Experiment / Process
Trajectory
% des-ethyl examplain (<1.0%)
% fines (< x µm)(<15%)
Weight uniformity
(RSD)
Acceptable quality?
1 1.7 4 1.3% No – high des-ethyl level 2 1.3 7 1.7% No – high des-ethyl level 3 0.3 5 1.5% Yes 4 0.3 5 1.4% Yes 5 0.2 6 1.7% Yes 6 0.3 4 1.3% Yes 7 0.2 7 1.6% Yes 8 0.2 17 3.4% No – poor flow impacts
weight uniformity 9 0.2 20 5.3% No – poor flow impacts
weight uniformity 1158
1159 1160 1161 1162 1163 1164 1165 1166 1167 1168 1169 1170 1171 1172
The granules made using the slowest drying conditions shown by the blue (dotted) lines gave elevated levels of des-ethyl examplain, but satisfactory amounts of fines. In contrast, the most rapid drying trajectories shown in red (dashed lines) resulted in granules with very low levels of degradation, but increased quantities of fine particles. As before, this was demonstrated to lead to flow problems during tableting and to increased variability of tablet weight. All of the process trajectories shown by black lines gave granules with acceptable values for the particle size distribution for downstream processing and the amount of des-ethyl examplain. In conclusion, these experiments demonstrate that extended exposure to high water content at elevated temperature leads to degradation of the examplain hydrochloride in the granule and can result in tablets containing unacceptably high levels of des-ethyl examplain at the time of release, despite the water content of the dried granule being at an acceptable level. On the other hand, over-rapid removal of the water
Version 3 24 Jan 06 Page 46 of 69
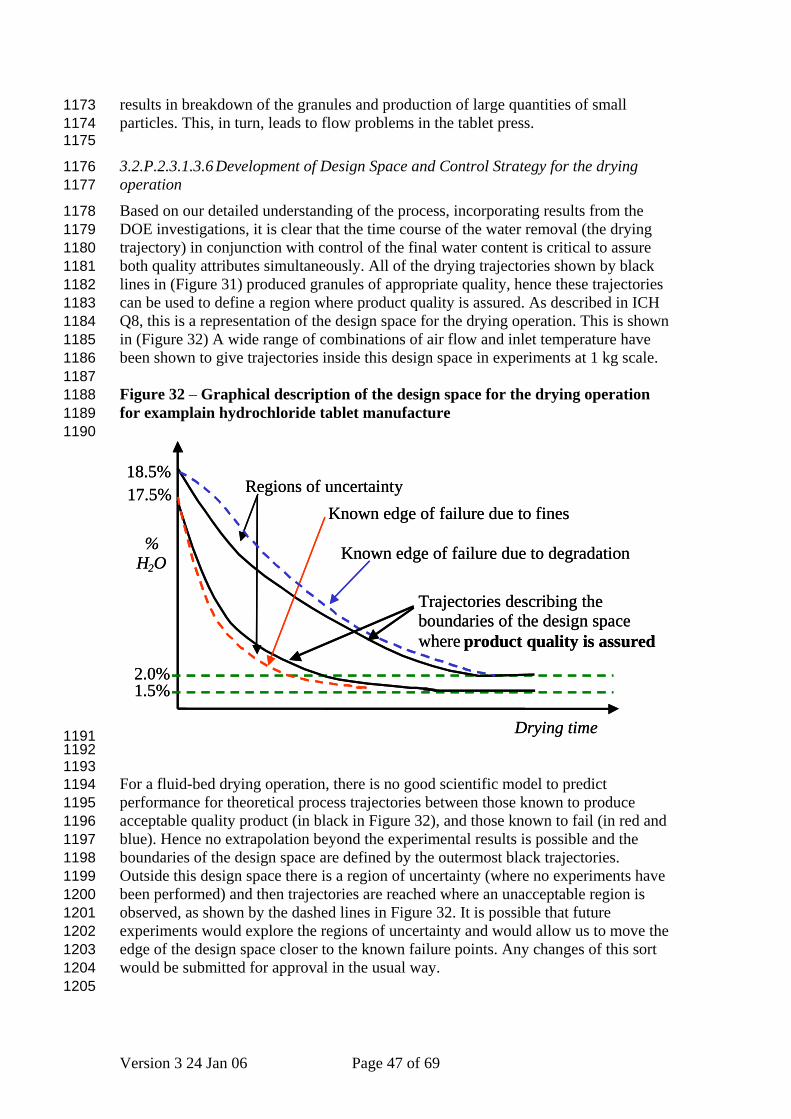
results in breakdown of the granules and production of large quantities of small particles. This, in turn, leads to flow problems in the tablet press.
1173 1174 1175
1176 1177
1178 1179 1180 1181 1182 1183 1184 1185 1186 1187 1188 1189 1190
3.2.P.2.3.1.3.6 Development of Design Space and Control Strategy for the drying operation
Based on our detailed understanding of the process, incorporating results from the DOE investigations, it is clear that the time course of the water removal (the drying trajectory) in conjunction with control of the final water content is critical to assure both quality attributes simultaneously. All of the drying trajectories shown by black lines in (Figure 31) produced granules of appropriate quality, hence these trajectories can be used to define a region where product quality is assured. As described in ICH Q8, this is a representation of the design space for the drying operation. This is shown in (Figure 32) A wide range of combinations of air flow and inlet temperature have been shown to give trajectories inside this design space in experiments at 1 kg scale. Figure 32 – Graphical description of the design space for the drying operation for examplain hydrochloride tablet manufacture
Known edge of failure due to fines
% H 2 O
2.0% 1.5%
18.5%
Drying time
Known edge of failure due to degradation
Regions of uncertainty 17.5%
Trajectories describing the boundaries of the design space where product quality is assured
Known edge of failure due to fines
% H 2 O
2.0% 1.5%
18.5%
Drying time
Known edge of failure due to degradation
Regions of uncertainty 17.5%
Trajectories describing the boundaries of the design space where product quality is assured
1191 1192 1193 1194 1195 1196 1197 1198 1199 1200 1201 1202 1203 1204 1205
For a fluid-bed drying operation, there is no good scientific model to predict performance for theoretical process trajectories between those known to produce acceptable quality product (in black in Figure 32), and those known to fail (in red and blue). Hence no extrapolation beyond the experimental results is possible and the boundaries of the design space are defined by the outermost black trajectories. Outside this design space there is a region of uncertainty (where no experiments have been performed) and then trajectories are reached where an unacceptable region is observed, as shown by the dashed lines in Figure 32. It is possible that future experiments would explore the regions of uncertainty and would allow us to move the edge of the design space closer to the known failure points. Any changes of this sort would be submitted for approval in the usual way.
Version 3 24 Jan 06 Page 47 of 69
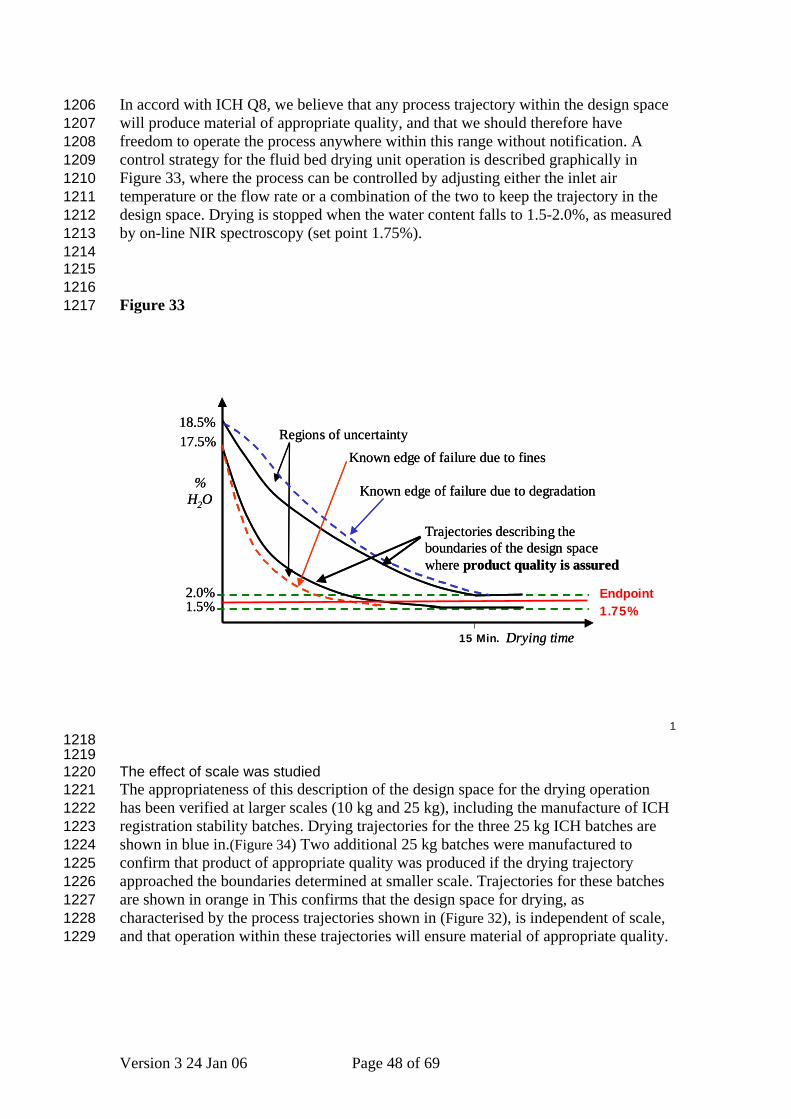
In accord with ICH Q8, we believe that any process trajectory within the design space will produce material of appropriate quality, and that we should therefore have freedom to operate the process anywhere within this range without notification. A control strategy for the fluid bed drying unit operation is described graphically in Figure 33, where the process can be controlled by adjusting either the inlet air temperature or the flow rate or a combination of the two to keep the trajectory in the design space. Drying is stopped when the water content falls to 1.5-2.0%, as measured by on-line NIR spectroscopy (set point 1.75%).
1206 1207 1208 1209 1210 1211 1212 1213 1214 1215 1216 1217
Figure 33
1
Known edge of failure due to fines
% H2O
2.0%1.5%
18.5%
Drying time
Known edge of failure due to degradation
Regions of uncertainty17.5%
Trajectories describing the boundaries of the design space where product quality is assured
Known edge of failure due to fines
% H2O
2.0%1.5%
18.5%
Drying time
Known edge of failure due to degradation
Regions of uncertainty17.5%
Trajectories describing the boundaries of the design space where product quality is assured
15 Min.
Endpoint1.75%
1218 1219 1220 1221 1222 1223 1224 1225 1226 1227 1228 1229
The effect of scale was studied The appropriateness of this description of the design space for the drying operation has been verified at larger scales (10 kg and 25 kg), including the manufacture of ICH registration stability batches. Drying trajectories for the three 25 kg ICH batches are shown in blue in.(Figure 34) Two additional 25 kg batches were manufactured to confirm that product of appropriate quality was produced if the drying trajectory approached the boundaries determined at smaller scale. Trajectories for these batches are shown in orange in This confirms that the design space for drying, as characterised by the process trajectories shown in (Figure 32), is independent of scale, and that operation within these trajectories will ensure material of appropriate quality.
Version 3 24 Jan 06 Page 48 of 69
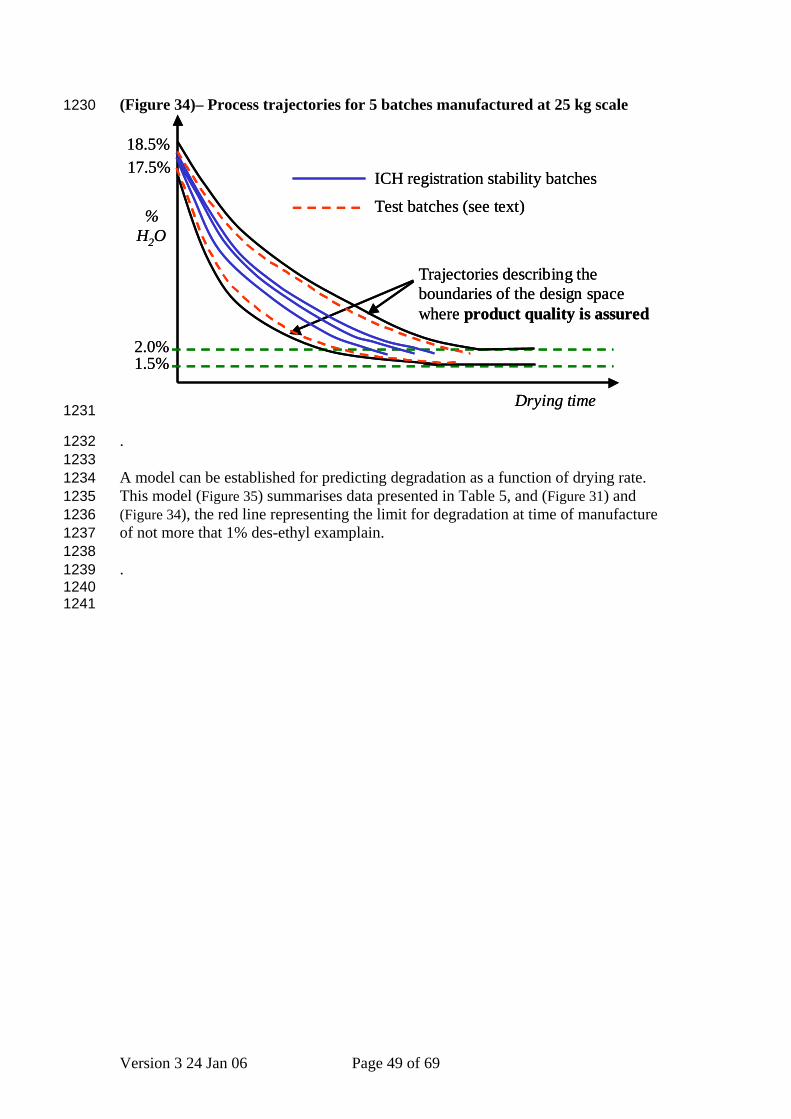
(Figure 34)– Process trajectories for 5 batches manufactured at 25 kg scale 1230
% H2O
2.0%1.5%
18.5%
Drying time
17.5%
Trajectories describing the boundaries of the design space where product quality is assured
Test batches (see text)
ICH registration stability batches
% H2O
2.0%1.5%
18.5%
Drying time
17.5%
Trajectories describing the boundaries of the design space where product quality is assured
Test batches (see text)
ICH registration stability batches
1231
1232 1233 1234 1235 1236 1237 1238 1239 1240 1241
. A model can be established for predicting degradation as a function of drying rate. This model (Figure 35) summarises data presented in Table 5, and (Figure 31) and (Figure 34), the red line representing the limit for degradation at time of manufacture of not more that 1% des-ethyl examplain. .
Version 3 24 Jan 06 Page 49 of 69

1241 1242
Figure 35 : Degradation as a function of the drying rate
Deg
rada
tatio
n
Drying rate
1243 1244 1245 1246 1247
1248 1249
1250 1251 1252 1253 1254 1255 1256 1257 1258 1259 1260 1261 1262 1263 1264 1265 1266
3.2.P.2.3.1.3.7 Impact of process understanding for the fluid bed drying operation on the quality control of examplain hydrochloride tablets.
Des-ethyl examplain is the only degradation product observed in examplain hydrochloride tablets and, as described in Section 3.2.P.5.4, an appropriately validated test exists for measuring its level at release and on stability and acceptance criteria have been proposed consistent with ICH Q6a and Q3b. In addition to the early formulation studies relating level of tablet water content on formation of des-ethyl examplain stored in Aclar blisters at 40°C/75% RH (Figure 10), further confirmatory accelerated studies of samples resulting from the 1kg scale work (Trajectories 2, 3, 5 and 7) and 25kg scale (test batches coloured red in (Figure 31) were conducted. A batch with a water content close to the upper limit of 2.0% (2.1%) was also placed on long term stability at 25°C/60% RH packed into Aclar blisters (Trajectory 3). In all cases accelerated testing for 6 months at 40°C/75% in Aclar blisters showed rates of degradation lower than the batch containing 2.4% water content in (Figure 10). Furthermore, the batch with an initial water content of 2.1% and des-ethyl examplain level of 0.3% has satisfactory stability after 12 months at
Version 3 24 Jan 06 Page 50 of 69
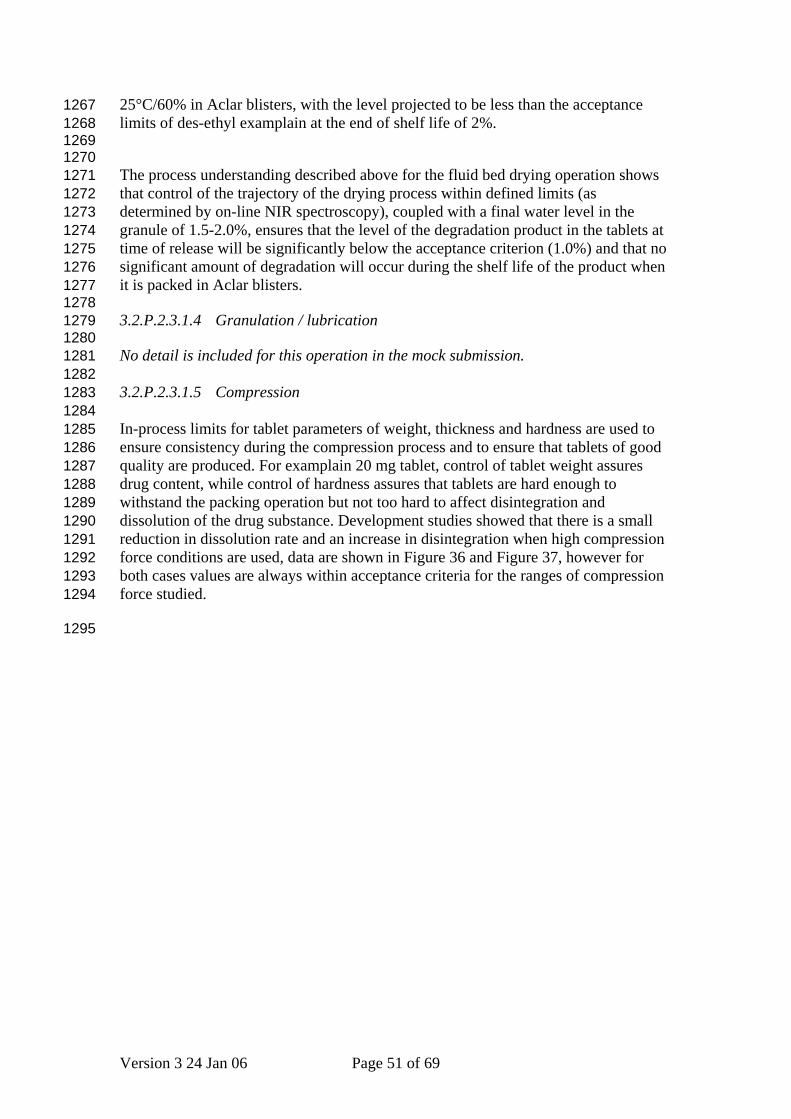
25°C/60% in Aclar blisters, with the level projected to be less than the acceptance limits of des-ethyl examplain at the end of shelf life of 2%.
1267 1268 1269 1270 1271 1272 1273 1274 1275 1276 1277 1278 1279 1280 1281 1282 1283 1284 1285 1286 1287 1288 1289 1290 1291 1292 1293 1294
1295
The process understanding described above for the fluid bed drying operation shows that control of the trajectory of the drying process within defined limits (as determined by on-line NIR spectroscopy), coupled with a final water level in the granule of 1.5-2.0%, ensures that the level of the degradation product in the tablets at time of release will be significantly below the acceptance criterion (1.0%) and that no significant amount of degradation will occur during the shelf life of the product when it is packed in Aclar blisters. 3.2.P.2.3.1.4 Granulation / lubrication No detail is included for this operation in the mock submission. 3.2.P.2.3.1.5 Compression In-process limits for tablet parameters of weight, thickness and hardness are used to ensure consistency during the compression process and to ensure that tablets of good quality are produced. For examplain 20 mg tablet, control of tablet weight assures drug content, while control of hardness assures that tablets are hard enough to withstand the packing operation but not too hard to affect disintegration and dissolution of the drug substance. Development studies showed that there is a small reduction in dissolution rate and an increase in disintegration when high compression force conditions are used, data are shown in Figure 36 and Figure 37, however for both cases values are always within acceptance criteria for the ranges of compression force studied.
Version 3 24 Jan 06 Page 51 of 69
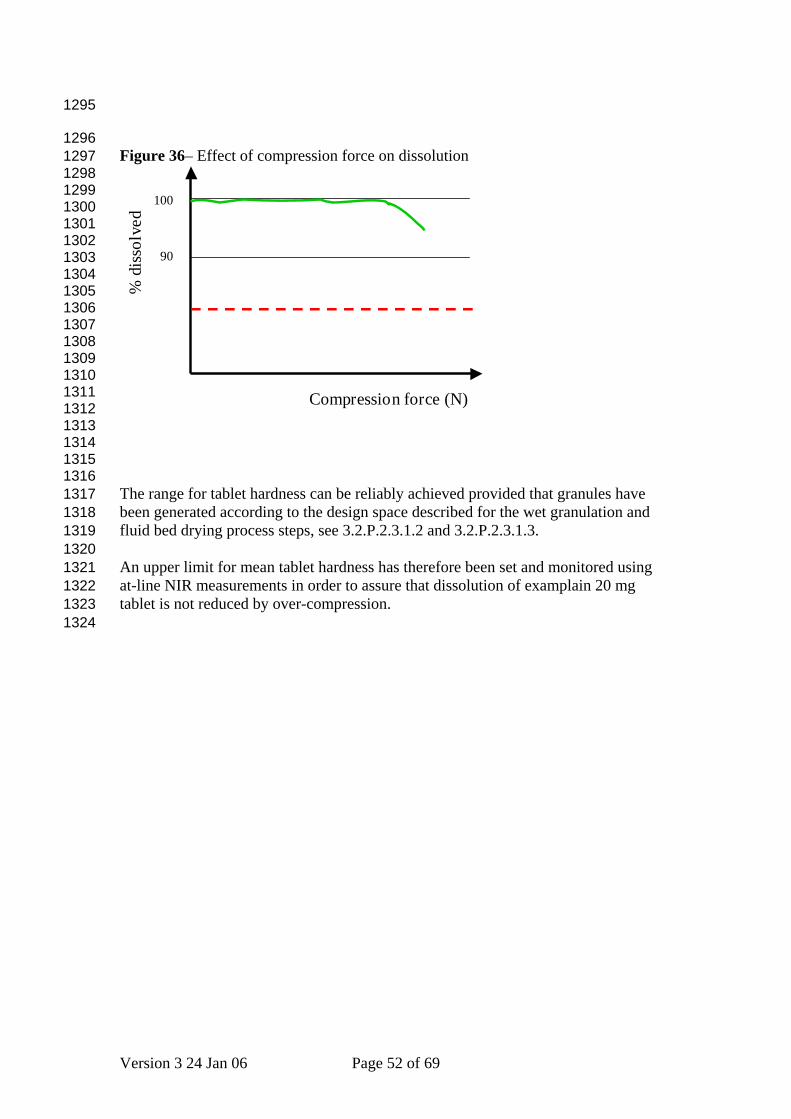
1295
1296 1297 1298 1299 1300 1301 1302 1303 1304 1305 1306 1307 1308 1309 1310 1311 1312 1313 1314 1315 1316 1317 1318 1319 1320 1321 1322 1323 1324
Figure 36– Effect of compression force on dissolution
90
100
lv
sso
di
%ed
Compression force (N)
The range for tablet hardness can be reliably achieved provided that granules have been generated according to the design space described for the wet granulation and fluid bed drying process steps, see 3.2.P.2.3.1.2 and 3.2.P.2.3.1.3. An upper limit for mean tablet hardness has therefore been set and monitored using at-line NIR measurements in order to assure that dissolution of examplain 20 mg tablet is not reduced by over-compression.
Version 3 24 Jan 06 Page 52 of 69
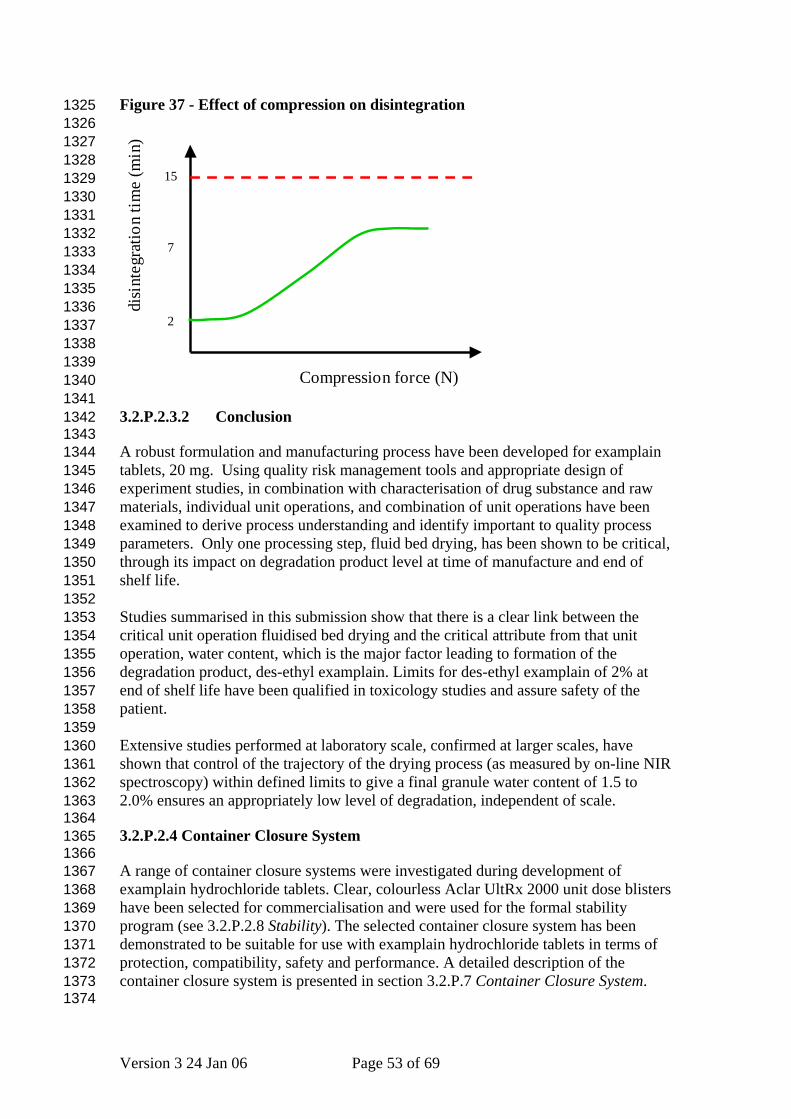
Figure 37 - Effect of compression on disintegration 1325 1326 1327 1328 1329 1330 1331 1332 1333 1334 1335 1336 1337 1338 1339 1340 1341 1342 1343 1344 1345 1346 1347 1348 1349 1350 1351 1352 1353 1354 1355 1356 1357 1358 1359 1360 1361 1362 1363 1364 1365 1366 1367 1368 1369 1370 1371 1372 1373 1374
3.2.P.2.3.2 Conclusion A robust formulation and manufacturing process have been developed for examplain tablets, 20 mg. Using quality risk management tools and appropriate design of experiment studies, in combination with characterisation of drug substance and raw materials, individual unit operations, and combination of unit operations have been examined to derive process understanding and identify important to quality process parameters. Only one processing step, fluid bed drying, has been shown to be critical, through its impact on degradation product level at time of manufacture and end of shelf life. Studies summarised in this submission show that there is a clear link between the critical unit operation fluidised bed drying and the critical attribute from that unit operation, water content, which is the major factor leading to formation of the degradation product, des-ethyl examplain. Limits for des-ethyl examplain of 2% at end of shelf life have been qualified in toxicology studies and assure safety of the patient. Extensive studies performed at laboratory scale, confirmed at larger scales, have shown that control of the trajectory of the drying process (as measured by on-line NIR spectroscopy) within defined limits to give a final granule water content of 1.5 to 2.0% ensures an appropriately low level of degradation, independent of scale. 3.2.P.2.4 Container Closure System A range of container closure systems were investigated during development of examplain hydrochloride tablets. Clear, colourless Aclar UltRx 2000 unit dose blisters have been selected for commercialisation and were used for the formal stability program (see 3.2.P.2.8 Stability). The selected container closure system has been demonstrated to be suitable for use with examplain hydrochloride tablets in terms of protection, compatibility, safety and performance. A detailed description of the container closure system is presented in section 3.2.P.7 Container Closure System.
7
15
disi
nteg
ratio
n tim
e (m
in)
2
Compression force (N)
Version 3 24 Jan 06 Page 53 of 69

Protection 1375 1376 1377 1378 1379 1380 1381 1382 1383 1384 1385 1386 1387 1388 1389 1390 1391 1392 1393 1394 1395 1396 1397 1398 1399 1400 1401 1402 1403 1404 1405 1406 1407 1408 1409 1410 1411 1412 1413 1414 1415 1416 1417 1418 1419 1420 1421 1422 1423 1424 1425
Examplain hydrochloride is known to be sensitive to hydrolysis under extremes of temperature and humidity. Aclar UltRx 2000 unit dose blisters with aluminium foil backing have been demonstrated to provide effective protection of the tablets, leading to <0.1% degradation after 6 months at 40ºC/75% RH (see 3.2.P.8 Stability). Examplain hydrochloride tablets are not photosensitive, so there is no need for opaque or tinted blister materials. Compatibility The blister materials meet Pharmacopoeial requirements. Studies reported in 3.2.P.8.1 Stability Summary and Conclusion I indicate that the proposed commercial pack is compatible with examplain hydrochloride. Safety There are no safety issues with the proposed commercial packaging materials. All of the packaging components used are listed as “Generally Recognised as Safe” (GRAS) or “suitable for direct and indirect contact with food”, as per 21 CFR 174-186. More detail of the composition of each component is given in Section 3.2.P.7 Container Closure System. Performance The container closure system for examplain hydrochloride tablets is designed to provide adequate protection for the drug product until use. The stability studies described in 3.2.P.8 Stability support the use of the container closure system. Design space for packaging materials Based on the extended understanding of the degradation of the product and the dominating influence of residual water to long term stability as well as the conclusions of the ICH Q1A stability program, it can be concluded that the design space for packaging material for Examplain hydrochloride tablets is given by the permeability of the packaging material. All packaging material that has an equal or better permeability than Aclar UltRx 2000 will lead to a stable product throughout the shelf life in moderate climates (zone II). This is also supported by the outcome of additional stability studies in less protective packaging material and in very tight containers for climatic zones III and IV, hot and humid climates. In these studies the influence on degradation in tight containers (full aluminium blister and high density polyethylene bottles) were studied. These studies have shown, as expected from the understanding of the degradation, that also under hot and humid storage conditions the product is stable if protected from uptake of additional humidity. 3.2.P.2.5 Microbiological Attributes The microbiological requirements for the starting materials are monitored based on the specifications in their approval procedure. The water used for the granulation step has the defined quality of “purified water”..
Version 3 24 Jan 06 Page 54 of 69

3.2.P.2.6 Compatibility 1426 1427 1428
This section is not applicable for solid dosage forms.
Version 3 24 Jan 06 Page 55 of 69

1429 3.3 Control Strategy as result of the quality risk management 1430
1431 1432 1433 1434 1435 1436 1437 1438 1439 1440 1441 1442 1443 1444 1445 1446 1447 1448 1449 1450 1451 1452 1453 1454 1455 1456 1457
The control strategy is based on a Quality Risk Management Process and will ensure that the product meets its specifications without recourse to further testing. The finished product specification is given in P4. Critical to Quality Attributes (CQA) Our present formulation and process understanding has shown that the only critical to quality attribute is the level of degradation product, des-ethyl examplain. Des-ethyl examplain is also the main metabolite in animals as well as in humans and is qualified at the level of 10%. It is considered that des-ethyl examplain is not of any safety risk to patients up to the level qualified. Quality Risk Management Using the initial quality risk management (see Table 2) development activities as described above have generated an enhanced level of formulation and process understanding of possible critical unit operations. This high level understanding was used to define critical and non-critical process parameters and unit operations. The Quality Risk Management analysis using FMEA analysed all possible failures, their impact, probabilities and the detectability. The full FMEA is available for inspection. A summary is described in Table 6.
Version 3 24 Jan 06 Page 56 of 69

1457 1458 1459 1460
Table 6: Classification of unit operation to have an impact on quality
Unit operations / Quality attributes
Dispensing (Raw Material
Properties) Granulation Drying
Blending (Magnesium
Stearate) Tableting Packaging
Dissolution Particle size API Power
consumption Prior knowledge Not critical to
quality Not critical to quality
Prior knowledge
Disintegration Particle size API water amount
and feed rate Prior knowledge Not critical to
quality Not critical to quality
Prior knowledge
Hardness Prior knowledge Prior knowledge Prior knowledge Not critical to
quality Not critical to quality
Prior knowledge
Assay Prior knowledge Prior knowledge Prior knowledge Prior knowledge NIR
measurement Prior knowledge
Content uniformity Prior knowledge Power
consumption Not critical to quality
Not critical to quality
NIR measurement
Prior knowledge
Degradation Prior knowledge Water amount
and feed rate Not critical to quality
Prior knowledge Prior knowledge Prior knowledge
Stability Prior knowledge Prior knowledge Control water
content Prior knowledge Prior knowledge Prior knowledge
Appearance Prior knowledge Prior knowledge Not critical to
quality Prior knowledge Not critical to
quality Prior knowledge
Identification NIR of raw material
Prior knowledge Prior knowledge Prior knowledge Prior knowledge Prior knowledge
Water Prior knowledge Prior knowledge Control water
content Prior knowledge Prior knowledge Prior knowledge
Microbiology Specification of starting material
Purified water used
Prior knowledge Prior knowledge Prior knowledge Prior knowledge
Influence: low Prior knowledge Original high Controlled by a) process understanding or b) included in the control
strategy Process understanding Original high influence:
Development studies have shown to be not critical to quality Control Strategy Original high influence:
Development studies have shown to have potential influence to quality. Therefore control measurements have been introduced.
1461 1462 1463 1464 1465 1466 1467 1468 1469 1470 1471 1472 1473 1474 1475 1476 1477 1478 1479 1480
Based on the Quality Risk Management the optimal control strategy was defined so that all possible failures were reduced to an acceptable level. Therefore process controls including end point controls were established based on direct and timely measurements of relevant material attributes and relevant process parameters (Table 6) Proposed Controls The control strategy proposed ensures that the process can manage the natural variability of raw materials to give a consistent product. The process is therefore adjusted to give target quality endpoints of material attributes that are relevant for the next processing steps. Dispensing The NIR spectra of all raw materials (drug substance and excipients) are recorded and checked for identity. The NIR spectra are also used to detect differences in physicochemical properties by correlating the NIR spectra in a multivariant way with
Version 3 24 Jan 06 Page 57 of 69
end product quality characteristics. Normal GMP double-checking of weighing and transfers assures correct weights of materials are added.
1481 1482 1483 1484 1485 1486 1487 1488 1489 1490 1491 1492 1493 1494
Granulation The granulation process is controlled by measuring the power consumption during granulation. The water amount per mass of granulate and the addition rate are fixed based on our process understanding and DOE as described above. Wet massing is finished after a preset time interval (approx. 6 min.) following the peak of power consumption. This compensates for differences in the raw materials properties e.g. batch-to-batch differences of water content and particle size distributions and allows a process to operate independent from raw material properties, leading to a consistent quality of granules.
Version 3 24 Jan 06 Page 58 of 69

1494 1495 1496 1497 1498 1499 1500 1501 1502 1503 1504 1505 1506 1507 1508 1509
Drying The progress and end point of drying are monitored by on-line NIR and on-line laser particle size measurements. The critical material attribute, water content of the granulate is controlled by adjusting air flow and inlet air temperature to stay within the defined design space. The particle size distribution is monitored by laser diffraction on-line measurements to ensure that the fraction of fine particles is not too high and may impact processability of the granulate for tabletting. The end point of the drying is defined when the water content measured by on-line NIR reaches the range 1.5% to 2.0% (target of 1.75%) (see Figure 38). By this end point control proposed for drying, the granulate has the defined critical material attribute that is necessary for the following unit operations and ensures a final quality of the product that is stable over the full proposed shelf life.
Version 3 24 Jan 06 Page 59 of 69

1509 1510 1511
1512 1513 1514 1515 1516 1517 1518 1519 1520 1521 1522 1523 1524 1525 1526 1527 1528 1529 1530 1531 1532 1533 1534 1535 1536 1537 1538 1539 1540 1541 1542
Figure 38 : End point control of Drying
15 Min.
Endpoint
%H2O
2.0%1.5%
18.5%
Drying time
17.5%
Trajectories describing the paceboundaries of the design s
manufacturing batches
%H2O
2.0%1.5%
18.5%
Drying time
17.5%
Trajectories describing the paceboundaries of the design s
Blending The end point of the blending is determined by on-line NIR. This ensures that magnesium stearate is evenly distributed, and that content of active remains uniform. Tableting The compression machine is equipped with a modern compression force feedback control that adjusts the granulate feed to ensure target tablet weight and consequently content uniformity. An automated weight control and at-line NIR measurement system allows feedback to the feed control and compression force system of the compression machine. The compression control system with 100% control of all tablets eliminates any risk of not acceptable compression forces during tabletting. At-line NIR confirms content uniformity and can detect any unexpected segregation of the blend during compression. The NIR also allows the monitoring of water content of the final tablets. A multivariant model for hardness, disintegration and dissolution allows prediction of hardness, disintegration and dissolution. In summary the following process controls will ensure robust and consistent processes leading to consistent end product quality (see Figure 39)
- NIR for raw materials on receipt or when dispensing - power consumption for granulation end point - on-line NIR and laser diffraction of the drying process - on-line NIR for blend uniformity - compression force control and at-line NIR during compression for content
uniformity, prediction of hardness, disintegration and dissolution
Version 3 24 Jan 06 Page 60 of 69
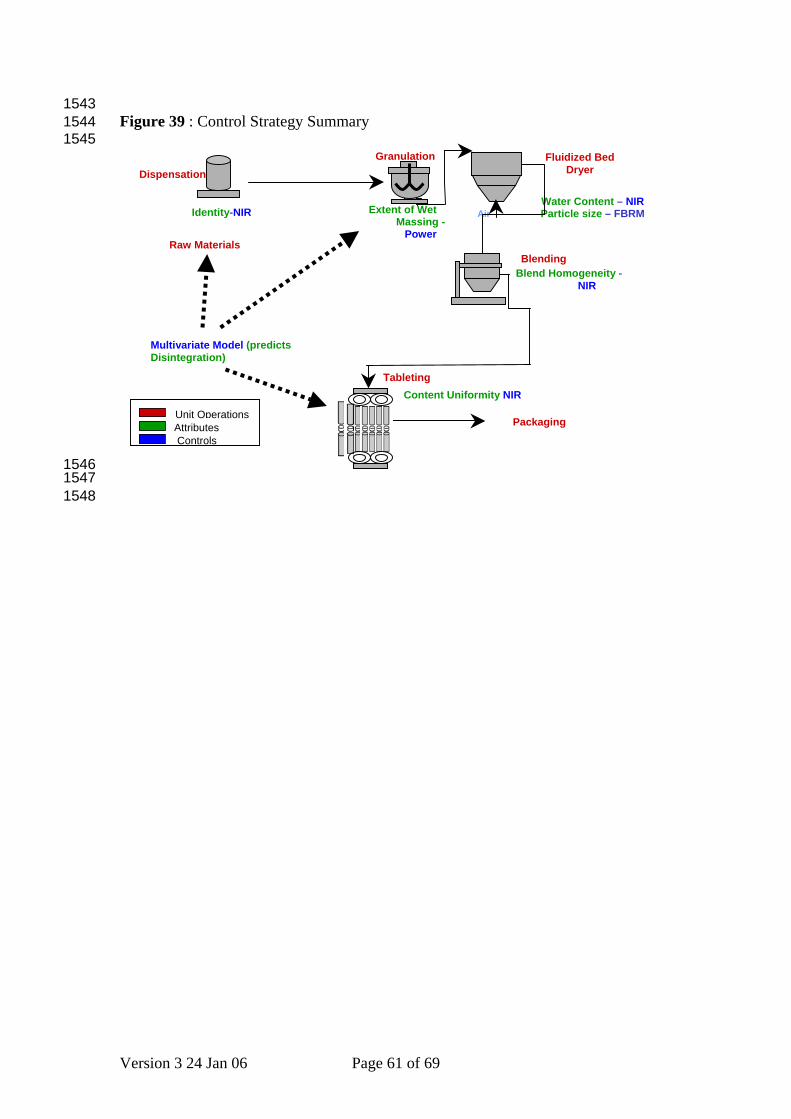
1543 1544 1545
1546 1547 1548
Figure 39 : Control Strategy Summary
Unit Operations Attributes Controls
Content Uniformity NIR
Water Content – NIR Particle size – FBRM
Dispensation
Blending
Fluidized Bed Dryer
Packaging
Tableting
Identity-NIR
Blend Homogeneity -NIR
Granulation
Extent of Wet Massing -
Power
Air
Multivariate Model (predicts Disintegration)
Raw Materials
Version 3 24 Jan 06 Page 61 of 69

3.3.1 Impact of the control strategy to end product quality specification 1548 1549 1550 1551 1552 1553 1554 1555 1556 1557 1558 1559 1560 1561 1562 1563 1564 1565 1566 1567 1568 1569 1570 1571 1572 1573 1574 1575 1576 1577 1578 1579 1580 1581 1582 1583 1584 1585 1586 1587 1588 1589 1590 1591 1592 1593 1594 1595 1596 1597 1598
Dissolution – Disintegration The mechanistic understanding of the disintegration and dissolution of Examplain tablets together with the established multivariant prediction of disintegration and dissolution allows an excellent understanding of factors influencing disintegration and dissolution. The conclusion of this understanding is that no process or product formulation parameter within the established design space can be considered as critical for these quality attributes. The properties of the drug substance, and design of formulation and process meet the requirements given in ICH Q6A (Decision Tree # 7(1)) for replacement of dissolution with disintegration. In conclusion, the product can be considered to be insensitive to the variability of the raw materials and of the processing parameters investigated during development and scale-up with respect to disintegration and dissolution and we propose to not perform dissolution and disintegration on finalised product. Dissolution will not be included in the drug product specification. Hardness For this product hardness is mainly influenced by wet granulation and by the compression force during compression. Control of all unit operations ensures that the processing properties of the granulate are reproducible. This ensures that together with the compression force feedback control during compression, the variability of hardness is low and predictable. DOE has demonstrated that disintegration and dissolution are not significantly influenced by hardness. The NIR measurements at line to compression also allow an excellent prediction of hardness based on the correlation of NIR predictions of hardness with conventional hardness measurements. Hardness is not a critical quality attribute for Examplain hydrochloride tablets and will not be included in the drug product specification. Assay and Unit Dose Uniformity Mechanistic understanding of the relevant unit operations and the impact on variations on content uniformity and assay together with the extensive process controls and monitoring that allow the adjustment of all unit operations to defined material attribute end points lead to reproducible results of assay and content uniformity. Control of the fluid bed drying step, to operate within defined drying trajectories and to avoid over-drying, ensures that excessive amounts of fines are not produced. As a consequence, the dried, lubricated granule flows well, ensuring that there are no weight uniformity issues during compression. The at-line monitoring of content uniformity by NIR and the weight measurements ensures that all deviations from expected performance will be detected and corrective adjustments of feed and the compression force can be made, obviating the need for end point testing. The results from the at-line NIR measurements will be used for the release decision on content uniformity and the mean of the NIR value will be the assay for release. Degradation Process and formulation understanding showed that the formation of des-ethyl Examplain at time of manufacture is influenced by water addition rate during
Version 3 24 Jan 06 Page 62 of 69

granulation, by the trajectory of the fluid bed drying process, and the water content in resultant tablets. During processing, temperature and water content of the granulate are controlled and ensure that hydrolysis is minimized. Experience and process understanding show that the drying process influences the level of degradation during manufacturing. The controlled drying process leads to product that has consistently reproducible low levels of degradation and water content. All other processing steps when operated within relevant design spaces have been shown not to influence the level of water content and degradation in the end product, therefore neither moisture content nor degradation product levels will be tested in finished product.
1599 1600 1601 1602 1603 1604 1605 1606 1607 1608 1609 1610 1611 1612 1613 1614 1615 1616 1617 1618 1619 1620 1621 1622 1623 1624 1625 1626 1627 1628 1629 1630 1631 1632 1633 1634 1635 1636 1637 1638 1639 1640 1641 1642 1643 1644 1645 1646 1647 1648
Stability Extensive supportive stability studies and the ICH Q1A stability studies have shown that the stability of the product is predominantly influenced by the water content that leads to hydrolysis. Except at stress temperatures, no degradation products other than the formation of des-ethyl Examplain are found at relevant levels. The uptake of humidity during storage is minimized by adequate protective (moisture tight) proposed packaging material. As a consequence of this understanding the control of the water content at the time of manufacture of bulk product was considered as critical. The proposed controls of the only critical process step, the drying of the granulate, has shown to effectively guarantee that water content is less than 2% w/w at the end of manufacturing. The monitoring of water content by NIR during compression provides assurance that any deviation from the established product characteristics will be detected. Based on development data which demonstrates the high level of understanding of the stability of the product and the high level of reproducibility of manufacturing of the product due to extensive real time control of the manufacturing process a reduced annual stability monitoring is proposed. It has been shown that the rate of production of des-ethyl examplain is related to moisture content of tablets at time of manufacture and the uptake during storage. Based on this underpinning science of water uptake and degradation rates, the selection of the packaging material, the control of storage of bulk product before packing, design of package, long term data on pilot batches, supported by long term testing of the first 3 production batches, it is proposed to conduct confirmatory stability testing after changes of equipment, scale or site, or other changes as assessed by a quality risk management exercise by comparing accelerated testing of changes of samples stored in Aclar blisters at 40°C/75%R.H. for up to 3 months. The degradation level and disintegration will be tested only and degradation levels compared with rates produced from development studies, described in Sections 3.2 P.2.2.1 (Figure 10) and Section 3.2 P.2.3.1.3.7, and initial accelerated studies as part of ICH pilot and full scale stability programmes. 3.3.2 Conclusions: Proposal for real time release Based on the high level of formulation and process understanding, the extensive Quality Risk Management and the sophisticated control strategy including advanced on-line and real time measurements of relevant material attributes the consistent acceptable quality of the end product is guaranteed. No additional batch wise end product testing is needed.
Version 3 24 Jan 06 Page 63 of 69

1649 1650 1651 1652 1653 1654 1655 1656 1657 1658
3.3.3 Monitoring program A monitoring program is proposed for adjusting the multivariant model to manufacturing experience. In regular intervals (at least quarterly) conventional end product tests will be performed and the prediction models will be verified and if needed recalibrated.
Version 3 24 Jan 06 Page 64 of 69

3.4 SCIENCE- AND RISK-BASED REGULATORY APPROACH 1658
1659 1660 1661 1662 1663 1664 1665 1666 1667 1668 1669 1670 1671 1672 1673 1674 1675 1676 1677 1678 1679 1680 1681 1682 1683 1684 1685 1686 1687 1688 1689 1690 1691 1692 1693 1694 1695 1696 1697 1698 1699 1700 1701 1702 1703 1704 1705 1706 1707
Development of a formulation and process which is understood and characterised has produced using quality risk management approaches a series of design spaces for unit operations (exemplified by granulation and fluid-bed drying unit operations). Based on the knowledge and understanding we propose the following regulatory flexibility: Continuous Improvement Changes to the manufacturing process within the established design space will not be submitted, if required, for regulatory prior approval. Scale Knowledge from development studies leading to mechanistic process understanding, and using quality risk management, has resulted in design spaces for fluid bed drying and wet granulation. These design spaces have been demonstrated to be transferable to and reproduced for different process equipment, representing different processing scales. Provided that the process continues to operate within these design spaces, it is proposed that changes of scale will be made immediately without notifying authorities. Site Mechanistic process understanding, control of the process to critical quality attribute end points , and the use of quality risk management have resulted in a design space that transferable between different process equipment and therefore allows transfer of the process from one site to the other. It is therefore proposed that, providing the process continues to operate within this design space, a transfer from one site to other sites is made immediately with authorities being notified of change of address. The site change will use the presented procedure and means for reproducing design space at other sites with equivalent equipment, equivalent sources of raw materials, inspected GMP status of the site and with equivalent quality systems. For the first 3 batches full end product testing will be performed to confirm the validity of the process model and the first batch will be put into the confirmatory stability program and monitored according to the proposed confirmatory stability study protocol. Process Validation Assurance is given that each process step (granulation and fluid-bed drying are examples) is routinely and reproducibly producing material for the next processing step ensuring compliance with the finished product specification. This assurance is given by good process understanding and control, which includes process verification, compliance with the design space and application of the control strategy, which includes key attributes for a processing step. Therefore the 3 batch validation is replaced by a continuous process verification.
Version 3 24 Jan 06 Page 65 of 69

Real Time Release 1708 1709 1710 1711 1712 1713 1714 1715 1716 1717 1718 1719 1720 1721 1722 1723 1724 1725 1726 1727 1728 1729 1730 1731 1732 1733 1734 1735 1736 1737 1738 1739 1740 1741 1742 1743 1744 1745 1746 1747
Based on application of the control strategy it is not proposed that any additional end product tests will be applied for release.
Reduction in Confirmatory Stability Studies Based on development data which demonstrates the high level of understanding of the stability of the product and the high level of reproducibility of manufacturing of the product due to extensive real time control of the manufacturing process a reduced annual stability monitoring is proposed. It has been shown that the rate of production of des-ethyl examplain is related to moisture content of tablets at time of manufacture and the uptake during storage. Based on this underpinning science of water uptake and degradation rates, the selection of the packaging material, the control of storage of bulk product before packing, design of package, long term data on pilot batches, supported by long term testing of the first 3 production batches, it is proposed to conduct confirmatory stability testing after changes of equipment, scale or site, as assessed by a quality risk management exercise by comparing accelerated testing of changes of samples stored in Aclar blisters at 40°C/75%R.H. for up to 3 months. The degradation level and disintegration will be tested only and degradation levels compared with rates produced from development studies, described in Sections 3.2 P.2.2.1 (Figure 10) and Section 3.2 P.2.3.1.3.7, and initial accelerated studies as part of ICH pilot and full scale stability programmes Drug Substance Manufacturing Changes (only limited data given in this mock document) Studies on drug substance leading to development of appropriate drug substance specification with limits for degradation product and particle size indicate that changes in drug substance manufacture will not impact on drug product stability, hence it is proposed not to perform stability studies on drug product following changes in drug substance manufacturing providing that drug substance complies with specification. Information will be available at the appropriate site for inspection if required.
Version 3 24 Jan 06 Page 66 of 69

3.5 CLINICAL TRIAL FORMULAE 1747
1748 1749 1750 1751 1752
1753 1754 1755
All clinical investigations conducted in connection with acute anxiety following regulatory submission used either an intravenous solution or immediate release tablets. The 1 mg, 10 mg and 20 mg tablets were initially developed for clinical trials. The qualitative tablet formulation has remained the same throughout the clinical program. A single 20mg strength is proposed for commercialisation.
Qualitative and quantitative formulae are described in this section for the proposed commercial tablet formulation, registration stability studies, and tablet and intravenous solution formulations used in clinical studies.
Version 3 24 Jan 06 Page 67 of 69
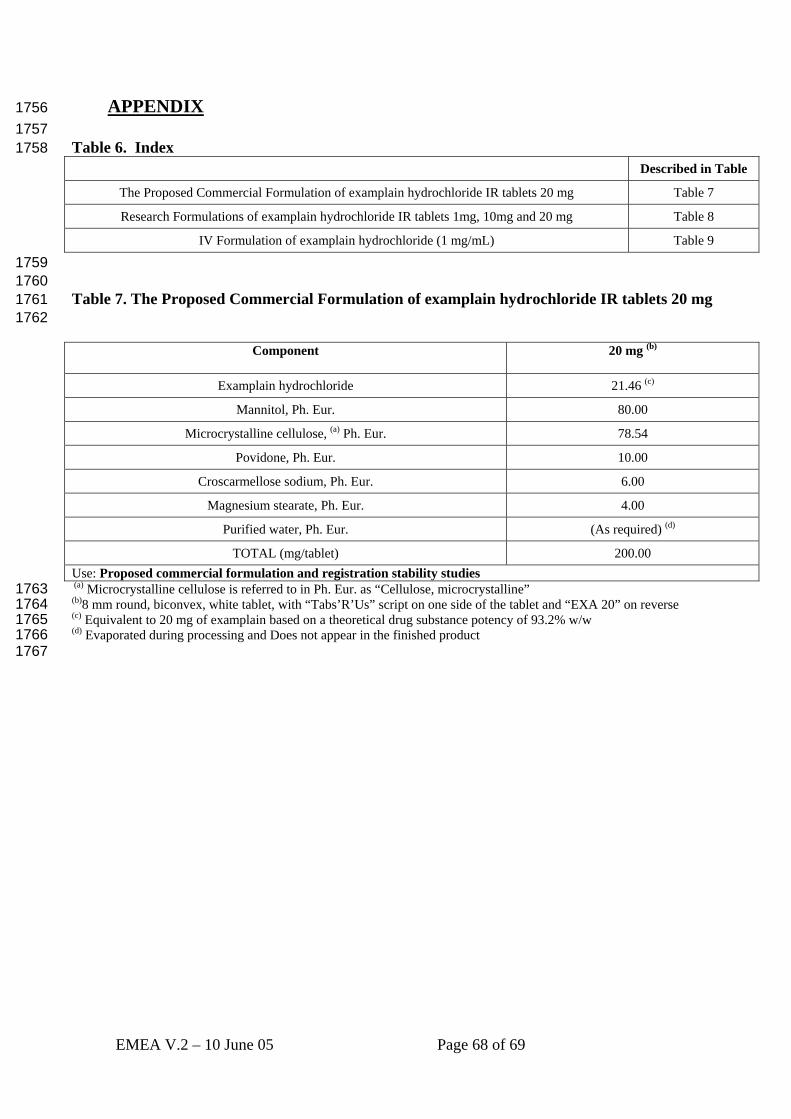
APPENDIX 1756 1757 1758
Table 6. Index
Described in Table
The Proposed Commercial Formulation of examplain hydrochloride IR tablets 20 mg Table 7
Research Formulations of examplain hydrochloride IR tablets 1mg, 10mg and 20 mg Table 8
IV Formulation of examplain hydrochloride (1 mg/mL) Table 9 1759
1760 1761 1762
Table 7. The Proposed Commercial Formulation of examplain hydrochloride IR tablets 20 mg
Component
20 mg (b)
Examplain hydrochloride 21.46 (c)
Mannitol, Ph. Eur. 80.00
Microcrystalline cellulose, (a) Ph. Eur. 78.54
Povidone, Ph. Eur. 10.00
Croscarmellose sodium, Ph. Eur. 6.00
Magnesium stearate, Ph. Eur. 4.00
Purified water, Ph. Eur. (As required) (d)
TOTAL (mg/tablet) 200.00 Use: Proposed commercial formulation and registration stability studies
1763 1764 1765 1766 1767
(a) Microcrystalline cellulose is referred to in Ph. Eur. as “Cellulose, microcrystalline” (b)8 mm round, biconvex, white tablet, with “Tabs’R’Us” script on one side of the tablet and “EXA 20” on reverse (c) Equivalent to 20 mg of examplain based on a theoretical drug substance potency of 93.2% w/w (d) Evaporated during processing and Does not appear in the finished product
EMEA V.2 – 10 June 05 Page 68 of 69

Table 8. Research Formulations of examplain hydrochloride IR tablets 1mg, 10mg and 20 mg 1768 1769
Component
1 mg (b)
10 mg (b)
20 mg (b)
Examplain hydrochloride 1.07 (c) 10.73 (c) 21.46 (c)
Mannitol, Ph. Eur. 80.00 80.00 80.00
Microcrystalline cellulose, (a) Ph. Eur. 98.93 89.27 78.54
Povidone, Ph. Eur. 10.00 10.00 10.00
Croscarmellose sodium, Ph. Eur. 6.00 6.00 6.00
Magnesium stearate, Ph. Eur. 4.00 4.00 4.00
Purified water, Ph. Eur. (As required) (d) (As required) (d) (As required) (d)
TOTAL (mg/tablet) 200.00 200.00 200.00 Use: Phase 1, Phase 2 and Phase 3 clinical studies
1770 1771 1772 1773 1774 1775 1776
(a) Microcrystalline cellulose is referred to in Ph. Eur. as “Cellulose, microcrystalline” (b) 8 mm round, biconvex, white tablet, with “Tabs’R’Us” script on one side of the tablet and “EXA 123” on reverse. (c) Based on a theoretical drug substance potency of 93.2% w/w (d) Evaporated during processing and Does not appear in the finished product Table 9. Intravenous Formulation of examplain hydrochloride (1 mg/mL)
Component
1 mg/mL (S01187EA)
Examplain hydrochloride 1.073 (a)
Glucose anhydrous Ph. Eur. 50.500 (b)
Water for Injection Ph. Eur. to 1.000 mL 1777 1778 1779 1780 1781
Notes on Injection: (a) Equivalent to 1 mg of examplain based on a theoretical potency of 93.2% w/w (b) As D-glucose anhydrous
EMEA V.2 – 10 June 05 Page 69 of 69