mobility/orthopedic procedures 2011 to 2012
TRANSCRIPT


Contact Information:
Healthcare Cost and Utilization Project (HCUP) Agency for Healthcare Research and Quality
540 Gaither Road Rockville, MD 20850
http://www.hcup-us.ahrq.gov
For Technical Assistance with HCUP Products:
Email: [email protected]
or
Phone: 1-866-290-HCUP
Recommended Citation: Steiner C, Andrews R, Barrett M, Weiss A. HCUP Projections: Mobility/Orthopedic Procedures 2003 to 2012. 2012. HCUP Projections Report # 2012-03. ONLINE September 20, 2012. U.S. Agency for Healthcare Research and Quality. Available: http://www.hcup-us.ahrq.gov/reports/projections/2012-03.pdf.

HCUP Projections:
Mobility/Orthopedic Procedures
HCUP (09/07/12) HCUP Orthopedic Projections
Table of Contents Introduction ................................................................................................................................ 1
Summary ................................................................................................................................... 3
Primary Hip Replacement for Any Reason ................................................................................. 4
Number of Discharges for All Adults ....................................................................................... 5
Number of Discharges by Age Group ..................................................................................... 6
Number of Discharges by Gender .......................................................................................... 7
Number of Discharges by Income (Lowest Compared to Highest Quartile) ............................ 8
Average Total Hospital Cost for All Adults .............................................................................. 9
Average Total Hospital Cost by Age Group ...........................................................................10
Average Total Hospital Cost by Gender ................................................................................11
Average Total Hospital Cost by Income (Lowest Compared to Highest Quartile) ..................12
Average Length of Stay for All Adults ....................................................................................13
Average Length of Stay by Age Group ..................................................................................14
Average Length of Stay by Gender .......................................................................................15
Average Length of Stay by Income (Lowest Compared to Highest Quartile) .........................16
Primary Hip Replacement for Osteoarthritis ..............................................................................18
Number of Discharges for All Adults ......................................................................................19
Number of Discharges by Age Group ....................................................................................20
Number of Discharges by Gender .........................................................................................21
Number of Discharges by Income (Lowest Compared to Highest Quartile) ...........................22
Average Total Hospital Cost for All Adults .............................................................................23
Average Total Hospital Cost by Age Group ...........................................................................24
Average Total Hospital Cost by Gender ................................................................................25
Average Total Hospital Cost by Income (Lowest Compared to Highest Quartile) ..................26
Average Length of Stay for All Adults ....................................................................................27
Average Length of Stay by Age Group ..................................................................................28
Average Length of Stay by Gender .......................................................................................29
Average Length of Stay by Income (Lowest Compared to Highest Quartile) .........................30
Primary Hip Replacement for Hip Fracture ................................................................................32
Number of Discharges for All Adults ......................................................................................33
Number of Discharges by Age Group ....................................................................................34
Number of Discharges by Gender .........................................................................................35

HCUP Projections:
Mobility/Orthopedic Procedures
HCUP (09/07/12) HCUP Orthopedic Projections
Number of Discharges by Income (Lowest Compared to Highest Quartile) ...........................36
Average Total Hospital Cost for All Adults .............................................................................37
Average Total Hospital Cost by Age Group ...........................................................................38
Average Total Hospital Cost by Gender ................................................................................39
Average Total Hospital Cost by Income (Lowest Compared to Highest Quartile) ..................40
Average Length of Stay for All Adults ....................................................................................41
Average Length of Stay by Age Group ..................................................................................42
Average Length of Stay by Gender .......................................................................................43
Average Length of Stay by Income (Lowest Compared to Highest Quartile) .........................44
Hip Replacement Revision Surgery ...........................................................................................46
Number of Discharges for All Adults ......................................................................................47
Number of Discharges by Age Group ....................................................................................48
Number of Discharges by Gender .........................................................................................49
Number of Discharges by Income (Lowest Compared to Highest Quartile) ...........................50
Average Total Hospital Cost for All Adults .............................................................................51
Average Total Hospital Cost by Age Group ...........................................................................52
Average Total Hospital Cost by Gender ................................................................................53
Average Total Hospital Cost by Income (Lowest Compared to Highest Quartile) ..................54
Average Length of Stay for All Adults ....................................................................................55
Average Length of Stay by Age Group ..................................................................................56
Average Length of Stay by Gender .......................................................................................57
Average Length of Stay by Income (Lowest Compared to Highest Quartile) .........................58
Primary Knee Arthroplasty for Osteoarthritis .............................................................................60
Number of Discharges for All Adults ......................................................................................61
Number of Discharges by Age Group ....................................................................................62
Number of Discharges by Gender .........................................................................................63
Number of Discharges by Income (Lowest Compared to Highest Quartile) ...........................64
Average Total Hospital Cost for All Adults .............................................................................65
Average Total Hospital Cost by Age Group ...........................................................................66
Average Total Hospital Cost by Gender ................................................................................67
Average Total Hospital Cost by Income (Lowest Compared to Highest Quartile) ..................68
Average Length of Stay for All Adults ....................................................................................69
Average Length of Stay by Age Group ..................................................................................70
Average Length of Stay by Gender .......................................................................................71
Average Length of Stay by Income (Lowest Compared to Highest Quartile) .........................72

HCUP Projections:
Mobility/Orthopedic Procedures
HCUP (09/07/12) HCUP Orthopedic Projections
Knee Replacement Revision Surgery ........................................................................................74
Number of Discharges for All Adults ......................................................................................75
Number of Discharges by Age Group ....................................................................................76
Number of Discharges by Gender .........................................................................................77
Number of Discharges by Income (Lowest Compared to Highest Quartile) ...........................78
Average Total Hospital Cost for All Adults .............................................................................79
Average Total Hospital Cost by Age Group ...........................................................................80
Average Total Hospital Cost by Gender ................................................................................81
Average Total Hospital Cost by Income (Lowest Compared to Highest Quartile) ..................82
Average Length of Stay for All Adults ....................................................................................83
Average Length of Stay by Age Group ..................................................................................84
Average Length of Stay by Gender .......................................................................................85
Average Length of Stay by Income (Lowest Compared to Highest Quartile) .........................86
Spinal Fusion for Back Problems ..............................................................................................88
Number of Discharges for All Adults ......................................................................................89
Number of Discharges by Age Group ....................................................................................90
Number of Discharges by Gender .........................................................................................91
Number of Discharges by Income (Lowest Compared to Highest Quartile) ...........................92
Average Total Hospital Cost for All Adults .............................................................................93
Average Total Hospital Cost by Age Group ...........................................................................94
Average Total Hospital Cost by Gender ................................................................................95
Average Total Hospital Cost by Income (Lowest Compared to Highest Quartile) ..................96
Average Length of Stay for All Adults ....................................................................................97
Average Length of Stay by Age Group ..................................................................................98
Average Length of Stay by Gender .......................................................................................99
Average Length of Stay by Income (Lowest Compared to Highest Quartile) ....................... 100
Appendix I: HCUP Data Partners ............................................................................................ 102
Appendix II: Definitions for Mobility/Orthopedic Procedures .................................................... 103
Appendix III: Methods ............................................................................................................. 107

HCUP Projections:
Mobility/Orthopedic Procedures
HCUP (09/07/12) HCUP Orthopedic Projections
Return to Contents
This page intentionally left blank.

HCUP Projections:
Mobility/Orthopedic Procedures
HCUP (09/07/12) 1 HCUP Orthopedic Projections
Return to Contents
Introduction Musculoskeletal conditions affect muscles, joints, tendons, ligaments, and nerves and are the leading cause of chronic disability in adults worldwide.1 According to the 2008 National Health Interview Survey (NHIS), 110 million U.S. adults (approximately one out of every two people) report having a musculoskeletal condition.2 They are among the most disabling and costly conditions experienced in the United States, contributing to an estimated $849 billion in direct and indirect costs per year.3 Orthopedic medical procedures can mitigate many common musculoskeletal conditions and improve patients’ mobility and quality of life. The most common procedures for musculoskeletal conditions are knee arthroplasty (surgical reconstruction or replacement of the knee), spinal fusion (correction of an unstable part of the spine by joining two or more vertebrae), and hip replacement (total and partial).4 Timely information on trends for mobility/orthopedic procedures provides analysts and policy makers with baseline information that can be used to help evaluate the impact of health improvement efforts. A novel initiative from the Agency for Healthcare Research and Quality’s (AHRQ) Healthcare Cost and Utilization Project (HCUP) is used in this report to produce timely, current inpatient statistics on mobility/orthopedic procedures. The HCUP State Inpatient Databases (SID) from 2003 to 2010 include about 330 million inpatient discharges from 46 States. The list of statewide data organizations that contribute to HCUP is available in Appendix I. In this report we use the historical SID data with early 2011 data from 10 HCUP States to develop national quarterly projections of 2011 and 2012 inpatient statistics for:
• primary hip replacement (for any reason, for osteoarthritis only, for hip fracture only)
• hip replacement revision surgery
• primary knee arthroplasty for osteoarthritis
• knee replacement revision surgery
• spinal fusion for back problems.
1 Disease Control Priorities Project – Musculoskeletal Conditions are the Most Common Cause of Disability. May 2007. http://www.dcp2.org. 2 Haralson, RH 3rd, Zuckerman, JD. Prevalence, health care expenditures, and orthopedic surgery workforce for musculoskeletal conditions. JAMA 2009 Oct 14;302(14):1586-7. 3 United States Bone and Joint Decade. "Health Care Utilization and Economic Cost of Musculoskeletal Diseases." The Burden of Musculoskeletal Diseases in the United States. Rosemont, IL: American Academy of Orthopaedic Surgeons; 2008. 219-252. 4 HCUPnet, Healthcare Cost and Utilization Project. Agency for Healthcare Research and Quality, Rockville, MD. http://hcupnet.ahrq.gov/. Accessed June 5, 2012.

HCUP Projections:
Mobility/Orthopedic Procedures
HCUP (09/07/12) 2 HCUP Orthopedic Projections
Return to Contents
Introduction (continued) Statistics for each orthopedic procedure are reported in total and separately by adult age group (18–44 years, 45–64 years, and 65 years and older), by gender, and by community-level income (lowest and highest income quartiles). The orthopedic procedures reported in this study are identified on an inpatient stay record. Appendix II includes specifications for the various orthopedic procedures. Three outcomes are projected for each orthopedic procedure: counts of inpatient discharges, average total hospital cost, and average length of stay. Average total hospital costs reflect actual expenses incurred in the production of hospital services; the average costs do not include physician billing. No adjustment has been made to the costs to equate them to a constant year. However, a reference line is included that depicts the cost per admission in the first quarter of 2003 adjusted for economy-wide inflation only. In HCUP, the length of stay counts nights spent in the hospital. If a patient is admitted and discharged on the same day, the length of stay is zero. A detailed explanation of the projection methodology is included in Appendix III. More information on HCUP is available on the HCUP User Support Website (http://www.hcup-us.ahrq.gov).

HCUP Projections:
Mobility/Orthopedic Procedures
HCUP (09/07/12) 3 HCUP Orthopedic Projections
Return to Contents
Summary The following table summarizes the change from annual estimates in 2003 to projected annual estimates in 2012 for mobility/orthopedic procedures included in this report for each of the three outcomes. Detailed graphs showing historical data and projections by quarter follow for each measure and outcome. The data presented in the table is for all adults. Graphs following this summary also show data for three age groups, by gender, and by income. Up or down arrows indicate change of over 10 percent between annual weighted estimates from 2003 to 2012. Dashes indicate inconsistent or little change.
Measure
Projected Annual Total Discharges
for All Adults 2012
Change from 2003 to 2012 Projection for All Adults
Total Discharges
Average Total Hospital Cost
Average Length of Stay
primary hip replacement for any reason 427,946
primary hip replacement for osteoarthritis 285,354
primary hip replacement for hip fracture 101,846 −−
hip replacement revision surgery 47,024
primary knee arthroplasty for osteoarthritis
675,359
knee replacement revision surgery 60,803
spinal fusion for back problems 347,422 −−

HCUP Projections:
Mobility/Orthopedic Procedures
HCUP (09/07/12) 4 HCUP Orthopedic Projections
Return to Contents
Primary Hip Replacement for Any Reason
Primary hip replacement for any reason involves replacing a natural hip joint with an artificial (prosthetic) device in order to alleviate severe joint pain or correct joint damage, such as caused by osteoarthritis or hip fracture. Using the HCUP SID from 2003 to 2010 and early 2011 data from 10 States, different outcomes for inpatient discharges with primary hip replacement for any reason are projected for 2011 to 2012.
Projections include the following:
• Total inpatient discharges for all adults, adults by age group, adults by gender, and adults by community income quartile. Discharge counts exclude inpatient stays that were transferred out to another acute care hospital. This ensures that these events are not double counted.
• Average total hospital cost for all adults, adults by age group, adults by gender, and adults by community income quartile. Average total hospital cost reflects actual expenses incurred in the production of hospital services; physician costs are not included. For comparison, a line is included that depicts the change in the average inpatient hospital cost per admission in the first quarter of 2003 (Q1 2003) due solely to economy-wide inflation. The difference between the actual/projected cost line and the inflation-adjusted Q1 2003 cost line represents cost increases due to other non-inflation factors, such as new technology or patient case mix.
• Average length of stay for all adults, adults by age group, adults by gender, and adults by community income quartile. In HCUP, the length of stay counts nights spent in the hospital. If a patient is admitted and discharged on the same day, the length of stay is zero.

HCUP Projections:
Mobility/Orthopedic Procedures
HCUP (09/07/12) 5 HCUP Orthopedic Projections
Return to Contents
Primary Hip Replacement for Any Reason
Number of Discharges for All Adults
Key Findings: • The number of discharges with primary hip replacement for any reason increased over time, from
about 79,000 discharges per quarter in 2003 to 101,500 discharges per quarter in 2010.
• The increasing trend is projected to continue in 2011 and 2012, with quarterly discharges projected to be about 110,000 at the end of 2012.
Source: Agency for Healthcare Research and Quality, Center for Delivery, Organization, and Markets, Healthcare Cost and Utilization Project, State Inpatient Databases.

HCUP Projections:
Mobility/Orthopedic Procedures
HCUP (09/07/12) 6 HCUP Orthopedic Projections
Return to Contents
Primary Hip Replacement for Any Reason
Number of Discharges by Age Group
Key Findings: • Adults age 65 and older had the highest discharges with primary hip replacement for any reason, at
about 55,000 discharges per quarter in 2003 and increasing to 62,500 discharges per quarter in 2010.
• Adults ages 45 to 64 had the next highest discharges, at about 20,000 discharges per quarter in 2003 and increasing to 34,500 discharges per quarter in 2010.
• Adults ages 18 to 44 had the lowest discharges, at about 3,800 discharges per quarter in 2003 and increasing to 4,200 discharges per quarter in 2010.
Source: Agency for Healthcare Research and Quality, Center for Delivery, Organization, and Markets, Healthcare Cost and Utilization Project, State Inpatient Databases.

HCUP Projections:
Mobility/Orthopedic Procedures
HCUP (09/07/12) 7 HCUP Orthopedic Projections
Return to Contents
Primary Hip Replacement for Any Reason
Number of Discharges by Gender
Key Findings: • Females had about 19,500 more quarterly discharges with primary hip replacement for any reason
than did males.
• Females had about 49,500 discharges per quarter in 2003, increasing to 60,000 discharges per quarter in 2010.
• Males had about 29,000 discharges per quarter in 2003, increasing to 41,500 discharges per quarter in 2010.
Source: Agency for Healthcare Research and Quality, Center for Delivery, Organization, and Markets, Healthcare Cost and Utilization Project, State Inpatient Databases.

HCUP Projections:
Mobility/Orthopedic Procedures
HCUP (09/07/12) 8 HCUP Orthopedic Projections
Return to Contents
Primary Hip Replacement for Any Reason
Number of Discharges by Income (Lowest Compared to Highest Quartile)
Key Findings: • Adults residing in the highest income communities had about 5,000 more quarterly discharges with
primary hip replacement for any reason than did those in the lowest income communities.
• Adults residing in the highest income communities had about 19,500 discharges per quarter in 2003, increasing to 26,500 discharges per quarter in 2010.
• Adults residing in the lowest income communities had about 15,500 discharges per quarter in 2003, increasing to 22,000 discharges per quarter in 2010.
Source: Agency for Healthcare Research and Quality, Center for Delivery, Organization, and Markets, Healthcare Cost and Utilization Project, State Inpatient Databases.

HCUP Projections:
Mobility/Orthopedic Procedures
HCUP (09/07/12) 9 HCUP Orthopedic Projections
Return to Contents
Primary Hip Replacement for Any Reason
Average Total Hospital Cost for All Adults
Key Findings: • The average hospital cost for discharges with primary hip replacement for any reason increased over
time, from about $14,000 in 2003 to $17,500 in 2010.
• The increasing trend is projected to continue in 2011 and 2012, with the average hospital cost projected to be about $19,000 at the end of 2012.
• Using the Gross Domestic Product (GDP) price index, a cost of $14,000 in 2003 would be equivalent to a cost of $16,500 at the end of 2010.
• The average hospital cost through 2010 remained relatively consistent with the cost expected by inflation alone.
Inflation-adjusted Q1 2003 Costs: Cost per admission in the first quarter of 2003, adjusted for economy-wide inflation. Source: Agency for Healthcare Research and Quality, Center for Delivery, Organization, and Markets, Healthcare Cost and Utilization Project, State Inpatient Databases.

HCUP Projections:
Mobility/Orthopedic Procedures
HCUP (09/07/12) 10 HCUP Orthopedic Projections
Return to Contents
Primary Hip Replacement for Any Reason
Average Total Hospital Cost by Age Group
Key Findings: • The average hospital cost for discharges with primary hip replacement for any reason was similar for
all three age groups, increasing from about $14,000 in 2003 to $17,500 in 2010.
Inflation-adjusted Q1 2003 Costs: Cost per admission in the first quarter of 2003, adjusted for economy-wide inflation. Source: Agency for Healthcare Research and Quality, Center for Delivery, Organization, and Markets, Healthcare Cost and Utilization Project, State Inpatient Databases.

HCUP Projections:
Mobility/Orthopedic Procedures
HCUP (09/07/12) 11 HCUP Orthopedic Projections
Return to Contents
Primary Hip Replacement for Any Reason
Average Total Hospital Cost by Gender
Key Findings: • The average hospital cost for discharges with primary hip replacement for any reason was similar for
males and females, increasing from about $14,000 in 2003 to $17,500 in 2010.
Inflation-adjusted Q1 2003 Costs: Cost per admission in the first quarter of 2003, adjusted for economy-wide inflation. Source: Agency for Healthcare Research and Quality, Center for Delivery, Organization, and Markets, Healthcare Cost and Utilization Project, State Inpatient Databases.

HCUP Projections:
Mobility/Orthopedic Procedures
HCUP (09/07/12) 12 HCUP Orthopedic Projections
Return to Contents
Primary Hip Replacement for Any Reason
Average Total Hospital Cost by Income (Lowest Compared to Highest Quartile)
Key Findings: • The average hospital cost for discharges with primary hip replacement for any reason was similar for
adults residing in the lowest and highest income communities, increasing from about $14,000 in 2003 to $17,500 in 2010.
Inflation-adjusted Q1 2003 Costs: Cost per admission in the first quarter of 2003, adjusted for economy-wide inflation. Source: Agency for Healthcare Research and Quality, Center for Delivery, Organization, and Markets, Healthcare Cost and Utilization Project, State Inpatient Databases.

HCUP Projections:
Mobility/Orthopedic Procedures
HCUP (09/07/12) 13 HCUP Orthopedic Projections
Return to Contents
Primary Hip Replacement for Any Reason
Average Length of Stay for All Adults
Key Findings: • The average length of stay for discharges with primary hip replacement for any reason decreased over
time, from 5.2 days in 2003 to 4.2 days in 2010.
• The decreasing trend is projected to continue in 2011 and 2012, with the length of stay projected to be 3.9 days at the end of 2012.
Source: Agency for Healthcare Research and Quality, Center for Delivery, Organization, and Markets, Healthcare Cost and Utilization Project, State Inpatient Databases.

HCUP Projections:
Mobility/Orthopedic Procedures
HCUP (09/07/12) 14 HCUP Orthopedic Projections
Return to Contents
Primary Hip Replacement for Any Reason
Average Length of Stay by Age Group
Key Findings: • Adults age 65 and older had the longest length of stay for discharges with primary hip replacement for
any reason, at 5.6 days in 2003 and decreasing to 4.7 days in 2010.
• The two youngest age groups had similar lengths of stay, at 4.3 days in 2003 and decreasing to 3.4 days in 2010.
Source: Agency for Healthcare Research and Quality, Center for Delivery, Organization, and Markets, Healthcare Cost and Utilization Project, State Inpatient Databases.

HCUP Projections:
Mobility/Orthopedic Procedures
HCUP (09/07/12) 15 HCUP Orthopedic Projections
Return to Contents
Primary Hip Replacement for Any Reason
Average Length of Stay by Gender
Key Findings: • Length of stay for discharges with primary hip replacement for any reason was similar for males and
females, decreasing from 5.2 days in 2003 to 4.2 days in 2010.
Source: Agency for Healthcare Research and Quality, Center for Delivery, Organization, and Markets, Healthcare Cost and Utilization Project, State Inpatient Databases.

HCUP Projections:
Mobility/Orthopedic Procedures
HCUP (09/07/12) 16 HCUP Orthopedic Projections
Return to Contents
Primary Hip Replacement for Any Reason
Average Length of Stay by Income (Lowest Compared to Highest Quartile)
Key Findings: • Length of stay for discharges with primary hip replacement for any reason was 0.6 days longer for
adults residing in the lowest income communities than for those in the highest income communities.
• Adults residing in the lowest income communities had a length of stay that decreased from 5.6 days in 2003 to 4.5 days in 2010.
• Adults residing in the highest income communities had a length of stay that decreased from 5.0 days in 2003 to 4.0 days in 2010.
Source: Agency for Healthcare Research and Quality, Center for Delivery, Organization, and Markets, Healthcare Cost and Utilization Project, State Inpatient Databases.

HCUP Projections:
Mobility/Orthopedic Procedures
HCUP (09/07/12) 17 HCUP Orthopedic Projections
Return to Contents
This page intentionally left blank.

HCUP Projections:
Mobility/Orthopedic Procedures
HCUP (09/07/12) 18 HCUP Orthopedic Projections
Return to Contents
Primary Hip Replacement for Osteoarthritis
Primary hip replacement for osteoarthritis involves replacing a natural hip joint with an artificial (prosthetic) device in order to alleviate severe joint pain or correct joint damage caused by osteoarthritis. Using the HCUP SID from 2003 to 2010 and early 2011 data from 10 States, different outcomes for inpatient discharges with primary hip replacement for osteoarthritis are projected for 2011 to 2012.
Projections include the following:
• Total inpatient discharges for all adults, adults by age group, adults by gender, and adults by community income quartile. Discharge counts exclude inpatient stays that were transferred out to another acute care hospital. This ensures that these events are not double counted.
• Average total hospital cost for all adults, adults by age group, adults by gender, and adults by community income quartile. Average total hospital cost reflects actual expenses incurred in the production of hospital services; physician costs are not included. For comparison, a line is included that depicts the change in the average inpatient hospital cost per admission in the first quarter of 2003 (Q1 2003) due solely to economy-wide inflation. The difference between the actual/projected cost line and the inflation-adjusted Q1 2003 cost line represents cost increases due to other non-inflation factors, such as new technology or patient case mix.
• Average length of stay for all adults, adults by age group, adults by gender, and adults by community income quartile. In HCUP, the length of stay counts nights spent in the hospital. If a patient is admitted and discharged on the same day, the length of stay is zero.

HCUP Projections:
Mobility/Orthopedic Procedures
HCUP (09/07/12) 19 HCUP Orthopedic Projections
Return to Contents
Primary Hip Replacement for Osteoarthritis
Number of Discharges for All Adults
Key Findings: • The number of discharges with primary hip replacement for osteoarthritis increased over time, from
about 43,000 discharges per quarter in 2003 to 65,500 discharges per quarter in 2010.
• The increasing trend is projected to continue in 2011 and 2012, with quarterly discharges projected to be about 74,000 at the end of 2012.
Source: Agency for Healthcare Research and Quality, Center for Delivery, Organization, and Markets, Healthcare Cost and Utilization Project, State Inpatient Databases.

HCUP Projections:
Mobility/Orthopedic Procedures
HCUP (09/07/12) 20 HCUP Orthopedic Projections
Return to Contents
Primary Hip Replacement for Osteoarthritis
Number of Discharges by Age Group
Key Findings: • Adults age 65 and older had the highest discharges with primary hip replacement for osteoarthritis, at
about 26,000 discharges per quarter in 2003 and increasing to 35,000 discharges per quarter in 2010.
• Adults ages 45 to 64 had the next highest discharges, at about 15,000 discharges per quarter in 2003 and increasing to 28,500 discharges per quarter in 2010.
• Adults ages 18 to 44 had the lowest discharges, at about 1,900 discharges per quarter in 2003 and increasing to 2,400 discharges per quarter in 2010.
Source: Agency for Healthcare Research and Quality, Center for Delivery, Organization, and Markets, Healthcare Cost and Utilization Project, State Inpatient Databases.

HCUP Projections:
Mobility/Orthopedic Procedures
HCUP (09/07/12) 21 HCUP Orthopedic Projections
Return to Contents
Primary Hip Replacement for Osteoarthritis
Number of Discharges by Gender
Key Findings: • Females had about 6,500 more quarterly discharges with primary hip replacement for osteoarthritis
than did males.
• Females had about 25,000 discharges per quarter in 2003, increasing to 36,500 discharges per quarter in 2010.
• Males had about 18,000 discharges per quarter in 2003, increasing to 29,000 discharges per quarter in 2010.
Source: Agency for Healthcare Research and Quality, Center for Delivery, Organization, and Markets, Healthcare Cost and Utilization Project, State Inpatient Databases.

HCUP Projections:
Mobility/Orthopedic Procedures
HCUP (09/07/12) 22 HCUP Orthopedic Projections
Return to Contents
Primary Hip Replacement for Osteoarthritis
Number of Discharges by Income (Lowest Compared to Highest Quartile)
Key Findings: • Adults residing in the highest income communities had about 6,000 more quarterly discharges with
primary hip replacement for osteoarthritis than did those in the lowest income communities.
• Adults residing in the highest income communities had about 12,000 discharges per quarter in 2003, increasing to 19,000 discharges per quarter in 2010.
• Adults residing in the lowest income communities had about 7,000 discharges per quarter in 2003, increasing to 12,500 discharges per quarter in 2010.
Source: Agency for Healthcare Research and Quality, Center for Delivery, Organization, and Markets, Healthcare Cost and Utilization Project, State Inpatient Databases.

HCUP Projections:
Mobility/Orthopedic Procedures
HCUP (09/07/12) 23 HCUP Orthopedic Projections
Return to Contents
Primary Hip Replacement for Osteoarthritis
Average Total Hospital Cost for All Adults
Key Findings: • The average hospital cost for discharges with primary hip replacement for osteoarthritis increased over
time, from about $13,000 in 2003 to $16,500 in 2010.
• The increasing trend is projected to continue in 2011 and 2012, with the average hospital cost projected to be about $18,000 at the end of 2012.
• Using the Gross Domestic Product (GDP) price index, a cost of $13,000 in 2003 would be equivalent to a cost of $16,000 in 2010.
• The average hospital cost through 2010 remained relatively consistent with the cost expected by inflation alone.
Inflation-adjusted Q1 2003 Costs: Cost per admission in the first quarter of 2003, adjusted for economy-wide inflation. Source: Agency for Healthcare Research and Quality, Center for Delivery, Organization, and Markets, Healthcare Cost and Utilization Project, State Inpatient Databases.

HCUP Projections:
Mobility/Orthopedic Procedures
HCUP (09/07/12) 24 HCUP Orthopedic Projections
Return to Contents
Primary Hip Replacement for Osteoarthritis
Average Total Hospital Cost by Age Group
Key Findings: • The average hospital cost for discharges with primary hip replacement for osteoarthritis was similar for
all three age groups, increasing from about $13,500 in 2003 to $17,000 in 2010.
Inflation-adjusted Q1 2003 Costs: Cost per admission in the first quarter of 2003, adjusted for economy-wide inflation. Source: Agency for Healthcare Research and Quality, Center for Delivery, Organization, and Markets, Healthcare Cost and Utilization Project, State Inpatient Databases.

HCUP Projections:
Mobility/Orthopedic Procedures
HCUP (09/07/12) 25 HCUP Orthopedic Projections
Return to Contents
Primary Hip Replacement for Osteoarthritis
Average Total Hospital Cost by Gender
Key Findings: • The average hospital cost for discharges with primary hip replacement for osteoarthritis was similar for
males and females, increasing from about $13,000 in 2003 to $16,500 in 2010.
Inflation-adjusted Q1 2003 Costs: Cost per admission in the first quarter of 2003, adjusted for economy-wide inflation. Source: Agency for Healthcare Research and Quality, Center for Delivery, Organization, and Markets, Healthcare Cost and Utilization Project, State Inpatient Databases.

HCUP Projections:
Mobility/Orthopedic Procedures
HCUP (09/07/12) 26 HCUP Orthopedic Projections
Return to Contents
Primary Hip Replacement for Osteoarthritis
Average Total Hospital Cost by Income (Lowest Compared to Highest Quartile)
Key Findings: • The average hospital cost for discharges with primary hip replacement for osteoarthritis was similar for
adults residing in the lowest and highest income communities, increasing from about $13,500 in 2003 to $16,500 in 2010.
Inflation-adjusted Q1 2003 Costs: Cost per admission in the first quarter of 2003, adjusted for economy-wide inflation. Source: Agency for Healthcare Research and Quality, Center for Delivery, Organization, and Markets, Healthcare Cost and Utilization Project, State Inpatient Databases.

HCUP Projections:
Mobility/Orthopedic Procedures
HCUP (09/07/12) 27 HCUP Orthopedic Projections
Return to Contents
Primary Hip Replacement for Osteoarthritis
Average Length of Stay for All Adults
Key Findings: • The average length of stay for discharges with primary hip replacement for osteoarthritis decreased
over time, from 4.1 days in 2003 to 3.3 days in 2010.
• The decreasing trend is projected to continue in 2011 and 2012, with the length of stay projected to be 2.9 days at the end of 2012.
Source: Agency for Healthcare Research and Quality, Center for Delivery, Organization, and Markets, Healthcare Cost and Utilization Project, State Inpatient Databases.

HCUP Projections:
Mobility/Orthopedic Procedures
HCUP (09/07/12) 28 HCUP Orthopedic Projections
Return to Contents
Primary Hip Replacement for Osteoarthritis
Average Length of Stay by Age Group
Key Findings: • Adults age 65 and older had the longest length of stay for discharges with primary hip replacement for
osteoarthritis, at 4.2 days in 2003 and decreasing to 3.4 days in 2010.
• The two youngest age groups had similar lengths of stay, at 3.8 days in 2003 and decreasing to 3.0 days in 2010.
Source: Agency for Healthcare Research and Quality, Center for Delivery, Organization, and Markets, Healthcare Cost and Utilization Project, State Inpatient Databases.
HCUP Projections:
Mobility/Orthopedic Procedures
HCUP (09/07/12) 29 HCUP Orthopedic Projections
Return to Contents
Primary Hip Replacement for Osteoarthritis
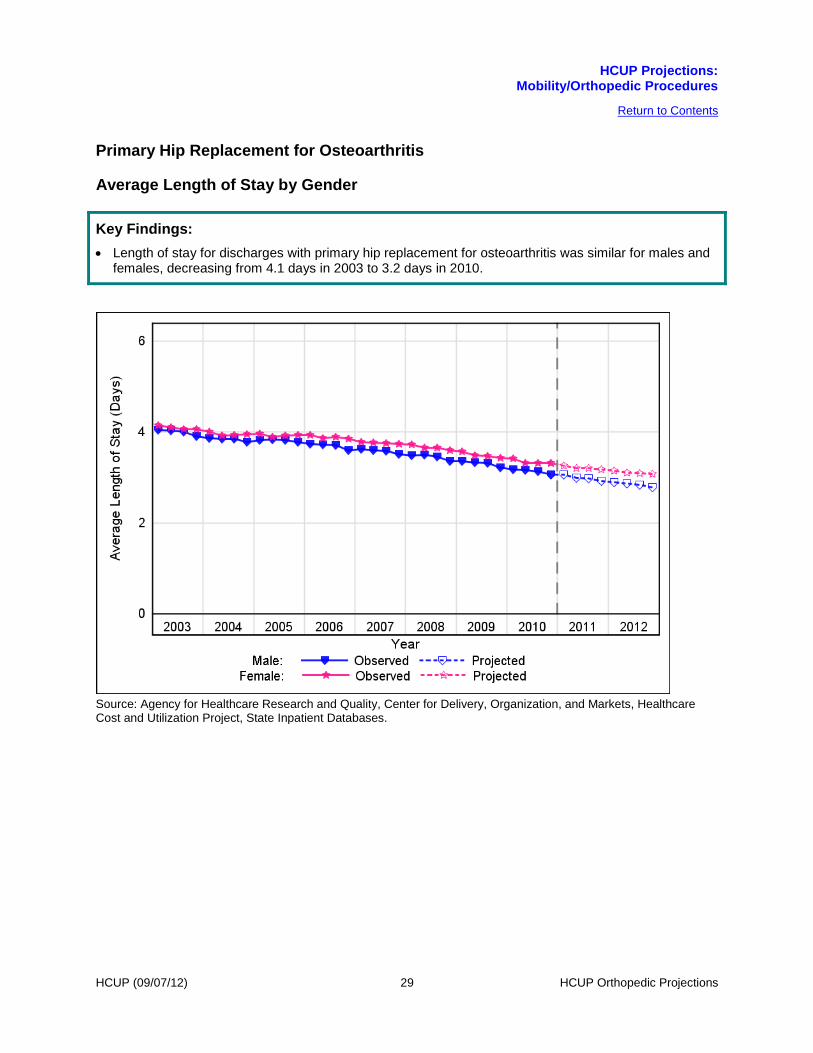
Average Length of Stay by Gender
Key Findings: • Length of stay for discharges with primary hip replacement for osteoarthritis was similar for males and
females, decreasing from 4.1 days in 2003 to 3.2 days in 2010.
Source: Agency for Healthcare Research and Quality, Center for Delivery, Organization, and Markets, Healthcare Cost and Utilization Project, State Inpatient Databases.

HCUP Projections:
Mobility/Orthopedic Procedures
HCUP (09/07/12) 30 HCUP Orthopedic Projections
Return to Contents
Primary Hip Replacement for Osteoarthritis
Average Length of Stay by Income (Lowest Compared to Highest Quartile)
Key Findings: • Length of stay for discharges with primary hip replacement for osteoarthritis was similar for adults
residing in the lowest and highest income communities, decreasing from 4.1 days in 2003 to 3.3 days in 2010.
Source: Agency for Healthcare Research and Quality, Center for Delivery, Organization, and Markets, Healthcare Cost and Utilization Project, State Inpatient Databases.

HCUP Projections:
Mobility/Orthopedic Procedures
HCUP (09/07/12) 31 HCUP Orthopedic Projections
Return to Contents
This page intentionally left blank.

HCUP Projections:
Mobility/Orthopedic Procedures
HCUP (09/07/12) 32 HCUP Orthopedic Projections
Return to Contents
Primary Hip Replacement for Hip Fracture
Primary hip replacement for hip fracture involves replacing a natural hip joint with an artificial (prosthetic) device in order to correct joint damage caused by hip fracture. Using the HCUP SID from 2003 to 2010 and early 2011 data from 10 States, different outcomes for inpatient discharges with primary hip replacement for hip fracture are projected for 2011 to 2012.
Projections include the following:
• Total inpatient discharges for all adults, adults by age group, adults by gender, and adults by community income quartile. Discharge counts exclude inpatient stays that were transferred out to another acute care hospital. This ensures that these events are not double counted.
• Average total hospital cost for all adults, adults by age group, adults by gender, and adults by community income quartile. Average total hospital cost reflects actual expenses incurred in the production of hospital services; physician costs are not included. For comparison, a line is included that depicts the change in the average inpatient hospital cost per admission in the first quarter of 2003 (Q1 2003) due solely to economy-wide inflation. The difference between the actual/projected cost line and the inflation-adjusted Q1 2003 cost line represents cost increases due to other non-inflation factors, such as new technology or patient case mix.
• Average length of stay for all adults, adults by age group, adults by gender, and adults by community income quartile. In HCUP, the length of stay counts nights spent in the hospital. If a patient is admitted and discharged on the same day, the length of stay is zero.

HCUP Projections:
Mobility/Orthopedic Procedures
HCUP (09/07/12) 33 HCUP Orthopedic Projections
Return to Contents
Primary Hip Replacement for Hip Fracture
Number of Discharges for All Adults
Key Findings: • The number of discharges with primary hip replacement for hip fracture was relatively stable between
2003 and 2010, at about 25,500 discharges per quarter.
• Discharges are projected to remain at about this same level in 2011 and 2012.
Source: Agency for Healthcare Research and Quality, Center for Delivery, Organization, and Markets, Healthcare Cost and Utilization Project, State Inpatient Databases.

HCUP Projections:
Mobility/Orthopedic Procedures
HCUP (09/07/12) 34 HCUP Orthopedic Projections
Return to Contents
Primary Hip Replacement for Hip Fracture
Number of Discharges by Age Group
Key Findings: • Adults age 65 and older had the highest discharges with primary hip replacement for hip fracture,
remaining relatively stable at about 23,500 discharges per quarter.
• Adults ages 45 to 64 had the next highest discharges, at about 1,500 discharges per quarter in 2003 and increasing to 2,000 discharges per quarter in 2010.
• Adults ages 18 to 44 had the lowest discharges, remaining relatively stable at about 75 discharges per quarter.
Source: Agency for Healthcare Research and Quality, Center for Delivery, Organization, and Markets, Healthcare Cost and Utilization Project, State Inpatient Databases.

HCUP Projections:
Mobility/Orthopedic Procedures
HCUP (09/07/12) 35 HCUP Orthopedic Projections
Return to Contents
Primary Hip Replacement for Hip Fracture
Number of Discharges by Gender
Key Findings: • Females had about 11,500 more quarterly discharges with primary hip replacement for hip fracture
than did males.
• Females had a relatively stable number of discharges at about 18,500 discharges per quarter.
• Males had about 6,500 discharges per quarter in 2003, increasing to 7,000 discharges per quarter in 2010.
Source: Agency for Healthcare Research and Quality, Center for Delivery, Organization, and Markets, Healthcare Cost and Utilization Project, State Inpatient Databases.

HCUP Projections:
Mobility/Orthopedic Procedures
HCUP (09/07/12) 36 HCUP Orthopedic Projections
Return to Contents
Primary Hip Replacement for Hip Fracture
Number of Discharges by Income (Lowest Compared to Highest Quartile)
Key Findings: • Adults residing in the lowest income communities had about 1,000 more quarterly discharges with
primary hip replacement for hip fracture than did those in the highest income communities.
• Adults residing in the lowest income communities had about 6,000 discharges per quarter in 2003, increasing to 6,500 discharges per quarter in 2010.
• Adults residing in the highest income communities had a relatively stable number of discharges at about 5,500 discharges per quarter.
Source: Agency for Healthcare Research and Quality, Center for Delivery, Organization, and Markets, Healthcare Cost and Utilization Project, State Inpatient Databases.

HCUP Projections:
Mobility/Orthopedic Procedures
HCUP (09/07/12) 37 HCUP Orthopedic Projections
Return to Contents
Primary Hip Replacement for Hip Fracture
Average Total Hospital Cost for All Adults
Key Findings: • The average hospital cost for discharges with primary hip replacement for hip fracture increased over
time, from about $14,000 in 2003 to $18,000 in 2010.
• The increasing trend is projected to continue in 2011 and 2012, with the average hospital cost projected to be about $20,000 at the end of 2012.
• Using the Gross Domestic Product (GDP) price index, a cost of $14,000 in 2003 would be equivalent to a cost of $16,500 at the end of 2010.
• By 2010, the average hospital cost exceeded the cost expected by inflation alone.
Inflation-adjusted Q1 2003 Costs: Cost per admission in the first quarter of 2003, adjusted for economy-wide inflation. Source: Agency for Healthcare Research and Quality, Center for Delivery, Organization, and Markets, Healthcare Cost and Utilization Project, State Inpatient Databases.

HCUP Projections:
Mobility/Orthopedic Procedures
HCUP (09/07/12) 38 HCUP Orthopedic Projections
Return to Contents
Primary Hip Replacement for Hip Fracture
Average Total Hospital Cost by Age Group
Key Findings: • Adults ages 45 to 64 had the highest average hospital cost, at about $16,000 in 2003 and increasing to
$20,000 in 2010.
• Adults age 65 and older had the lowest average hospital cost, at about $13,500 in 2003 and increasing to $18,000 in 2010.
• The average hospital cost for adults ages 18 to 44 was not included due to the small number of discharges among this age group (about 75 per quarter).
Inflation-adjusted Q1 2003 Costs: Cost per admission in the first quarter of 2003, adjusted for economy-wide inflation. Source: Agency for Healthcare Research and Quality, Center for Delivery, Organization, and Markets, Healthcare Cost and Utilization Project, State Inpatient Databases.

HCUP Projections:
Mobility/Orthopedic Procedures
HCUP (09/07/12) 39 HCUPOrthopedic Projections
Return to Contents
Primary Hip Replacement for Hip Fracture
Average Total Hospital Cost by Gender
Key Findings: • The average hospital cost for discharges with primary hip replacement for hip fracture was about
$2,000 higher for males than for females.
• Males had an average hospital cost that increased from about $15,000 in 2003 to $20,000 in 2010.
• Females had an average hospital cost that increased from about $13,500 in 2003 to $17,500 in 2010.
Inflation-adjusted Q1 2003 Costs: Cost per admission in the first quarter of 2003, adjusted for economy-wide inflation. Source: Agency for Healthcare Research and Quality, Center for Delivery, Organization, and Markets, Healthcare Cost and Utilization Project, State Inpatient Databases.

HCUP Projections:
Mobility/Orthopedic Procedures
HCUP (09/07/12) 40 HCUP Orthopedic Projections
Return to Contents
Primary Hip Replacement for Hip Fracture
Average Total Hospital Cost by Income (Lowest Compared to Highest Quartile)
Key Findings: • The average hospital cost for discharges with primary hip replacement for hip fracture was similar for
adults residing in the lowest and highest income communities, increasing from about $14,000 in 2003 to $18,500 in 2010.
Inflation-adjusted Q1 2003 Costs: Cost per admission in the first quarter of 2003, adjusted for economy-wide inflation. Source: Agency for Healthcare Research and Quality, Center for Delivery, Organization, and Markets, Healthcare Cost and Utilization Project, State Inpatient Databases.
HCUP Projections:
Mobility/Orthopedic Procedures
HCUP (09/07/12) 41 HCUP Orthopedic Projections
Return to Contents
Primary Hip Replacement for Hip Fracture
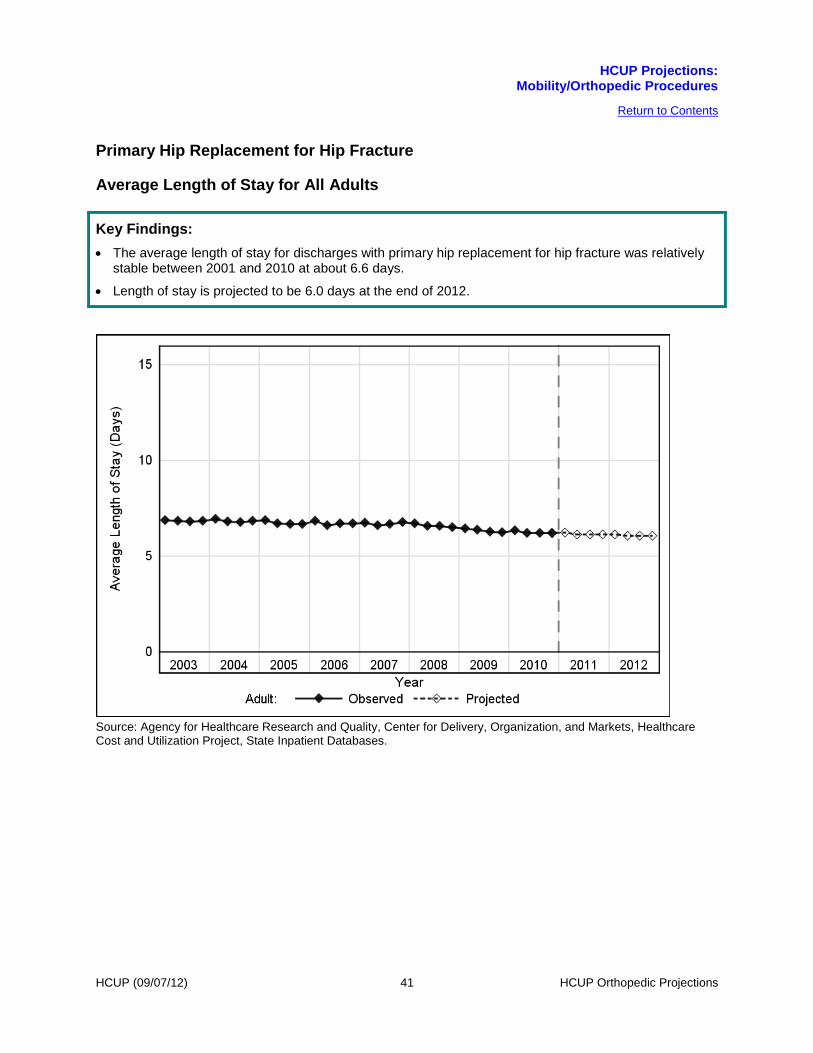
Average Length of Stay for All Adults
Key Findings: • The average length of stay for discharges with primary hip replacement for hip fracture was relatively
stable between 2001 and 2010 at about 6.6 days.
• Length of stay is projected to be 6.0 days at the end of 2012.
Source: Agency for Healthcare Research and Quality, Center for Delivery, Organization, and Markets, Healthcare Cost and Utilization Project, State Inpatient Databases.

HCUP Projections:
Mobility/Orthopedic Procedures
HCUP (09/07/12) 42 HCUP Orthopedic Projections
Return to Contents
Primary Hip Replacement for Hip Fracture
Average Length of Stay by Age Group
Key Findings: • The two oldest age groups had similar lengths of stay, at 7.1 days in 2003 and decreasing to 6.4 days
in 2010.
• The length of stay for adults ages 18 to 44 was not included due to the small number of discharges among this age group (about 75 per quarter).
Source: Agency for Healthcare Research and Quality, Center for Delivery, Organization, and Markets, Healthcare Cost and Utilization Project, State Inpatient Databases.

HCUP Projections:
Mobility/Orthopedic Procedures
HCUP (09/07/12) 43 HCUP Orthopedic Projections
Return to Contents
Primary Hip Replacement for Hip Fracture
Average Length of Stay by Gender
Key Findings: • Length of stay for discharges with primary hip replacement for hip fracture was 1.0 days longer for
males than for females, and remained relatively stable for both genders over time.
• Males had a length of stay of 7.4 days.
• Females had a length of stay of 6.3 days.
Source: Agency for Healthcare Research and Quality, Center for Delivery, Organization, and Markets, Healthcare Cost and Utilization Project, State Inpatient Databases.

HCUP Projections:
Mobility/Orthopedic Procedures
HCUP (09/07/12) 44 HCUP Orthopedic Projections
Return to Contents
Primary Hip Replacement for Hip Fracture
Average Length of Stay by Income (Lowest Compared to Highest Quartile)
Key Findings: • Length of stay for discharges with primary hip replacement for hip fracture was similar for adults
residing in the lowest and highest income communities, remaining relatively stable at 6.7 days.
Source: Agency for Healthcare Research and Quality, Center for Delivery, Organization, and Markets, Healthcare Cost and Utilization Project, State Inpatient Databases.

HCUP Projections:
Mobility/Orthopedic Procedures
HCUP (09/07/12) 45 HCUP Orthopedic Projections
Return to Contents
This page intentionally left blank.

HCUP Projections:
Mobility/Orthopedic Procedures
HCUP (09/07/12) 46 HCUP Orthopedic Projections
Return to Contents
Hip Replacement Revision Surgery
Hip replacement revision surgery involves replacing part or all of an artificial (prosthetic) hip that is no longer functioning properly. Patients may undergo revision surgery if they are experiencing pain or have lost mobility with the current prosthetic hip. Using the HCUP SID from 2003 to 2010 and early 2011 data from 10 States, different outcomes for inpatient discharges with hip replacement revision surgery are projected for 2011 to 2012.
Projections include the following:
• Total inpatient discharges for all adults, adults by age group, adults by gender, and adults by community income quartile. Discharge counts exclude inpatient stays that were transferred out to another acute care hospital. This ensures that these events are not double counted.
• Average total hospital cost for all adults, adults by age group, adults by gender, and adults by community income quartile. Average total hospital cost reflects actual expenses incurred in the production of hospital services; physician costs are not included. For comparison, a line is included that depicts the change in the average inpatient hospital cost per admission in the first quarter of 2003 (Q1 2003) due solely to economy-wide inflation. The difference between the actual/projected cost line and the inflation-adjusted Q1 2003 cost line represents cost increases due to other non-inflation factors, such as new technology or patient case mix.
• Average length of stay for all adults, adults by age group, adults by gender, and adults by community income quartile. In HCUP, the length of stay counts nights spent in the hospital. If a patient is admitted and discharged on the same day, the length of stay is zero.

HCUP Projections:
Mobility/Orthopedic Procedures
HCUP (09/07/12) 47 HCUP Orthopedic Projections
Return to Contents
Hip Replacement Revision Surgery
Number of Discharges for All Adults
Key Findings: • The number of discharges with hip replacement revision surgery increased over time, from about
9,500 discharges per quarter in 2003 to 11,000 discharges per quarter in 2010.
• The increasing trend is projected to continue in 2011 and 2012, with quarterly discharges projected to be about 12,000 at the end of 2012.
Source: Agency for Healthcare Research and Quality, Center for Delivery, Organization, and Markets, Healthcare Cost and Utilization Project, State Inpatient Databases.

HCUP Projections:
Mobility/Orthopedic Procedures
HCUP (09/07/12) 48 HCUP Orthopedic Projections
Return to Contents
Hip Replacement Revision Surgery
Number of Discharges by Age Group
Key Findings: • Adults age 65 and older had the highest discharges with hip replacement revision surgery, remaining
relatively stable at about 6,000 discharges per quarter.
• Adults ages 45 to 64 had the next highest discharges, at about 3,000 discharges per quarter in 2003 and increasing to 4,000 discharges per quarter in 2010.
• Adults ages 18 to 44 had the lowest discharges, at about 700 discharges per quarter in 2003 and decreasing to 600 discharges per quarter in 2010.
Source: Agency for Healthcare Research and Quality, Center for Delivery, Organization, and Markets, Healthcare Cost and Utilization Project, State Inpatient Databases.

HCUP Projections:
Mobility/Orthopedic Procedures
HCUP (09/07/12) 49 HCUP Orthopedic Projections
Return to Contents
Hip Replacement Revision Surgery
Number of Discharges by Gender
Key Findings: • Females had about 1,500 more quarterly discharges with hip replacement revision surgery than did
males.
• Females had about 5,500 discharges per quarter in 2003, increasing to 6,500 discharges per quarter in 2010.
• Males had about 4,000 discharges per quarter in 2003, increasing to 4,500 discharges per quarter in 2010.
Source: Agency for Healthcare Research and Quality, Center for Delivery, Organization, and Markets, Healthcare Cost and Utilization Project, State Inpatient Databases.

HCUP Projections:
Mobility/Orthopedic Procedures
HCUP (09/07/12) 50 HCUP Orthopedic Projections
Return to Contents
Hip Replacement Revision Surgery
Number of Discharges by Income (Lowest Compared to Highest Quartile)
Key Findings: • Adults residing in the highest income communities had about 400 more quarterly discharges with hip
replacement revision surgery than did those in the lowest income communities.
• Adults residing in the highest income communities had about 2,400 discharges per quarter in 2003, increasing to 2,700 discharges per quarter in 2010.
• Adults residing in the lowest income communities had about 2,000 discharges per quarter in 2003, increasing to 2,400 discharges per quarter in 2010.
Source: Agency for Healthcare Research and Quality, Center for Delivery, Organization, and Markets, Healthcare Cost and Utilization Project, State Inpatient Databases.

HCUP Projections:
Mobility/Orthopedic Procedures
HCUP (09/07/12) 51 HCUP Orthopedic Projections
Return to Contents
Hip Replacement Revision Surgery
Average Total Hospital Cost for All Adults
Key Findings: • The average hospital cost for discharges with hip replacement revision surgery increased over time,
from about $17,000 in 2003 to $22,500 in 2010.
• The increasing trend is projected to continue in 2011 and 2012, with the average hospital cost projected to be about $24,500 at the end of 2012.
• Using the Gross Domestic Product (GDP) price index, a cost of $17,000 in 2003 would be equivalent to a cost of $20,000 at the end of 2010.
• By 2010, the average hospital cost exceeded the cost expected by inflation alone.
Inflation-adjusted Q1 2003 Costs: Cost per admission in the first quarter of 2003, adjusted for economy-wide inflation. Source: Agency for Healthcare Research and Quality, Center for Delivery, Organization, and Markets, Healthcare Cost and Utilization Project, State Inpatient Databases.

HCUP Projections:
Mobility/Orthopedic Procedures
HCUP (09/07/12) 52 HCUP Orthopedic Projections
Return to Contents
Hip Replacement Revision Surgery
Average Total Hospital Cost by Age Group
Key Findings: • The average hospital cost for discharges with hip replacement revision surgery was similar for all three
age groups, increasing from about $16,500 in 2003 to $22,000 in 2010.
Inflation-adjusted Q1 2003 Costs: Cost per admission in the first quarter of 2003, adjusted for economy-wide inflation. Source: Agency for Healthcare Research and Quality, Center for Delivery, Organization, and Markets, Healthcare Cost and Utilization Project, State Inpatient Databases.

HCUP Projections:
Mobility/Orthopedic Procedures
HCUP (09/07/12) 53 HCUP Orthopedic Projections
Return to Contents
Hip Replacement Revision Surgery
Average Total Hospital Cost by Gender
Key Findings: • The average hospital cost for discharges with hip replacement revision surgery was similar for males
and females, increasing from about $17,000 in 2003 to $22,500 in 2010.
Inflation-adjusted Q1 2003 Costs: Cost per admission in the first quarter of 2003, adjusted for economy-wide inflation. Source: Agency for Healthcare Research and Quality, Center for Delivery, Organization, and Markets, Healthcare Cost and Utilization Project, State Inpatient Databases.

HCUP Projections:
Mobility/Orthopedic Procedures
HCUP (09/07/12) 54 HCUP Orthopedic Projections
Return to Contents
Hip Replacement Revision Surgery
Average Total Hospital Cost by Income (Lowest Compared to Highest Quartile)
Key Findings: • The average hospital cost for discharges with hip replacement revision surgery was similar for adults
residing in the lowest and highest income communities, increasing from about $17,000 in 2003 to $22,500 in 2010.
Inflation-adjusted Q1 2003 Costs: Cost per admission in the first quarter of 2003, adjusted for economy-wide inflation. Source: Agency for Healthcare Research and Quality, Center for Delivery, Organization, and Markets, Healthcare Cost and Utilization Project, State Inpatient Databases.

HCUP Projections:
Mobility/Orthopedic Procedures
HCUP (09/07/12) 55 HCUP Orthopedic Projections
Return to Contents
Hip Replacement Revision Surgery
Average Length of Stay for All Adults
Key Findings: • The average length of stay for discharges with hip replacement revision surgery decreased over time,
from 6.0 days in 2003 to 5.2 days in 2010.
• The decreasing trend is projected to continue in 2011 and 2012, with the length of stay projected to be 4.9 days at the end of 2012.
Source: Agency for Healthcare Research and Quality, Center for Delivery, Organization, and Markets, Healthcare Cost and Utilization Project, State Inpatient Databases.

HCUP Projections:
Mobility/Orthopedic Procedures
HCUP (09/07/12) 56 HCUP Orthopedic Projections
Return to Contents
Hip Replacement Revision Surgery
Average Length of Stay by Age Group
Key Findings: • Adults age 65 and older had the longest length of stay for discharges with hip replacement revision
surgery, at 6.3 days in 2003 and decreasing to 5.5 days in 2010.
• The two youngest age groups had similar lengths of stay, at 5.4 days in 2003 and decreasing to 4.6 days in 2010.
Source: Agency for Healthcare Research and Quality, Center for Delivery, Organization, and Markets, Healthcare Cost and Utilization Project, State Inpatient Databases.

HCUP Projections:
Mobility/Orthopedic Procedures
HCUP (09/07/12) 57 HCUP Orthopedic Projections
Return to Contents
Hip Replacement Revision Surgery
Average Length of Stay by Gender
Key Findings: • Length of stay for discharges with hip replacement revision surgery was similar for males and females,
decreasing from 5.9 days in 2003 to 5.1 days in 2010.
Source: Agency for Healthcare Research and Quality, Center for Delivery, Organization, and Markets, Healthcare Cost and Utilization Project, State Inpatient Databases.

HCUP Projections:
Mobility/Orthopedic Procedures
HCUP (09/07/12) 58 HCUP Orthopedic Projections
Return to Contents
Hip Replacement Revision Surgery
Average Length of Stay by Income (Lowest Compared to Highest Quartile)
Key Findings: • Length of stay for discharges with hip replacement revision surgery was similar for adults residing in
the lowest and highest income communities, decreasing from 6.0 days in 2003 to 5.3 days in 2010.
Source: Agency for Healthcare Research and Quality, Center for Delivery, Organization, and Markets, Healthcare Cost and Utilization Project, State Inpatient Databases.

HCUP Projections:
Mobility/Orthopedic Procedures
HCUP (09/07/12) 59 HCUP Orthopedic Projections
Return to Contents
This page intentionally left blank.

HCUP Projections:
Mobility/Orthopedic Procedures
HCUP (09/07/12) 60 HCUP Orthopedic Projections
Return to Contents
Primary Knee Arthroplasty for Osteoarthritis
Primary knee arthroplasty for osteoarthritis involves replacing a natural knee joint with an artificial (prosthetic) device in order to alleviate severe joint pain, improve impaired mobility, or correct joint damage caused by osteoarthritis. Using the HCUP SID from 2003 to 2010 and early 2011 data from 10 States, different outcomes for inpatient discharges with primary knee arthroplasty for osteoarthritis are projected for 2011 to 2012.
Projections include the following:
• Total inpatient discharges for all adults, adults by age group, adults by gender, and adults by community income quartile. Discharge counts exclude inpatient stays that were transferred out to another acute care hospital. This ensures that these events are not double counted.
• Average total hospital cost for all adults, adults by age group, adults by gender, and adults by community income quartile. Average total hospital cost reflects actual expenses incurred in the production of hospital services; physician costs are not included. For comparison, a line is included that depicts the change in the average inpatient hospital cost per admission in the first quarter of 2003 (Q1 2003) due solely to economy-wide inflation. The difference between the actual/projected cost line and the inflation-adjusted Q1 2003 cost line represents cost increases due to other non-inflation factors, such as new technology or patient case mix.
• Average length of stay for all adults, adults by age group, adults by gender, and adults by community income quartile. In HCUP, the length of stay counts nights spent in the hospital. If a patient is admitted and discharged on the same day, the length of stay is zero.

HCUP Projections:
Mobility/Orthopedic Procedures
HCUP (09/07/12) 61 HCUP Orthopedic Projections
Return to Contents
Primary Knee Arthroplasty for Osteoarthritis
Number of Discharges for All Adults
Key Findings: • The number of discharges with primary knee arthroplasty for osteoarthritis increased over time, from
about 94,500 discharges per quarter in 2003 to 155,000 discharges per quarter in 2010.
• The increasing trend is projected to continue in 2011 and 2012, with quarterly discharges projected to be about 176,000 at the end of 2012.
Source: Agency for Healthcare Research and Quality, Center for Delivery, Organization, and Markets, Healthcare Cost and Utilization Project, State Inpatient Databases.

HCUP Projections:
Mobility/Orthopedic Procedures
HCUP (09/07/12) 62 HCUP Orthopedic Projections
Return to Contents
Primary Knee Arthroplasty for Osteoarthritis
Number of Discharges by Age Group
Key Findings: • Adults age 65 and older had the highest discharges with primary knee arthroplasty for osteoarthritis, at
about 58,500 discharges per quarter in 2003 and increasing to 88,500 discharges per quarter in 2010.
• Adults ages 45 to 64 had the next highest discharges, at about 34,500 discharges per quarter in 2003 and increasing to 64,000 discharges per quarter in 2010.
• Adults ages 18 to 44 had the lowest discharges, at about 2,000 discharges per quarter in 2003 and increasing to 2,500 discharges per quarter in 2010.
Source: Agency for Healthcare Research and Quality, Center for Delivery, Organization, and Markets, Healthcare Cost and Utilization Project, State Inpatient Databases.

HCUP Projections:
Mobility/Orthopedic Procedures
HCUP (09/07/12) 63 HCUP Orthopedic Projections
Return to Contents
Primary Knee Arthroplasty for Osteoarthritis
Number of Discharges by Gender
Key Findings: • Females had about 35,000 more quarterly discharges with primary knee arthroplasty for osteoarthritis
than did males.
• Females had about 61,500 discharges per quarter in 2003, increasing to 97,500 discharges per quarter in 2010.
• Males had about 33,500 discharges per quarter in 2003, increasing to 57,500 discharges per quarter in 2010.
Source: Agency for Healthcare Research and Quality, Center for Delivery, Organization, and Markets, Healthcare Cost and Utilization Project, State Inpatient Databases.

HCUP Projections:
Mobility/Orthopedic Procedures
HCUP (09/07/12) 64 HCUP Orthopedic Projections
Return to Contents
Primary Knee Arthroplasty for Osteoarthritis
Number of Discharges by Income (Lowest Compared to Highest Quartile)
Key Findings: • The number of discharges with primary knee arthroplasty for osteoarthritis was similar for adults
residing in the lowest and highest income communities, at about 20,500 discharges per quarter in 2003 and increasing to 36,000 discharges per quarter in 2010.
Source: Agency for Healthcare Research and Quality, Center for Delivery, Organization, and Markets, Healthcare Cost and Utilization Project, State Inpatient Databases.

HCUP Projections:
Mobility/Orthopedic Procedures
HCUP (09/07/12) 65 HCUP Orthopedic Projections
Return to Contents
Primary Knee Arthroplasty for Osteoarthritis
Average Total Hospital Cost for All Adults
Key Findings: • The average hospital cost for discharges with primary knee arthroplasty for osteoarthritis increased
over time, from about $12,500 in 2003 to $16,000 in 2010.
• The increasing trend is projected to continue in 2011 and 2012, with the average hospital cost projected to be about $17,500 at the end of 2012.
• Using the Gross Domestic Product, a cost of $12,500 in 2003 would be equivalent to a cost of $15,000 at the end of 2010.
• The average hospital cost through 2010 remained relatively consistent with the cost expected by inflation alone.
Inflation-adjusted Q1 2003 Costs: Cost per admission in the first quarter of 2003, adjusted for economy-wide inflation. Source: Agency for Healthcare Research and Quality, Center for Delivery, Organization, and Markets, Healthcare Cost and Utilization Project, State Inpatient Databases.

HCUP Projections:
Mobility/Orthopedic Procedures
HCUP (09/07/12) 66 HCUP Orthopedic Projections
Return to Contents
Primary Knee Arthroplasty for Osteoarthritis
Average Total Hospital Cost by Age Group
Key Findings: • The average hospital cost for discharges with primary knee arthroplasty for osteoarthritis was similar
for all three age groups, increasing from about $12,500 in 2003 to $16,000 in 2010.
Inflation-adjusted Q1 2003 Costs: Cost per admission in the first quarter of 2003, adjusted for economy-wide inflation. Source: Agency for Healthcare Research and Quality, Center for Delivery, Organization, and Markets, Healthcare Cost and Utilization Project, State Inpatient Databases.

HCUP Projections:
Mobility/Orthopedic Procedures
HCUP (09/07/12) 67 HCUP Orthopedic Projections
Return to Contents
Primary Knee Arthroplasty for Osteoarthritis
Average Total Hospital Cost by Gender
Key Findings: • The average hospital cost for discharges with primary knee arthroplasty for osteoarthritis was similar
for males and females, increasing from about $12,500 in 2003 to $16,000 in 2010.
Inflation-adjusted Q1 2003 Costs: Cost per admission in the first quarter of 2003, adjusted for economy-wide inflation. Source: Agency for Healthcare Research and Quality, Center for Delivery, Organization, and Markets, Healthcare Cost and Utilization Project, State Inpatient Databases.

HCUP Projections:
Mobility/Orthopedic Procedures
HCUP (09/07/12) 68 HCUP Orthopedic Projections
Return to Contents
Primary Knee Arthroplasty for Osteoarthritis
Average Total Hospital Cost by Income (Lowest Compared to Highest Quartile)
Key Findings: • The average hospital cost for discharges with primary knee arthroplasty for osteoarthritis was similar
for adults residing in the lowest and highest income communities, increasing from about $12,500 in 2003 to $16,000 in 2010.
Inflation-adjusted Q1 2003 Costs: Cost per admission in the first quarter of 2003, adjusted for economy-wide inflation. Source: Agency for Healthcare Research and Quality, Center for Delivery, Organization, and Markets, Healthcare Cost and Utilization Project, State Inpatient Databases.

HCUP Projections:
Mobility/Orthopedic Procedures
HCUP (09/07/12) 69 HCUP Orthopedic Projections
Return to Contents
Primary Knee Arthroplasty for Osteoarthritis
Average Length of Stay for All Adults
Key Findings: • The average length of stay for discharges with primary knee arthroplasty for osteoarthritis decreased
over time, from 4.0 days in 2003 to 3.3 days in 2010.
• The decreasing trend is projected to continue in 2011 and 2012, with the length of stay projected to be 3.1 days at the end of 2012.
Source: Agency for Healthcare Research and Quality, Center for Delivery, Organization, and Markets, Healthcare Cost and Utilization Project, State Inpatient Databases.

HCUP Projections:
Mobility/Orthopedic Procedures
HCUP (09/07/12) 70 HCUP Orthopedic Projections
Return to Contents
Primary Knee Arthroplasty for Osteoarthritis
Average Length of Stay by Age Group
Key Findings: • Adults ages 45 to 64 had a length of stay for discharges with primary knee arthroplasty for
osteoarthritis that was similar to the length of stay for the other two age groups.
• Adults ages 45 to 64 had a decrease in length of stay, from 3.9 days in 2003 to 3.2 days in 2010.
• Adults age 65 and older had the longest length of stay, at 4.1 days in 2003 and decreasing to 3.4 days in 2010.
• Adults ages 18 to 44 had the shortest length of stay, at 3.7 days in 2003 and decreasing to 3.1 days in 2010.
Source: Agency for Healthcare Research and Quality, Center for Delivery, Organization, and Markets, Healthcare Cost and Utilization Project, State Inpatient Databases.

HCUP Projections:
Mobility/Orthopedic Procedures
HCUP (09/07/12) 71 HCUP Orthopedic Projections
Return to Contents
Primary Knee Arthroplasty for Osteoarthritis
Average Length of Stay by Gender
Key Findings: • Length of stay for discharges with primary knee arthroplasty for osteoarthritis was similar for males and
females, decreasing from 4.0 days in 2003 to 3.3 days in 2010.
Source: Agency for Healthcare Research and Quality, Center for Delivery, Organization, and Markets, Healthcare Cost and Utilization Project, State Inpatient Databases.

HCUP Projections:
Mobility/Orthopedic Procedures
HCUP (09/07/12) 72 HCUP Orthopedic Projections
Return to Contents
Primary Knee Arthroplasty for Osteoarthritis
Average Length of Stay by Income (Lowest Compared to Highest Quartile)
Key Findings: • Length of stay for discharges with primary knee arthroplasty for osteoarthritis was similar for adults
residing in the lowest and highest income communities, decreasing from 4.1 days in 2003 to 3.3 days in 2010.
Source: Agency for Healthcare Research and Quality, Center for Delivery, Organization, and Markets, Healthcare Cost and Utilization Project, State Inpatient Databases.

HCUP Projections:
Mobility/Orthopedic Procedures
HCUP (09/07/12) 73 HCUP Orthopedic Projections
Return to Contents
This page intentionally left blank.

HCUP Projections:
Mobility/Orthopedic Procedures
HCUP (09/07/12) 74 HCUP Orthopedic Projections
Return to Contents
Knee Replacement Revision Surgery
Knee replacement revision surgery involves replacing part or all of an artificial (prosthetic) knee that is no longer functioning properly. Patients may undergo revision surgery if they are experiencing pain or have lost mobility with the current prosthetic knee. Using the HCUP SID from 2003 to 2010 and early 2011 data from 10 States, different outcomes for inpatient discharges with knee replacement revision surgery are projected for 2011 to 2012.
Projections include the following:
• Total inpatient discharges for all adults, adults by age group, adults by gender, and adults by community income quartile. Discharge counts exclude inpatient stays that were transferred out to another acute care hospital. This ensures that these events are not double counted.
• Average total hospital cost for all adults, adults by age group, adults by gender, and adults by community income quartile. Average total hospital cost reflects actual expenses incurred in the production of hospital services; physician costs are not included. For comparison, a line is included that depicts the change in the average inpatient hospital cost per admission in the first quarter of 2003 (Q1 2003) due solely to economy-wide inflation. The difference between the actual/projected cost line and the inflation-adjusted Q1 2003 cost line represents cost increases due to other non-inflation factors, such as new technology or patient case mix.
• Average length of stay for all adults, adults by age group, adults by gender, and adults by community income quartile. In HCUP, the length of stay counts nights spent in the hospital. If a patient is admitted and discharged on the same day, the length of stay is zero.

HCUP Projections:
Mobility/Orthopedic Procedures
HCUP (09/07/12) 75 HCUP Orthopedic Projections
Return to Contents
Knee Replacement Revision Surgery
Number of Discharges for All Adults
Key Findings: • The number of discharges with knee replacement revision surgery increased over time, from about
8,500 discharges per quarter in 2003 to 13,500 discharges per quarter in 2010.
• The increasing trend is projected to continue in 2011 and 2012, with quarterly discharges projected to be about 15,500 at the end of 2012.
Source: Agency for Healthcare Research and Quality, Center for Delivery, Organization, and Markets, Healthcare Cost and Utilization Project, State Inpatient Databases.

HCUP Projections:
Mobility/Orthopedic Procedures
HCUP (09/07/12) 76 HCUP Orthopedic Projections
Return to Contents
Knee Replacement Revision Surgery
Number of Discharges by Age Group
Key Findings: • Adults age 65 and older had the highest discharges with knee replacement revision surgery, at about
5,000 discharges per quarter in 2003 and increasing to 7,000 discharges per quarter in 2010.
• Adults ages 45 to 64 had the next highest discharges, at about 3,000 discharges per quarter in 2003 and increasing to 6,000 discharges per quarter in 2010.
• Adults ages 18 to 44 had the lowest discharges, at about 350 discharges per quarter in 2003 and increasing to 450 discharges per quarter in 2010.
Source: Agency for Healthcare Research and Quality, Center for Delivery, Organization, and Markets, Healthcare Cost and Utilization Project, State Inpatient Databases.

HCUP Projections:
Mobility/Orthopedic Procedures
HCUP (09/07/12) 77 HCUP Orthopedic Projections
Return to Contents
Knee Replacement Revision Surgery
Number of Discharges by Gender
Key Findings: • Females had about 2,000 more quarterly discharges with knee replacement revision surgery than did
males.
• Females had about 5,000 discharges per quarter in 2003, increasing to 8,000 discharges per quarter in 2010.
• Males had about 3,500 discharges per quarter in 2003, increasing to 5,500 discharges per quarter in 2010.
Source: Agency for Healthcare Research and Quality, Center for Delivery, Organization, and Markets, Healthcare Cost and Utilization Project, State Inpatient Databases.

HCUP Projections:
Mobility/Orthopedic Procedures
HCUP (09/07/12) 78 HCUP Orthopedic Projections
Return to Contents
Knee Replacement Revision Surgery
Number of Discharges by Income (Lowest Compared to Highest Quartile)
Key Findings: • The number of discharges with knee replacement revision surgery was similar for adults residing in the
lowest and highest income communities, at about 2,000 discharges per quarter in 2003 and increasing to 3,000 discharges per quarter in 2010.
Source: Agency for Healthcare Research and Quality, Center for Delivery, Organization, and Markets, Healthcare Cost and Utilization Project, State Inpatient Databases.

HCUP Projections:
Mobility/Orthopedic Procedures
HCUP (09/07/12) 79 HCUP Orthopedic Projections
Return to Contents
Knee Replacement Revision Surgery
Average Total Hospital Cost for All Adults
Key Findings: • The average hospital cost for discharges with knee replacement revision surgery increased over time,
from about $15,000 in 2003 to $22,000 in 2010.
• The increasing trend is projected to continue in 2011 and 2012, with the average hospital cost projected to be about $25,000 at the end of 2012.
• Using the Gross Domestic Product (GDP) price index, a cost of $15,000 in 2003 would be equivalent to a cost of $18,000 at the end of 2010.
• By 2010, the average hospital cost exceeded the cost expected by inflation alone.
Inflation-adjusted Q1 2003 Costs: Cost per admission in the first quarter of 2003, adjusted for economy-wide inflation. Source: Agency for Healthcare Research and Quality, Center for Delivery, Organization, and Markets, Healthcare Cost and Utilization Project, State Inpatient Databases.

HCUP Projections:
Mobility/Orthopedic Procedures
HCUP (09/07/12) 80 HCUP Orthopedic Projections
Return to Contents
Knee Replacement Revision Surgery
Average Total Hospital Cost by Age Group
Key Findings: • The average hospital cost for discharges with knee replacement revision surgery was similar for all
three age groups, increasing from about $15,000 in 2003 to $21,500 in 2010.
Inflation-adjusted Q1 2003 Costs: Cost per admission in the first quarter of 2003, adjusted for economy-wide inflation. Source: Agency for Healthcare Research and Quality, Center for Delivery, Organization, and Markets, Healthcare Cost and Utilization Project, State Inpatient Databases.

HCUP Projections:
Mobility/Orthopedic Procedures
HCUP (09/07/12) 81 HCUP Orthopedic Projections
Return to Contents
Knee Replacement Revision Surgery
Average Total Hospital Cost by Gender
Key Findings: • The average hospital cost for discharges with knee replacement revision surgery was similar for males
and females, increasing from about $15,500 in 2003 to $22,000 in 2010.
Inflation-adjusted Q1 2003 Costs: Cost per admission in the first quarter of 2003, adjusted for economy-wide inflation. Source: Agency for Healthcare Research and Quality, Center for Delivery, Organization, and Markets, Healthcare Cost and Utilization Project, State Inpatient Databases.

HCUP Projections:
Mobility/Orthopedic Procedures
HCUP (09/07/12) 82 HCUP Orthopedic Projections
Return to Contents
Knee Replacement Revision Surgery
Average Total Hospital Cost by Income (Lowest Compared to Highest Quartile)
Key Findings: • The average hospital cost for discharges with knee replacement revision surgery was similar for adults
residing in the lowest and highest income communities, increasing from about $15,500 in 2003 to $22,000 in 2010.
Inflation-adjusted Q1 2003 Costs: Cost per admission in the first quarter of 2003, adjusted for economy-wide inflation. Source: Agency for Healthcare Research and Quality, Center for Delivery, Organization, and Markets, Healthcare Cost and Utilization Project, State Inpatient Databases.

HCUP Projections:
Mobility/Orthopedic Procedures
HCUP (09/07/12) 83 HCUP Orthopedic Projections
Return to Contents
Knee Replacement Revision Surgery
Average Length of Stay for All Adults
Key Findings: • The average length of stay for discharges with knee replacement revision surgery decreased over
time, from 4.9 days in 2003 to 4.3 days in 2010.
• The decreasing trend is projected to continue in 2011 and 2012, with the length of stay projected to be 4.0 days at the end of 2012.
Source: Agency for Healthcare Research and Quality, Center for Delivery, Organization, and Markets, Healthcare Cost and Utilization Project, State Inpatient Databases.

HCUP Projections:
Mobility/Orthopedic Procedures
HCUP (09/07/12) 84 HCUP Orthopedic Projections
Return to Contents
Knee Replacement Revision Surgery
Average Length of Stay by Age Group
Key Findings: • Adults age 65 and older had the longest length of stay for discharges with knee replacement revision
surgery, at 5.1 days in 2003 and decreasing to 4.5 days in 2010.
• The two youngest age groups had similar lengths of stay, at 4.6 days in 2003 and decreasing to 4.0 days in 2010.
Source: Agency for Healthcare Research and Quality, Center for Delivery, Organization, and Markets, Healthcare Cost and Utilization Project, State Inpatient Databases.

HCUP Projections:
Mobility/Orthopedic Procedures
HCUP (09/07/12) 85 HCUP Orthopedic Projections
Return to Contents
Knee Replacement Revision Surgery
Average Length of Stay by Gender
Key Findings: • Length of stay for discharges with knee replacement revision surgery was similar for males and
females, decreasing from 4.9 days in 2003 to 4.2 days in 2010.
Source: Agency for Healthcare Research and Quality, Center for Delivery, Organization, and Markets, Healthcare Cost and Utilization Project, State Inpatient Databases.

HCUP Projections:
Mobility/Orthopedic Procedures
HCUP (09/07/12) 86 HCUP Orthopedic Projections
Return to Contents
Knee Replacement Revision Surgery
Average Length of Stay by Income (Lowest Compared to Highest Quartile)
Key Findings: • Length of stay for discharges with knee replacement revision surgery was similar for adults residing in
the lowest and highest income communities, decreasing from 5.0 days in 2003 to 4.3 days in 2010.
Source: Agency for Healthcare Research and Quality, Center for Delivery, Organization, and Markets, Healthcare Cost and Utilization Project, State Inpatient Databases.

HCUP Projections:
Mobility/Orthopedic Procedures
HCUP (09/07/12) 87 HCUP Orthopedic Projections
Return to Contents
This page intentionally left blank.

HCUP Projections:
Mobility/Orthopedic Procedures
HCUP (09/07/12) 88 HCUP Orthopedic Projections
Return to Contents
Spinal Fusion for Back Problems
Spinal fusion for back problems, such as spondylosis (degenerative back osteoarthritis) or intervertebral disc disorders, involves joining two or more of the vertebrae in the back in order to alleviate back pain and improve spine stability. Using the HCUP SID from 2003 to 2010 and early 2011 data from 10 States, different outcomes for inpatient discharges with spinal fusion for back problems are projected for 2011 to 2012.
Projections include the following:
• Total inpatient discharges for all adults, adults by age group, adults by gender, and adults by community income quartile. Discharge counts exclude inpatient stays that were transferred out to another acute care hospital. This ensures that these events are not double counted.
• Average total hospital cost for all adults, adults by age group, adults by gender, and adults by community income quartile. Average total hospital cost reflects actual expenses incurred in the production of hospital services; physician costs are not included. For comparison, a line is included that depicts the change in the average inpatient hospital cost per admission in the first quarter of 2003 (Q1 2003) due solely to economy-wide inflation. The difference between the actual/projected cost line and the inflation-adjusted Q1 2003 cost line represents cost increases due to other non-inflation factors, such as new technology or patient case mix.
• Average length of stay for all adults, adults by age group, adults by gender, and adults by community income quartile. In HCUP, the length of stay counts nights spent in the hospital. If a patient is admitted and discharged on the same day, the length of stay is zero.

HCUP Projections:
Mobility/Orthopedic Procedures
HCUP (09/07/12) 89 HCUP Orthopedic Projections
Return to Contents
Spinal Fusion for Back Problems
Number of Discharges for All Adults
Key Findings: • The number of discharges with spinal fusion for back problems increased over time, from about 61,500
discharges per quarter in 2003 to 82,500 discharges per quarter in 2010.
• The increasing trend is projected to continue in 2011 and 2012, with quarterly discharges projected to be about 89,000 at the end of 2012.
Source: Agency for Healthcare Research and Quality, Center for Delivery, Organization, and Markets, Healthcare Cost and Utilization Project, State Inpatient Databases.

HCUP Projections:
Mobility/Orthopedic Procedures
HCUP (09/07/12) 90 HCUP Orthopedic Projections
Return to Contents
Spinal Fusion for Back Problems
Number of Discharges by Age Group
Key Findings: • Adults ages 45 to 64 had the highest discharges with spinal fusion for back problems, at about 30,000
discharges per quarter in 2003 and increasing to 42,500 discharges per quarter in 2010.
• Adults ages 18 to 44 had the next highest discharges in 2003, at about 19,500 discharges per quarter, but decreased to 17,500 discharges per quarter in 2010, having the lowest discharges.
• Adults age 65 and older had the lowest discharges in 2003 at about 11,500 discharges per quarter, but increased to 22,500 discharges per quarter in 2010, having the second highest discharges.
Source: Agency for Healthcare Research and Quality, Center for Delivery, Organization, and Markets, Healthcare Cost and Utilization Project, State Inpatient Databases.

HCUP Projections:
Mobility/Orthopedic Procedures
HCUP (09/07/12) 91 HCUP Orthopedic Projections
Return to Contents
Spinal Fusion for Back Problems
Number of Discharges by Gender
Key Findings: • Females had about 4,500 more quarterly discharges with spinal fusion for back problems than did
males.
• Females had about 32,500 discharges per quarter in 2003, increasing to 43,500 discharges per quarter in 2010.
• Males had about 29,000 discharges per quarter in 2003, increasing to 39,000 discharges per quarter in 2010.
Source: Agency for Healthcare Research and Quality, Center for Delivery, Organization, and Markets, Healthcare Cost and Utilization Project, State Inpatient Databases.

HCUP Projections:
Mobility/Orthopedic Procedures
HCUP (09/07/12) 92 HCUP Orthopedic Projections
Return to Contents
Spinal Fusion for Back Problems
Number of Discharges by Income (Lowest Compared to Highest Quartile)
Key Findings: • The number of discharges with spinal fusion for back problems was similar for adults residing in the
lowest and highest income communities, at about 13,500 discharges per quarter in 2003 and increasing to 19,000 discharges per quarter in 2010.
Source: Agency for Healthcare Research and Quality, Center for Delivery, Organization, and Markets, Healthcare Cost and Utilization Project, State Inpatient Databases.

HCUP Projections:
Mobility/Orthopedic Procedures
HCUP (09/07/12) 93 HCUP Orthopedic Projections
Return to Contents
Spinal Fusion for Back Problems
Average Total Hospital Cost for All Adults
Key Findings: • The average hospital cost for discharges with spinal fusion for back problems increased over time,
from about $15,500 in 2003 to $24,500 in 2010.
• The increasing trend is projected to continue in 2011 and 2012, with the average hospital cost projected to be about $27,500 at the end of 2012.
• Using the Gross Domestic Product (GDP) price index, a cost of $15,500 in 2003 would be equivalent to a cost of $18,500 at the end of 2010.
• By 2010, the average hospital cost exceeded the cost expected by inflation alone.
Inflation-adjusted Q1 2003 Costs: Cost per admission in the first quarter of 2003, adjusted for economy-wide inflation. Source: Agency for Healthcare Research and Quality, Center for Delivery, Organization, and Markets, Healthcare Cost and Utilization Project, State Inpatient Databases.

HCUP Projections:
Mobility/Orthopedic Procedures
HCUP (09/07/12) 94 HCUP Orthopedic Projections
Return to Contents
Spinal Fusion for Back Problems
Average Total Hospital Cost by Age Group
Key Findings: • Adults age 65 and older had the highest average hospital cost for discharges with spinal fusion for
back problems, at about $17,500 in 2003 and increasing to $26,500 in 2010.
• The two youngest age groups had similar average hospital cost, at about $15,000 in 2003 and increasing to $23,000 in 2010.
Inflation-adjusted Q1 2003 Costs: Cost per admission in the first quarter of 2003, adjusted for economy-wide inflation. Source: Agency for Healthcare Research and Quality, Center for Delivery, Organization, and Markets, Healthcare Cost and Utilization Project, State Inpatient Databases.

HCUP Projections:
Mobility/Orthopedic Procedures
HCUP (09/07/12) 95 HCUP Orthopedic Projections
Return to Contents
Spinal Fusion for Back Problems
Average Total Hospital Cost by Gender
Key Findings: • The average hospital cost for discharges with spinal fusion for back problems was similar for males
and females, increasing from about $15,500 in 2003 to $24,500 in 2010.
Inflation-adjusted Q1 2003 Costs: Cost per admission in the first quarter of 2003, adjusted for economy-wide inflation. Source: Agency for Healthcare Research and Quality, Center for Delivery, Organization, and Markets, Healthcare Cost and Utilization Project, State Inpatient Databases.

HCUP Projections:
Mobility/Orthopedic Procedures
HCUP (09/07/12) 96 HCUP Orthopedic Projections
Return to Contents
Spinal Fusion for Back Problems
Average Total Hospital Cost by Income (Lowest Compared to Highest Quartile)
Key Findings: • The average hospital cost for discharges with spinal fusion for back problems was similar for adults
residing in the lowest and highest income communities, increasing from about $15,500 in 2003 to $24,500 in 2010.
Inflation-adjusted Q1 2003 Costs: Cost per admission in the first quarter of 2003, adjusted for economy-wide inflation. Source: Agency for Healthcare Research and Quality, Center for Delivery, Organization, and Markets, Healthcare Cost and Utilization Project, State Inpatient Databases.

HCUP Projections:
Mobility/Orthopedic Procedures
HCUP (09/07/12) 97 HCUP Orthopedic Projections
Return to Contents
Spinal Fusion for Back Problems
Average Length of Stay for All Adults
Key Findings: • The average length of stay for discharges with spinal fusion for back problems remained relatively
stable over time at about 3.2 days.
• Length of stay is projected to be 3.0 days at the end of 2012.
Source: Agency for Healthcare Research and Quality, Center for Delivery, Organization, and Markets, Healthcare Cost and Utilization Project, State Inpatient Databases.

HCUP Projections:
Mobility/Orthopedic Procedures
HCUP (09/07/12) 98 HCUP Orthopedic Projections
Return to Contents
Spinal Fusion for Back Problems
Average Length of Stay by Age Group
Key Findings: • Adults age 65 and older had the longest length of stay for discharges with spinal fusion for back
problems, at 4.7 days in 2003 and decreasing to 3.9 days in 2010.
• Adults ages 45 to 64 had the next longest length of stay, remaining relatively stable over time at about 3.0 days.
• Adults ages 18 to 44 had the shortest length of stay, remaining relatively stable over time at about 2.6 days.
Source: Agency for Healthcare Research and Quality, Center for Delivery, Organization, and Markets, Healthcare Cost and Utilization Project, State Inpatient Databases.

HCUP Projections:
Mobility/Orthopedic Procedures
HCUP (09/07/12) 99 HCUP Orthopedic Projections
Return to Contents
Spinal Fusion for Back Problems
Average Length of Stay by Gender
Key Findings: • Length of stay for discharges with spinal fusion for back problems was similar for males and females,
remaining relatively stable over time at about 3.2 days.
Source: Agency for Healthcare Research and Quality, Center for Delivery, Organization, and Markets, Healthcare Cost and Utilization Project, State Inpatient Databases.

HCUP Projections:
Mobility/Orthopedic Procedures
HCUP (09/07/12) 100 HCUP Orthopedic Projections
Return to Contents
Spinal Fusion for Back Problems
Average Length of Stay by Income (Lowest Compared to Highest Quartile)
Key Findings: • Length of stay for discharges with spinal fusion for back problems was similar for adults residing in the
lowest and highest income communities, remaining relatively stable over time at about 3.3 days.
Source: Agency for Healthcare Research and Quality, Center for Delivery, Organization, and Markets, Healthcare Cost and Utilization Project, State Inpatient Databases.

HCUP Projections:
Mobility/Orthopedic Procedures
HCUP (09/07/12) 101 HCUP Orthopedic Projections
Return to Contents
This page intentionally left blank.

HCUP Projections:
Mobility/Orthopedic Procedures
HCUP (09/07/12) 102 HCUP Orthopedic Projections
Return to Contents
Appendix I: HCUP Data Partners Alaska State Hospital and Nursing Home Association
Arizona Department of Health Services
Arkansas Department of Health
California Office of Statewide Health Planning and Development
Colorado Hospital Association
Connecticut Hospital Association
Florida Agency for Health Care Administration
Georgia Hospital Association
Hawaii Health Information Corporation
Illinois Department of Public Health
Indiana Hospital Association
Iowa Hospital Association
Kansas Hospital Association
Kentucky Cabinet for Health and Family Services
Louisiana Department of Health and Hospitals
Maine Health Data Organization
Maryland Health Services Cost Review Commission
Massachusetts Division of Health Care Finance and Policy
Michigan Health & Hospital Association
Minnesota Hospital Association
Mississippi Department of Health
Missouri Hospital Industry Data Institute
Montana MHA - An Association of Montana Health Care Providers
Nebraska Hospital Association
Nevada Department of Health and Human Services
New Hampshire Department of Health & Human Services
New Jersey Department of Health
New Mexico Department of Health
New York State Department of Health
North Carolina Department of Health and Human Services
Ohio Hospital Association
Oklahoma State Department of Health
Oregon Association of Hospitals and Health Systems
Oregon Health Policy and Research
Pennsylvania Health Care Cost Containment Council
Rhode Island Department of Health
South Carolina State Budget & Control Board
South Dakota Association of Healthcare Organizations
Tennessee Hospital Association
Texas Department of State Health Services Utah Department of Health
Vermont Association of Hospitals and Health Systems
Virginia Health Information
Washington State Department of Health
West Virginia Health Care Authority
Wisconsin Department of Health Services
Wyoming Hospital Association

HCUP Projections:
Mobility/Orthopedic Procedures
HCUP (09/07/12) 103 HCUP Orthopedic Projections
Return to Contents
Appendix II: Definitions for Mobility/Orthopedic Procedures This section includes the coding criteria used to identify adult discharges with mobility/orthopedic procedures. Coding criteria are based on either International Classification of Diseases, Ninth Revision, Clinical Modification (ICD-9-CM) codes or the HCUP Clinical Classifications Software (CCS). CCS categorizes ICD-9-CM diagnoses and procedures into a manageable number of clinically meaningful categories.5 This "clinical grouper" makes it easier to quickly understand patterns of diagnoses and procedures. Mobility/orthopedic procedures may be reported as a principal or secondary procedure during the inpatient stay. Outcomes of interest include the following:
• Discharge counts: Number of discharges that meet the mobility/orthopedic coding criteria, excluding discharges transferred out to another acute care hospital
• Average total hospital cost:
Total cost for discharges that meet the mobility/orthopedic coding criteria, including transfers
Discharge counts (definition above)
• Average length of stay: Total days for discharges that meet the mobility/orthopedic coding criteria,
including transfers Discharge counts (definition above)
Outcome of interest also reported by adult age group (18–44, 45–64, and 65 and above), by gender, and by community-level income (lowest vs. highest income quartile).
5 HCUP CCS. Healthcare Cost and Utilization Project (HCUP). June 2009. U.S. Agency for Healthcare Research and Quality, Rockville, MD. www.hcup-us.ahrq.gov/toolssoftware/ccs/ccs.jsp.

HCUP Projections:
Mobility/Orthopedic Procedures
HCUP (09/07/12) 104 HCUP Orthopedic Projections
Return to Contents
Appendix II: Definitions for Mobility/Orthopedic Procedures
Primary Hip Replacement for Any Reason
Coding criteria:
Adult discharge (age 18 and older) with a principal or secondary procedure in CCS 153 Hip replacement; total and partial excluding discharges with any one of the following ICD-9-CM procedure codes:
• 00.70 Revision of hip replacement, both acetabular and femoral components
• 00.71 Revision of hip replacement, acetabular component • 00.72 Revision of hip replacement, femoral component • 00.73 Revision of hip replacement, acetabular liner and/or femoral
head only • 81.53 Revision of hip replacement, not otherwise specified
Primary Hip Replacement for Osteoarthritis
Coding criteria:
Adult discharge (age 18 and older) with a principal or secondary procedure in CCS 153 Hip replacement; total and partial and a principal diagnosis in CCS 203 Osteoarthritis excluding discharges with any one of the following ICD-9-CM procedure codes:
• 00.70 Revision of hip replacement, both acetabular and femoral components
• 00.71 Revision of hip replacement, acetabular component • 00.72 Revision of hip replacement, femoral component • 00.73 Revision of hip replacement, acetabular liner and/or femoral
head only • 81.53 Revision of hip replacement, not otherwise specified
Primary Hip Replacement for Hip Fracture
Coding criteria:
Adult discharge (age 18 and older) with a principal or secondary procedure in CCS 153 Hip replacement; total and partial and a principal diagnosis in CCS 226 Fracture of neck of femur (hip) excluding discharges with any one of the following ICD-9-CM procedure codes:
• 00.70 Revision of hip replacement, both acetabular and femoral components
• 00.71 Revision of hip replacement, acetabular component • 00.72 Revision of hip replacement, femoral component • 00.73 Revision of hip replacement, acetabular liner and/or femoral
head only • 81.53 Revision of hip replacement, not otherwise specified

HCUP Projections:
Mobility/Orthopedic Procedures
HCUP (09/07/12) 105 HCUP Orthopedic Projections
Return to Contents
Appendix II: Definitions for Mobility/Orthopedic Procedures
Hip Replacement Revision Surgery
Coding criteria:
Adult discharge (age 18 and older) with a principal or secondary procedure in one of the following ICD-9-CM procedure codes:
• 00.70 Revision of hip replacement, both acetabular and femoral components
• 00.71 Revision of hip replacement, acetabular component • 00.72 Revision of hip replacement, femoral component • 00.73 Revision of hip replacement, acetabular liner and/or femoral
head only • 81.53 Revision of hip replacement, not otherwise specified
Primary Knee Arthroplasty for Osteoarthritis
Coding criteria:
Adult discharge (age 18 and older) with a principal or secondary procedure in CCS 152 Arthroplasty knee and a principal diagnosis in CCS 203 Osteoarthritis excluding discharges with any one of the following ICD-9-CM procedure codes:
• 00.80 Revision of knee replacement, total (all components) • 00.81 Revision of knee replacement, tibial component • 00.82 Revision of knee replacement, femoral component • 00.83 Revision of knee replacement, patellar component • 00.84 Revision of total knee replacement, tibial insert (liner) • 81.55 Revision of knee replacement, not otherwise specified
Knee Replacement Revision Surgery
Coding criteria:
Adult discharge (age 18 and older) with a principal or secondary procedure in one of the following ICD-9-CM procedure codes:
• 00.80 Revision of knee replacement, total (all components) • 00.81 Revision of knee replacement, tibial component • 00.82 Revision of knee replacement, femoral component • 00.83 Revision of knee replacement, patellar component • 00.84 Revision of total knee replacement, tibial insert (liner) • 81.55 Revision of knee replacement, not otherwise specified

HCUP Projections:
Mobility/Orthopedic Procedures
HCUP (09/07/12) 106 HCUP Orthopedic Projections
Return to Contents
Appendix II: Definitions for Mobility/Orthopedic Procedures
Spinal Fusion for Back Problems
Coding criteria:
Adult discharge (age 18 and older) with a principal or secondary procedure in CCS 158 Spinal fusion and a principal diagnosis in CCS 205 Spondylosis; intervertebral disc disorders; other back problems

HCUP Projections:
Mobility/Orthopedic Procedures
HCUP (09/07/12) 107 HCUP Orthopedic Projections
Return to Contents
Appendix III: Methods
This appendix describes the methods for projecting national outcomes of inpatient stays using the HCUP State Inpatient Databases (SID). The methodology leverages the breadth of States (up to 46) and longitudinal data (up to ten years) to improve the timeliness of estimates of inpatient statistics. The following factors make this initiative possible:
• the longitudinal nature of HCUP State databases
• the breadth of the databases across 46 States
• the capacity of our HCUP Partners to provide timely quarterly data
• the modeling expertise among HCUP staff, both Federal and contract
• the use of recently-released SAS Econometric Time Series® Software
• the automated assembly of analytic results into a streamlined, ready-to-deliver report using technology developed for another AHRQ product, the State Snapshots (developed in conjunction with the National Healthcare Quality and Disparities Reports).
HCUP includes the largest collection of longitudinal hospital care data in the United States, with all-payer, encounter-level information beginning in 1988. The number of HCUP Partners has expanded over the years to include an ever-larger percentage of hospital discharges nationwide. In fact, the 2010 HCUP State Inpatient Databases (SID) encompass more than 97 percent of all U.S. community hospital discharges, made possible by the data collection efforts of State data organizations, hospital associations, private data organizations, and the Federal government. The list of statewide data organizations that contribute to HCUP databases is available in Appendix I. Although full-year administrative hospital data typically lag the current calendar year by nine to 15 months, some HCUP Partner organizations can now produce quarterly data files within four to six months following the close of a quarter. This “early” data is used to inform the projection models.
Discharges from the SID were limited to those from hospitals that were open during any part of each calendar year and were designated as community hospitals by the American Hospital Association (AHA) Annual Survey of Hospitals, excluding rehabilitation hospitals. The definition of a community hospital was that used by the AHA: "all nonfederal short-term general and other specialty hospitals, excluding hospital units of institutions."
Projected outcomes include the following:
• Count of inpatient discharges
• Average total cost for inpatient stay
• Average length of stay

HCUP Projections:
Mobility/Orthopedic Procedures
HCUP (09/07/12) 108 HCUP Orthopedic Projections
Return to Contents
Appendix III: Methods
Total hospital charges were converted to costs using HCUP cost-to-charge ratios based on hospital accounting reports from the Centers for Medicare & Medicaid Services (CMS).6 Costs reflect the actual expenses incurred in the production of hospital services, such as wages, supplies and utility costs, while charges represent the amount a hospital billed for the case. For each hospital, a hospital-wide cost-to-charge ratio is used. Hospital charges reflect the amount the hospital billed for the entire hospital stay and does not include professional (physician) fees. Inflation adjustments were not applied to the observed total cost. Projected total costs will estimate inflated charges. In HCUP, the length of stay counts nights spent in the hospital. If a patient is admitted and discharged on the same day, the length of stay is zero. Each outcome is projected for the measures specified in Appendix II: Definitions.
Projections were generated using the SAS Time Series Forecasting System™ (Version 9.2).7 Projections were calculated first by State and then weighted proportionally to the nine Census divisions and the nation. For each State, the software automatically selected from among 40 different time series models the model with the lowest mean absolute percentage error (MAPE) for that State.
National quarterly trends were calculated as a weighted average of the State-level quarterly trends within each division. Each State’s weight was proportional to its total number of discharges (excluding newborns) as reported in the AHA Hospital Survey. These AHA-based weights were used throughout the period, 2003–2012. For 2011, we had early quarterly data for 10 States. The 2011 projections incorporated observed rates for these 10 States and incorporated rates estimated from time series models for the remaining States. For 2012, the projections were entirely based on rates estimated from time series models.
Table A summarizes the data available from States in each division and each State’s percentage of its division’s discharges. Rows highlighted in red represent States for which no data were available throughout the period. These missing States represent small percentages of the total division discharges except for the East South Central division, which is missing data from Alabama, constituting about 26% of discharges. The yellow cells in Table A indicate missing years of data for States that contributed to the projections. The green cells in Table A highlight States for which “early” 2011 data were incorporated into the projections. In the Middle Atlantic, Pacific, and West North Central divisions, States with early data represent more than half of the population in the division.
6 HCUP Cost-to-Charge Ratio Files (CCR). Healthcare Cost and Utilization Project (HCUP). U.S. Agency for Healthcare Research and Quality, Rockville, MD. www.hcup-us.ahrq.gov/db/state/costtocharge.jsp. 7 Large-Scale Automatic Forecasting Using Inputs and Calendar Events. White Paper, SAS Institute Inc., 2009.

HCUP Projections:
Mobility/Orthopedic Procedures
HCUP (09/07/12) 109 HCUP Orthopedic Projections
Return to Contents
Table A. Available Data for Orthopedic Projections
Calendar year
Total
Percent of 2010 Total Division
Discharges 2003 2004 2005 2006 2007 2008 2009 2010 2011
Qtrs Qtrs Qtrs Qtrs Qtrs Qtrs Qtrs Qtrs Qtrs Qtrs
Division State
4 4 4 4 4 4 4 4 0 32 27.9 East North Central
IL
IN 4 4 4 4 4 4 4 4 0 32 13.8
MI 4 4 4 4 4 4 4 4 0 32 21.4
OH 4 4 4 4 4 4 4 4 0 32 24.7
WI 4 4 4 4 4 4 4 4 0 32 12.2
East South Central
AL 0 0 0 0 0 0 0 0 0 0 25.7
KY 4 4 4 4 4 4 4 4 3 35 23.6
MS 0 0 0 0 0 0 0 4 0 4 16.2
TN 4 4 4 4 4 4 4 4 0 32 34.5
Middle Atlantic
NJ 4 4 4 4 4 4 4 4 4 36 21.3
NY 4 4 4 4 4 4 4 4 1 33 47.9
PA 4 0 0 0 0 4 4 4 0 16 30.7
Mountain AZ 4 4 4 4 4 4 4 4 2 34 30.1
CO 4 4 4 4 4 4 4 4 0 32 22.7
ID 0 0 0 0 0 0 0 0 0 0 7.0
MT 0 0 0 0 0 0 4 4 0 8 4.4
NM 0 0 0 0 0 0 4 4 0 8 9.0
NV 4 4 4 4 4 4 4 4 0 35 11.8
UT 4 4 4 4 4 4 4 4 0 35 12.7
WY 0 0 0 0 4 4 4 4 0 16 2.4
New England CT 4 4 4 4 4 4 4 4 0 35 24.5
MA 4 4 4 4 4 4 4 4 0 32 45.5
ME 4 0 0 4 4 4 4 4 0 24 9.2
NH 4 4 4 4 4 4 4 0 0 28 9.2
RI 4 4 4 4 4 4 4 4 0 32 7.3
VT 4 4 4 4 4 4 4 4 0 32 4.3

HCUP Projections:
Mobility/Orthopedic Procedures
HCUP (09/07/12) 110 HCUP Orthopedic Projections
Return to Contents
Calendar year
Total
Percent of 2010 Total Division
Discharges 2003 2004 2005 2006 2007 2008 2009 2010 2011
Qtrs Qtrs Qtrs Qtrs Qtrs Qtrs Qtrs Qtrs Qtrs Qtrs
Pacific AK 0 0 0 0 0 0 0 4 0 4 1.4
CA 4 4 4 4 4 4 4 4 2 34 75.1
HI 4 4 4 4 4 4 4 4 4 36 2.6
OR 4 4 4 4 4 4 4 4 0 32 7.7
WA 4 4 4 4 4 4 4 4 0 32 13.3
South Atlantic
DC 0 0 0 0 0 0 0 0 0 0 1.0
DE 0 0 0 0 0 0 0 0 0 0 1.5
FL 4 4 4 4 4 4 4 4 0 32 31.6
GA 4 4 4 4 4 4 4 4 4 36 16.7
MD 4 4 4 4 4 4 4 4 0 32 9.5
NC 4 4 4 4 4 4 4 4 0 32 15.8
SC 4 4 4 4 4 4 4 4 0 32 7.7
VA 4 4 0 4 4 4 4 4 3 31 13.2
WV 4 4 4 4 4 4 4 4 0 32 3.0
West North Central
IA 4 4 4 4 4 4 4 4 0 32 14.9
KS 4 4 4 4 4 4 4 4 0 32 13.9
MN 4 4 4 4 4 4 4 4 3 35 25.9
MO 4 4 4 4 4 4 4 4 4 36 29.3
ND 0 0 0 0 0 0 0 0 0 0 3.2
NE 4 4 4 4 4 4 4 4 0 32 8.8
SD 4 4 4 4 4 4 4 4 0 32 4.0
West South Central
AR 0 4 4 4 4 4 4 4 0 28 8.0
LA 0 0 0 0 0 4 4 4 0 12 12.4
OK 0 0 4 4 4 4 4 4 0 24 10.2
TX 4 4 4 4 4 4 4 4 0 32 69.3