mobility solutions, infrastructure, & sustainability
TRANSCRIPT

FY 2018-19 Annual Budget: Mobility Solutions, Infrastructure, & Sustainability
Majed Al-Ghafry, Assistant City Manager
City Council Briefing August 15, 2018

Overview• FY 2018-19 Budget by Strategic Priority• Strategic Priority Statement• Strategic Priority Budget Overview• FY 2018-19 Budget Highlights• Dallas 365 Measures• FY 2019-20 Planned Activities
2
Mobility Solutions, Infrastructure, & Sustainability

FY 2018-19 Budget by Strategic Priority
3
Mobility Solutions, Infrastructure, & Sustainability
General Fund only
Mobility Solutions, Infrastructure, &
Sustainability$145,589,762
11%

FY 2018-19 Budget by Strategic Priority
4
Mobility Solutions, Infrastructure, & Sustainability
All Funds
Mobility Solutions, Infrastructure, &
Sustainability$1,768,297,044
49%

Strategic Priority StatementDesign, build, and maintain the underlying structures necessary to support Dallas’ residents
5
Mobility Solutions, Infrastructure, & Sustainability
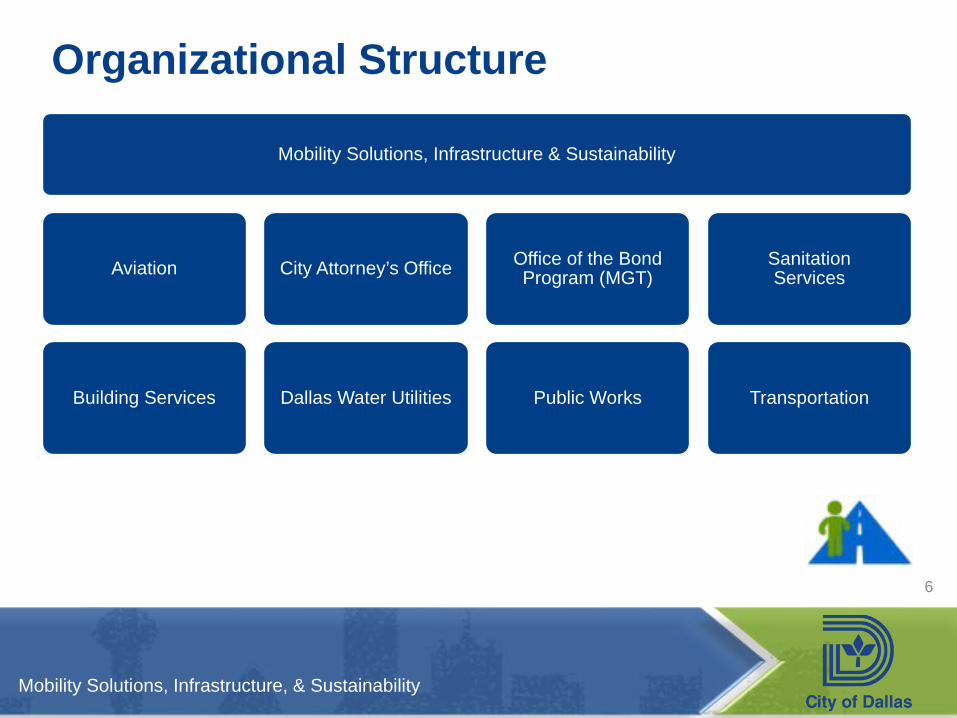
Organizational Structure
Mobility Solutions, Infrastructure & Sustainability
Aviation
Building Services
City Attorney’s Office
Dallas Water Utilities
Office of the Bond Program (MGT)
Public Works
SanitationServices
Transportation
6
Mobility Solutions, Infrastructure, & Sustainability

Strategic Priority Budget by Department
7
Mobility Solutions, Infrastructure, & Sustainability
General Fund only
City Attorney's Office$593,930
Public Works$75,781,653Transportation
$47,219,419
Building Services$21,994,760

Strategic Priority Budget by Department
8
Mobility Solutions, Infrastructure, & Sustainability
All Funds
Aviation$144,132,819
City Attorney's Office$593,930
Dallas Water Utilities$723,928,231
Public Works$75,781,653
Sanitation Services$112,653,465
Transportation$47,219,419
Building Services$21,994,760
Capital$501,783,699
Debt Service$140,209,068

FY 2018-19 Budget Highlights• Investing more than $125M of bonds and cash to
improve the condition of city streets• Leveraging $10M of federal Highway Safety
Improvement Program funds with approximately $2M in City funds to improve safety at high-crash locations
• Creating a cross-departmental pilot program to improve alley access for residents and utilities
• Combining water, wastewater, and stormwater into one utility to comprehensively manage Dallas’ valuable water resources
9
Mobility Solutions, Infrastructure, & Sustainability

FY 2018-19 Budget Highlights• Expanding bike lanes and improving mobility by
increasing the current $500K budget by $500K per year over each of the next three years to achieve a $2M per year investment starting in FY 2020-21
• Investing almost $2M in major signal repair, providing emergency response to traffic signal knockdowns and underground cable repairs, as well as replacing broken vehicle detectors at 40 traffic signals
• Reorganizing Equipment & Building Services into two departments to improve focus in critical areas
10
Mobility Solutions, Infrastructure, & Sustainability

FY 2018-19 Dallas 365 Measures
11
Mobility Solutions, Infrastructure, & Sustainability
Department Measure Target
Dallas Water Utilities Percentage of emergency service requests responded to within one hour* 100%
Dallas Water Utilities Water meter reading accuracy rate 99.5%
Office of the Bond Program Percentage of annual bond appropriation awarded* 90%
Public Works Number of street lane miles resurfaced 197
Public Works Percentage of potholes repaired within five days 98%
Public Works Percentage of streets with a Pavement Condition Index rating of C or better* 77.4%
Sanitation Services Missed refuse and recycling collections per 10,000 collection points/service opportunities 11
Sanitation Services Residential recycling diversion rate* 18%
Transportation Percentage of surveyed street lights on major streets that are working 96%
* Denotes new measure
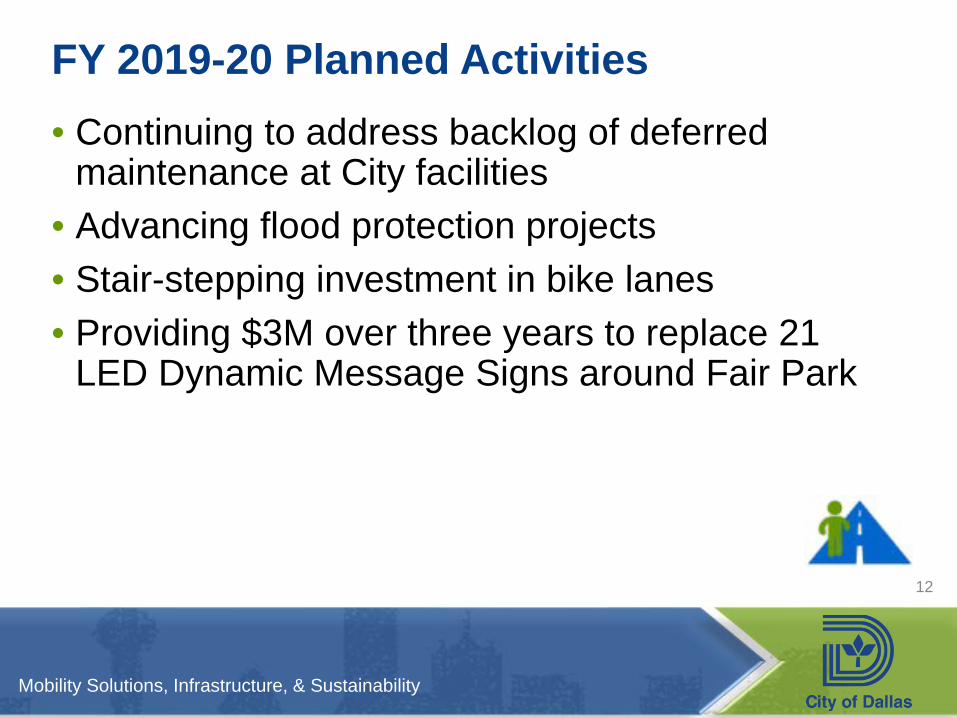
FY 2019-20 Planned Activities• Continuing to address backlog of deferred
maintenance at City facilities• Advancing flood protection projects• Stair-stepping investment in bike lanes• Providing $3M over three years to replace 21
LED Dynamic Message Signs around Fair Park
12
Mobility Solutions, Infrastructure, & Sustainability

FY 2018-19 Annual Budget: Mobility Solutions, Infrastructure, & Sustainability
Majed Al-Ghafry, Assistant City Manager
City Council Briefing August 15, 2018

Appendix• Community Survey Highlights• Services by Strategic Priority• FY 2017-18 Accomplishments
14
Mobility Solutions, Infrastructure, & Sustainability

Community Survey Highlights
15
Mobility Solutions, Infrastructure, & Sustainability
3.26%4.85%
6.03%6.87%
8.60%9.78%
10.68%12.83%
15.26%15.95%16.64%
17.55%18.17%
20.87%28.85%29.54%
52.70%54.92%
0% 10% 20% 30% 40% 50% 60%
DALLAS LOVE FIELD AIRPORTMUNICIPAL COURT SERVICES
PUBLIC INFORMATION SERVICESPUBLIC LIBRARY SERVICES
SEWER SERVICESSTORM DRAINAGE
ART AND CULTURAL PROGRAMS/FACILITIESCUSTOMER SERVICE PROVIDED BY CITY
LAND USE, PLANNING, AND ZONINGFIRE SERVICES
SOLID WASTE SERVICESPARK AND RECREATION SYSTEM
TRAFFIC SIGNAL TIMINGAMBULANCE/EMERGENCY MEDICAL SERVICES
DRINKING WATERNEIGHBORHOOD CODE ENFORCEMENT
POLICE SERVICESMAINTENANCE OF INFRASTRUCTURE
MAJOR SERVICE PRIORITIES

Community Survey Highlights (cont.)
16
Mobility Solutions, Infrastructure, & Sustainability
54%
50%
14%
12%
10%
9%
9%
8%
5%
3%
MAINTENANCE OF THOROUGHFARES/MAJOR STREETS
MAINTENANCE OF NEIGHBORHOOD STREETS
STREET LIGHTING
SIDEWALK MAINTENANCE
TRAFFIC SIGNS AND SIGNAL OPERATIONS
ALLEY MAINTENANCE
BIKE LANES IN THE CITY
STREET CLEANING
STREET STRIPING
CURBS AND GUTTERS
STREETS AND INFRASTRUCTURE PRIORITIES

Community Survey Highlights (cont.)
17
Mobility Solutions, Infrastructure, & Sustainability
12%
12%
10%
7%
8%
37%
33%
34%
25%
23%
33%
33%
35%
36%
37%
18%
22%
21%
32%
32%
EASE OF RAIL TRAVEL IN DALLAS
EASE OF BUS TRAVEL IN DALLAS
EASE OF CAR TRAVEL IN DALLAS
EASE OF WALKING IN DALLAS
EASE OF BICYCLE TRAVEL IN DALLAS
RATINGS OF COMMUNITY MOBILITYExcellent (4) Good (3) Fair(2) Poor (1)

Community Survey Highlights (cont.)
18
Mobility Solutions, Infrastructure, & Sustainability
8%
6%
5%
3%
4%
4%
3%
3%
5%
3%
46%
31%
27%
26%
24%
23%
23%
23%
20%
14%
32%
38%
33%
38%
32%
41%
37%
36%
32%
32%
14%
25%
35%
33%
40%
32%
37%
38%
43%
51%
TRAFFIC SIGNS AND SIGNAL OPERATIONS
STREET LIGHTING
STREET CLEANING
CURBS AND GUTTERS
BIKE LANES
STREET STRIPING
SIDEWALK MAINTENANCE
MAINTENANCE OF MAJOR STREETS
MAINTENANCE OF NEIGHBORHOOD STREETS
ALLEY MAINTENANCE
RATINGS OF STREETS AND INFRASTRUCTUREExcellent (4) Good (3) Fair(2) Poor (1)

Community Survey Highlights (cont.)
19
Mobility Solutions, Infrastructure, & Sustainability
36%
35%
30%
33%
27%
44%
41%
46%
45%
35%
13%
15%
17%
15%
24%
6%
8%
7%
7%
15%
GARBAGE COLLECT IONS
RECYCLING
YARD WAST E P ICKUP
BULK T RASH P ICKUP
HHW DISPOSAL
RATINGS OF SANITATION SERVICESExcellent (4) Good (3) Fair (2) Poor (1)

Services by Strategic PriorityFY 2018-19 Total
ProposedFY 2018-19 General Fund
ProposedAviationAviation Facilities – Dallas Executive Airport – Vertiport $3,796,075 $0Capital Construction and Debt Service $51,046,627 $0Dallas Love Field $88,884,243 $0Regulation and Enforcement of For-Hire Transportation $405,874 $0City Attorney's OfficeDFW International Airport Legal Counsel $593,930 $593,930Dallas Water UtilitiesDWU General Expense $94,889,454 $0Floodplain Drainage Management $2,917,083 $0Floodway/Neighborhood Drainage Operations $16,728,589 $0Storm Drainage Management Fund $32,454,319 $0Stormwater Regulations and Enforcement $6,336,846 $0Wastewater Collection $21,007,415 $0Wastewater Treatment $52,478,323 $0Water Capital Funding $323,324,047 $0Water Planning, Financial, and Rate Services $4,160,381 $0
20
Mobility Solutions, Infrastructure, & Sustainability

Services by Strategic PriorityFY 2018-19 Total
ProposedFY 2018-19 General Fund
ProposedWater Production and Delivery $126,661,656 $0Water Utilities Capital Program Management $14,249,317 $0Water Utilities Customer Account Services $28,720,802 $0Public WorksCapital and Implementation Program $2,336,045 $2,336,045Interagency and Transportation Administration $414,407 $414,407Land Surveying Services $195,897 $195,897Pavement Management $452,126 $452,126Rights-of-Way Maintenance Contracts $2,755,861 $2,755,861Service Maintenance Areas $14,707,498 $14,707,498Street Cut and Right-of-Way Management (Cut Control) $419,977 $419,977Street Maintenance Contracts and Inspections $29,797,069 $29,797,069Street Repair Division – Asphalt $10,087,809 $10,087,809Street Repair Division – Concrete $13,717,309 $13,717,309Urban Forestry Division $897,656 $897,656Sanitation ServicesAnimal Remains Collection $738,655
21
Mobility Solutions, Infrastructure, & Sustainability

Services by Strategic PriorityFY 2018-19 Total
ProposedFY 2018-19 General Fund
ProposedBrush-Bulk Waste Removal Services $17,244,610 $0City Facility Services $794,394 $0Landfill Services $36,734,206 $0Recycling Collection and Waste Diversion $13,905,553 $0Residential Refuse Collection $43,236,047 $0TransportationCommunication and Planning $5,684,083 $5,684,083Parking Management $1,652,782 $1,652,782Traffic Engineering and Operations $36,227,503 $36,227,503Transportation Administration $3,655,051 $3,655,051Building ServicesCapital Facilities $765,851 $765,851City Facility Operation, Maintenance & Repair $14,798,146 $14,798,146Custodial Maintenance $3,521,606 $3,521,606Energy Procurement & Monitoring $2,909,157 $2,909,157CapitalCapital Improvement $501,783,699 $0
22
Mobility Solutions, Infrastructure, & Sustainability

Services by Strategic PriorityFY 2018-19 Total
ProposedFY 2018-19 General Fund
ProposedDebt ServiceDebt Service $140,209,068 $0Mobility Solutions, Infrastructure, and Sustainability Total $1,768,297,044 $145,589,762
23
Mobility Solutions, Infrastructure, & Sustainability

FY 2017-18 Accomplishments• Transportation
• Realigned existing resources to establish a new Department of Transportation
• Began community engagement and policy development for a comprehensive Strategic Mobility Plan
• Replaced 30 traffic signals using $2M in matching state and federal funding
• Public Works• Invested $6M in street and alley improvements
• Voters approved a $1.05B bond package in November 2017 and projects are currently being awarded
24
Mobility Solutions, Infrastructure, & Sustainability

FY 2017-18 Accomplishments• Dallas Water Utilities
• Completed a comprehensive retail cost of service study resulting in service rate reductions for residents
• Successfully completed the water quality improvements project at the Bachman Water Treatment Plant and has begun conversion to biological filtration at the East Side Water Treatment Plant, which will improve water quality in the distribution system
25
Mobility Solutions, Infrastructure, & Sustainability