mobile technology, mobile money and financial services in
TRANSCRIPT

Tanzanian Economic Review, Vol. 7 Nos. 1 & 2, 2017: 72–90
Mobile Technology, Mobile Money
and Financial Services in Emerging Economies
Bruno L. Yawe* & Jaideep Prabhu**
Abstract
We use data collected by the Financial Inclusion Insights (FII) research and knowledge-
sharing program that is managed by InterMedia to investigate the uptake of mobile
technology, mobile money and financial services in Bangladesh, India, Nigeria,
Pakistan, Tanzania and Uganda. We also investigated by country the predictors of use
of the most popular mobile money product for these six countries. It was not possible to
undertake an econometric analysis for Kenya due to the lack of data on the dependent
variable and some predictors. We can infer from the pooled cross-sectional data for
Bangladesh, India, Nigeria and Pakistan that the following are significant predictors
of using mobile money: (i) possession of a job or income source; (ii) possessing a mobile
phone; (iii) possessing a bank account; (iv) degree of trust in mobile money services; (v)
degree of trust in mobile money agents; as well as (vi) basic literacy.
Keywords: financial inclusion, mobile money, financial innovation, ‘know-do’ gap,
binomial logistic regression.
1. Introduction
Mobile technology may be poised to change the field of development. Every month,
cellular voice and data networks reach further into developing countries.
Increasingly, many organizations are using mobile technology in their operations.
In 2012 there were more than 6bn mobile phone subscribers compared to 2011
when there were a billion mobile broadband subscribers, and 75% of the world had
access to mobile phones (Pact Inc., 2014).
Mobile phones not only enable communication; they also open up potentially
revolutionary applications in a range of services, especially financial services.
Noting the distinction between a good (something tangible that lasts, whether for
a long or short time) and a service (a task that someone performs for you),
Asmundson (2011) observes that a financial service is not a financial good itself
(for example, a mortgage loan to buy a house or a car insurance policy); rather, it
is something that is best described as the process of acquiring a financial good. It
involves the transaction required to obtain a financial good. The financial sector
covers many different types of transactions in such areas as real estate, consumer
finance, banking, and insurance. Additionally, it covers a broad spectrum of
investment funding, including securities.
*School of Economics, Makerere University: [email protected]; [email protected]
(Corresponding Author) **Judge Business School, University of Cambridge, [email protected]; [email protected]

Mobile Technology, Mobile Money and Financial Services
73
Mobile money is a financial service that comes under the category of mobile
payments. Like Near Field Communication (NFC), the payment process is
contactless.1 However, while NFC only works at close range, mobile money also
allows money to be sent over long distances using cell phones.
Several authors have recently noted that a well-deployed technology provides an
opportunity to ensure that financial services reach the financially excluded
(unbanked or underbanked). The Center for Financial Inclusion (CFI) (2013) has
noted that the ability of technology to bring services at low cost to people, wherever
they are and whenever they need them, is possibly today’s biggest driver of full financial inclusion. In 2012 the World Council of Credit Unions (WCCU) observed
that the increasing popularity of transaction and payment services through cell
phones and mom-and-pop shops has revealed the tremendous potential to expand
financial inclusion through mobile technology. Electronic money models have
improved the lives of millions by reducing the need to spend time travelling over
long distances to reach the nearest point of service or to carry cash (WCCU, 2012).
While the potential of mobile telephony to revolutionize financial (and other services)
is undeniable, many research questions still remain unaddressed. Key among these
are: (i) What evidence exists regarding the uptake of these solutions by people in
emerging economies? (ii) What impact has this uptake had on financial inclusion in
emerging economies? (iii) What are the potential drivers of mobile money use?
We explore these questions by analysing new comparative data on the uptake and
use of mobile-enabled financial services across several emerging economies.
Specifically, we use data collected by the Financial Inclusion Insights (FII) research
and knowledge-sharing program, which is managed by InterMedia, and sponsored
by the Bill & Melinda Gates Foundation. Launched in 2013, the FII is producing
demand-side data and analysis based on nationally representative tracking
surveys, and a range of qualitative studies to support work in financial inclusion—particularly in the mobile and digital areas. Countries currently covered by FII are:
Bangladesh, India, Indonesia, Pakistan, Kenya, Nigeria, Tanzania and Uganda;
with more likely to be added in due course. It should be noted that Indonesia was
not surveyed in the first wave conducted in 2013.
FII’s rich, comparable datasets delve deeply into the dynamics of access and use of mobile phones, mobile money, bank accounts and other financial products and
services. They also explore the potential to expand digitization of payments in
various forms—for example, government support payments to citizens, and wages
paid by businesses to workers. Extensive demographic data for each survey
respondent allows the data to be sliced and diced to highlight behaviours of
particular segments, such as rural women or poor urban men.
1 Near field communication is a set of ideas and technology that enables smart phones and other devices
to establish radio communication with each other by touching them together or bringing them into
proximity, typically a distance of 10cm (3.9in) or less.

Bruno L. Yawe & Jaideep Prabhu
74
The FII country datasets contain nationally representative data with sample sizes
for each country presented in Table 1.
Table 1: Number of Surveys per Year and Interviews per Survey by Country
Country Bangladesh India Kenya Nigeria Pakistan Tanzania Uganda
Surveys per year 2 1 1 2 1 2 2
Interviews per survey 6,000 45,000 3,000 6,000 6,000 3,000 3,000
Sample size 12,000 45,000 3,000 12,000 6,000 6,000 6,000
Source: Intermedia (2014)
The data cover the following areas:
(a) Demographics including age, gender, marital status, education, employment
or occupation, literacy and numeracy, rural and urban location, geographical
location (region/province/district), and poverty measure (Grameen progress
out of poverty index).
(b) Core survey module covering mobile phone access, bank account access and
use, mobile money access and use, product awareness, triggers or barriers to
use, mobile money activities (transfers, payments, savings, etc.), mobile
money business-to-business (B2B) activities, consumer experience with
mobile money agents, consumer segmentation (active, lapsed, and non-
users), and prevalence and potential for digital government-to-person (G2P)
and donor-to-person (D2P) payments.
(c) Additional modules in the surveys for Bangladesh, Nigeria and Pakistan
include use of digital/prepaid cards, payments habits, use of savings
instruments, use of insurance instruments, as well as borrowing and lending
habits.
(d) Finally, there are additional modules for surveys in the following specified
countries: (i) influencers driving mobile money adoption for Tanzania and
Uganda; (ii) assessing potential demand for interoperability of mobile money
services for Tanzania and Uganda; (iii) technical skills assessment relating
to mobile money use for Tanzania; (iv) opinions/attitudes about mobile
network operator (MNO) fraud for Uganda; (v) use of over-the-counter
mobile money services for Pakistan and Uganda; (vi) use of new digital
financial services for Kenya; (vii) use of G2P programs and digitization
potential for India; and (viii) financial behaviours for India.
2. Methods
We source data from the Financial Inclusion Insights Program (FIIP), InterMedia’s
online data centre.2 Datasets in SPSS as well as Microsoft Excel were provided to
us for each of the program countries by the FIIP, Intermedia. We use a comparative
analytical approach to examine the percentage distribution of respondents under
the following broad three categories: (i) mobile technology; (ii) financial services;
2 http://finclusion.org/datacenter/data-center/

Mobile Technology, Mobile Money and Financial Services
75
and (iii) mobile money for the following countries in which we conduct these
analyses: Bangladesh, India, Kenya, Nigeria, Pakistan, Tanzania and Uganda.
We conduct further comparative analysis under each broad category as follows.
First, we decompose mobile technology into mobile phone ownership, mobile
phone borrowing, and total mobile phone access (ownership plus borrowing/pay-
for-use). Second, we decompose financial services into: bank account ownership,
bank account access (including sharing), frequency of bank account use, and use
of formal/informal financial institutions. Finally, we decompose mobile money
into: awareness of mobile money, mobile money use, registered account use, and
active registered account use. Wherever possible we present our findings
graphically.
2.1 Econometric Analysis of Predictors of Use of Most Popular Mobile
Money Product by Country
We perform econometric analyses of the predictors of the use of mobile money for
the most popular mobile money product in two related steps. In step 1 we perform
an analysis to identify the most popular mobile money product; and in step 2 we
perform binomial/binary logistic analysis of the data for the most popular mobile
product as identified in step 1.
Step 1: Identifying the Most Popular Mobile Money Product
We identify the most popular mobile money product by country and present the
results of this process in Table 2.
Table 2: Most Popular Mobile Money Product by County as of 2013
Country Mobile Money Product Percentage
Bangladesh bKash 21.7
India Airtel Money 0.2
Kenya Safaricom Mpesa 75
Nigeria MTN Mobile Money 11
Pakistan Telenor Easy Paisa Money 6.2
Tanzania Vodacom Mpesa 32.4
Uganda MTN Mobile Money 38.7
Source: Own computations using data tool at:
http://finclusion.org/datacenter/data-center/.
Step 2: Estimation of a Binomial or Binary Logistic Regression
We use a binomial or binary logistic regression to model the outcome of ‘using’ versus ‘not using’ mobile money. Binomial or binary logistic regression deals with
situations in which the observed outcome for a dependent variable can have only
two possible types (for example, ‘using mobile money’ versus ‘not using mobile
money’). A binomial logistic regression (often referred to simply as logistic
regression) predicts the probability that an observation falls into one of two
categories of a dichotomous dependent variable based on one or more independent
variables that can be either continuous or categorical.

Bruno L. Yawe & Jaideep Prabhu
76
The use of mobile money services by a respondent is a binary or dichotomous
outcome that we model to be dependent on the following respondent-specific
factors: (i) having a job or source of income; (ii) possessing a bank account; (iii)
distance to the nearest branch of a bank or microfinance institution; (iv) owning a
mobile phone; (v) basic literacy; (vi) basic numeracy; (vii) degree of trust in mobile
money services; and (viii) degree of trust in mobile money agents. As such, we
estimate a binary logistic regression for the most popular mobile network operator
in each country in our dataset.
2.2 The Logistic Regression Equation
While logistic regression gives each predictor a coefficient 𝛽 that measures its
independent contribution to variations in the dependent variable, the dependent
variable can only take on one of the two values: 0 or 1. We want to predict from the
knowledge of relevant independent variables and coefficients the probability (p)
that the dependent variable is 1 rather than 0 (i.e., that it belongs to one group
rather than the other). A further mathematical transformation, namely a log
transformation, is needed to normalize the distribution. This log transformation of
the p values to a log distribution enables us to create a link with the normal
regression equation. The log distribution (or logistic transformation of p) is also
called the logit of p or logit(p) (Burns & Burns, 2009).
Logit(p) is the log (to base e) of the odds ratio or likelihood ratio that the dependent
variable is 1. Algebraically, it is defined as: log 𝑖𝑡 of (𝑝) = log𝑒 [ 𝑝1 − 𝑝] = In [ 𝑝1 − 𝑝] (1)
While p can only lie between 0 and 1, logit(p) scale ranges from negative infinity to
positive infinity; and is symmetrical around the logit of 0.5 (which is zero). Equation
2 shows the relationship between the usual regression equation (𝛼 + 𝛴𝛽𝑖𝑥𝑖) (where 𝑖 = 1, 2, 3, … 𝑛. ), which is the functional form of a straight line and the logistic
regression equation.
The logistic regression equation takes the following form: log 𝑖𝑡 [𝑝(𝑥)] = log𝑒 [ 𝑝(𝑥)1 − 𝑝(𝑥)] = 𝛼 + 𝛽1𝑥1 + 𝛽2𝑥2 + 𝛽3𝑥3 + ⋯ + 𝛽𝑛𝑥𝑛 (2)
This resembles a linear regression and although logistic regression finds a ‘best fitting’ equation, just as linear regression, the principles upon which it does this are
different. Rather than use a least-squared deviations criterion for the best fit, it uses
a maximum likelihood method, which maximizes the probability of getting the
observed results given the fitted regression coefficients. Consequently, the goodness
of fit and overall significance statistics used in logistic regression are different from
those used in linear regression. The probability denoted by p is computed by means
of Equation (3), which is simply another rearrangement of Equation (2):
Mobile Technology, Mobile Money and Financial Services
77
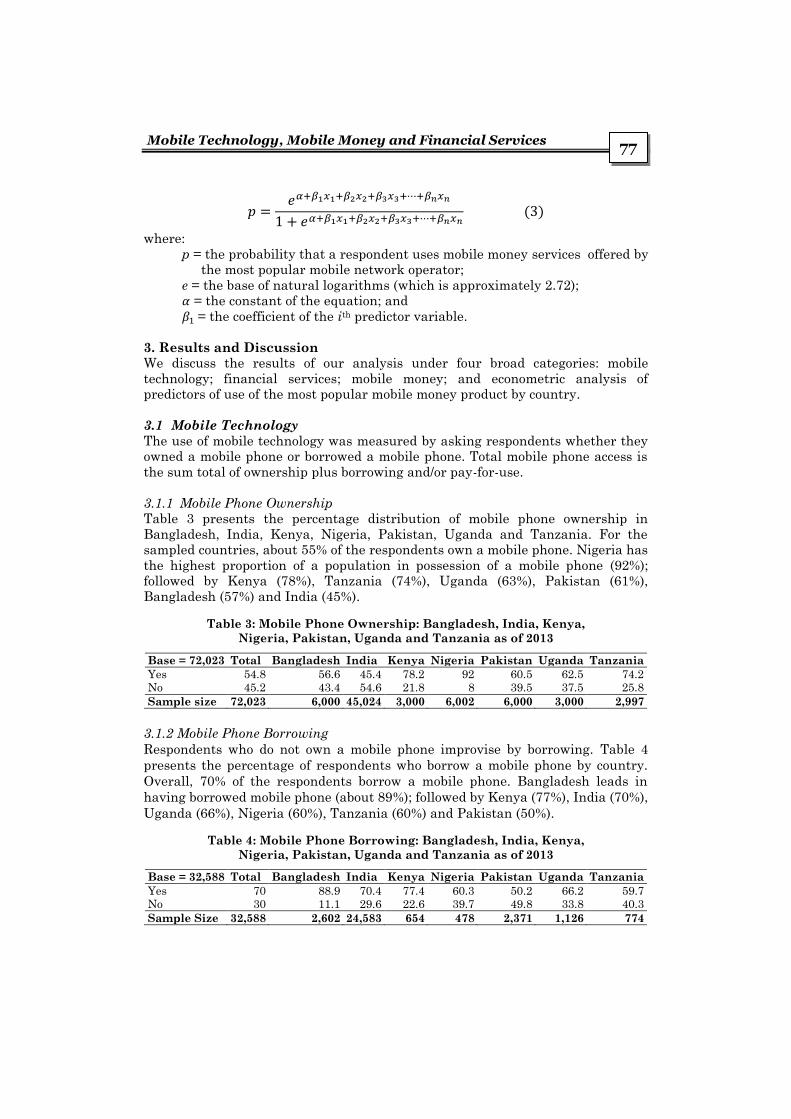
𝑝 = 𝑒𝛼+𝛽1𝑥1+𝛽2𝑥2+𝛽3𝑥3+⋯+𝛽𝑛𝑥𝑛1 + 𝑒𝛼+𝛽1𝑥1+𝛽2𝑥2+𝛽3𝑥3+⋯+𝛽𝑛𝑥𝑛 (3)
where:
p = the probability that a respondent uses mobile money services offered by
the most popular mobile network operator;
e = the base of natural logarithms (which is approximately 2.72); 𝛼 = the constant of the equation; and 𝛽1 = the coefficient of the ith predictor variable.
3. Results and Discussion We discuss the results of our analysis under four broad categories: mobile
technology; financial services; mobile money; and econometric analysis of
predictors of use of the most popular mobile money product by country.
3.1 Mobile Technology
The use of mobile technology was measured by asking respondents whether they
owned a mobile phone or borrowed a mobile phone. Total mobile phone access is
the sum total of ownership plus borrowing and/or pay-for-use.
3.1.1 Mobile Phone Ownership Table 3 presents the percentage distribution of mobile phone ownership in
Bangladesh, India, Kenya, Nigeria, Pakistan, Uganda and Tanzania. For the
sampled countries, about 55% of the respondents own a mobile phone. Nigeria has
the highest proportion of a population in possession of a mobile phone (92%);
followed by Kenya (78%), Tanzania (74%), Uganda (63%), Pakistan (61%),
Bangladesh (57%) and India (45%).
Table 3: Mobile Phone Ownership: Bangladesh, India, Kenya,
Nigeria, Pakistan, Uganda and Tanzania as of 2013
Base = 72,023 Total Bangladesh India Kenya Nigeria Pakistan Uganda Tanzania
Yes 54.8 56.6 45.4 78.2 92 60.5 62.5 74.2
No 45.2 43.4 54.6 21.8 8 39.5 37.5 25.8
Sample size 72,023 6,000 45,024 3,000 6,002 6,000 3,000 2,997
3.1.2 Mobile Phone Borrowing
Respondents who do not own a mobile phone improvise by borrowing. Table 4
presents the percentage of respondents who borrow a mobile phone by country.
Overall, 70% of the respondents borrow a mobile phone. Bangladesh leads in
having borrowed mobile phone (about 89%); followed by Kenya (77%), India (70%),
Uganda (66%), Nigeria (60%), Tanzania (60%) and Pakistan (50%).
Table 4: Mobile Phone Borrowing: Bangladesh, India, Kenya,
Nigeria, Pakistan, Uganda and Tanzania as of 2013
Base = 32,588 Total Bangladesh India Kenya Nigeria Pakistan Uganda Tanzania
Yes 70 88.9 70.4 77.4 60.3 50.2 66.2 59.7
No 30 11.1 29.6 22.6 39.7 49.8 33.8 40.3
Sample Size 32,588 2,602 24,583 654 478 2,371 1,126 774

Bruno L. Yawe & Jaideep Prabhu
78
3.2 Total Mobile Phone Access (Ownership plus Borrowing/Pay-for-use)
Total mobile phone access (ownership plus borrowing/pay-for-use) for the sampled
countries stands at about 86%. Table 5 presents the total mobile phone access
(ownership plus borrowing/pay-for-use) for Bangladesh, India, Kenya, Nigeria,
Pakistan, Uganda and Tanzania. Nigeria leads on total mobile phone access (97%);
followed by Bangladesh (95.2%), Kenya (95.1%), Tanzania (90%), Uganda (87%),
India (84%) and Pakistan (80%).
Table 5: Total Mobile Phone Access (ownership plus borrowing/pay-for-use):
Bangladesh, India, Kenya, Nigeria, Pakistan, Uganda and Tanzania as of 2013
Base = 72,023 Total Bangladesh India Kenya Nigeria Pakistan Uganda Tanzania
Yes 86.4 95.2 83.9 95.1 96.8 80.3 87.3 89.6
No 13.6 4.8 16.1 4.9 3.2 19.7 12.7 10.4
Sample Size 72,023 6,000 45,024 3,000 6,002 6,000 3,000 2,997
Comparing Tables 3, 4 and 5 reveals that total mobile phone access has increased
in all countries when mobile phone borrowing is accounted for.
3.3 Financial Services
The uptake of financial services comprises: bank account ownership, bank account
access (including sharing), frequency of bank account use, and use of
formal/informal financial institutions. Table 6 presents information on bank
account ownership. Overall, about 37% of the population in the sampled countries
owns a bank account. India leads the sampled countries with 46% owning a bank
account; followed by Nigeria (41%), Kenya (28%), Bangladesh (19%), Uganda
(11.9%), Tanzania (11.8%) and Pakistan (7.9%).
Table 6: Bank Account Ownership: Bangladesh, India, Kenya,
Nigeria, Pakistan, Uganda and Tanzania as of 2013
Base = 72,023 Total Bangladesh India Kenya Nigeria Pakistan Uganda Tanzania
Yes (Percentage) 36.6 19.4 46 28.2 41.3 7.9 11.9 11.8
No (Percentage) 63.4 80.6 54 71.8 58.7 92.1 88.1 88.2
Sample Size 72,023 6,000 45,024 3,000 6,002 6,000 3,000 2,997
3.3.1 Bank Account Access (Including Sharing)
Table 7 presents information relating to bank account access (including sharing).
Overall, about 38% of the population in the sampled countries has bank account access
(including sharing). In terms of bank account access (including sharing), India leads
with about 47% of respondents reporting bank account access; followed by Nigeria
(46%), Kenya (31%), Bangladesh (21%), Uganda (13.5%), and Tanzania (13%).
Table 7: Bank Account Access (including sharing): Bangladesh, India,
Kenya, Nigeria, Pakistan, Uganda and Tanzania as of 2013
Base = 72,023 Total Bangladesh India Kenya Nigeria Pakistan Uganda Tanzania
Yes (Percentage) 37.9 20.9 46.6 30.7 46.1 9 13.5 13.1
No (Percentage) 62.1 79.1 53.4 69.3 53.9 91 86.5 86.9
Sample Size 72,023 6,000 45,024 3,000 6,002 6,000 3,000 2,997
Mobile Technology, Mobile Money and Financial Services
79
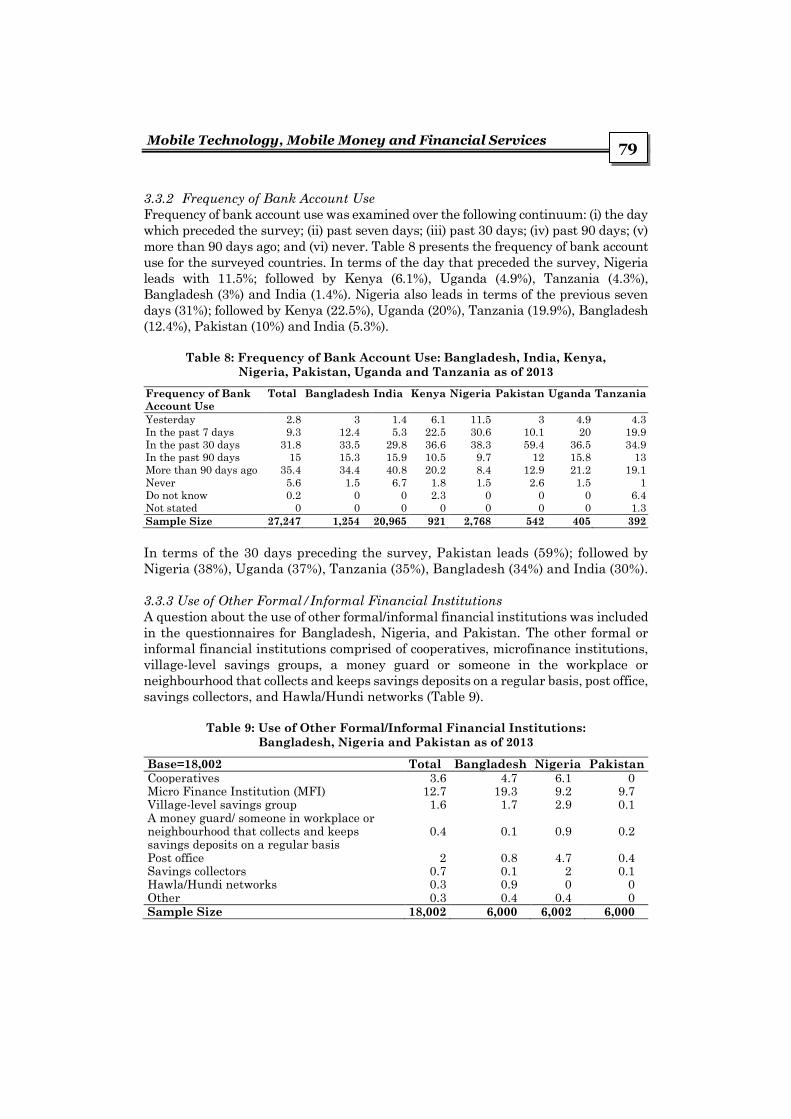
3.3.2 Frequency of Bank Account Use
Frequency of bank account use was examined over the following continuum: (i) the day
which preceded the survey; (ii) past seven days; (iii) past 30 days; (iv) past 90 days; (v)
more than 90 days ago; and (vi) never. Table 8 presents the frequency of bank account
use for the surveyed countries. In terms of the day that preceded the survey, Nigeria
leads with 11.5%; followed by Kenya (6.1%), Uganda (4.9%), Tanzania (4.3%),
Bangladesh (3%) and India (1.4%). Nigeria also leads in terms of the previous seven
days (31%); followed by Kenya (22.5%), Uganda (20%), Tanzania (19.9%), Bangladesh
(12.4%), Pakistan (10%) and India (5.3%).
Table 8: Frequency of Bank Account Use: Bangladesh, India, Kenya,
Nigeria, Pakistan, Uganda and Tanzania as of 2013
Frequency of Bank
Account Use
Total Bangladesh India Kenya Nigeria Pakistan Uganda Tanzania
Yesterday 2.8 3 1.4 6.1 11.5 3 4.9 4.3
In the past 7 days 9.3 12.4 5.3 22.5 30.6 10.1 20 19.9
In the past 30 days 31.8 33.5 29.8 36.6 38.3 59.4 36.5 34.9
In the past 90 days 15 15.3 15.9 10.5 9.7 12 15.8 13
More than 90 days ago 35.4 34.4 40.8 20.2 8.4 12.9 21.2 19.1
Never 5.6 1.5 6.7 1.8 1.5 2.6 1.5 1
Do not know 0.2 0 0 2.3 0 0 0 6.4
Not stated 0 0 0 0 0 0 0 1.3
Sample Size 27,247 1,254 20,965 921 2,768 542 405 392
In terms of the 30 days preceding the survey, Pakistan leads (59%); followed by
Nigeria (38%), Uganda (37%), Tanzania (35%), Bangladesh (34%) and India (30%).
3.3.3 Use of Other Formal/Informal Financial Institutions
A question about the use of other formal/informal financial institutions was included
in the questionnaires for Bangladesh, Nigeria, and Pakistan. The other formal or
informal financial institutions comprised of cooperatives, microfinance institutions,
village-level savings groups, a money guard or someone in the workplace or
neighbourhood that collects and keeps savings deposits on a regular basis, post office,
savings collectors, and Hawla/Hundi networks (Table 9).
Table 9: Use of Other Formal/Informal Financial Institutions:
Bangladesh, Nigeria and Pakistan as of 2013
Base=18,002 Total Bangladesh Nigeria Pakistan
Cooperatives 3.6 4.7 6.1 0 Micro Finance Institution (MFI) 12.7 19.3 9.2 9.7 Village-level savings group 1.6 1.7 2.9 0.1 A money guard/ someone in workplace or neighbourhood that collects and keeps savings deposits on a regular basis
0.4 0.1 0.9 0.2
Post office 2 0.8 4.7 0.4 Savings collectors 0.7 0.1 2 0.1 Hawla/Hundi networks 0.3 0.9 0 0 Other 0.3 0.4 0.4 0 Sample Size 18,002 6,000 6,002 6,000

Bruno L. Yawe & Jaideep Prabhu
80
Nigeria leads in terms of cooperatives (6%), followed by Bangladesh (4.7%). By way of
microfinance institutions and Hawla/Hundi networks, Bangladesh leads (respectively,
19.3% and 0.9%); followed by Pakistan (9.7%) and Nigeria (9.2%). In terms of village-
level savings groups, Nigeria leads (2.9%), followed by Bangladesh (1.7%).
3.4 Mobile Money
The uptake of mobile money was measured by assessing: (i) awareness of mobile
money; (ii) mobile money use; (iii) registered account use; and (iv) active registered
account use.
3.4.1 Awareness of Mobile Money
Table 10 presents findings regarding awareness of mobile money in Bangladesh,
India, Kenya, Nigeria, Pakistan, Uganda and Tanzania. In terms of awareness of
mobile money, Kenya leads (96.9%); followed by Tanzania (94.6%), Uganda
(90.5%), Bangladesh (88.1%), Pakistan (64.1%), Nigeria (12.3%) and India (5.1%).
Table 10: Awareness of Mobile Money: Bangladesh, India, Kenya, Nigeria,
Pakistan, Uganda and Tanzania as of 2013
Base = 72,023 Total Bangladesh India Kenya Nigeria Pakistan Uganda
Yes (Percentage) 28.6 88.1 5.1 96.9 12.3 64.1 90.5
No (Percentage) 71.4 11.9 94.9 3.1 87.7 35.9 9.5
Sample Size 72,023 6,000 45,024 3,000 6,002 6,000 3,000
What might explain the wide differences in percentages regarding awareness of
mobile money between the two categories of countries (Bangladesh, Kenya,
Pakistan, Uganda and Tanzania) and (India and Nigeria)? The information paints
a picture about the mobile payments model adopted in each category. Merritt
(2010) has observed that three mobile payments business models (bank-led,
mobile-operator-led, or partnership-led) have emerged, depending on the
applicable regulatory climate, consumer culture, and demographics. In the bank-
led model, the financial institution controls the customer relationship, and provides
mobile services primarily as a new channel to existing services. The mobile-
operator model provides a channel for domestic transfers and international
remittances conducted by a financial institution.
A mobile network operator-led business model limits or eliminates the involvement
of a financial institution in payment delivery, clearing, and settlement. Mobile-
network-operator models thrive in developing markets because of their ability to
reach large numbers of unbanked people in physically remote locations beyond the
presence of bank and landline infrastructures. Finally, in the partnership model,
financial institutions, mobile network operators and third-party service providers
that make up the ecosystem, partner and collaborate to provide payment services.
In this model it may be possible to capitalize on each organization’s respective strengths in terms of providing customer service, introducing innovation, and
ensuring an environment of sound regulatory compliance.

Mobile Technology, Mobile Money and Financial Services
81
3.4.2 Mobile Money Use
Table 11 presents mobile money use in Bangladesh, India, Kenya, Nigeria,
Pakistan, Uganda and Tanzania. In terms of mobile money use, Kenya leads
(79.7%); followed by Tanzania (46.1%), Uganda (43.5%), Bangladesh (21.1%),
Pakistan (7.1%), Nigeria (0.3%) and India (0.2%).
Table 11: Mobile Money Use: Bangladesh, India, Kenya, Nigeria,
Pakistan, Uganda and Tanzania as of 2013
Base=72,023 Total Bangladesh India Kenya Nigeria Pakistan Uganda Tanzania Yes (Percentage) 9.6 21.1 0.2 79.7 0.3 7.1 43.5 46.1 No (Percentage) 90.4 78.9 99.8 20.3 99.7 92.9 56.5 53.9 Sample Size 72,023 6,000 45,024 3,000 6,002 6,000 3,000 2,997
A comparison of mobile money use (Table 11) with awareness of mobile money
(Table 10) reveals a ‘know-do’ gap. A ‘know-do’ gap refers to the gap between today’s scientific advances and their application; between what we know and what is
actually being done (WHO, 2006; IDRC, 2011). But what might explain the
discrepancy between awareness and use of mobile money? Some authors have tried
to explain this discrepancy in terms of the innovation assessment lag: namely, the
time required between initial awareness and actual use of a technology (Thirtle &
Rhutan, 2001). Table 12 presents the ‘know-do’ gap with regard to mobile money
use for Bangladesh, India, Kenya, Nigeria, Pakistan, Uganda and Tanzania. In
terms of the ‘know-do’ gap, Bangladesh leads (67%); followed by Pakistan (57%),
Tanzania (48.5%), Uganda (47%), Kenya (17.2%), Nigeria (12%) and India (4.9%).
Table 12: Awareness of Mobile Money versus Mobile Money Use: Bangladesh,
India, Kenya, Nigeria, Pakistan, Uganda and Tanzania as of 2013
Total Bangladesh India Kenya Nigeria Pakistan Uganda Tanzania
Awareness of mobile money
28.6 88.1 5.1 96.9 12.3 64.1 90.5 94.6
Mobile money use
9.6 21.1 0.2 79.7 0.3 7.1 43.5 46.1
‘Know-do’ gap 19 67 4.9 17.2 12 57 47 48.5
Sample Size 72,023 6,000 45,024 3,000 6,002 6,000 3,000 2,997
Comparing bank account access (Table 7) with mobile money use (Table 11) reveals
a negative relationship between bank account access and mobile money use. This is
because India, with a bank account access of 46.6%, has a mobile money use of 0.2%;
Nigeria with a bank account access of 46% has a mobile money use of 0.3%; Kenya
with a bank account access of 30.7% has a mobile money use of 79.7%; Bangladesh
with a bank account access of 20.9% has a mobile money use of 21.1%; Uganda with
a bank account access of 13.5% has a mobile money use of 43.5%; Tanzania with a
bank account access of 13.1% has a mobile money use of 46.1%; and Pakistan with a
bank account access of 9% has a mobile money use of 7.1%. Notwithstanding the
negative relationship between bank account access and mobile money use, the two
modes of enhancing financial inclusion are more complementary and not substitutes,
especially with growing interoperability and agent banking. This has been stressed

Bruno L. Yawe & Jaideep Prabhu
82
by Davidson (2011) by noting that it is impossible for a bank to offer mobile money
without an operator. This is because an operator must provide the data channel that
allows customers and agents to initiate transactions using their handsets. Similarly,
it is impossible for a mobile network operator to offer mobile money without a bank.
This is due to the fact that a bank must hold the deposits that back the electronic
value stored in customers’ and agents’ wallets.
3.4.3 Registered Account Use
In June 2013, there were over 203m registered mobile money accounts worldwide.
In Sub-Sahara Africa alone, there were 98m registered accounts by June 2013: this
was more than twice the total number of Facebook users in the region. East Africa
accounts for a particularly large portion of mobile money accounts globally,
representing 34% of the total registered accounts. These are in Cameroon, the
Democratic Republic of Congo, Gabon, Kenya, Madagascar, Tanzania, Uganda,
Zambia and Zimbabwe. In these markets the mobile money industry has made
financial services accessible to more people than the traditional banking industry
ever did. All these markets are in Sub-Sahara Africa, a sign of the transformational
power of mobile money in this region, where banking penetration remains very low
(Pénicaud & Katakam, 2013).
3.4.4 Active Registered Account Use
In spite of the growing number of registered accounts, activating customers remains
a challenge for a large number of services. Globally, only 29.9% of registered accounts
were active as of June 2013. A customer’s journey from awareness of mobile money, to registration, and finally to regular usage is quite complex. Notwithstanding
customers’ awareness, they may not necessarily understand how they would benefit
from using the service. Using mobile money represents a significant behavioural
change in economies where almost all payment transactions are conducted in cash
(Pénicaud & Katakam, 2013). Fig. 1 compares the percentages of registered account
use to active registered account use.
Figure 1: Registered Account Use versus Active Registered Account Use
2.9 0.1
72.9
0.1 0.5
29.3
41.9
2.4 0.1
66.6
0.1 0.4
26.3
36.5
0
10
20
30
40
50
60
70
80
Bangladesh India Kenya Nigeria Pakistan Uganda Tanzania
Country
Perc
en
t
Registered account use Active registered account use

Mobile Technology, Mobile Money and Financial Services
83
As seen in Fig. 1, Kenya leads in terms of both registered account use (72.9%) and
active registered account use (66.6%); followed by Tanzania (41.9% versus 36.5%),
Uganda (29.3% versus 26.3%), Bangladesh (2.9% versus 2.4%), Pakistan (0.5%
versus 0.4%), India and Nigeria (0.1% versus 0.1%).
4. Econometric Analysis of Predictors of Use of the Most Popular Mobile Money Product by Country
This section presents, by country, the predictors of the use of the most popular
mobile money product for each of the following countries: Bangladesh, India,
Nigeria, Pakistan, Tanzania, and Uganda. It was not possible to undertake an
econometric analysis for Kenya due to the lack of data on the dependent variable
and some predictors.
4.1 Bangladesh
Table 13 presents the binomial logistic regression results predicting the use of bKash
in Bangladesh. All predictors of using bKash are significant with the exception of:
possession of a bank account, distance to the nearest bank branch with an ATM, and
the degree of trust in mobile money services. Possession of a job or income source,
ownership of a mobile phone, degree of trust in mobile money agents, basic literacy
and basic numeracy are significant predictors of the use of bKash.
Table 13: Binomial Logistic Regression Results Predicting the
Use of bKash
Explanatory Variables B S.E. Wald df Sig. Exp(B) 95.0% C.I. for Lower Upper
Possession of a Job or Income Source 0.586 0.126 21.763 1.000 0.000 1.798 1.405 2.300 Owning a Mobile Phone 0.487 0.188 6.740 1.000 0.009 1.628 1.127 2.352 Possession of a Bank Account -0.271 0.228 1.411 1.000 0.235 0.763 0.488 1.192 Distance to Nearest Bank Branch or
MFI with ATM 0.001 0.046 0.001 1.000 0.976 1.001 0.915 1.096
Degree of Trust in Mobile Money Services
-0.070 0.070 1.008 1.000 0.315 0.932 0.812 1.069
Degree of Trust in Mobile Money Agents 0.189 0.070 7.217 1.000 0.007 1.208 1.052 1.386 Basic Literacy 0.594 0.198 8.991 1.000 0.003 1.812 1.229 2.672 Basic Numeracy 0.660 0.276 5.724 1.000 0.017 1.935 1.127 3.324
Constant -2.817 0.464 36.865 1.000 0.000 0.06
The logits or log odds of using bKash change by 0.586 for a one-unit change in the
possession of a job or income source, holding other factors constant. Equivalently,
the odds of using bKash change by a factor of approximately 1.8 for a one-unit
increase in the possession of a job or income source, when all other predictors are
held constant. This implies that persons with jobs or income sources are more likely
to use bKash, and vice versa.
The logits or log odds of using bKash change by 0.487 for a one-unit change in the
possession of a mobile phone, holding other factors constant. Equivalently, the odds
of using bKash change by a factor of approximately 1.6 for a one-unit increase in the
possession of a mobile phone, when all other predictors are controlled. This implies
that persons with mobile phones are more likely to use bKash, and vice versa.

Bruno L. Yawe & Jaideep Prabhu
84
The logits or log odds of using bKash change by 0.189 for a one-unit change in the
degree of trust in mobile money agents, holding other factors constant.
Equivalently, the odds of using bKash change by a factor of approximately 1.2 for
a one-unit increase in the degree of trust in mobile money agents, when all other
predictors are controlled. This implies that efforts that enhance the degree of trust
in mobile money agents are likely to increase the use of bKash, and vice versa.
The logits or log odds of using bKash change by 0.189 for a one-unit change in basic
literacy, holding other factors constant. Equivalently, the odds of using bKash
change by a factor of approximately 1.8 for a one-unit increase in basic literacy,
when all other predictors are controlled. This implies that efforts that enhance
basic literacy are likely to increase the use of bKash, and vice versa.
The logits or log odds of using bKash change by 0.7 for a one-unit change in basic
numeracy, holding other factors constant. Equivalently, the odds of using bKash
change by a factor of approximately 1.9 for a one-unit increase in basic numeracy,
when all other predictors are controlled. This implies that efforts which enhance
basic numeracy are likely to increase the use of bKash, and vice versa.
4.2 India
Table 14 presents the binomial logistic regression results predicting the use of
Airtel Money in India. All predictors of using Airtel Money are non-significant with
the exception of the degree of trust in mobile money services. The logits or log odds
of using Airtel Money change by 0.7 for a one-unit change in the degree of trust in
mobile money services, holding other factors constant. Equivalently, the odds of
using Airtel Money change by a factor of approximately 2 for a one-unit increase in
the degree of trust in mobile money services, when all other predictors are
controlled. This implies that efforts that enhance the degree of trust in mobile
money services are likely to increase the use of Airtel Money, and vice versa.
Table 14: Binomial Logistic Regression Results Predicting the
Use of Airtel Money
Explanatory Variables B S.E. Wald df Sig. Exp(B)
95.0% C.I. for
Lower Upper
Possession of a Job or Income
Source
0.163 0.381 0.184 1.000 0.668 1.177 0.558 2.485
Owning a Mobile Phone -0.007 0.660 0.000 1.000 0.991 0.993 0.272 3.619
Possession of a Bank Account -1.112 0.833 1.783 1.000 0.182 0.329 0.064 1.683
Distance to Nearest Bank
Branch or MFI with ATM
-0.097 0.121 0.645 1.000 0.422 0.907 0.715 1.151
Degree of Trust in Mobile
Money Services
0.691 0.154 19.997 1.000 0.000 1.995 1.474 2.701
Degree of Trust in Mobile
Money Agents
0.114 0.132 0.746 1.000 0.388 1.120 0.866 1.450
Basic Literacy 16.556 5320.884 0.000 1.000 0.998 15502309.879 0.000
Basic Numeracy 16.971 8379.972 0.000 1.000 0.998 23467647.311 0.000
Constant -31.674 9926.517 0.000 1.000 0.997 0.000

Mobile Technology, Mobile Money and Financial Services
85
4.3 Nigeria
Table 15 presents the binomial logistic regression results predicting the use of
MTN Mobile Money in Nigeria. All predictors of using MTN Mobile Money are non-
significant, with the exception of the degree of trust in mobile money services, as
well as the degree of trust in mobile money agents. The logits or log odds of using
MTN Mobile Money change by 0.9 for a one-unit change in the degree of trust in
mobile money services, holding other factors constant. Equivalently, the odds of
using MTN Mobile Money change by a factor of approximately 0.4 for a one-unit
increase in the degree of trust in mobile money services, when all other predictors
are controlled. This implies that efforts that enhance the degree of trust in mobile
money services are likely to increase the use of MTN Mobile Money, and vice versa.
Table 15: Binomial Logistic Regression Results Predicting the
Use of MTN Mobile Money
Explanatory
Variables B S.E. Wald df Sig. Exp(B)
95.0% C.I. for
Lower Upper
Possession of a Job or
Income Source
-0.386 0.759 0.259 1.000 0.610 0.679 0.154 3.006
Owning a Mobile Phone -14.901 5587.036 0.000 1.000 0.998 0.000 0.000
Possession of a Bank
Account
-15.399 2748.039 0.000 1.000 0.996 0.000 0.000
Distance to Nearest
Bank Branch or MFI
with ATM
0.193 0.225 0.737 1.000 0.391 1.213 0.780 1.886
Degree of Trust in
Mobile Money Services
0.869 0.269 10.443 1.000 0.001 0.419 0.248 0.710
Degree of Trust in
Mobile Money Agents
0.426 0.229 3.459 1.000 0.063 1.531 0.977 2.339
Basic Literacy -15.016 3482.529 0.000 1.000 0.997 0.000 0.000
Basic Numeracy -15.606 2543.854 0.000 1.000 0.995 0.000 0.000
Constant 57.054 7574.028 0.000 1.000 0.994 6002387679917110000000000.000
Conversely, the logits or log odds of using MTN Mobile Money change by 0.4 for a
one-unit change in the degree of trust in mobile money agents, holding other factors
constant. Equivalently, the odds of using MTN Mobile Money change by a factor of
approximately 1.5 for a one-unit increase in the degree of trust in mobile money
agents, when all other predictors are controlled. This implies that efforts which
enhance the degree of trust in mobile money agents are likely to increase the use
of MTN Mobile Money, and vice versa.
4.4 Pakistan
Table 16 presents the binomial logistic regression results predicting the use of
Telenor Easy Paisa Money in Pakistan. All predictors of using Telenor Easy Paisa
Money are non-significant, with the exception of the degree of trust in mobile
money services. The logits or log odds of using Telenor Easy Paisa Money change
by 0.6 for a one-unit change in the degree of trust in mobile money services, holding
other factors constant. Equivalently, the odds of using MTN Mobile Money change
by a factor of approximately 0.6 for a one-unit increase in the degree of trust in
mobile money services, when all other predictors are controlled. This implies that

Bruno L. Yawe & Jaideep Prabhu
86
efforts that enhance the degree of trust in mobile money services are likely to
increase the use of Telenor Easy Paisa Money, and vice versa. It should be noted
that, here, data were missing on ownership of a mobile phone.
Table 16: Binomial Logistic Regression Results Predicting the
Use of Telenor Easy Paisa Money
Explanatory Variables B S.E. Wald df Sig. Exp(B)
95.0% C.I. for
Lower Upper
Possession of a Job or Income Source
-0.002 0.433 0.000 1.000 0.997 0.998 0.427 2.333
Owning a Mobile Phone Possession of a Bank Account -1.205 0.695 3.001 1.000 0.083 0.300 0.077 1.172 Distance to Nearest Bank
Branch or MFI with ATM 0.071 0.103 0.479 1.000 0.489 1.074 0.877 1.315
Degree of Trust in Mobile Money Services
0.590 0.169 12.262 1.000 0.000 0.554 0.398 0.771
Degree of Trust in Mobile Money Agents
-0.125 0.151 0.692 1.000 0.406 0.882 0.657 1.185
Basic Literacy -19.444 9336.364 0.000 1.000 0.998 0.000 0.000 . Basic Numeracy 0.000 0.712 0.000 1.000 1.000 1.000 0.248 4.033
Constant 20.906 9336.364 0.000 1.000 0.998 1200031247.683
4.5 Tanzania
Table 17 presents the binomial logistic regression results predicting the use of
Vodacom Mpesa in Tanzania. All predictors of using Vodacom Mpesa are non-
significant, and data were missing on the degree of trust in mobile money services,
as well as the degree of trust in mobile money agents.
Table 17: Binomial Logistic Regression Results Predicting the
Use of Vodacom Mpesa
Explanatory Variables B S.E. Wald df Sig. Exp(B)
95.0% C.I. for
Lower Upper
Possession of a Job or Income Source
-0.172 0.471 0.133 1.000 0.715 0.842 0.335 2.120
Owning a Mobile Phone 21.503 21562.353 0.000 1.000 0.999 2180995425.644 0.000 . Possession of a Bank Account 0.961 0.787 1.491 1.000 0.222 2.614 0.559 12.216 Distance to Nearest Bank
Branch or MFI with ATM 0.126 0.095 1.758 1.000 0.185 1.134 0.941 1.367
Degree of Trust in Mobile Money Services
Degree of Trust in Mobile Money Agents
Basic Literacy 1.182 0.993 1.417 1.000 0.234 3.260 0.466 22.821 Basic Numeracy 0.644 0.614 1.099 1.000 0.295 1.903 0.571 6.342
Constant -25.360 21562.353 0.000 1.000 0.999 0.000
4.6 Uganda
Table 18 presents the binomial logistic regression results predicting the use of
MTN Mobile Money in Uganda. All predictors of using MTN Mobile Money are
significant, with the exception of the possession of a job or income source and basic
numeracy. Data were missing on the degree of trust in mobile money services, as
well as on the degree of trust in mobile money agents.

Mobile Technology, Mobile Money and Financial Services
87
Table 18: Binomial Logistic Regression Results Predicting the
Use of MTN Mobile Money
Explanatory Variables B S.E. Wald df Sig. Exp(B)
95.0% C.I. for
Lower Upper
Possession of a Job or Income Source 0.197 0.632 0.097 1.000 0.755 1.218 0.353 4.206 Owning a Mobile Phone 1.815 0.552 10.800 1.000 0.001 0.163 0.055 0.481 Possession of a Bank Account 0.797 0.446 3.193 1.000 0.074 0.450 0.188 1.080 Distance to Nearest Bank Branch or
MFI with ATM -0.171 0.084 4.204 1.000 0.040 0.842 0.715 0.992
Degree of Trust in Mobile Money Services
Degree of Trust in Mobile Money Agents
Basic Literacy 0.797 0.366 4.740 1.000 0.029 0.451 0.220 0.924 Basic Numeracy 0.748 0.531 1.981 1.000 0.159 0.473 0.167 1.341
Constant 5.874 1.153 25.936 1.000 0.000 355.518
The logits or log odds of using MTN Mobile Money change by 1.8 for a one-unit change
in the possession of a mobile phone, holding other factors constant. Equivalently, the
odds of using MTN Mobile money change by a factor of approximately 0.2 for a one-
unit increase in the possession of a mobile phone, when all other predictors are
controlled. This implies that persons with mobile phones are more likely to use MTN
Mobile Money, and vice versa.
The logits or log odds of using MTN Mobile Money change by 0.8 for a one-unit change
in the possession of a bank account, holding other factors constant. Equivalently, the
odds of using MTN Mobile Money change by a factor of approximately 0.5 for a one-
unit increase in the possession of a bank account, when all other predictors are
controlled. This implies that efforts that enhance the possession of bank accounts by
the populace are likely to increase the use of MTN Mobile Money, and vice versa.
The logits or log odds of using MTN mobile money reduce by 0.2 for a one-unit increase
in the distance to the nearest bank branch or microfinance institution, holding other
factors constant. Equivalently, the odds of using MTN mobile money change by a factor
of approximately 0.8 for a one-unit decrease in the distance to the nearest bank branch
or microfinance institution, when all other predictors are controlled. This implies that
efforts that reduce the distance to the nearest bank branch or microfinance institution
are likely to increase the use of MTN mobile money, and vice versa.
The logits or log odds of using MTN mobile money change by 0.8 for a one-unit change
in basic literacy, holding other factors constant. Equivalently, the odds of using MTN
mobile money by a factor of approximately 0.5 for a one-unit increase in basic literacy,
when all other predictors are controlled. This implies that efforts that enhance basic
literacy are likely to increase the use of MTN mobile money, and vice versa.
5. Results Using Pooled Cross-Sectional Data for Bangladesh, India,
Nigeria and Pakistan
Cross-sectional variation is ordinarily substantially greater than time-series
variation. Thus, pooled estimates usually have the desirable property of being

Bruno L. Yawe & Jaideep Prabhu
88
derived from a wider space of variation than estimates based solely on time-series
data (Bass & Wittink, 1975). We have pooled data for a common set of variables for
Bangladesh, India, Nigeria and Pakistan. It should be noted that Kenya, Tanzania
and Uganda have been excluded from the pooled dataset because of missing
variables. Below are the results obtained by estimating a binomial logistic
regression predicting the use of the most popular mobile money product.
Table 19 gives the overall test for the model that includes the predictors. The chi-
square value of 595.5, with a p-value of less than 0.0005, tells us that our model, as a
whole, fits significantly better than an empty model (i.e., a model with no predictors).
Table 19: Omnibus Tests of Model Coefficients
Chi-square df Sig.
Step 595.512 8 0.000
Block 595.512 8 0.000
Model 595.512 8 0.000
Table 20 presents the coefficients, their standard errors, the Wald test statistic
with associated degrees of freedom and p-values, and the exponentiated coefficient
(also known as the odds ratio). The binomial logistic regression results presented
are the predictors of using the most popular mobile money product (using the
pooled cross-sectional dataset) for Bangladesh, India, Nigeria and Pakistan.
Table 20: Binomial Logistic Regression Results Predicting Use of Most Popular
Mobile Money Product (for the Pooled Cross-sectional Dataset)
in Bangladesh, India, Nigeria and Pakistan
Explanatory Variables B S.E. Wald df Sig. Exp(B)
95.0% C.I. for
Lower Upper
Possession of a job or income source 0.951 0.073 168.691 1.000 0.000 2.588 2.242 2.988
Owning a mobile phone 1.862 0.159 137.692 1.000 0.000 6.434 4.715 8.781
Possession of a bank account -0.835 0.165 25.647 1.000 0.000 0.434 0.314 0.599
Distance to nearest bank branch or MFI
with ATM
-0.060 0.029 4.178 1.000 0.041 0.942 0.890 0.998
Degree of trust in mobile money services 0.369 0.035 111.173 1.000 0.000 0.691 0.645 0.740
Degree of trust in mobile money agents 0.371 0.036 106.716 1.000 0.000 1.449 1.350 1.554
Basic literacy 0.805 0.142 32.339 1.000 0.000 2.236 1.695 2.951
Basic numeracy 0.463 0.163 8.043 1.000 0.005 0.629 0.457 0.867
Constant -3.604 0.317 128.894 1.000 0.000 0.027
All predictors of using the most popular mobile money products in Bangladesh, India,
Nigeria and Pakistan as a group are significant, with the exception of the distance to
the nearest bank branch and basic numeracy. The logistic regression coefficients give
the change in the log odds of using mobile money for a one unit increase in the predictor
variable as follows. For every one unit change in possessing a job, the log odds of using
mobile money (versus non-use) in Bangladesh, India, Nigeria and Pakistan taken
together increase by 0.951, holding other factors constant. The log odds of using mobile
money (versus non-use) in these countries, taken together, increase by 1.862 for every

Mobile Technology, Mobile Money and Financial Services
89
one unit change in the possessing a mobile phone, holding other factors constant.
Holding other factors constant, the log odds of using mobile money (versus non-use), in
these countries, taken together, decrease by 0.835 for every one unit change in
possessing a bank account. For every one unit change in the degree of trust in mobile
money services, the log odds of using mobile money (versus non-use) in the three
countries, taken together, increase by 0.369, holding other factors constant. The log
odds of using mobile money (versus non-use) in these countries, taken together,
increase by 0.371 for every one unit change in the degree of trust in mobile money
agents, holding other factors constant. Finally, holding other factors constant, the log
odds of using mobile money (versus non-use), in Bangladesh, India, Nigeria and
Pakistan, taken together, increase by 0.805 for every one unit change in basic literacy.
4. Conclusion
The following conclusions emerge from this study. First, in the sampled countries,
more than half of the population owns a mobile phone. Individuals without a mobile
phone improvise by borrowing. Total mobile phone access (ownership plus
borrowing/pay-for-use) for the sampled countries stands at about 86%. About 37% of
the population in the sampled countries owns a bank account, and this figure rises
to 38% when account-sharing is considered. In Bangladesh, Nigeria and Pakistan,
there are other formal or informal financial institutions—namely, cooperatives,
microfinance institutions, village-level savings groups, a money guard or someone in
a workplace or neighbourhood—that collects and keeps savings deposits on a regular
basis, post office, savings collectors, and Hawla/Hundi networks.
In terms of awareness of mobile money, as well as mobile money use, Kenya leads
followed by Tanzania, Uganda, Bangladesh, Pakistan, Nigeria and India. A
comparison of mobile money use with awareness of mobile money reveals a ‘know-
do’ gap. In terms of the ‘know-do’ gap, Bangladesh leads; followed by Pakistan,
Tanzania, Uganda, Kenya, Nigeria and India. Comparing bank account access with
mobile money use reveals a negative relationship between bank account access and
mobile money use. In spite of this negative relationship, it is noteworthy that the
two modes of enhancing financial inclusion are more complementary and not
substitutes, especially with growing interoperability and agent banking.
In spite of the growing number of registered accounts, activating customers
remains a challenge for a large number of services. Kenya leads in terms of both
registered account use and active registered account use; followed by Tanzania,
Uganda, Bangladesh, Pakistan, India and Nigeria.
We also investigated, by country, the predictors of use of the most popular mobile
money product for Bangladesh, India, Nigeria, Pakistan, Tanzania and Uganda. It was
not possible to undertake an econometric analysis for Kenya due to the lack of data on
the dependent variable and some predictors. For the pooled cross-sectional data for
Bangladesh, India, Nigeria and Pakistan, it can be inferred that the significant
predictors of using mobile money are: (i) possession of a job or income source; (ii)
possessing a mobile phone; (iii) possessing a bank account; (iv) degree of trust in mobile
money services; (v) degree of trust in mobile money agents; as well as (vi) basic literacy.
Bruno L. Yawe & Jaideep Prabhu
90
Acknowledgements
The writing of this paper would not have been possible without data. To this end, we
gratefully acknowledge the invaluable support in providing the requisite data by The
Financial Inclusion Insights Program, InterMedia. We acknowledge financial support
from the Cambridge-Africa Partnership for Research Excellence (CAPREX) Program
and the Alborada Research Trust.
References
Asmundson, I. 2011. What are Financial Services? Finance & Development (March 2011)
pages 46-47.
Bass, F. M. & D. R. Wittink. 1975. Pooling Issues and Methods in Regression Analysis with
Examples in Marketing Research. Journal of Marketing Research, 12(4): 414-425.
Burns, R. P. & R. Burns. 2009. Business Research Methods and Statistics using SPSS.
London: SAGE Publications Ltd.
Center for Financial Inclusion (CFI). 2013. Technology Enables Full Financial Inclusion.
Retrieved on 17th April 2015 from: https://centerforfinancialinclusionblog.files. wordpress.
com/2013/10/technology1.pdf
Davidson, N. 2011. Mapping and Effectively Structuring Operator-Bank Relationships to Offer
Mobile Money for the Unbanked. Retrieved on 18th April 2015 from: www.gsma.com/
.../wp.../mappingandeffectivestructuringfinal2643.pdf.
InterMedia. 2014. Uganda Digital Pathways to Financial Inclusion 2014 Survey Report.
Retrieved on 06th March 2015 from: http://finclusion.org/country-pages/uganda-country-
page/.
International Development Research Centre (IDRC). 2011. The Knowledge Translation
Toolkit: Bridging the Know-Do Gap: A Resource for Researchers. Ottawa: International
Development Research Centre.
Merritt, C. 2010. Mobile Money Transfer Services: The Next Phase in the Evolution in Person-
to-Person Payments. Federal Reserve Bank of Atlanta.
Pact, Inc. 2014. Mobile Technology Handbook. Washington, DC: Pact, Inc.
Pénicaud, C. & A. Katakam. 2013. State of the Industry 2013 Report: Mobile Financial
Services for the Unbanked. Retrieved on 18th April 2015 from: http://www.gsma.com/
mobilefordevelopment/wp-content/uploads/2014/02/SOTIR_2013.pdf.
Thirtle, C. G. & V. W. Ruttan. 2001. The Role of Demand and Supply in the Generation and
Diffusion of Technical Change. Taylor & Francis Group.
World Council of Credit Unions (WCCU). 2012. Using Mobile Technology to Expand
Financial Inclusion: The Credit Union Experience.
World Health Organization (WHO). 2006. Bridging the “Know–Do” Gap. Geneva: World
Health Organization.