mobile social networks
DESCRIPTION
Mobile Social Networks. Jon Crowcroft &Eiko Yoneki&Narseo Vallina Rodriguez [email protected],[email protected] Systems Research Group University of Cambridge Computer Laboratory. I. Spread of Infectious Diseases. Thread to public health: e.g., , , SARS, AIDS - PowerPoint PPT PresentationTRANSCRIPT

Mobile Social Networks
Jon Crowcroft &Eiko Yoneki&Narseo Vallina Rodriguez
[email protected],[email protected]
Systems Research GroupUniversity of Cambridge Computer Laboratory

I. Spread of Infectious Diseases
Thread to public health: e.g., , , SARS, AIDS
Current understanding of disease spread dynamics Epidemiology: Small scale empirical work Physics/Math: Mostly large scale abstract/simplified models
Real-world networks are far more complex
Advantage of real world data Emergence of wireless technology for proximity data
(tiny wireless sensors, mobile phones...)
Post-facto analysis and modelling yield insight into human interactions
Model realistic infectious disease epidemics and predictions
2

Susceptible, Infected, Recovered: the SIR Model of an Epidemic
S I R

What is a Mathematical Model?
a mathematical description of a scenario or situation from the real-world
focuses on specific quantitative features of the scenario, ignores others
a simplification, abstraction, “cartoon”
involves hypotheses that can be tested against real data and refined if desired
one purpose is improved understanding of real-world scenario
e.g. celestial motion, chemical kinetics

The SIR Epidemic Model
First studied, Kermack & McKendrick, 1927.
Consider a disease spread by contact with infected individuals.
Individuals recover from the disease and gain further immunity from it.
S = fraction of susceptibles in a population
I = fraction of infecteds in a population
R = fraction of recovereds in a population
S + I + R = 1

The SIR Epidemic Model (Cont’d)
• Differential equations (involving the variables S, I, and R and their rates of change with respect to time t) are
• An equivalent compartment diagram is
Idt
dRIIS
dt
dIIS
dt
dS ,,
S I R

Parameters of the Model
• the infection rate• the removal rate
• The basic reproduction number is obtained from these parameters:
NR = /
• This number represents the average number of infections caused by one infective in a totally susceptible population. As such, an epidemic can occur only if NR > 1.
Vaccination and Herd Immunity
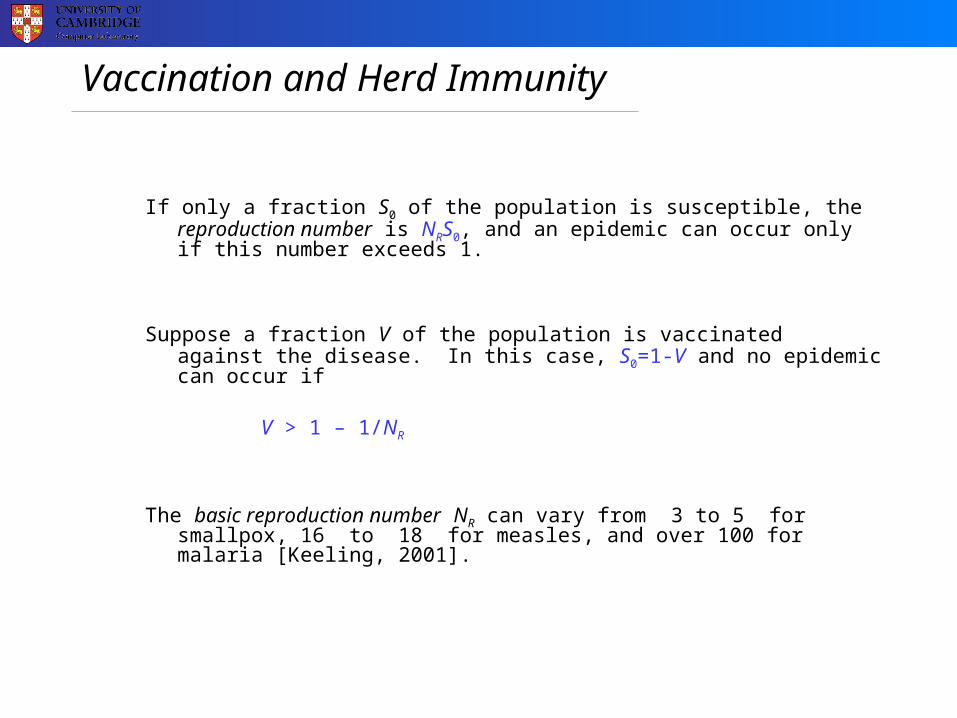
If only a fraction S0 of the population is susceptible, the reproduction number is NRS0, and an epidemic can occur only if this number exceeds 1.
Suppose a fraction V of the population is vaccinated against the disease. In this case, S0=1-V and no epidemic can occur if
V > 1 – 1/NR
The basic reproduction number NR can vary from 3 to 5 for smallpox, 16 to 18 for measles, and over 100 for malaria [Keeling, 2001].

Case Study: Boarding School Flu

Boarding School Flu (Cont’d)
• In this case, time is measured in days, = 1.66, =, and RN = 3.8.

Flu at Hypothetical Hospital
• In this case, new susceptibles are arriving and those of all classes are leaving.
RIdt
dRIIIS
dt
dISIS
dt
dS ,,
S I R

Flu at Hypothetical Hospital (Cont’d)• Parameters and are as before. New parameters
= = 1/14, representing an average turnover time of 14 days. The disease becomes endemic.

Case Study: Bombay Plague, 1905-6
• The R in SIR often means removed (due to death, quarantine, etc.), not recovered.

Eyam Plague, 1665-66
Raggett (1982) applied the SIR model to the famous Eyam Plague of 1665-66.
http://www.warwick.ac.uk/statsdept/staff/WSK/Courses/ST333/eyam.html
It began when some cloth infested with infected fleas arrived from London. George Vicars, the village tailor, was the first to die.
Of the 350 inhabitants of the village, all but 83 of them died from September 1665 to November 1666.
Rev. Wm. Mompesson, the village parson, convinced the villagers to essentially quarantine themselves to prevent the spread of the epidemic to neighboring villages, e.g. Sheffield.

Eyam Plague, 1665-66 (Cont’d)
• In this case, a rough fit of the data to the SIR model yields a basic reproduction number of RN
= 1.9.
Enhancing the SIR Model
Can consider additional populations of disease vectors (e.g. fleas, rats).
Can consider an exposed (but not yet infected) class, the SEIR model.
SIRS, SIS, and double (gendered) models are sometimes used for sexually transmitted diseases.
Can consider biased mixing, age differences, multiple types of transmission, geographic spread, etc.
Enhancements often require more compartments.
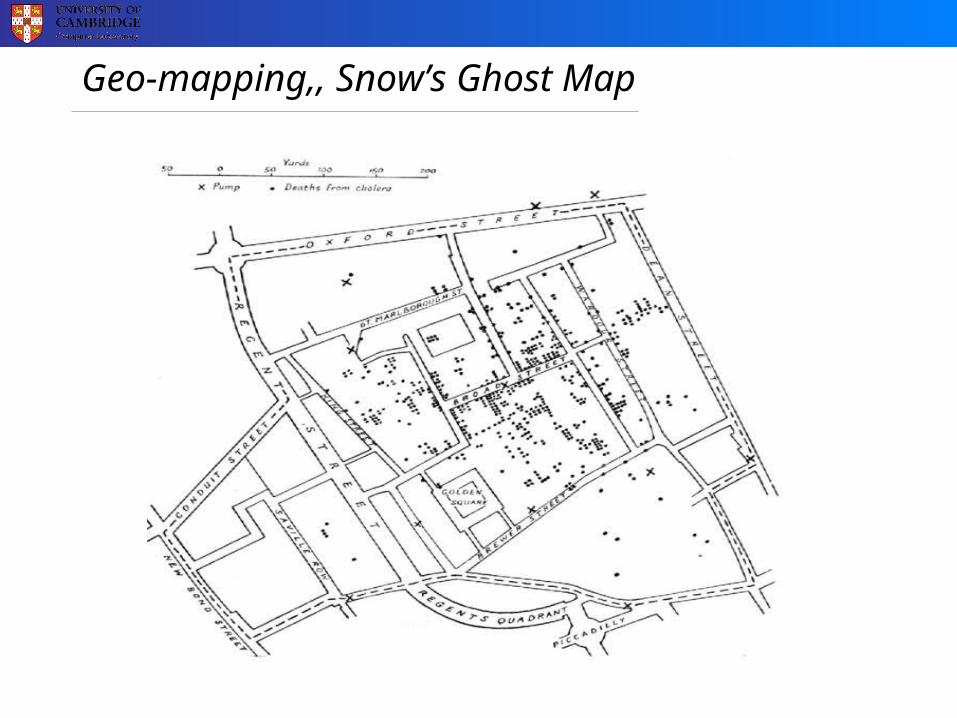
Geo-mapping,, Snow’s Ghost Map

We meet, we connect, we communicate
We meet in real life in the real world
We use text messages, phones, IM
We make friends on facebook, Second Life
How are these related?
How do they affect each other?
How do they change with new technology?
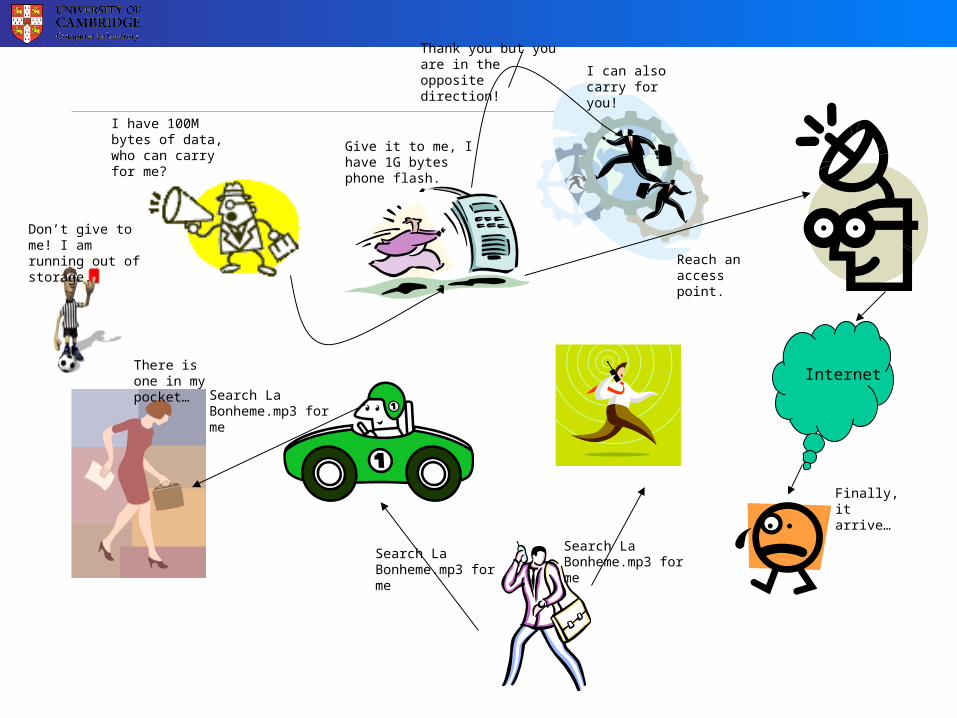
Give it to me, I have 1G bytes phone flash.
I have 100M bytes of data, who can carry for me?
I can also carry for you!
Thank you but you are in the opposite direction!
Don’t give to me! I am running out of storage. Reach an access
point.
Internet
Finally, it arrive…
Search La Bonheme.mp3 for me
Search La Bonheme.mp3 for me
Search La Bonheme.mp3 for me
There is one in my pocket…

My facebook friendswheel

My email statistics!

Cliques and Communities

We are still learning about this!
There are big problems understanding this
Data?
Privacy?
Usefulness?

Spread of Infectious Diseases
Thread to public health: e.g., , , SARS, AIDS
Current understanding of disease spread dynamics Epidemiology: Small scale empirical work Physics/Math: Mostly large scale abstract/simplified models
Real-world networks are far more complex
Advantage of real world data Emergence of wireless technology for proximity data
(tiny wireless sensors, mobile phones...)
Post-facto analysis and modelling yield insight into human interactions
Model realistic infectious disease epidemics and predictions
24

The FluPhone Project Understanding behavioural responses to infectious
disease outbreaks Proximity data collection using mobile phone from
general public in Cambridge https://www.fluphone.org
25

Various Data Collection Flu-like symptoms Proximity detection by Bluetooth Environmental information (e.g. in train, on road) Feedback to users
(e.g. How many contacts past hours/days) Towards potential health-care app Extending Android/iPhone platforms
FluPhone
26
iMote

Sensor Board or Phone or ...
iMote needs disposable battery Expensive Third world experiment
Mobile phone Rechargeable Additional functions (messaging, tracing) Smart phone: location assist applications
Provide device or software
27
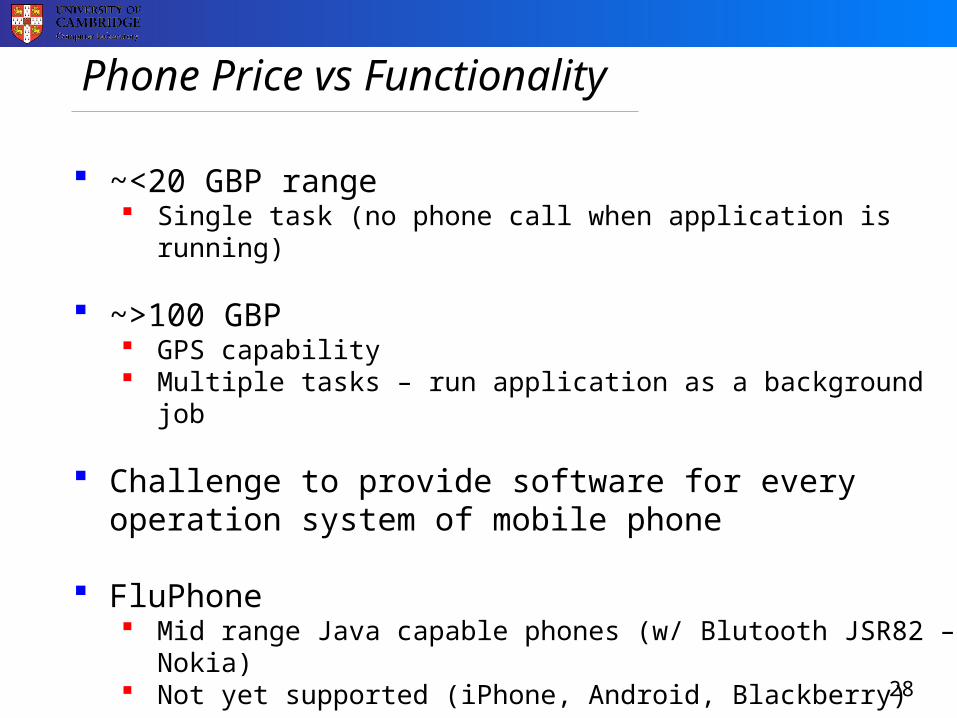
Phone Price vs Functionality
~<20 GBP range Single task (no phone call when application is running)
~>100 GBP GPS capability Multiple tasks – run application as a background job
Challenge to provide software for every operation system of mobile phone
FluPhone Mid range Java capable phones (w/ Blutooth JSR82 –Nokia) Not yet supported (iPhone, Android, Blackberry)
28

Experiment Parameters vs Data Quality Battery life vs Granularity of detection interval
Duration of experiments Day, week, month, or year? Data rate
Data Storage Contact /GPS data <50K per device per day (in
compressed format) Server data storage for receiving data from devices Extend storage by larger memory card
Collected data using different parameters or methods aggregated?
29
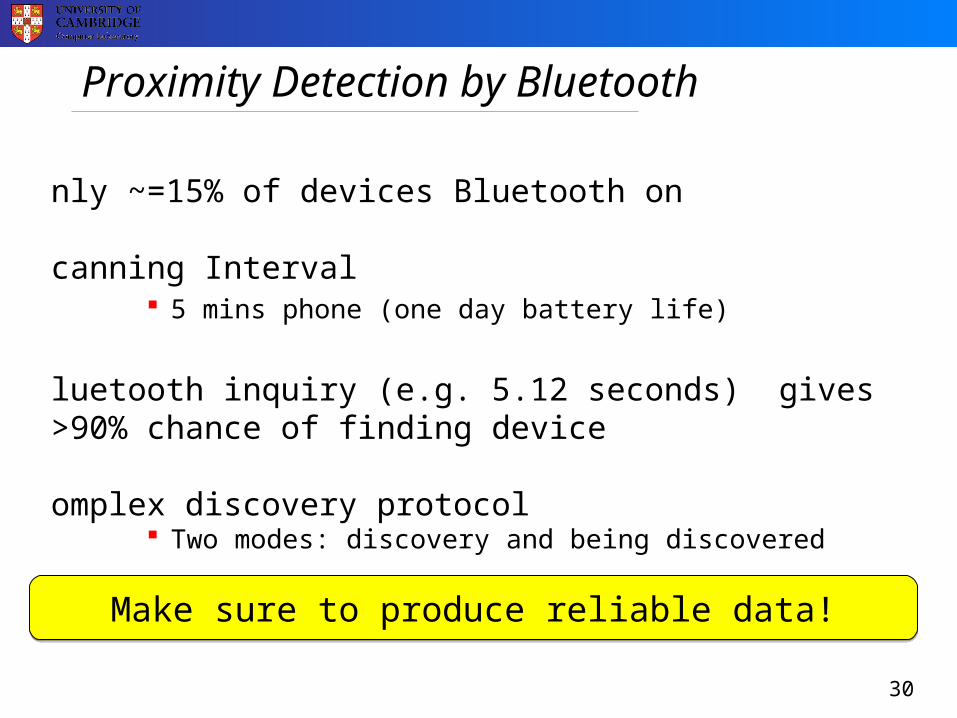
Proximity Detection by Bluetooth
Only ~=15% of devices Bluetooth on
Scanning Interval
5 mins phone (one day battery life)B
luetooth inquiry (e.g. 5.12 seconds) gives >90% chance of finding device
Complex discovery protocol
Two modes: discovery and being discovered 5
~10m discover range
30
Make sure to produce reliable data!Make sure to produce reliable data!

Data Retrieval Methods
Retrieving collected data: Tracking station Online (3G, SMS) Uploading via Web via memory card
Incentive for participating experiments
Collection cycle: real-time, day, or week?
31

FluPhone Server
Via GPRS/3G FluPhone server collects data
32

Security and Privacy
Current method: Basic anonymisation of identities (MAC address)
FluPhone server – use of HTTPS for data transmission via GPRS/3G
Anonymising identities may not be enough? Simple anonymisation does not prevent to be found the
social graph
Ethic approval tough! ~40 pages of study protocol document for FluPhone
project – took several months to get approval
33

Currently No Location Data
Location data necessary? Ethic approval gets tougher Use of WiFi Access Points or Cell Towers Use of GPS but not inside of buildings
Infer location using various information Online Data (Social Network Services, Google) Us of limited location information – Post localisation
Scanner Location in Bath 34

Consent
35

Study Status
Pilot study (April 21 ~ May 15) Computer Laboratory Very few participants – people do not worry flu in summer
University scale study (May 15 ~ June 30) Advertisement (all departments, 35 colleges, student
union, industry support club, Twitter, Facebook...) Employees of University of Cambridge, their families, and
any residents or people who work in Cambridge
Issues Limited phone models are supported Slightly complex installation process Motivation to participate...
36

Encountered Bluetooth Devices
37
May 14, 2010April 16, 2010
A FluPhone Participant Encountering History
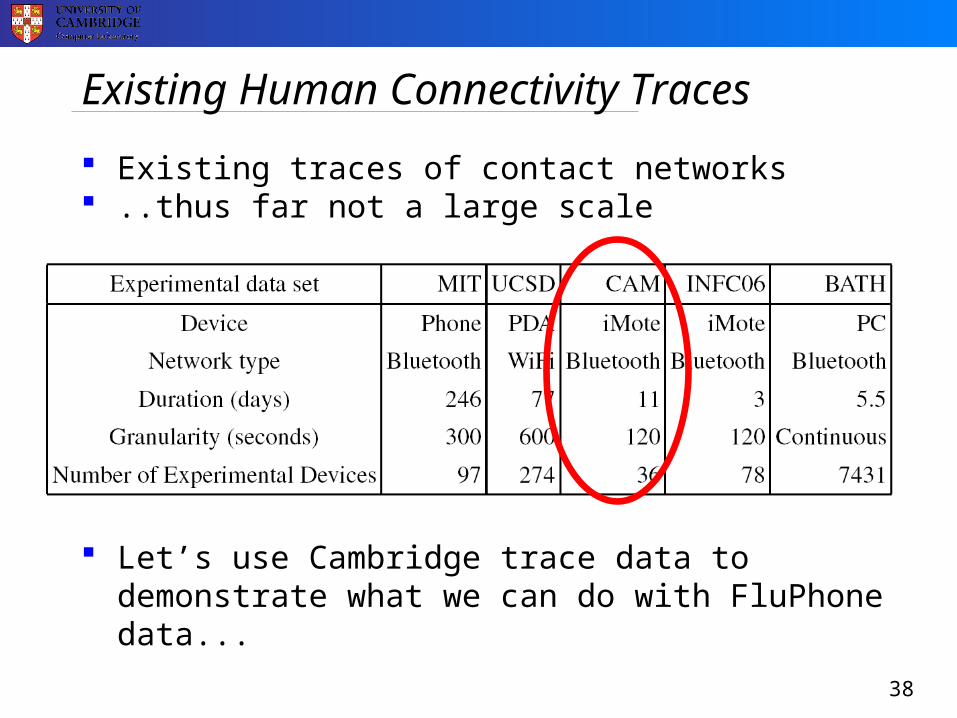
Existing Human Connectivity Traces
Existing traces of contact networks ..thus far not a large scale
Let’s use Cambridge trace data to demonstrate what we can do with FluPhone data...
38

Analyse Network Structure and Model
Network structure of social systems to model dynamics
Parameterise with interaction patterns, modularity, and details of time-dependent activity
Weighted networks Modularity Centrality (e.g. Degree) Community evolution Network measurement metrics Patterns of interactions
Publications at: http://www.haggleproject.org http://www.social-nets.eu/
39

Regularity of Network Activity
Cambridge Data (11 days by undergraduate students in Cambridge): Size of largest fragment shows network dynamics
40

Fiedler Clustering
K-CLIQUE (K=5)
Uncovering Community
Contact trace in form of weighted (multi) graphs Contact Frequency and Duration
Use community detection algorithms from complex network studies
K-clique, Weighted network analysis, Betweenness, Modularity, Fiedler Clustering etc.
41

Simulation of Disease – SEIR ModelFour states on each node:
SUSCEPTIBLEEXPOSEDINFECTEDRECOVERD Parameters
p: exposure probability a: exposed time (incubation period)t: infected time
Diseases
D1 (SARS): p=0.8, a=24H, t=30HD2 (FLU): p=0.4, a=48H, t=60HD3 (COLD): p=0.2, a=72H, t=120H
Seed nodesRandom selection of 20% of nodes (=7) among 36 nodes
42
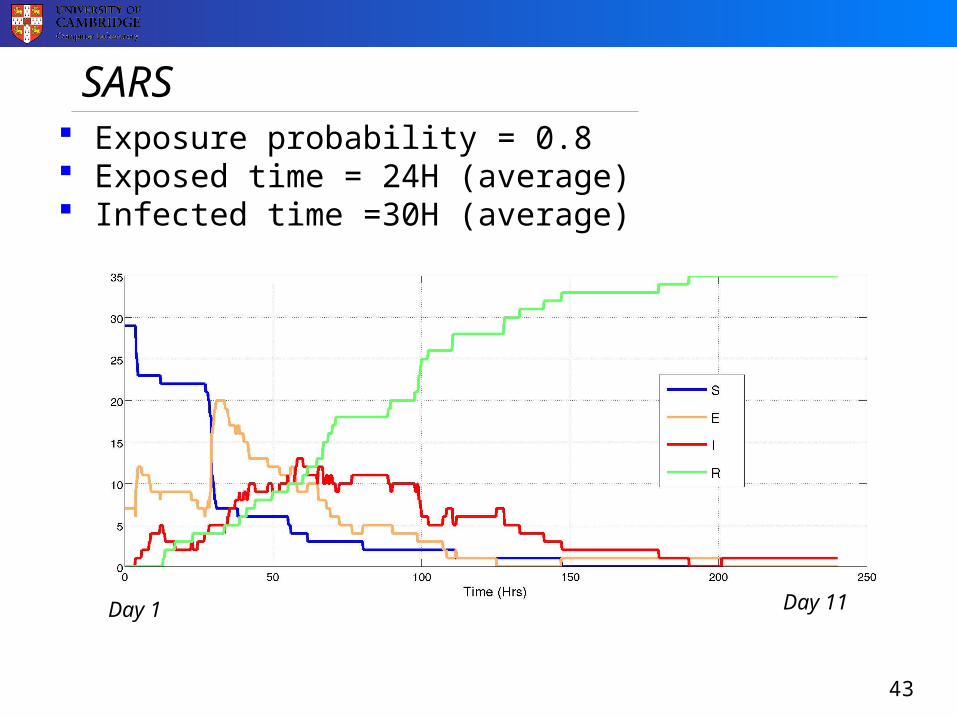
SARS
43
Exposure probability = 0.8 Exposed time = 24H (average) Infected time =30H (average)
Day 11Day 1

Flu
44
Exposure probability = 0.4 Exposed time = 48H (average) Infected time = 60H (average)
Day 11Day 1

Time to Exposure vs #of Meetings
45
Distribution of time to infection (black line) is strongly influenced by the time dependent adjacency matrices of meetings
Day 11Day 1

D0: Simple Epidemic (3 Stages)
First Rapid Increase: Propagation within Cluster Second Slow Climbing Reach Upper Limit of Infection
5 days
46

Virtual Disease Experiment Spread virtual disease via Blutooth communication in
proximity radio range Integrate SAR, FLU, and COLD in SIER model Provide additional information (e.g. Infection status,
news) to observe behavioural change
47

The FluPhone Project
http://www.cl.cam.ac.uk/research/srg/netos/fluphone/ https://www.fluphone.org
Email: [email protected]
48

ErdOSEnabling opportunistic resources sharing in mobile Operating Systems
Narseo Vallina-Rodríguez
Jon Crowcroft
University of Cambridge
MUM 2010, Cyprus

Motivation
WiFi
Bluetooth
GSM/GPRS/3G
Camera
Accelerometer
GPS
CPU (1 GHz)
Storage (>2 GB)

Motivation
“Energy is still the main limitation in mobile systems”

Motivation Para ver esta película, debedisponer de QuickTime™ y deun descompresor .Para ver esta película, debedisponer de QuickTime™ y deun descompresor .

Motivation
GPS
3G
CPU

Motivation

Motivation
Operator 1 Operator 2
Net
wor
k T
ype
Sig
nal S
tren
g th

Motivation
Why not sharing mobile resources opportunistically with other users?


II. ErdOS

ErdOS
Social energy-aware OS
Access co-located resources opportunistically
Customised proactive resources management
Social connections provide access control
Dataset Description
18 Android OS users
1-2 weeks
Resources Tracker
“Exhausting battery statistics”. Mobiheld 2010

Dataset Description
CurrentVoltage
Remaining CapacityTemperature
Charging Status
Battery Statistics
Airplane ModeTelephony State
Cellular Network TypeCellular Network State
WiFi StateBluetooth State
GPS StateTraffic
Network & Telephony
CPUProcessMemory
O.S. Info
TimeLocation (Cell ID)
RoamingScreen State
Contextual
Usage Analysis Tools
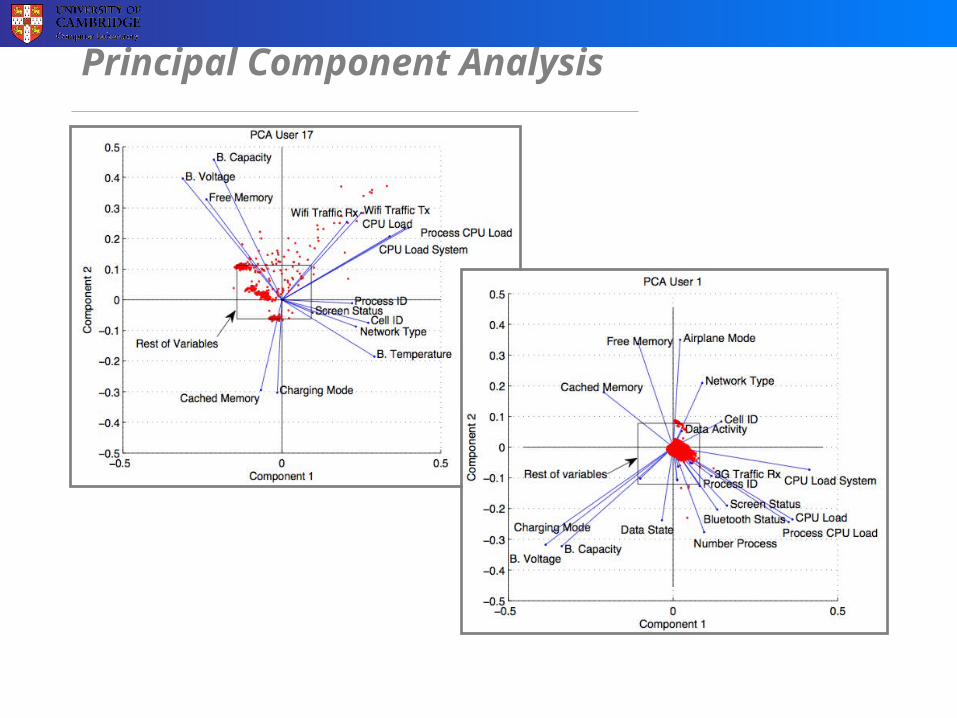
Principal Component Analisys (PCA):
Transforms a number of possibly correlated variables into a smaller number of uncorrelated ones called Principal Components

Principal Component Analysis
Principal Component Analysis


Context importance

Spatial context: Screen usage
Mean (%)
Std
dev
(%
)
20 40 60 80 100
20
10
30
40
50
U17U18
U11
U7
U13
U12
U16 U2
U15
U4
U14 U10
U6
U8U3U9
U1 U5
HighPredictability
LowPredictability

Spatial context: Cellular traffic
Mean (%)
Std
dev
(%
)
20 40 60 80 100
20
10
30
40
50
U13U6
U2 U11
U3
U15, 16
U4
U7
U12U10
U8
U9U5
U1 U18U14
LowPredictability
HighPredictability

Temporal context: Daily usage

Resources Allocations: Activities
Users’ Activities
2nd Level Activities
System Act Users’ Apps Users’ Actions Social Actions Remote Act.

Forecasting Resources Demands

Forecasting Resources State

Access Control
Social links facilitate access control and security
Unix-like permissions are made automatically based on users’ social networks
Proximity reduces privacy and security issues
OSNs can help to exchange public keys

Architecture

Related work
Resource allocation and energy-aware OS-ECOSystem. Zeng et al. ACM ASPLOS, 2002-Quanto. Stoica et al. USENIX 2008-CinderOS. Rumble et al. MOBIHELD 2009
Mobile usage and energy demand-Falaki et al. ACM Mobisys 2010-Oliver, ACM HotPlanet 2010-Balasubramanian et al. ACM IMC 2010-Rice et al. ACM PerCOM 2010

Conclusions
Energy is a primary target for optimization in mobile handsetsBenefits in QoS and energy savings by accessing resources opportunistically
Social links can be used for access control policies
Applications and users’ behavior generate complex dynamics and interdependencies among resources
Energy allocation and resources control must be customized to each user and handset
Pro-active resources management aided by contextual information

Future WorkFinishing implementation as an Android OS extension
Performance/Scalability evaluation
Demonstrate benefits of sharing different resources (Cellular Nets, GPS, CPU)
Resources Discovery Protocols
Research on lighter forecasting techniquesCloud Computing?
Security evaluation
Incentive schemes?

IIIDroplets:- Condensing the Cloud
http://www.cl.cam.ac.uk/~jac22

From the Cloud…
The cloud has its risks…

Centralisation of PII
What ifProvider goes brokeLose all your family photosAssets sold to another (unknown) provider
In a large organisation,There will always be someone badWho can datamineIdentity theftAnd worse

To Droplets
At the other extreme…
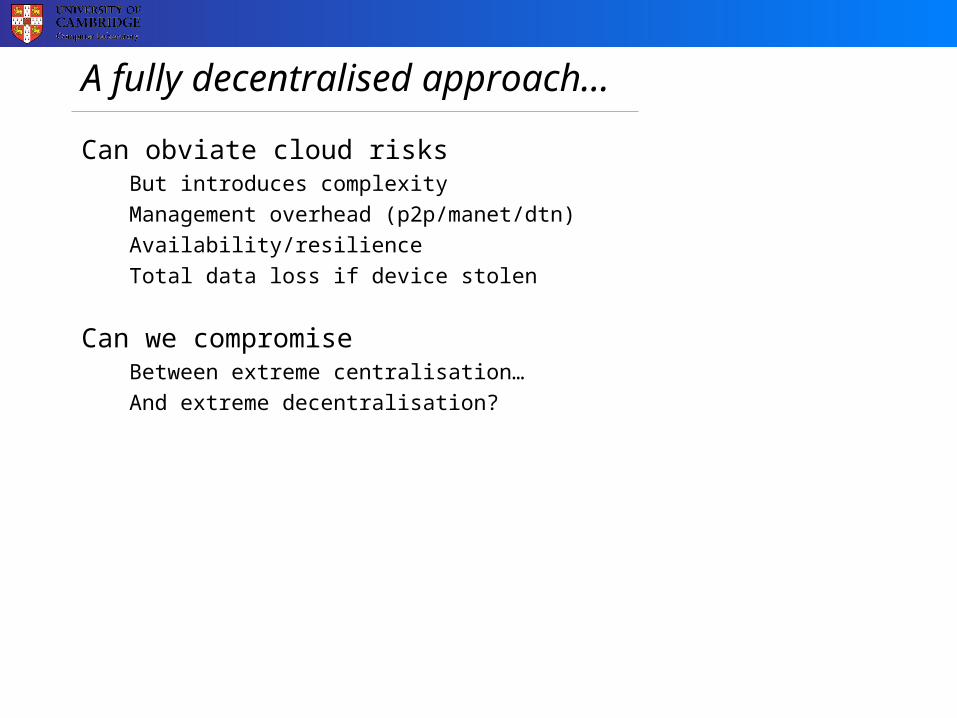
A fully decentralised approach…
Can obviate cloud risksBut introduces complexity
Management overhead (p2p/manet/dtn)
Availability/resilience
Total data loss if device stolen
Can we compromiseBetween extreme centralisation…
And extreme decentralisation?
Via extraction
Firstly, we need to pull/push data
From/to the cloud…

…and condensation

Replication/Decentralisation are necessary, but not sufficient…
Need to encrypt data Both in Cloud
And in Mist
The mist is a collection of droplets - small objects with key/capability
and auditor
What about cloud business models?Use privacy preserving advertising (MPI)
Use k-anonymity and threshold security
Use differential privacy for market research

Implementation Details

To Conclude…
Use contributed resources are fineHome hub, phone, etc
But need to unify with cloudDo so at API level
Have both decentralised and central
Advantages of bothLow latency access to home/pocketHigh resilience in cloudNo loss of privacy if bad cloud/pick pocket
