mobile money: the economics of mâ€pesa1 - georgetown university
TRANSCRIPT

Mobile Money: The Economics of M‐PESA1
WILLIAM JACK2
GEORGETOWN UNIVERSITY
AND
TAVNEET SURI3
MIT SLOAN
January, 2011
Abstract
Mobile money is a tool that allows individuals to make financial transactions using cell phone
technology. In this paper, we report initial results of two rounds of a large survey of households in
Kenya, the country that has seen perhaps the most rapid and widespread growth of a mobile money
product – known locally as M‐PESA – in the developing world. We first summarize the mechanics of M‐
PESA, and review its potential economic impacts. We then document the sequencing of adoption across
households according to income and wealth, location, gender, and other socio‐economic characteristics,
as well as the purposes for which the technology is used, including saving, sending and receiving
remittances, and direct purchases of goods and services. In addition, we report findings from a survey
of M‐PESA agents, who provide cash‐in and cash‐out services, and highlight the inventory management
problems they face.
1 We gratefully acknowledge the support and collaboration of Pauline Vaughan and Susie Lonie, and other staff of Safaricom and Vodafone. The first round of the survey whose results are reported here was commissioned by Financial Sector Deepening, a Nairobi‐based multi‐donor financial sector development programme, on behalf of the Central Bank of Kenya. Later rounds of the survey were funded by the Consortium on Financial Services and Poverty at the University of Chicago. Thanks are extended to Stephen Mwaura of the CBK, David Ferrand and Caroline Pulver of FSD, Suleiman Asman and to seminar participants at MIT Sloan, Safaricom, the Institute for Money, Technology and Financial Inclusion at UC Irvine and Columbia Business School. 2 [email protected] 3 [email protected]

I. Introduction
Mobile phone technology has reduced communication costs in many parts of the developing world from
prohibitive levels to amounts that are, in comparison, virtually trivial. Nowhere has this transformation
been as acute as in sub‐Saharan Africa, where networks of both fixed line communication and physical
transportation infrastructure are often inadequate, unreliable, and dilapidated. While mobile phone
calling rates remain high by world standards, the technology has allowed millions of Africans to leap‐frog
the land‐line en route to 21st century connectivity.
Early on in this revolution, cell phone users figured out that they could effectively transfer money across
wide distances. Phone companies have long allowed individuals to purchase “air‐time” (i.e., pre‐paid
cell phone credit that can be used for voice or SMS communication) and to send this credit to other
users. It was a small step for the recipient user to on‐sell the received air‐time to a local broker in return
for cash, or indeed for goods and services, thus effecting a transfer of purchasing power from the initial
sender to the recipient.
In March 2007, the leading cell phone company in Kenya, Safaricom, formalized this procedure with the
launch of M‐PESA, an SMS‐based money transfer system that allows individuals to deposit, send, and
withdraw funds using their cell phone. M‐PESA has grown rapidly, reaching approximately 65 percent of
Kenyan households by the end of 2009, and is widely viewed as a success story to be emulated across
the developing world.
This paper provides a description of the service and a review of the potential economic effects primarily
at the household level, but also in terms of macroeconomic and monetary aggregates. It then provides
a detailed portrayal of patterns of use across urban and rural populations, using data from the first large
household survey focused on money transfer services in Kenya.4
II. Context
Mobile phones and mobile banking in Kenya The adoption of mobile phones has occurred at perhaps the fastest rate and to the deepest level of any
consumer‐level technology in history. Figure 1 illustrates the speed of adoption compared with a
variety of product innovations. While cumulative forces are of course important, making it difficult to
compare directly across innovations, it is nonetheless informative to note that cell phones have been
4 Mobile payment systems have also been developed in other developing countries. In the Philippines, Globe Telecom
operates GCASH, and in South Africa WIZZIT facilitates mobile phone‐based transactions through the formal banking
system (Ivatury and Pickens, 2006). Similarly mobile banking technologies have developed in Sudan and Ghana, and in a
number of countries in Latin America and the Middle East (Mas, 2009). For related overviews, see also Mas and Rotman
(2008) and Mas and Kumar (2008), as well as other publications of the Consultative Group to Assist the Poor, at
www.cgap.org .

adopted more than five times as fast as fixed line telephone services, which took 100 years to reach 80
percent of country populations.
Figure 1: Technology adoption for select innovations (number years to reach 80% coverage)5
One of the reasons mobile phone technology has spread quickly is that it has followed other
technologies that may have eased the way. Figure 2 confirms this sequencing property is likely at work,
at least in the US: many of the new technologies that were introduced before about 1950 (with the
exception of radio) were relatively slow to diffuse through the population, whereas those introduced in
the second half of the century saw generally steeper adoption rates. Nonetheless, the speed of
adoption of cell‐phones, especially in the developing world, remains unprecedented.
Figure 2: Technology adoption is getting faster6
5 Data from World Bank.
0 20 40 60 80 100 120 140
Railways
Steel (open hearth)
Telephones
Steel (electric hearth)
Radio
Aviation
Personal computers
Internet use
CAT scan
Mobile phones
Years

The spread of mobile phone technology has been especially rapid and broad in Africa where penetration
rates stood at some 32 percent in 2008, still well below the global average of 60 percent at that time,
but much higher than the 7 percent coverage rate that prevailed just four years before. This pattern
stands in contrast to the adoption of other technologies such as improved seed and fertilizer, which
have been frustratingly weak. Since Solow’s (1956) seminal contribution to the theory of economic
growth, and following later developments (e.g., Romer 1986 and Lucas, 1988), economists have
understood that higher rates of adoption of modern technologies may accelerate the development
process.
In Kenya, the first mobile phone companies were publicly owned, and began operations in the mid‐
1990s on a small scale. Over time, mobile phones in Kenya have eclipsed landlines as the primary means
of telecommunication: while the number of landlines had fallen from about 300,000 in 1999 to around
250,000 by 2008, mobile phone subscriptions had increased from virtually zero to nearly 17 million over
the same time period (Figure 3).7 Assuming an individual has at most one cell phone,8 47% of the
population, or fully 83% of the population 15 years and older, have access to mobile phone technology.
Figure 3: Phone use in Kenya
6 Source: New York Times, February 10, 2008. 7 Figure 3 includes information on the share of our sample who had started using a cell phone by year. The evolution of this figure follows closely that from the aggregate data on cell phone use, providing partial validation of our sampling methodology. 8 This is not quite true, as some individuals own two (or more) phones, so as to take advantage of different tariff policies of the competing providers.
0%
20%
40%
60%
80%
100%
0
2
4
6
8
10
12
14
16
18
1998 2000 2002 2004 2006 2008 2010
Percent of our sample
Millions of subscribers
Fixed lines
Mobile lines
M‐PESA users
Year of first cell phone use (our data, right hand axis)

Safaricom, which began operations in 1997, is currently the largest mobile phone operator in Kenya,
controlling nearly 80 percent of the market, ahead of its three nearest rivals (Airtel (formerly Zain, and
before that Celtel), Yu, and Orange). Recent and prospective entry into the sector is expected to put a
squeeze on Safaricom’s market share, which some commentators (including its chief executive) expect
to fall to around 65 percent over the next 3 to 4 years.9
In March 2007, following a donor‐funded pilot project, Safaricom launched a new mobile phone‐based
payment and money transfer service, known as M‐PESA.10 The service allows users to deposit money
into an account stored on their cell phones, to send balances using SMS technology to other users
(including sellers of goods and services), and to redeem deposits for regular money. Charges, deducted
from users’ accounts, are levied when e‐float or e‐money (the currency in which M‐PESA balances are
denominated) is sent, and when cash is withdrawn.
M‐PESA has spread quickly, and has become one of the most successful mobile phone‐based financial
service in the developing world.11 The average number of new registrations per day exceeded 5,000 in
August 2007, and reached nearly 10,000 in December that year (see Figure 4). By August 2009, a stock
of about 7.7 million M‐PESA accounts had been registered. There are now about 23,000 agents, and
data from late 2009 indicated that even by then more than two‐thirds of Kenyan households had at least
one member who used the service.
Figure 4: Average daily growth in M‐PESA registrations by month
9 See report by International Telecommunication Union, http://www.itu.int/ITU‐D/ict/newslog/Safaricoms+Market+Share+To+Dip+From+80+To+65+As+Competition+Toughens+Kenya.aspx . 10 Pesa is Kiswahili for “money” – hence M[obile]‐Money. 11 Similar services in Tanzania and South Africa, for example, have penetrated the market much less. See Mas and Morawczynski (2009).
0
5,000
10,000
15,000
Number new
users per day

Since the launch of M‐PESA, wary of regulation by the Central Bank of Kenya, Safaricom has been at
pains to stress that M‐PESA is not a bank. On the other hand, the ubiquity of the cell phone across both
urban and rural parts of the country, and the lack of penetration of regular banking services,12 led to
hopes that M‐PESA accounts could substitute for bank accounts, and reach the unbanked population.
Our data, presented in more detail in the next section, suggest this is partially true, although M‐PESA
has been adopted by both the banked and unbanked in roughly equal proportions.13
While the sustained growth in M‐PESA registrations is notable, the volume of financial transactions
mediated through M‐PESA should not be exaggerated. Table 1 reports that the volume of transactions
effected between banks under the RTGS (Real Time Gross Settlement] method is nearly 700 times the
daily value transacted through M‐PESA. On the other hand, the average mobile transaction is about a
hundred times smaller than the average check transaction (Automated Clearing House, or ACH), and
even just half the size of the average Automatic Teller Machine (ATM) transaction.14 Thus M‐PESA is not
designed to replace all payment mechanisms, but has found and filled a niche in the market in which it
provides significantly enhanced financial services.
Table 1: Daily financial transactions, Oct 2007 ‐ Sept 200815
RTGS ACH ATM Mobile
Value per day (billion KSh) 66.3 8.5 1.0 0.1 Transactions per day (thousands) 1.0 39.2 180.2 107.2
Value per transaction (million KSh) 64.67 0.216 0.006 0.003
How does M‐PESA work Although M‐PESA does not pay interest on deposits, and does not make loans, it can usefully be thought
of as providing financial transaction services and that has operated, until recently, in parallel with the
formal banking system.
Safaricom accepts deposits of cash from customers with a Safaricom cell phone SIM card and who have
registered as M‐PESA users. Registration is simple, requiring an official form of identification (typically
the national ID card held by all Kenyans, or a passport) but no other validation documents that are
typically necessary when a bank account is opened. Formally, in exchange for cash deposits, Safaricom
issues a commodity known as e‐float or e‐money, measured in the same units as money, which is held in
an account under the user’s name. This account is operated and managed by M‐PESA, and records the
12 In 2006 it was estimated that 18.9 percent of adults used a bank account or insurance product, and by 2009 this had increased to 22.6 percent. (Finaccess I.) 13 In the time since our survey was first administered, there has been significant growth in the number of individuals, and households, with a bank account, due to the expansion of such institutions as Equity Bank and Family Bank. In addition, a number of banks have very recently allowed consumers to link their M‐PESA and bank accounts. How these changes have affected the relationship between M‐PESA registration and access to banking services remains to be seen. 14 These data refer to a period before M‐PESA could be used at ATMs. 15 Source: Central Bank of Kenya, presentation at conference on Banking & Payment Technologies East Africa, 17‐19 February 2009, Nairobi.
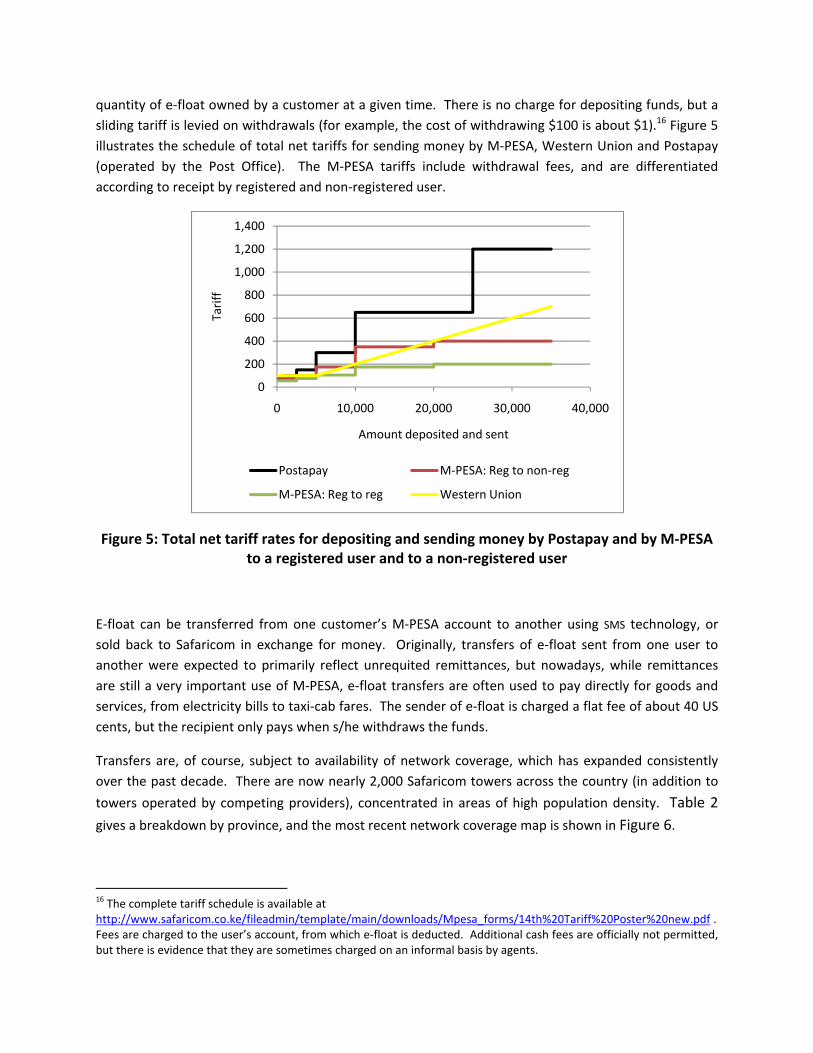
quantity of e‐float owned by a customer at a given time. There is no charge for depositing funds, but a
sliding tariff is levied on withdrawals (for example, the cost of withdrawing $100 is about $1).16 Figure 5
illustrates the schedule of total net tariffs for sending money by M‐PESA, Western Union and Postapay
(operated by the Post Office). The M‐PESA tariffs include withdrawal fees, and are differentiated
according to receipt by registered and non‐registered user.
Figure 5: Total net tariff rates for depositing and sending money by Postapay and by M‐PESA to a registered user and to a non‐registered user
E‐float can be transferred from one customer’s M‐PESA account to another using SMS technology, or
sold back to Safaricom in exchange for money. Originally, transfers of e‐float sent from one user to
another were expected to primarily reflect unrequited remittances, but nowadays, while remittances
are still a very important use of M‐PESA, e‐float transfers are often used to pay directly for goods and
services, from electricity bills to taxi‐cab fares. The sender of e‐float is charged a flat fee of about 40 US
cents, but the recipient only pays when s/he withdraws the funds.
Transfers are, of course, subject to availability of network coverage, which has expanded consistently
over the past decade. There are now nearly 2,000 Safaricom towers across the country (in addition to
towers operated by competing providers), concentrated in areas of high population density. Table 2
gives a breakdown by province, and the most recent network coverage map is shown in Figure 6.
16 The complete tariff schedule is available at http://www.safaricom.co.ke/fileadmin/template/main/downloads/Mpesa_forms/14th%20Tariff%20Poster%20new.pdf . Fees are charged to the user’s account, from which e‐float is deducted. Additional cash fees are officially not permitted, but there is evidence that they are sometimes charged on an informal basis by agents.
0
200
400
600
800
1,000
1,200
1,400
0 10,000 20,000 30,000 40,000
Tariff
Amount deposited and sent
Postapay M‐PESA: Reg to non‐reg
M‐PESA: Reg to reg Western Union
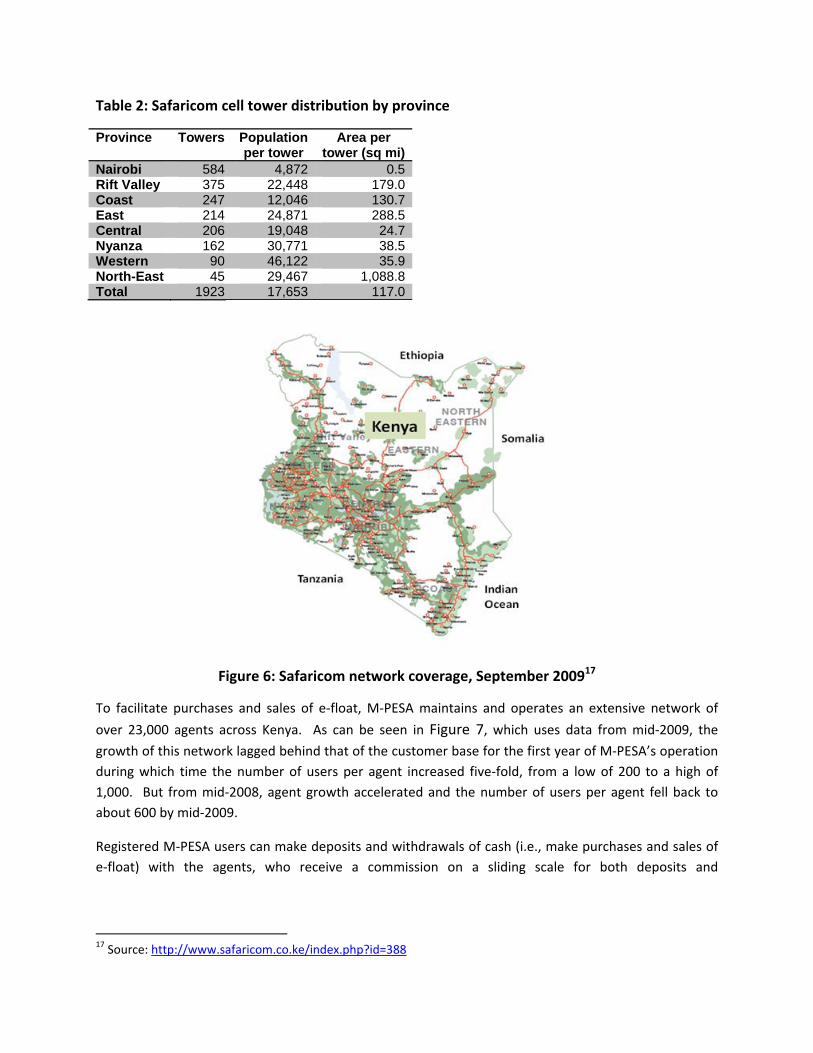
Table 2: Safaricom cell tower distribution by province
Province Towers Population per tower
Area per tower (sq mi)
Nairobi 584 4,872 0.5Rift Valley 375 22,448 179.0Coast 247 12,046 130.7East 214 24,871 288.5Central 206 19,048 24.7Nyanza 162 30,771 38.5Western 90 46,122 35.9North-East 45 29,467 1,088.8Total 1923 17,653 117.0
Figure 6: Safaricom network coverage, September 200917
To facilitate purchases and sales of e‐float, M‐PESA maintains and operates an extensive network of
over 23,000 agents across Kenya. As can be seen in Figure 7, which uses data from mid‐2009, the
growth of this network lagged behind that of the customer base for the first year of M‐PESA’s operation
during which time the number of users per agent increased five‐fold, from a low of 200 to a high of
1,000. But from mid‐2008, agent growth accelerated and the number of users per agent fell back to
about 600 by mid‐2009.
Registered M‐PESA users can make deposits and withdrawals of cash (i.e., make purchases and sales of
e‐float) with the agents, who receive a commission on a sliding scale for both deposits and
17 Source: http://www.safaricom.co.ke/index.php?id=388

withdrawals.18 M‐PESA agents hold e‐float balances on their own cell‐phones, purchased either from
Safaricom19 or from customers, and maintain cash on their premises. Agents therefore face a non‐trivial
inventory management problem, having to predict the time profile of net e‐float needs, while
maintaining the security of their operations.
Figure 7: Expansion of the agent network20
In practice, agents are organized into groups. Originally, M‐PESA required that agent groups operated in
at least three different physical locations, so that the probability of imbalances arising within the group
could be minimized. There are currently three agent group models in operation. In the first, one
member of the agent group (the “head‐office”) deals directly with M‐PESA, while subsidiary agents,
which are owned by the head office, manage cash and e‐float balances through transactions with the
head‐office. Both the head office and the agents can transact directly with M‐PESA users.
The second model under which agents are organized into groups is the Aggregator model. This model is
similar to the first, with the aggregator acting as a head office, dealing directly with Safaricom and
managing the cash and e‐float balances of agents. However, the agents can be independently owned
entities, with which the aggregator has a contractual relationship.
A final and more recent model allows a bank branch, referred to as a “super‐agent,” to perform as
purely an agent for agents. The bank branch can trade cash and e‐float with all M‐PESA agents, but
18 The commission amounts are non‐linear (and concave) in the size of the transaction. Some reports suggest that in response to this, agents encourage customers to split their transactions into multiple pieces, thereby increasing the overall commission. 19 M‐PESA requires that each agent has a bank account, so that funds can be transferred easily between them. 20 Source: Safaricom.
0
200
400
600
800
1000
1200
0
2000
4000
6000
8000
10000
12000
14000
Apr‐07
Jun‐07
Aug‐07
Oct‐07
Dec‐07
Feb‐08
Apr‐08
Jun‐08
Aug‐08
Oct‐08
Dec‐08
Feb‐09
Apr‐09
Jun‐09
Aug‐09
Users per agent
Number of agen
ts
Number agents (LH axis) Users per agent (RH axis)

unlike the regular and aggregator models, the bank does not trade e‐float directly with M‐PESA
customers.
The super‐agent model is one example of the integration of M‐PESA services into the banking system.
Other developments in this vein have seen users with accounts at certain commercial banks (about 65%
of user households in our data in 2009 have at least one bank account – see Table 11 below), being able
to transfer funds between those accounts and their M‐PESA accounts, both via ATMs as well as directly.
The cash collected by M‐PESA in exchange for e‐float is deposited in bank accounts, called M‐PESA trust
accounts. Originally, all funds were held in just one trust account at the Commercial Bank of Africa, but
recently Safaricom has opened an account at two other commercial banks to diversify its risk. These
accounts are very much like regular current accounts, with no restrictions on Safaricom’s access to
funds. In turn, the banks face no special reserve requirements with regard to M‐PESA deposits, which
are treated as any other current account deposit in terms of regulatory policy of the Central Bank.
There is no explicit requirement, for example, for Safaricom to give notice of its intention to withdraw
“large” quantities of cash at a given point in time. As M‐PESA continues to expand, and as these
balances grow, the authorities may decide to revisit this arrangement. An alternative approach,
adopted in the Philippines, is to institute a 100 percent reserve requirement vis‐à‐vis mobile banking
deposit balances held in accounts at commercial banks. The success of M‐PESA has rested in part on the
trust that customers have in one of Kenya’s most well‐respected private companies, the parent. But if
faith in the banking system erodes, a run on M‐PESA could be sparked, thereby jeopardizing the position
of the banks in which it holds deposited funds.
Finally, as M‐PESA deposits enter the banking system, they only reduce cash in circulation to the extent
that banks comply with or exceed official reserve requirements. But as e‐float becomes more widely
acceptable as an easily transferable store of value, it will adopt the features of money. The practical
implication of this is that M‐PESA could increase the effective money supply, with possible impacts on
inflation and /or output. Of theoretical interest is the possibility that two monies could co‐exist in
equilibrium. We will address these issues in more detail in future work.
III. Potential economic impacts on households
M‐PESA facilitates the safe storage and transfer of money. As such, it has a number of potential
economic effects. First, it simply facilitates trade, making it easier for people to pay for, and to receive
payment for, goods and services. Electricity bills can be paid with a push of a few buttons instead of
traveling to an often distant office with a fistful of cash and waiting in a long queue; consumers can
quickly purchase cell phone credit (“airtime”) without moving; and taxi drivers can operate more safely,
without carrying large amounts of cash, when they are paid electronically.
Second, by providing a safe storage mechanism, M‐PESA could increase net household savings.21 Third,
because it facilitates inter‐personal transactions, it could improve the allocation of savings across
households and businesses by deepening the person‐to‐person credit market. This could increase the
average return to capital, thereby producing a feed‐back to the level of saving.
Fourth, by making transfers across large distances trivially cheap, M‐PESA improves the investment in,
and allocation of, human capital as well as physical capital. Households may be more likely to send
members to high‐paying jobs in distant locations (e.g., the capital), either on a permanent or temporary
basis, and to invest in skills that are likely to earn a return in such places but not necessarily at home.
Fifth, M‐PESA could affect the ability of individuals to share risk. Informal risk‐sharing networks have
been found to be an important, although not fully effective, means by which individuals spread risk,
making state‐contingent transfers among group members. By expanding the geographic reach of these
networks, M‐PESA may allow more efficient risk sharing, although the risk‐reducing benefits might be
mitigated due to issues of observability and moral hazard when parties are separated by large distances.
Jack and Suri (2011) describe the risk sharing impacts it has had in Kenya in more detail.
Sixth, a further risk‐related effect arises if M‐PESA facilitates timely transfer of small amounts of money.
Instead of waiting for conditions to worsen to levels that cause long term damage, M‐PESA might enable
support networks to keep negative shocks manageable. For example, a household head with access to
M‐PESA who suffers a mild health shock might receive a small amount of money via M‐PESA that allows
him to keep his children in school. If this money was delayed, or the sender waited until the recipient
“really needed it”, the children might have quit school, the effects of which may be hard to reverse.
Seventh, if M‐PESA allows households to spread risk, they may be led to make more efficient investment
decisions, relaxing the trade‐off between risk and return that they would otherwise face.
M‐PESA could conceivably alter bargaining power and weaken incentives within households or other
networks. Economically weaker family members might expect larger and more regular remittances
from better‐off city‐dwelling relatives, who themselves might find it hard to justify not sending money
home. This could weaken incentives for rural household members to work or innovate, offsetting some
of the efficiency‐enhancing benefits of improved geographic labor allocation and risk sharing.
Conversely, M‐PESA could have the effect of empowering certain household members who have
traditionally had less bargaining power, in particular women. Especially among poorer segments of the
population, remittances and transfers received (and sent) via M‐PESA are less visible than those
transmitted by other means, such as delivery by a friend or relative. Granted this information
advantage, recipients could be in a position to keep more of the funds they receive. Evidence suggesting
the spending patterns of women and men differ (see, e.g., Chattopadhyay and Duflo, 2004) then implies
that the advent of M‐PESA could have real effects on the allocation of household spending. These are
issues we hope to explore more fully in future work.
21 By net, we mean net of losses due to theft, etc.

IV. Survey and data
Survey methodology In September 2008 we undertook a survey of 3,000 randomly selected households across Kenya. At the
time, both cell phone tower and M‐PESA agent coverage were very limited in the remote northern and
eastern parts of the country, so these areas were excluded from the sample frame. The non‐excluded
area covered by the sample frame included 92 percent of Kenya’s population, and 98 percent of M‐PESA
agents as of April 2008. We randomly selected 118 locations (the second‐smallest administrative unit),
in which there were 300 enumeration areas routinely visited by the Kenyan National Bureau of
Statistics. Ten households in each enumeration area were randomly chosen to take part in the survey –
the GPS‐recorded locations of these households are shown in Figure 8. In order to increase our chances
of interviewing households in which someone used M‐PESA, we over‐sampled locations on the basis of
the number of M‐PESA agents present. All figures presented below have been reweighted accordingly.
Figure 8: Interviewed households (lighter areas have higher poverty rates)
In 2009, we conducted a follow‐up survey which managed to reach 2,016 of the original 3,000
households. For the most part, the statistics presented in this report are based on these 2,016
households. Figures 9 and 10 (directly from Safaricom) show the growth in users of M‐PESA and in
agents over the period covered by the data (the vertical lines in the Figures indicate the timing of the
two rounds of the survey).
From Figure 9, it can be seen that there was a huge increase in the use of M‐PESA over the period
spanned by the two rounds of the survey. The number of users here is measured by the total number of
SIM cards registered to M‐PESA. Figure 10 shows a similar expansion in the number of M‐PESA agents.

At the time of the first round of the survey, there were just over 4,000 agents across the country, which
increased fourfold within a year to reach about 16,000.
Figure 9: Growth in M‐PESA Users
Figure 10: Growth in M‐PESA Agents
During the interviews we collected information on basic household composition and demographic data,
data on household wealth and assets, consumption, positive and negative shocks, and remittances. We
also asked for information on the use of financial services, savings, etc., and collected detailed data on
cell phone use and knowledge in general, and use of M‐PESA in particular.

Socioeconomic Characteristics Table 3 reports summary statistics of the households we interviewed, weighted as per our sampling
strategy. The upper panel reports the number of M‐PESA users in each round: users are defined as those
households with at least one member who has used M‐PESA for any purpose. The number of MPESA
users increased dramatically between the two survey rounds: while in 2008 less than half the
households surveyed were M‐PESA users (43 percent), by 2009 nearly 70 percent of households were
M‐PESA users.
The second panel reports household‐level income and wealth indicators. In both rounds of the survey,
users generally report higher annual expenditures and asset holdings than non‐users. However, the
composition of each group has clearly changed over time, as the users in Round 2 have lower mean
expenditures and assets than those in Round 1. This suggests that while M‐PESA use was originally
limited to the wealthiest groups, it is slowly being adopted by a broader share of the population. The
non‐users in Round 2 also appear less well off than those in Round 1, likely because it is the more
affluent of them who became M‐PESA users by the second round of the survey. However, there appears
to have been a decline in expenditures across all households, so it is difficult to parse out the trend and
compositional effects.
The numbers in the bottom panel of Table 1 provide further evidence that, by Round 2, a wider cross‐
section of people had begun to use M‐PESA. As might be expected, the percentage of users in the
banked population and the urban population increased substantially between Rounds 1 and 2. However,
the percentage of users in the unbanked population also increased (from 25 percent in Round 1 to 50
percent in Round 2) as did the percentage of users in rural areas (from 29 percent to 41 percent). Thus,
many of those who became users between Rounds 1 and 2 were those in rural areas and those without
bank accounts. In addition, the table shows that 52 percent of non‐users owned a cell phone in Round
1, while only 39 percent of non‐users owned a cell phone in Round2. This suggests that not owning a cell
phone is a major constraint to adoption of M‐PESA.

Table 3: Household characteristic
Round1 Round2
Non‐users Users All Non‐users Users All
Number of households 1,143 873 2,016 629 1,387 2,016
Share of total 0.57 0.43 1.00 0.31 0.69 1.00
Income and wealth
Annual Household Expenditure (KSh) 172,181 305,684 230,005 118,452 245,105 205,599
(221,960) (434,581) (337,712) (100,437) (240,852) (215,626)
Assets (KSh) 77,706 209,769 134,910 55,652 166,478 132,187
(299,111) (576,102) (445,713) (222,091) (715,700) (609,538)
Wealth index ‐0.571 0.747 0.000 ‐0.929 0.416 0.000
(1.529) (1.826) (1.788) (1.464) (1.828) (1.832)
Other characteristics
Share of households with at least one cell phone 0.52 0.92 0.69 0.39 0.92 0.75
Share of households with at least one bank account 0.34 0.71 0.50 0.23 0.65 0.52
Share of the unbanked population in each category 0.75 0.25 1.00 0.50 0.50 1.00
Share of the banked population in each category 0.38 0.62 1.00 0.14 0.86 1.00
Share of rural population in each category 0.71 0.29 1.00 0.41 0.59 1.00
Share of urban population in each category 0.47 0.53 1.00 0.24 0.76 1.00
Notes: All figures reweighted accordingly. Standard deviations in ( ).
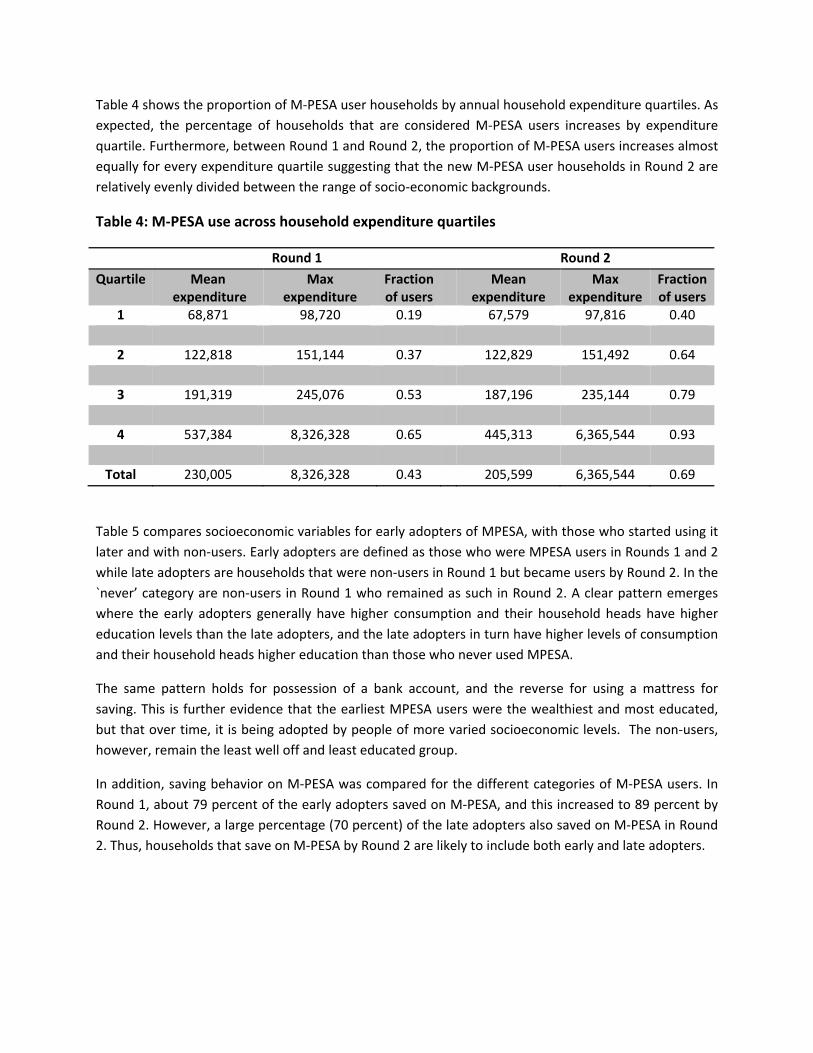
Table 4 shows the proportion of M‐PESA user households by annual household expenditure quartiles. As
expected, the percentage of households that are considered M‐PESA users increases by expenditure
quartile. Furthermore, between Round 1 and Round 2, the proportion of M‐PESA users increases almost
equally for every expenditure quartile suggesting that the new M‐PESA user households in Round 2 are
relatively evenly divided between the range of socio‐economic backgrounds.
Table 4: M‐PESA use across household expenditure quartiles
Round 1 Round 2
Quartile Mean expenditure
Max expenditure
Fraction of users
Mean expenditure
Max expenditure
Fraction of users
1 68,871 98,720 0.19 67,579 97,816 0.40
2 122,818 151,144 0.37 122,829 151,492 0.64
3 191,319 245,076 0.53 187,196 235,144 0.79
4 537,384 8,326,328 0.65 445,313 6,365,544 0.93
Total 230,005 8,326,328 0.43 205,599 6,365,544 0.69
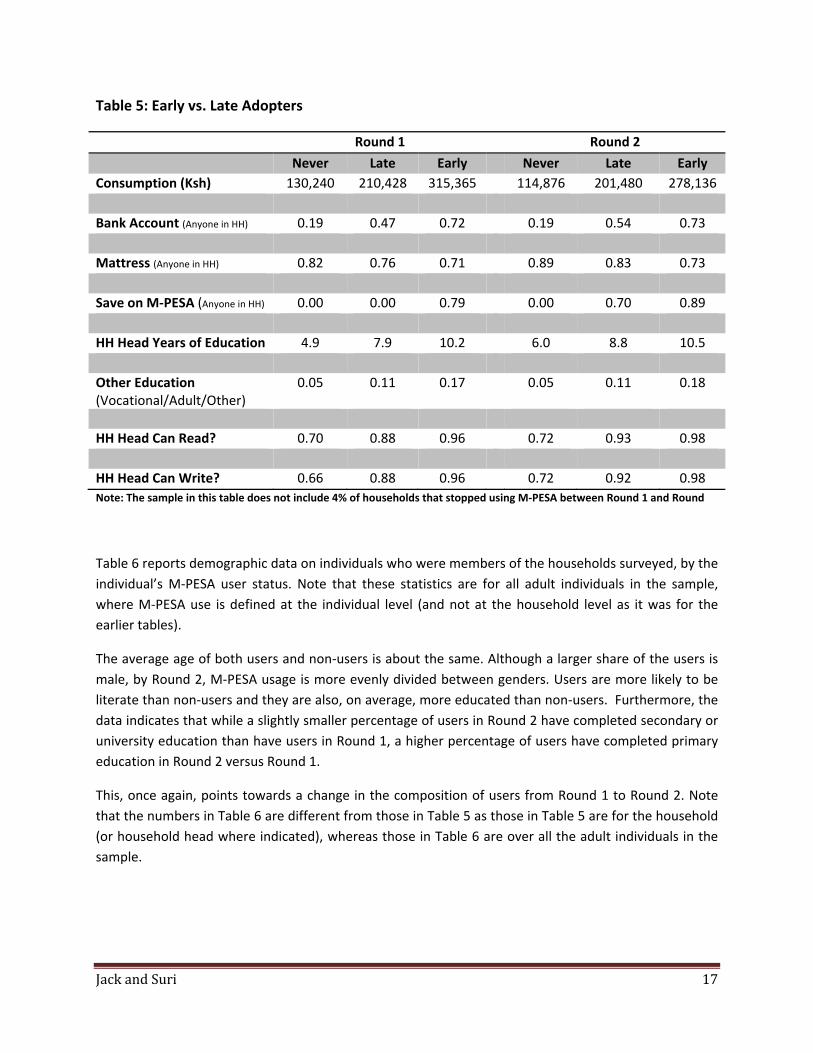
Table 5 compares socioeconomic variables for early adopters of MPESA, with those who started using it
later and with non‐users. Early adopters are defined as those who were MPESA users in Rounds 1 and 2
while late adopters are households that were non‐users in Round 1 but became users by Round 2. In the
`never’ category are non‐users in Round 1 who remained as such in Round 2. A clear pattern emerges
where the early adopters generally have higher consumption and their household heads have higher
education levels than the late adopters, and the late adopters in turn have higher levels of consumption
and their household heads higher education than those who never used MPESA.
The same pattern holds for possession of a bank account, and the reverse for using a mattress for
saving. This is further evidence that the earliest MPESA users were the wealthiest and most educated,
but that over time, it is being adopted by people of more varied socioeconomic levels. The non‐users,
however, remain the least well off and least educated group.
In addition, saving behavior on M‐PESA was compared for the different categories of M‐PESA users. In
Round 1, about 79 percent of the early adopters saved on M‐PESA, and this increased to 89 percent by
Round 2. However, a large percentage (70 percent) of the late adopters also saved on M‐PESA in Round
2. Thus, households that save on M‐PESA by Round 2 are likely to include both early and late adopters.
Jack and Suri 17
Table 5: Early vs. Late Adopters
Round 1 Round 2
Never Late Early Never Late Early
Consumption (Ksh) 130,240 210,428 315,365 114,876 201,480 278,136
Bank Account (Anyone in HH) 0.19 0.47 0.72 0.19 0.54 0.73
Mattress (Anyone in HH) 0.82 0.76 0.71 0.89 0.83 0.73
Save on M‐PESA (Anyone in HH) 0.00 0.00 0.79 0.00 0.70 0.89
HH Head Years of Education 4.9 7.9 10.2 6.0 8.8 10.5
Other Education (Vocational/Adult/Other)
0.05 0.11 0.17 0.05 0.11 0.18
HH Head Can Read? 0.70 0.88 0.96 0.72 0.93 0.98
HH Head Can Write? 0.66 0.88 0.96 0.72 0.92 0.98
Note: The sample in this table does not include 4% of households that stopped using M‐PESA between Round 1 and Round
Table 6 reports demographic data on individuals who were members of the households surveyed, by the
individual’s M‐PESA user status. Note that these statistics are for all adult individuals in the sample,
where M‐PESA use is defined at the individual level (and not at the household level as it was for the
earlier tables).
The average age of both users and non‐users is about the same. Although a larger share of the users is
male, by Round 2, M‐PESA usage is more evenly divided between genders. Users are more likely to be
literate than non‐users and they are also, on average, more educated than non‐users. Furthermore, the
data indicates that while a slightly smaller percentage of users in Round 2 have completed secondary or
university education than have users in Round 1, a higher percentage of users have completed primary
education in Round 2 versus Round 1.
This, once again, points towards a change in the composition of users from Round 1 to Round 2. Note
that the numbers in Table 6 are different from those in Table 5 as those in Table 5 are for the household
(or household head where indicated), whereas those in Table 6 are over all the adult individuals in the
sample.

Jack and Suri 18
Table 6: Individual Characteristics
Round1 Round2
Non‐users Users Total Non‐users Users Total
Count 3,907 958 4,865 2,772 2,327 5,099
Age (years) 36.0 36.3 36.0 36.0 36.7 36.3
(16.1) (12.3) (15.4) (16.8) (13.0) (15.2)
Sex (share male) 0.46 0.62 0.49 0.44 0.56 0.50
(0.50) (0.49) (0.50) (0.50) (0.50) (0.50)
Share who can read 0.87 0.97 0.89 0.84 0.98 0.91
(0.33) (0.18) (0.31) (0.36) (0.14) (0.29)
Share who can write 0.86 0.96 0.88 0.84 0.98 0.90
(0.35) (0.19) (0.32) (0.37) (0.14) (0.30)
Educational attainment (share)
None 0.24 0.08 0.21 0.10 0.01 0.06
(0.43) (0.26) (0.41) (0.30) (0.11) (0.24)
Primary 0.30 0.20 0.28 0.52 0.32 0.43
(0.46) (0.40) (0.45) (0.50) (0.47) (0.49)
Secondary 0.36 0.46 0.38 0.31 0.45 0.37
(0.48) (0.50) (0.49) (0.46) (0.50) (0.48)
University 0.03 0.10 0.04 0.01 0.08 0.04
(0.16) (0.30) (0.20) (0.10) (0.27) (0.20)
Other 0.07 0.17 0.09 0.05 0.14 0.09
(0.26) (0.37) (0.29) (0.22) (0.35) (0.29)

Jack and Suri 19
Remittances
The primary function of M‐PESA, at least as it was conceived, is to reduce the costs of making
remittances from one individual to another, especially across large distances. We collected detailed
data on all kinds of remittances, both monetary and in‐kind, and sent by all means. Table 7 reports the
shares of households in the sample who sent or received remittances in any form (goods, money, e‐
float, etc.), by rural/urban location and by M‐PESA use.
On average households are more likely to send remittances than receive remittances although this
difference is reduced in Round 2. In both Rounds 1 and 2, similar percentages of urban and rural
households receive remittances, but a much larger percentage of urban households send remittances. In
Round 1, M‐PESA users are much more likely to send and receive remittances than non‐users, and this
difference is even more pronounced in Round 2.
Table 7: Who makes remittances ‐ both money and goods
Round1 Round2
Send Receive Send Receive
Total 46% 38% 49% 45%
By geographic location
Rural 34% 36% 36% 45%
Urban 55% 40% 58% 46%
By M‐PESA use
Non‐user 32% 26% 17% 19%
User 65% 54% 63% 58%
Indicators of frequency and size of remittances sent and received are reported in Table 8. On average,
households in Round 1 sent and received remittances every three to four months and households in
Round 2 every two to three months.
M‐PESA users generally sent and received remittances more frequently than non‐users, however the
total amount they sent and received is not very different from the average household. Users sent about
half their remittances in Round 1 by M‐PESA, this increased to about 75 percent of their remittances in
Round 2. In both Rounds 1 and 2 they received about half their remittances by MPESA. The value of the
remittance sent or received was generally lower for those transactions using M‐PESA than for those
using other methods.
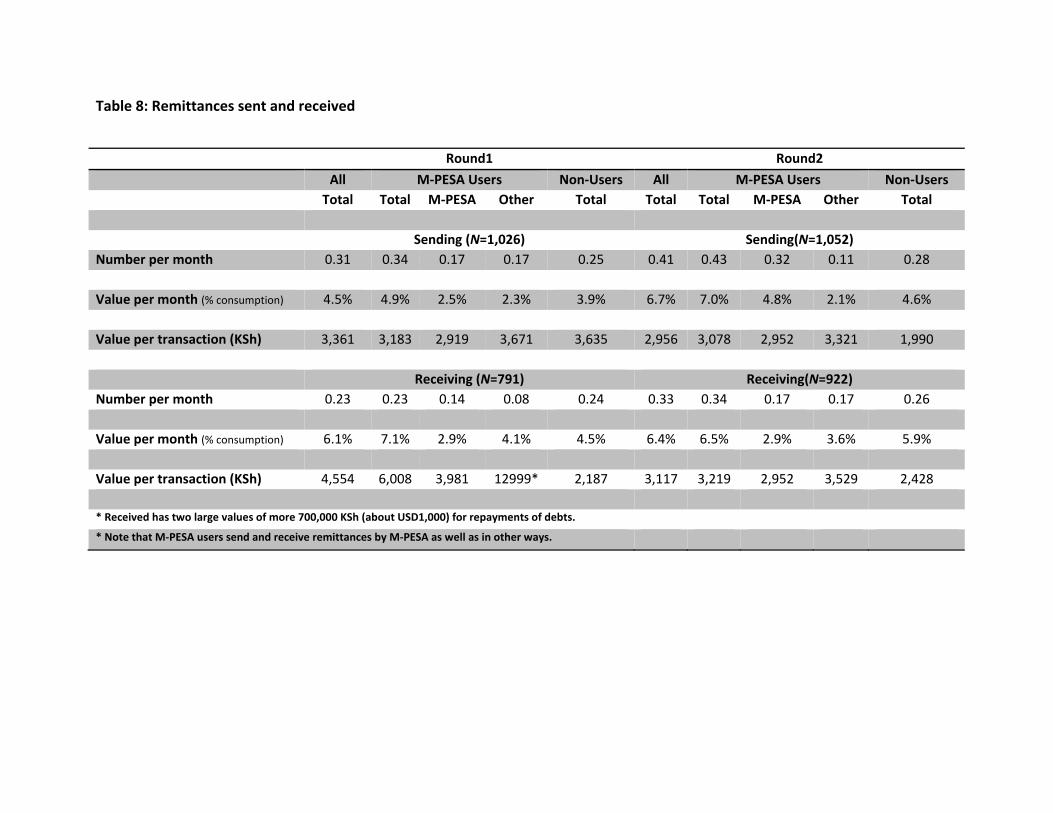
Table 8: Remittances sent and received
Round1 Round2
All M‐PESA Users Non‐Users All M‐PESA Users Non‐Users
Total Total M‐PESA Other Total Total Total M‐PESA Other Total
Sending (N=1,026) Sending(N=1,052) Number per month 0.31 0.34 0.17 0.17 0.25 0.41 0.43 0.32 0.11 0.28
Value per month (% consumption) 4.5% 4.9% 2.5% 2.3% 3.9% 6.7% 7.0% 4.8% 2.1% 4.6%
Value per transaction (KSh) 3,361 3,183 2,919 3,671 3,635 2,956 3,078 2,952 3,321 1,990
Receiving (N=791) Receiving(N=922) Number per month 0.23 0.23 0.14 0.08 0.24 0.33 0.34 0.17 0.17 0.26
Value per month (% consumption) 6.1% 7.1% 2.9% 4.1% 4.5% 6.4% 6.5% 2.9% 3.6% 5.9%
Value per transaction (KSh) 4,554 6,008 3,981 12999* 2,187 3,117 3,219 2,952 3,529 2,428 * Received has two large values of more 700,000 KSh (about USD1,000) for repayments of debts. * Note that M‐PESA users send and receive remittances by M‐PESA as well as in other ways.

Table 9: Destination and origin of remittances
Round1 Round2
Non‐MPESA transactions MPESA transactions Total Non‐MPESA transactions MPESA transactions Total
Destination of remittance Spouse 9% 9% 9% 6% 8% 8%
Parent 46% 40% 44% 47% 29% 35%
Child 11% 10% 10% 16% 15% 16%
Other relative 14% 17% 15% 18% 24% 22%
Friend 6% 13% 8% 10% 18% 15%
Other 14% 12% 13% 4% 5% 5%
Origin of remittance
Spouse 9% 18% 12% 6% 13% 9%
Parent 16% 4% 12% 9% 5% 7%
Child 27% 20% 25% 26% 21% 23%
Other relative 30% 37% 33% 25% 23% 24%
Friend 17% 20% 18% 28% 25% 27%
Other 1% 0% 1% 7% 13% 9%

Table 9 reports the destination and origin of household remittances. About half of remittances seem to
go from children to their parents: recipients are most likely to be parents and senders are most likely to
be children or other relatives. Remittances sent by MPESA are less likely to go to parents, but more
likely to go to other relatives or friends. This holds true for remittances received by M‐PESA as well –
they are much more likely to be received from friends and other family members than remittances
received through other methods. This suggests that M‐PESA is used more frequently by younger people
and people outside the direct parent‐child relationship. This may also signal that M‐PESA users have
and/or take advantage of much broader networks than non‐users (something we will study more closely
in future research).
Table 10 compares the remittance behavior of early versus late adopters of MPESA as well as non‐users
of MPESA. The results are very similar to our earlier comparisons of early versus late users, and
comparisons of these two groups with non‐users. A higher percentage of the early adopters sent and
received remittances than either the late adopters or the non‐users. In Round 1, the late adopters were
more likely to send remittances than the non‐users but about equally likely to receive remittances. By
Round 2, the late adopters were much more likely to both send and receive remittances than the non‐
users, suggesting that there is a relationship between the adoption of MPESA and remittance behavior.
The size of the remittances follow the general pattern with the early adopters sending and receiving the
highest amounts, and the non‐users sending and receiving the lowest amounts.
Table 10: Early vs. Late Adopters II
Round 1 Round 2
Never Late Early Never Late Early
Send Money? 0.26 0.37 0.66 0.18 0.55 0.69
Receive Money? 0.24 0.26 0.55 0.19 0.55 0.59
Amount Sent 3,269 5,814 10,294 1,646 4,438 7,599
Amount Received 2,415 3,357 12,285* 2,428 4,508 5,458
Net Receiver? 0.22 0.22 0.37 0.17 0.35 0.31
Net Receipts ‐855 ‐2,556 2,092 752 82 ‐2,128
* Received has two large values of more 700,000 KSh (about USD1,000) for repayments of debts.
Note the numbers in this table do not include the 4% of households that dropped M‐PESA between Round 1 and Round 2

Saving
Because individuals do not need to withdraw or send balances immediately, they are able to accumulate
savings on their M‐PESA accounts over time. Thus M‐PESA has become a savings instrument, as well as
a means to send money.22 Table 11 reports on the different types of savings instruments used by
households by their M‐PESA user status24. In Round 1 about 75 percent of users used MPESA for saving
and by Round 2 this had increased to 81 percent. Users are much more likely to use a bank account to
save than are non‐users. A large percentage of households save money at home “under the mattress”
(about 80 percent) although a slightly smaller percentage of users do than non‐users. The users in
Round 2 are less likely to save in a bank account and more likely to use a mattress for saving than are
the users in Round 1‐ again, this is likely because users in Round 2 encompass a larger share of the
population.
Table 11: Savings instruments used by households
Round1 Round2
Non‐users Users All Non‐users Users All
M‐PESA 0.00 0.76 0.33 0.00 0.81 0.56
Bank account 0.34 0.71 0.50 0.23 0.65 0.52
Mattress 0.79 0.71 0.76 0.89 0.77 0.81
SACCO 0.15 0.24 0.19 0.10 0.21 0.18
Merry‐go‐round 0.39 0.42 0.40 0.38 0.52 0.47
HH member 0.13 0.15 0.14 0.13 0.13 0.13
Family member 0.04 0.04 0.04 0.03 0.03 0.03
Friend 0.03 0.05 0.04 0.02 0.02 0.02
Advance purchase 0.03 0.04 0.04 0.05 0.06 0.06
Stocks 0.05 0.18 0.11 0.01 0.11 0.08
22 Sometimes money is stored in an M‐PESA account simply to save a person from carrying too much cash, especially for example on long and potentially dangerous bus trips. 24 Here modes of savings are defined to the respondent as any instrument where they have held cash for more than twenty four hours.

Jack and Suri 24
In Table 12 we compare the proportion of M‐PESA users that save on M‐PESA depending on whether
the household owns a bank account or not. M‐PESA users who own a bank account are much more
likely to save on M‐PESA than those who do not, and this is true in both Round 1 and Round 2. The
proportion of M‐PESA users who save on M‐PESA increases between Round 1 and Round 2 among both
the banked and unbanked population, however the increase is larger for the banked population.
Table 12: Probability of saving on M‐PESA across households with and without a bank
account
Probability Save on M‐PESA
Round 1 Round 2
No Bank account 0.65 0.68
Bank account 0.80 0.88
Total 0.76 0.81
Table 13: Reasons for household use and non‐use of MPESA for saving
Round 1 Round2
Reason Non‐users Users Non‐users Users
Safety 0.03 0.26 0.01 0.26
Ease 0.01 0.43 0.01 0.41
Cost 0.09 0.07 0.09 0.07
No access 0.20 0.00 0.21 0.01
Confidentiality 0.02 0.02 0.01 0.02
Emergency 0.00 0.12 0.00 0.22
No Reason 0.28 0.07 0.41 0.01
No need 0.17 0.00 0.25 0.00
Other 0.19 0.01 0.01 0.00
Jack and Suri 25
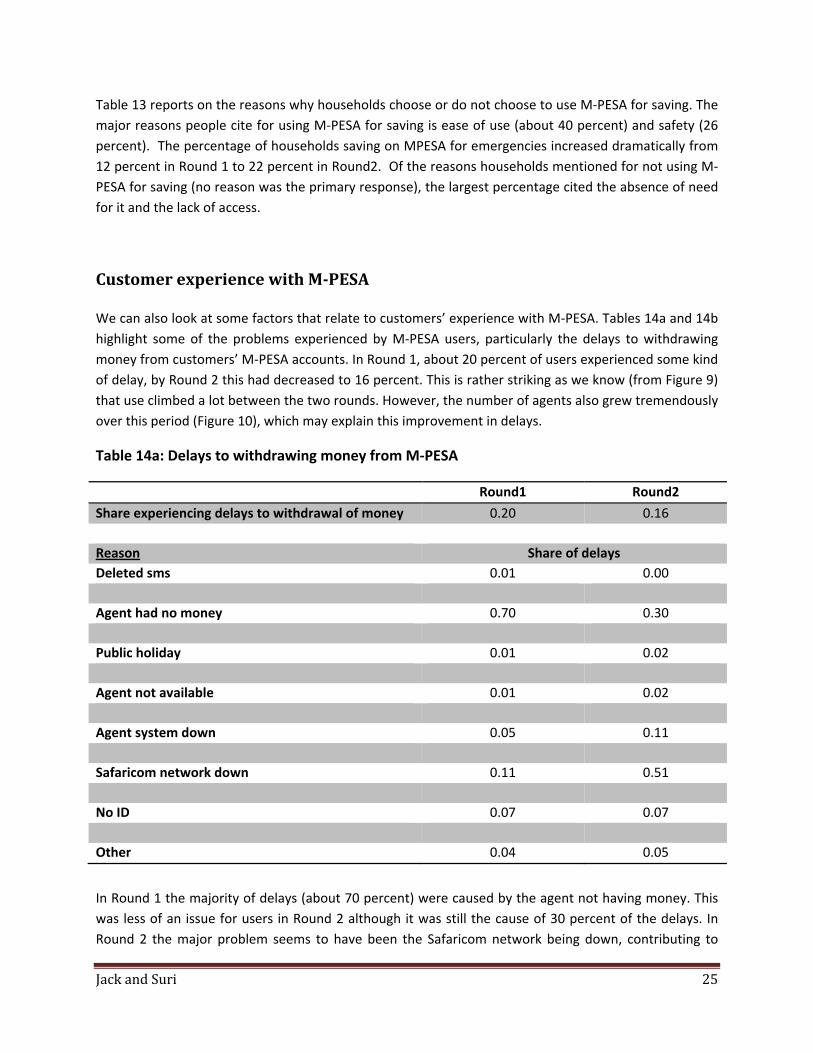
Table 13 reports on the reasons why households choose or do not choose to use M‐PESA for saving. The
major reasons people cite for using M‐PESA for saving is ease of use (about 40 percent) and safety (26
percent). The percentage of households saving on MPESA for emergencies increased dramatically from
12 percent in Round 1 to 22 percent in Round2. Of the reasons households mentioned for not using M‐
PESA for saving (no reason was the primary response), the largest percentage cited the absence of need
for it and the lack of access.
Customer experience with M‐PESA
We can also look at some factors that relate to customers’ experience with M‐PESA. Tables 14a and 14b
highlight some of the problems experienced by M‐PESA users, particularly the delays to withdrawing
money from customers’ M‐PESA accounts. In Round 1, about 20 percent of users experienced some kind
of delay, by Round 2 this had decreased to 16 percent. This is rather striking as we know (from Figure 9)
that use climbed a lot between the two rounds. However, the number of agents also grew tremendously
over this period (Figure 10), which may explain this improvement in delays.
Table 14a: Delays to withdrawing money from M‐PESA
Round1 Round2
Share experiencing delays to withdrawal of money 0.20 0.16
Reason Share of delays
Deleted sms 0.01 0.00
Agent had no money 0.70 0.30
Public holiday 0.01 0.02
Agent not available 0.01 0.02
Agent system down 0.05 0.11
Safaricom network down 0.11 0.51
No ID 0.07 0.07
Other 0.04 0.05
In Round 1 the majority of delays (about 70 percent) were caused by the agent not having money. This
was less of an issue for users in Round 2 although it was still the cause of 30 percent of the delays. In
Round 2 the major problem seems to have been the Safaricom network being down, contributing to

Jack and Suri 26
about half the delays. However, it is important to note that most of these delays were resolved fairly
quickly. About 79 percent of delays were resolved within a day for users in Round 1 and 81 percent were
resolved within a day for users in Round 2.
Table 14b: Delay until withdrawal possible
Delay until withdrawal possible Round1 Round2
Hour or less 0.18 0.34
Half a day 0.28 0.15
A day 0.33 0.32
A few days 0.17 0.03
A week 0.02 0.00
Several weeks N/A 0.00
Several months 0.02 0.01
Never 0.00 0.00
Went to another agent N/A 0.14
Users were also asked about their experiences with the agent closest to them (Round 1) or the agent
with whom they conducted their last two transactions (Round 2) and these data are reported in Table
15. Note that this question was changed across rounds. The reason was that the growth in use and in
the number of agents meant that asking about the closest agent was not very useful (since a lot of
respondents had more than one closest agent) and asking about the most used agent as we did in
Round 1 did not make sense for Round 2. Therefore, in Round 2, we asked detailed questions about the
last two M‐PESA transactions that customers did with agents.
In general, users in Round 2 had a better experience with their agents, as a smaller percentage of them
experienced problems with withdrawing or depositing money. Furthermore, 95 percent of users in
Round 2 were asked by the agent to show ID (as required for security reasons), while only 77 percent
were asked in Round 1. In addition, a much larger percentage of users in Round 2 trust their agent (95
percent) than did users in Round 1 (65 percent).
These numbers suggest that the quality of MPESA services have improved dramatically over time, as has
the general level of trust that users have in the system. The difference in these numbers over time is all
the more striking given that there are a lot more users in Round 2 and that these newer users tend to be
poorer households and have less educated heads.

Jack and Suri 27
Table 15: Reported experiences with agents
Round1 (closest agent) Round2 (last 2 transactions)
Fraction unable to withdraw from agent 0.16 0.05
Fraction unable to deposit money with agent 0.07 0.04
Fraction asked by agent to show ID 0.77 0.95
Fraction who trust agent 0.65 0.95
Overall, users seem to be quite satisfied with their M‐PESA services. When asked to rank on a scale of 1
to 10 how happy they were with M‐PESA, in Round 1 over half reported a rank of 10 and over 90
percent reported values of 8 or above (Table 16a). The happiness ranks were lower for users in Round2,
with about 35 percent reporting a rank of 10 and 88 percent reporting a value of 8 or above.
However, when asked about the impact of MPESA closing down (Table 16b), a higher percentage of
users in Round 2 (92 percent) said that it would be large and negative than did users in Round 1 (85
percent). Thus, it is not clear whether users in Round 2 are less satisfied with the quality of the services
provided or whether they simply have higher expectations.
Table 16a: Measures of satisfaction with M‐PESA: Happiness with M‐PESA
Round1 Round2
Extremely unhappy 1 0.008 0.002
2 0.003 0.002
3 0.001 0.006
4 0.001 0.002
5 0.005 0.022
6 0.024 0.022
7 0.055 0.065
8 0.129 0.199
9 0.221 0.332
Extremely happy 10 0.554 0.347
Table 16b: Measures of satisfaction with M‐PESA: Impact of closing down of M‐PESA
Large Negative Small Negative None Small Positive
Round 1 0.85 0.10 0.03 0.02
Round 2 0.91 0.08 0.01 0.01

Jack and Suri 28
Individual non‐users of M‐PESA were also asked their reasons for not using M‐PESA, as reported in Table
17. In Round 1, about 18 percent of non‐users said that they didn’t know about M‐PESA, while in Round
2 only 3 percent did, indicating that awareness of M‐PESA grew dramatically over the year and is now,
therefore, a negligible constraint to adoption of M‐PESA. About 14 percent of non‐users said that they
didn’t need M‐PESA in Round 1, while 21 percent cited this reason in Round2. The major constraint to
adoption of M‐PESA, however, appears to be access to a cell phone. In both Rounds 1 and 2, not owning
a cell‐phone was the primary reason cited although a much larger percentage mentioned it in Round 2
(60 percent) than in Round 1 (28 percent). This suggests that many of those individuals who adopted M‐
PESA between Round 1 and Round 2 were those who already owned cell phones.
Table 17: Individuals’ reasons for non‐use of M‐PESA
Reason Round1 Round2
Don’t know about it 0.18 0.03
Don’t need it 0.14 0.21
No network available 0.00 0.00
Celtel (or Zain) customer 0.04 N/A
Don’t own a mobile phone 0.28 0.60
Don’t understand it 0.05 0.05
Too complicated 0.01 0.02
Too costly 0.01 0.07
Not safe/Don’ t trust it 0.00 0.03
No agents where I live 0.01 0.01
No agents where my recipient lives 0.01 0.00
Happy with existing money transfer service 0.02 N/A
Other 0.17 0.16
No response 0.08 N/A

Jack and Suri 29
V. Conclusions
As the developed world begins to rebuild the recently collapsed global financial system, the financial
architecture in parts of the developing world is being rapidly transformed. As the costs of mobile phone
technology have fallen, and as the technology has been adapted to support financial services, mobile
banking innovations have begun to spread across and within poor countries. The low cost, and the
widespread unmet demand for financial services, as captured by low rates of bank access, means that
mobile banking has the potential to reach remote corners of the socio‐economic, as well as geographic,
spectrum.
That potential appears to be being realized in Kenya, through M‐PESA, a mobile banking system
operated by Safaricom. We estimate that M‐PESA had reached nearly 40 percent of the adult
population after a little more than 2 years of operation, and that now, approaching only the fourth
anniversary of its launch, is used by more than two‐thirds of households. Part of this success is due to a
rapidly expanding network of M‐PESA agents, who now number over 23,000. The descriptive statistics
across rounds suggest that the product has been adopted by an ever‐broadening cross‐section of the
population. While it has always been used by a non‐negligible share of those with lower economic
means, it has quickly expanded its reach into these groups, and is now used by households with a wide
range of economic, demographic, and educational characteristics.
M‐PESA is an innovation that clearly dominates its money‐transfer predecessors on virtually all
dimensions. Users say it is faster, cheaper, more reliable, and safer, and a very large majority report
that they would suffer significant negative consequences if it were to be shut down.
These expressed preferences suggest that M‐PESA is valued more by individuals than it costs. On the
other hand, the precise source of these benefits – i.e., the specific economic impacts of M‐PESA – is not
easy to calculate. We have identified a number of potential economic effects of M‐PESA at the
household level – for example from impacts on saving and investment, to risk spreading and insurance.
At the macroeconomic level, there could be important impacts on the money supply and inflation, with
implications for the extent of Central Bank regulation and the conduct of monetary policy. We hope to
explore these issues empirically in future work.

Jack and Suri 30
References
Chattopadhyay, Raghabendra and Esther Duflo (2004): “Women as policy makers: evidence from a
randomized policy experiment in India,” Econometrica, 72(5), 1409‐43.
Jack, William and Tavneet Suri (2011): “The Risk Sharing Benefits of Mobile Money”, Working Paper,
January 2011.
Ivatury, Gautam and Mark Pickens (2006): “Mobile Phone Banking and Low‐Income Customers: Evidence
from South Africa,” Consultative Group to Assist the Poor, Washington DC.
Lucas, Robert (1988): “On the mechanics of economic development,” Journal of Monetary Economics,
22, 3‐42.
Mas, Ignacio (2009): “The economics of branchless banking,” Innovations, 4(2), 57‐76, MIT Press.
Mas and Morawczynski (2009): “Designing Mobile Money Services: Lessons from M‐PESA,” Innovations,
4(2), 77‐92, MIT Press.
Mas, Ignacio and Sarah Rotman (2008): “Going Cashless at the Point of Sale: Hits and Misses in
Developed Countries,” Consultative Group to Assist the Poor, Focus Note No. 51, Washington DC.
Mas, Ignacio and Kabir Kumar (2008): “Banking on Mobiles: Why, How, for Whom?,” Consultative Group
to Assist the Poor, Focus Note No. 48, Washington DC.
Romer, Paul (1986): “Increasing Returns and Long‐Run Growth,” Journal of Political Economy, October,
94:5, 1002‐37.
Solow, Robert (1956): "A Contribution to the Theory of Economic Growth," Quarterly Journal of
Economics.