mobile money in tanzania: use, barriers, and opportunity - intermedia
TRANSCRIPT
Mobile Money in Tanzania
The Financial inclusion Tracker surveys ProjecT, February 2013
Use, barriers and opporTUniTies
2 Mobile Money in Tanzania: Use, Barriers and Opportunities
ExEcutivE Summary . . . . . . . . . . . . . . . . . . . . . . . . . . . . . . . . . . . . . . . . . . . . . . . . . . . . . . . . . . . . . . . . . . . .3
GloSSary . . . . . . . . . . . . . . . . . . . . . . . . . . . . . . . . . . . . . . . . . . . . . . . . . . . . . . . . . . . . . . . . . . . . . . . . . . . . . . . .5
mEthodoloGy . . . . . . . . . . . . . . . . . . . . . . . . . . . . . . . . . . . . . . . . . . . . . . . . . . . . . . . . . . . . . . . . . . . . . . . . . . .6
tanzania country ProfilE . . . . . . . . . . . . . . . . . . . . . . . . . . . . . . . . . . . . . . . . . . . . . . . . . . . . . . . . . . . . .7
mobilE monEy adoPtion . . . . . . . . . . . . . . . . . . . . . . . . . . . . . . . . . . . . . . . . . . . . . . . . . . . . . . . . . . . . . . .9Mobile money adoption at the household level . . . . . . . . . . . . . . . . . . . . . . . . . . . . . . . . . . . . . . . . . . . . . . . . . .9Mobile money adoption at the individual level . . . . . . . . . . . . . . . . . . . . . . . . . . . . . . . . . . . . . . . . . . . . . . . . . .10Market share in the Tanzanian mobile money services sector . . . . . . . . . . . . . . . . . . . . . . . . . . . . . . . . . . . . . . .10
motivatorS for and barriErS to thE adoPtion of mobilE monEy SErvicES . . . . . . .13The dynamics of adoption and use . . . . . . . . . . . . . . . . . . . . . . . . . . . . . . . . . . . . . . . . . . . . . . . . . . . . . . . . . . 13Sources of information about mobile money . . . . . . . . . . . . . . . . . . . . . . . . . . . . . . . . . . . . . . . . . . . . . . . . . . .14Mobile money adoption motivators . . . . . . . . . . . . . . . . . . . . . . . . . . . . . . . . . . . . . . . . . . . . . . . . . . . . . . . . . .14Barriers to mobile money adoption . . . . . . . . . . . . . . . . . . . . . . . . . . . . . . . . . . . . . . . . . . . . . . . . . . . . . . . . . .14Mobile money use for personal savings . . . . . . . . . . . . . . . . . . . . . . . . . . . . . . . . . . . . . . . . . . . . . . . . . . . . . . . .17Mobile money use for business . . . . . . . . . . . . . . . . . . . . . . . . . . . . . . . . . . . . . . . . . . . . . . . . . . . . . . . . . . . . . .17Lessons from registered mobile money users’ recent experiences with mobile money agents . . . . . . . . . . . . . . . .18
houSEholdS’ financial routinES and thE rolE of mobilE monEy . . . . . . . . . . . . . . . . .19Remittances: Sending and receiving patterns . . . . . . . . . . . . . . . . . . . . . . . . . . . . . . . . . . . . . . . . . . . . . . . . . . .19Non-remittance payments: Sending and receiving patterns . . . . . . . . . . . . . . . . . . . . . . . . . . . . . . . . . . . . . . . . .22Mechanisms for household savings . . . . . . . . . . . . . . . . . . . . . . . . . . . . . . . . . . . . . . . . . . . . . . . . . . . . . . . . . . .23Insurance and loans . . . . . . . . . . . . . . . . . . . . . . . . . . . . . . . . . . . . . . . . . . . . . . . . . . . . . . . . . . . . . . . . . . . . . .24
houSEholdS’ rESPonSES to Economic ShockS . . . . . . . . . . . . . . . . . . . . . . . . . . . . . . . . . . . . . .27Negative economic shocks . . . . . . . . . . . . . . . . . . . . . . . . . . . . . . . . . . . . . . . . . . . . . . . . . . . . . . . . . . . . . . . . .27Positive economic shocks . . . . . . . . . . . . . . . . . . . . . . . . . . . . . . . . . . . . . . . . . . . . . . . . . . . . . . . . . . . . . . . . . .28
concluSionS . . . . . . . . . . . . . . . . . . . . . . . . . . . . . . . . . . . . . . . . . . . . . . . . . . . . . . . . . . . . . . . . . . . . . . . . . . .29
EndnotES . . . . . . . . . . . . . . . . . . . . . . . . . . . . . . . . . . . . . . . . . . . . . . . . . . . . . . . . . . . . . . . . . . . . . . . . . . . . . .30
Table of ConTenTs

InterMedia 3
eXeCUTiVe sUMMary
In 2011, the Bill & Melinda Gates Foundation’s (BMGF) Financial Services for the Poor (FSP) program commissioned InterMedia to design and implement a project to track the uptake, use and market potential of mobile money (m-money) services in Pakistan, Uganda and Tanzania.
The findings from the Financial Inclusion Tracker Surveys Project (FITS), which includes annual panel-based surveys conducted on a national scale, are intended to support the m-money activities of the BMGF, development organizations, mobile operators, regulators and others who play active roles in m-money ecosystems. The surveys also are designed to facilitate analyses of m-money’s relationship to household financial behaviors, particularly a household’s ability to manage economic shocks.
This summary presents the key findings from the first annual FITS survey of 2,980 households in Tanzania conducted in April and May 2012. The first annual FITS Uganda survey report, published October 2012, is available on AudienceScapes.
tanzania and mobilE monEy Based on the current rate of access to mobile phones, the Tanzanian market shows potential for further m-money adoption. Sixty-three percent of surveyed households have access to a mobile phone. Fifty-six percent of households own at least one active SIM card which is required for opening an m-money account. Even among rural, unbanked and poor households (those living on less than $2 a day), about one-half of households have access to a mobile phone and own a SIM card.
Based on users’ perspectives, the leading challenge to m-money uptake is the inconsistent service quality offered by m-money agents. The large majority of registered users reported they had encountered problems with agents. In particular, they cited agents’ absenteeism and insufficient e-float or cash to help with a transaction. Another impediment to m-money uptake suggested by the survey findings is an insufficient understanding of m-money applications by potential and current users.
Thirty-five percent of households in Tanzania have at least one m-money user; 33 percent of households have at least one registered m-money user.
While m-money services have been available since 2008, most registered users said they didn’t sign up for an m-money account until 2010 or 2011. The number of early adopters of m-money services (those who started using m-money before 2010) is small regardless of the specific provider: 16 percent of current registered users of Airtel Money and 9 percent of registered users of Vodacom M-Pesa. Tigo Pesa was not in operation until late 2010.
Key findings
Vodacom M-Pesa is the leading provider of m-money services (representing 53 percent of the m-money market) and has broad national coverage. Tigo Pesa (18 percent of the m-money market) and Airtel Money (13 percent of the m-money market) are the second and third ranked providers.
4 Mobile Money in Tanzania: Use, Barriers and Opportunities
Subsequent FITS survey reports will monitor market growth and measure whether challenges to new or greater adoption have been overcome, particularly among the unbanked and those living at the bottom of the pyramid.
FITS data, reports and related analyses are disseminated to stakeholders in the financial access community, both in the countries studied and globally, to help inform policies and practices in the field of financial inclusion. InterMedia also is making the data and analyses available on AudienceScapes, www.audiencescapes.org/FITS, InterMedia’s online research knowledge base.
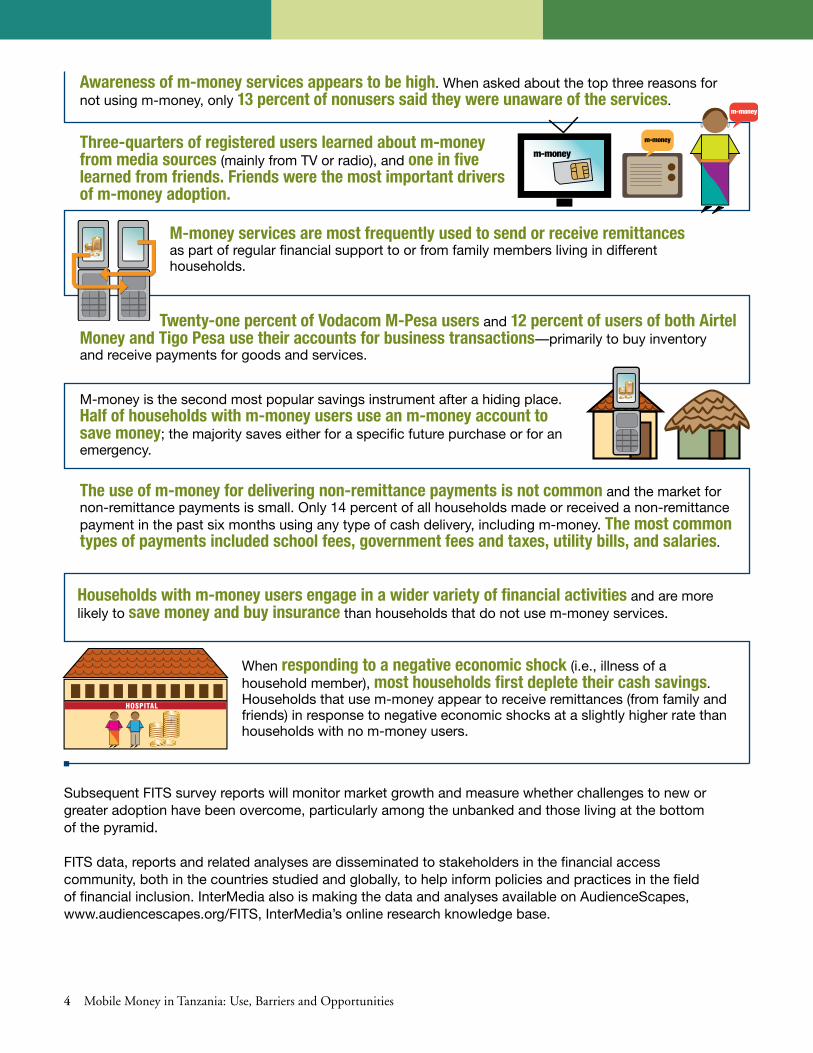
Three-quarters of registered users learned about m-money from media sources (mainly from TV or radio), and one in five learned from friends. Friends were the most important drivers of m-money adoption.
Awareness of m-money services appears to be high. When asked about the top three reasons for not using m-money, only 13 percent of nonusers said they were unaware of the services.
M-money services are most frequently used to send or receive remittances as part of regular financial support to or from family members living in different households.
Twenty-one percent of Vodacom M-Pesa users and 12 percent of users of both Airtel
m-moneym-money
m-money
When responding to a negative economic shock (i.e., illness of a household member), most households first deplete their cash savings. Households that use m-money appear to receive remittances (from family and friends) in response to negative economic shocks at a slightly higher rate than households with no m-money users.
M-money is the second most popular savings instrument after a hiding place. Half of households with m-money users use an m-money account to save money; the majority saves either for a specific future purchase or for an emergency.
The use of m-money for delivering non-remittance payments is not common and the market for non-remittance payments is small. Only 14 percent of all households made or received a non-remittance payment in the past six months using any type of cash delivery, including m-money. The most common types of payments included school fees, government fees and taxes, utility bills, and salaries.
Households with m-money users engage in a wider variety of financial activities and are more likely to save money and buy insurance than households that do not use m-money services.
Money and Tigo Pesa use their accounts for business transactions—primarily to buy inventory and receive payments for goods and services.
InterMedia 5
Banked populations—Households that reported saving money in at least one bank account (including microfi-nance institutions) in the six months prior to the survey .
Burial societies or “akiyo/amorican/engozi”—A “society” of friends who voluntarily contribute funds used as life insurance . Funds are paid out to family members upon the death of a member of the society for funeral and other expenses .
“Cashbox” or “mattress method” of saving or stor-ing money—Savings in a hiding place at home or on a person .
Dala dala—Shared minibus taxi .
Economic shock—An unexpected event that has a major impact on a household’s finances, either posi-tive (e .g ., inheriting money) or negative (e .g ., spending money on hospital care for a sick household member) .
e-float—When accepting deposits of cash from cus-tomers, an m-money provider issues a commodity known as “e-float,” measured in the same units as Tan-zanian money and held in a registered account under a user’s name . When a person sends/receives money through an agent, the agent has to have e-float (money on the agent’s account) available to transfer to the recip-ient’s account . Otherwise the agent cannot help with the transaction .
Gifting circle or “nigiina”—A group of individuals, who meet on a monthly basis, and gift each other pos-sessions (e .g ., domestic appliances or money) or services (e .g ., house construction or land cultivation) to help each other save money or boost each other’s incomes . Gifts, money and services are offered on a revolving basis .
Kutenga Pa Ngongole—A credit at a local store with the expectation the customer will pay the bill at the end of the month, or whenever the household has money .
Merry-go-round—A group of individuals who pool their savings . On a regular basis (monthly, weekly or daily), each individual puts the same amount of money “into the pot” and, on a revolving basis, one person takes the total amount of money .
glossary
M-money—Mobile money .
M-money deposit—One of the transactions m-money users can perform using their own or an agent’s account to “cash-in” (i .e ., put money in the account) . Some-times, when using an agent’s account, m-money cus-tomers are required to prepay an informal “deposit fee” in addition to the money they are sending via m-money and the fees they pay for using the service .
Non-remittance payments—Formal payments sent to the government, educational institutions, formal finan-cial institutions (e .g ., banks) or private businesses . Non-remittances include payments of taxes, fines or fees, utility bills, goods, debt or insurance payments . Pay-ments might include formal credit disbursements and repayments .
Remittances—Money or its equivalent (food or goods) sent from one household to another . Remittances include any informal credit and debt repayments between family members or friends who live elsewhere, any repayment of debts, or payments for goods and services .
Savings account at cooperatives—Savings accounts offered by cooperatives to their members only; the accounts do not have an expiration date .
Savings account at a Village Savings and Loan Asso-ciation (VSLA)—Members deposit small amounts of money for one year . At the end of the year, they share the money they paid into the account . A VSLA will also loan money to non-members known by the members .
Urban and rural households—Urban and rural house-holds are defined according to their residence in urban or rural enumeration areas as prescribed by the National Bureau of Statistics in Tanzania .
SIM card—An electronic micro-card that contains a subscriber identity module, an integrated circuit that securely stores the International Mobile Subscriber Identity (IMSI), and the key used to verify subscribers’ identities on mobile phones and computers .
6 Mobile Money in Tanzania: Use, Barriers and Opportunities
The FITS household studies in Pakistan, Tanzania and Uganda are three-year panel studies consisting of annual waves of face-to-face household surveys (N=2,980 households in Tanzania) and three telephone mini-surveys per year with the same households, conducted between each annual wave .
The core of the wave questionnaire covering house-holds’ financial behaviors is roughly the same in all three countries to allow for cross-market comparisons .
MeThodology
Some sections and questions, however, are tailored to the local context to allow for a more accurate assess-ment of the development of m-money in different financial, regulatory and socio-cultural environments .
This report presents the findings of the first wave sur-vey in Tanzania conducted April-May 2012 . Separate reports address the first wave surveys in Pakistan and Uganda .
a note on data analysis and reporting
The FITS surveys are designed to collect trend data primarily about m-money use and overall financial behavior at the household level—that is, the data represents collective usage patterns for entire households . The households for this panel were selected from a random sample frame and thus are representative of usage and behavior patterns of Tanzanian households in general .
In addition to the household-level data, the surveys gather data on behaviors and experiences with specific m-money services, based on interviews with individual registered users of those services . For these interviews, registered users of individual m-money products are randomly selected among all the users of these products in each household; if a household had only one user of a specific m-money service, this individual was interviewed .
The section of this report on the financial behaviors of individual registered users of specific m-money services reports the findings only for Vodacom M-Pesa, Airtel Money and Tigo Pesa m-money services . The number of users for Ezy Pesa m-money services, the only other provider operating in Tanzania, was insufficient for valid analysis (n=2) . The results of these individual interviews are not representative of individual users throughout Tanzania because the interview-ees were not chosen from a random sample frame .
The data reported for transaction costs, distances to and from m-money agents, and total amounts sent or received are based entirely on the head of household’s reporting about the activi-ties of every member of the household . These numbers, therefore, should be treated as estimates rather than exact numbers .
InterMedia 7
Tanzania CoUnTry profile
GEnEral EnvironmEnt
Tanzania is located south of the equator in East Africa . It borders on the Indian Ocean to the east, and has land borders with eight countries: Kenya, Uganda, Rwanda, Burundi, Democratic Republic of Congo (across Lake Tanganyika), Zambia, Malawi and Mozambique .
The country emerged in its current form in 1964 as a union between the mainland Tanganyika and the island of Zanzibar .
Tanzania’s population is estimated to be nearly 47 mil-lion, and 74 percent of Tanzanians reside in rural areas .1 According to the World Bank, in 2011, 35 .7 percent of the population lived below the poverty line (less than $1 .25 a day) .2
Tanzania’s economy relies mostly on agriculture; tour-ism and mineral production have also emerged recently as important industrial sectors .
Despite recent economic growth, Tanzania remains one of the poorest African countries . The two main chal-lenges the country is struggling to overcome are per-vasive corruption and a large but sparsely populated territory .
tElEcommunicationS EnvironmEnt
Tanzania has two fixed-line operators (TTCL and Zan-tel) and eight mobile networks . The four leading mobile network operators (MNOs) are Vodacom, Tigo, Bharti Airtel (formerly Zain) and Zantel .
Tanzania’s telecommunications market is competitive . In 2011 and 2012, price wars triggered a consolidation among smaller MNOs .3 The most recent changes in the market include the introduction of voice over internet protocol (VoIP) telephony, the third generation (3G) of mobile services and wireless broadband networks .4
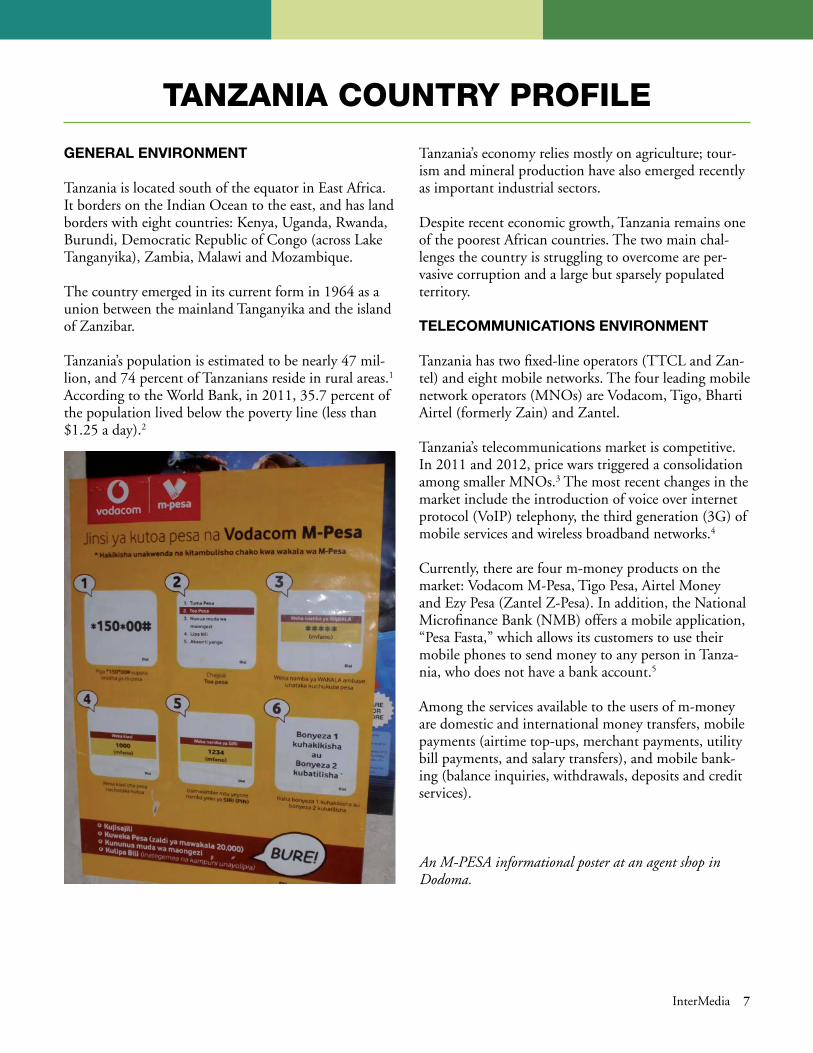
Currently, there are four m-money products on the market: Vodacom M-Pesa, Tigo Pesa, Airtel Money and Ezy Pesa (Zantel Z-Pesa) . In addition, the National Microfinance Bank (NMB) offers a mobile application, “Pesa Fasta,” which allows its customers to use their mobile phones to send money to any person in Tanza-nia, who does not have a bank account .5
Among the services available to the users of m-money are domestic and international money transfers, mobile payments (airtime top-ups, merchant payments, utility bill payments, and salary transfers), and mobile bank-ing (balance inquiries, withdrawals, deposits and credit services) .
An M-PESA informational poster at an agent shop in Dodoma.
8 Mobile Money in Tanzania: Use, Barriers and Opportunities
Airtel was the first mobile network operator to intro-duce a phone-to-phone airtime credit transfer service, “Me2U,” in 2005 . Airtel partners with Citigroup and Standard Chartered Bank to provide m-money services, including bill payments, payments for goods and ser-vices, phone-to-phone and phone-to-bank money trans-fers, and mobile wallets .6
Vodacom Tanzania launched the second East African implementation of the Vodafone m-money transfer platform, M-Pesa, in April 2008 . In 2010, Vodacom re-launched M-Pesa with a simpler pricing model, bet-ter management of the distribution network, and a marketing campaign that targeted the rural, poor and unbanked populations .7
Tigo, the oldest wireless telecommunications company in Tanzania, was the last to launch an m-money service . Tigo Pesa, launched in September 2010, focuses pri-marily on money transfers .8
Zantel Tanzania introduced a mobile payment service, in 2008, called Z-Pesa . In 2012, Zantel launched a re-branded and upgraded version of its Z-Pesa, the Ezy Pesa . The upgrades allow employers to pay wages via a mobile phone, and customers to access their Coopera-tive Rural Development Bank (CRDB) accounts .9
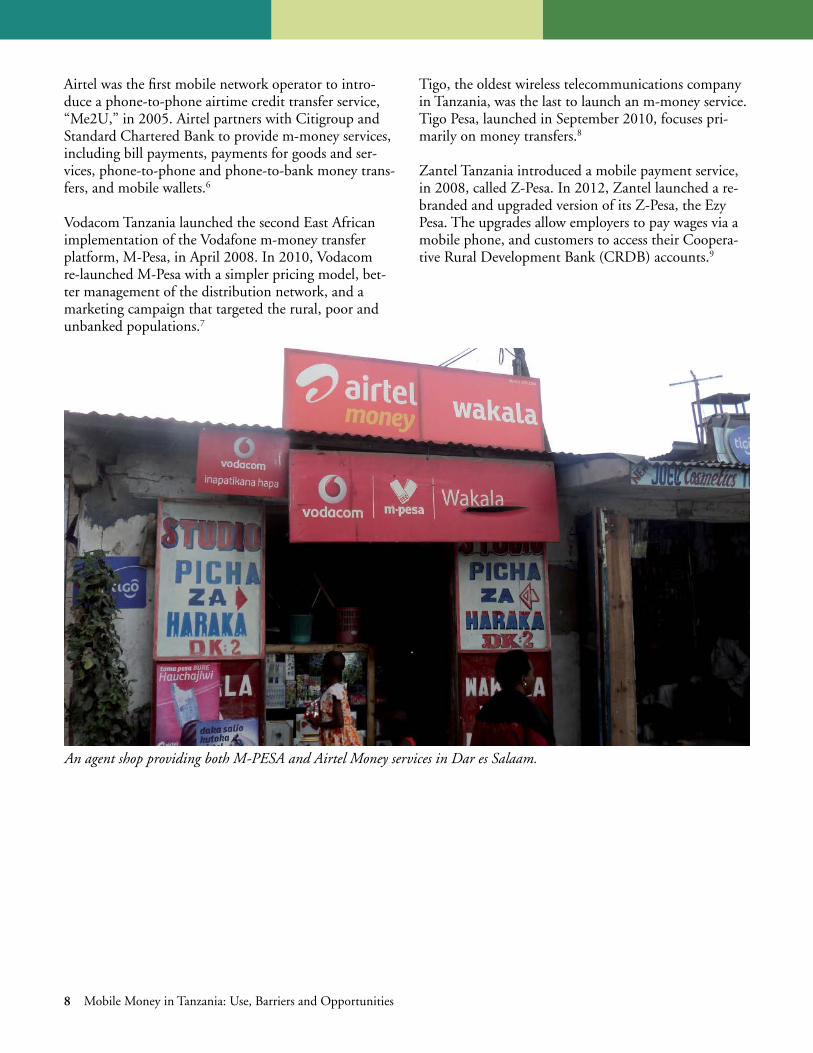
An agent shop providing both M-PESA and Airtel Money services in Dar es Salaam.
InterMedia 9
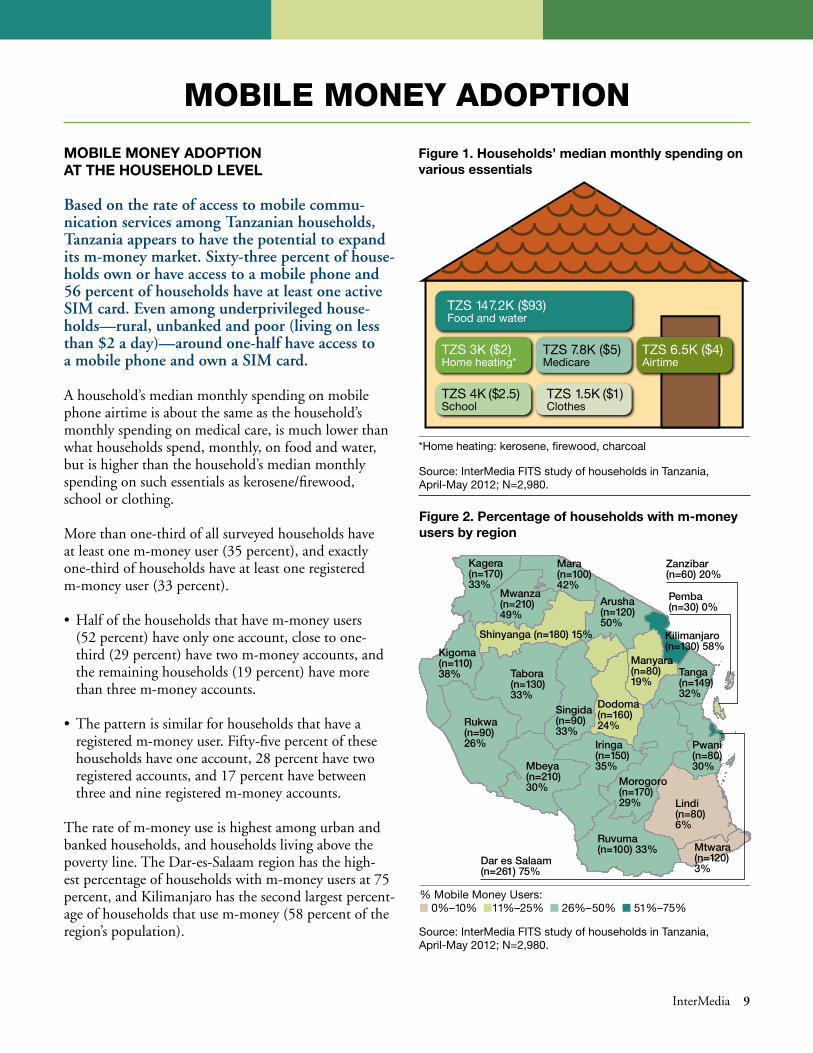
figure 1. households’ median monthly spending on various essentials
mobilE monEy adoPtion at thE houSEhold lEvEl
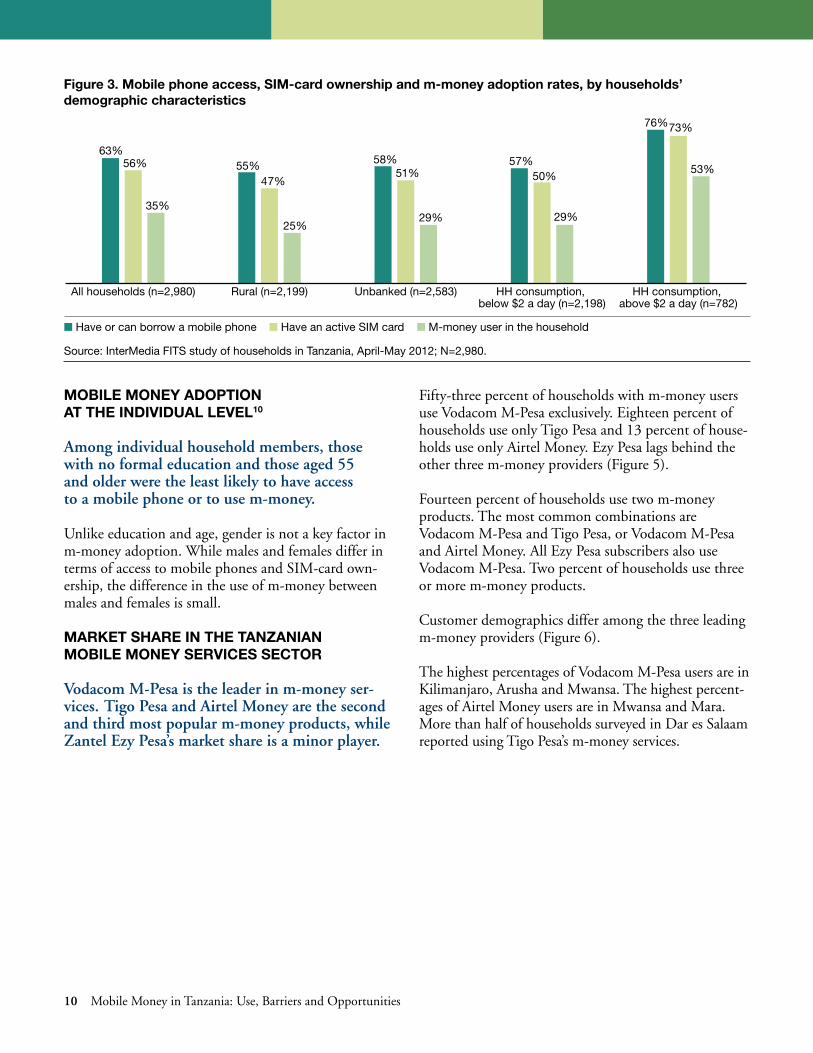
Based on the rate of access to mobile commu-nication services among Tanzanian households, Tanzania appears to have the potential to expand its m-money market. Sixty-three percent of house-holds own or have access to a mobile phone and 56 percent of households have at least one active SIM card. Even among underprivileged house-holds—rural, unbanked and poor (living on less than $2 a day)—around one-half have access to a mobile phone and own a SIM card.
A household’s median monthly spending on mobile phone airtime is about the same as the household’s monthly spending on medical care, is much lower than what households spend, monthly, on food and water, but is higher than the household’s median monthly spending on such essentials as kerosene/firewood, school or clothing .
More than one-third of all surveyed households have at least one m-money user (35 percent), and exactly one-third of households have at least one registered m-money user (33 percent) .
• Halfofthehouseholdsthathavem-moneyusers (52 percent) have only one account, close to one-third (29 percent) have two m-money accounts, and the remaining households (19 percent) have more than three m-money accounts .
• Thepatternissimilarforhouseholdsthathavearegistered m-money user . Fifty-five percent of these households have one account, 28 percent have two registered accounts, and 17 percent have between three and nine registered m-money accounts .
The rate of m-money use is highest among urban and banked households, and households living above the poverty line . The Dar-es-Salaam region has the high-est percentage of households with m-money users at 75 percent, and Kilimanjaro has the second largest percent-age of households that use m-money (58 percent of the region’s population) .
Mobile Money adopTion
Source: InterMedia FITS study of households in Tanzania, April-May 2012; N=2,980.
TZS 147.2K ($93)Food and water
TZS 4K ($2.5)School
TZS 1.5K ($1)Clothes
TZS 7.8K ($5)Medicare
TZS 6.5K ($4)Airtime
TZS 3K ($2)Home heating*
*Home heating: kerosene, firewood, charcoal
figure 2. Percentage of households with m-money users by region
Source: InterMedia FITS study of households in Tanzania, April-May 2012; N=2,980.
Mwanza(n=210) 49%
Arusha (n=120) 50%
Kilimanjaro (n=130) 58%
Manyara (n=80) 19%
Shinyanga (n=180) 15%
Iringa(n=150) 35%
Lindi (n=80) 6%
Mbeya (n=210) 30%
Ruvuma (n=100) 33%
Kigoma (n=110) 38%
Mtwara (n=120) 3%
Rukwa (n=90) 26%
Morogoro (n=170) 29%
Tabora (n=130) 33%
Pwani(n=80) 30%
Tanga (n=149) 32%
Kagera(n=170) 33%
Mara(n=100) 42%
Dar es Salaam (n=261) 75%
Dodoma(n=160) 24%
Zanzibar (n=60) 20%
Pemba (n=30) 0%
Singida (n=90) 33%
% Mobile Money Users: ■ 0%–10% ■1 1%–25% ■ 26%–50% ■ 51%–75%
10 Mobile Money in Tanzania: Use, Barriers and Opportunities
mobilE monEy adoPtion at thE individual lEvEl10
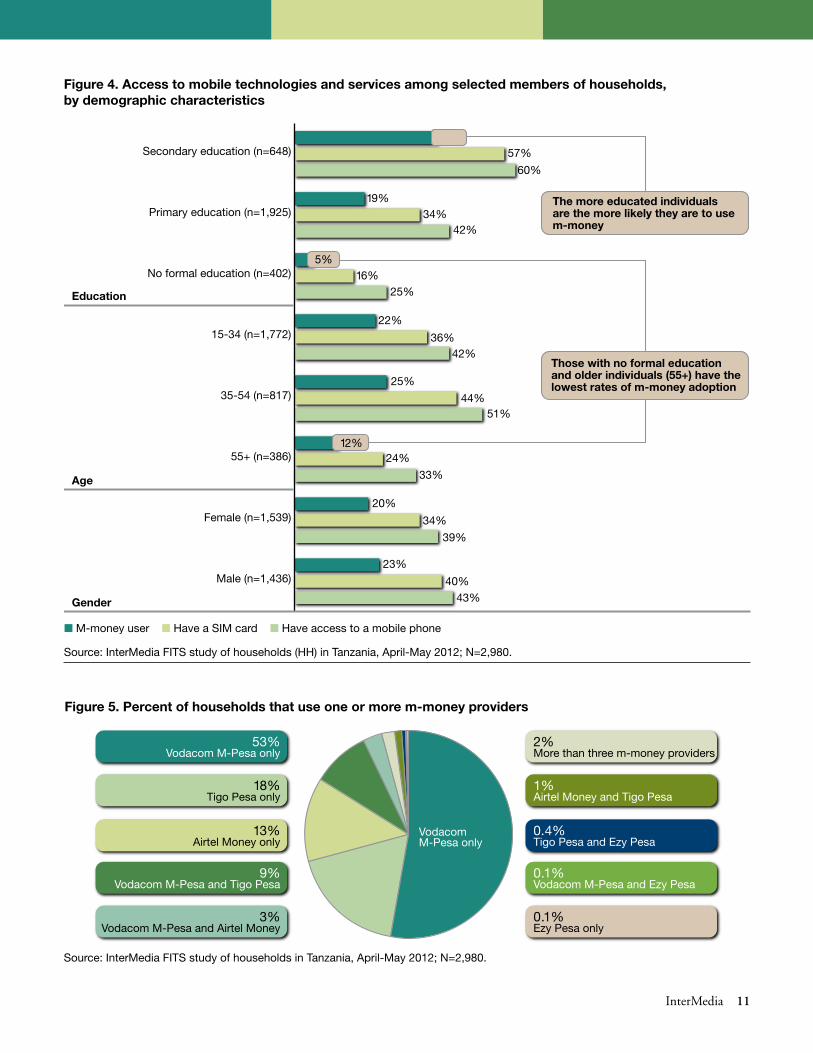
Among individual household members, those with no formal education and those aged 55 and older were the least likely to have access to a mobile phone or to use m-money.
Unlike education and age, gender is not a key factor in m-money adoption . While males and females differ in terms of access to mobile phones and SIM-card own-ership, the difference in the use of m-money between males and females is small .
markEt SharE in thE tanzanian mobilE monEy SErvicES SEctor
Vodacom M-Pesa is the leader in m-money ser-vices. Tigo Pesa and Airtel Money are the second and third most popular m-money products, while Zantel Ezy Pesa’s market share is a minor player.
Fifty-three percent of households with m-money users use Vodacom M-Pesa exclusively . Eighteen percent of households use only Tigo Pesa and 13 percent of house-holds use only Airtel Money . Ezy Pesa lags behind the other three m-money providers (Figure 5) .
Fourteen percent of households use two m-money products . The most common combinations are Vodacom M-Pesa and Tigo Pesa, or Vodacom M-Pesa and Airtel Money . All Ezy Pesa subscribers also use Vodacom M-Pesa . Two percent of households use three or more m-money products .
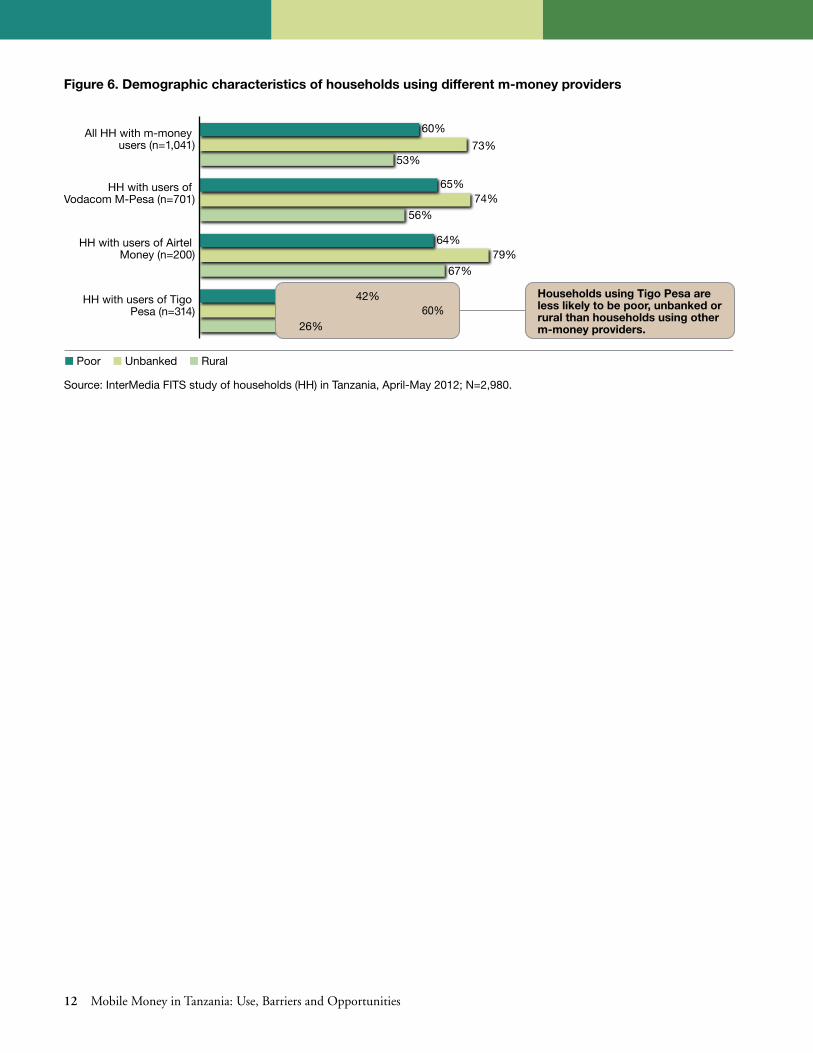
Customer demographics differ among the three leading m-money providers (Figure 6) .
The highest percentages of Vodacom M-Pesa users are in Kilimanjaro, Arusha and Mwansa . The highest percent-ages of Airtel Money users are in Mwansa and Mara . More than half of households surveyed in Dar es Salaam reported using Tigo Pesa’s m-money services .
figure 3. mobile phone access, Sim-card ownership and m-money adoption rates, by households’ demographic characteristics
Source: InterMedia FITS study of households in Tanzania, April-May 2012; N=2,980.
HH consumption, above $2 a day (n=782)
HH consumption, below $2 a day (n=2,198)
Unbanked (n=2,583)Rural (n=2,199)All households (n=2,980)
56%63%
35%
58%
47%
57%
25%
55%51%
■ Have or can borrow a mobile phone ■ Have an active SIM card ■ M-money user in the household
76%
29%
73%
53%
29%
50%
InterMedia 11
figure 4. access to mobile technologies and services among selected members of households, by demographic characteristics
Source: InterMedia FITS study of households (HH) in Tanzania, April-May 2012; N=2,980.
figure 5. Percent of households that use one or more m-money providers
Source: InterMedia FITS study of households in Tanzania, April-May 2012; N=2,980.
53%Vodacom M-Pesa only
18%Tigo Pesa only
13%Airtel Money only
9%Vodacom M-Pesa and Tigo Pesa
3%Vodacom M-Pesa and Airtel Money
2%More than three m-money providers
1%Airtel Money and Tigo Pesa
0.4%Tigo Pesa and Ezy Pesa
0.1%Vodacom M-Pesa and Ezy Pesa
0.1%Ezy Pesa only
Vodacom M-Pesa only
Male (n=1,436)
Female (n=1,539)
55+ (n=386)
35-54 (n=817)
15-34 (n=1,772)
No formal education (n=402)
Primary education (n=1,925)
Secondary education (n=648)39%
60%
19%
57%
25%
44%51%
42%34%
5%16%
25%
22%
36%42%
33%
24%
20%
12%
34%
39%
23%
40%43%
The more educated individuals are the more likely they are to use m-money
Those with no formal education and older individuals (55+) have the lowest rates of m-money adoption
Education
Age
Gender
■ M-money user ■ Have a SIM card ■ Have access to a mobile phone
12 Mobile Money in Tanzania: Use, Barriers and Opportunities
HH with users of Tigo Pesa (n=314)
HH with users of Airtel Money (n=200)
HH with users of Vodacom M-Pesa (n=701)
All HH with m-money users (n=1,041) 73%
60%
53%
64%
74%
79%
56%
65%
67%
42%60%
26%
Households using Tigo Pesa are less likely to be poor, unbanked or rural than households using other m-money providers.
■ Poor ■ Unbanked ■ Rural
figure 6. demographic characteristics of households using different m-money providers
Source: InterMedia FITS study of households (HH) in Tanzania, April-May 2012; N=2,980.
InterMedia 13
thE dynamicS of adoPtion and uSE
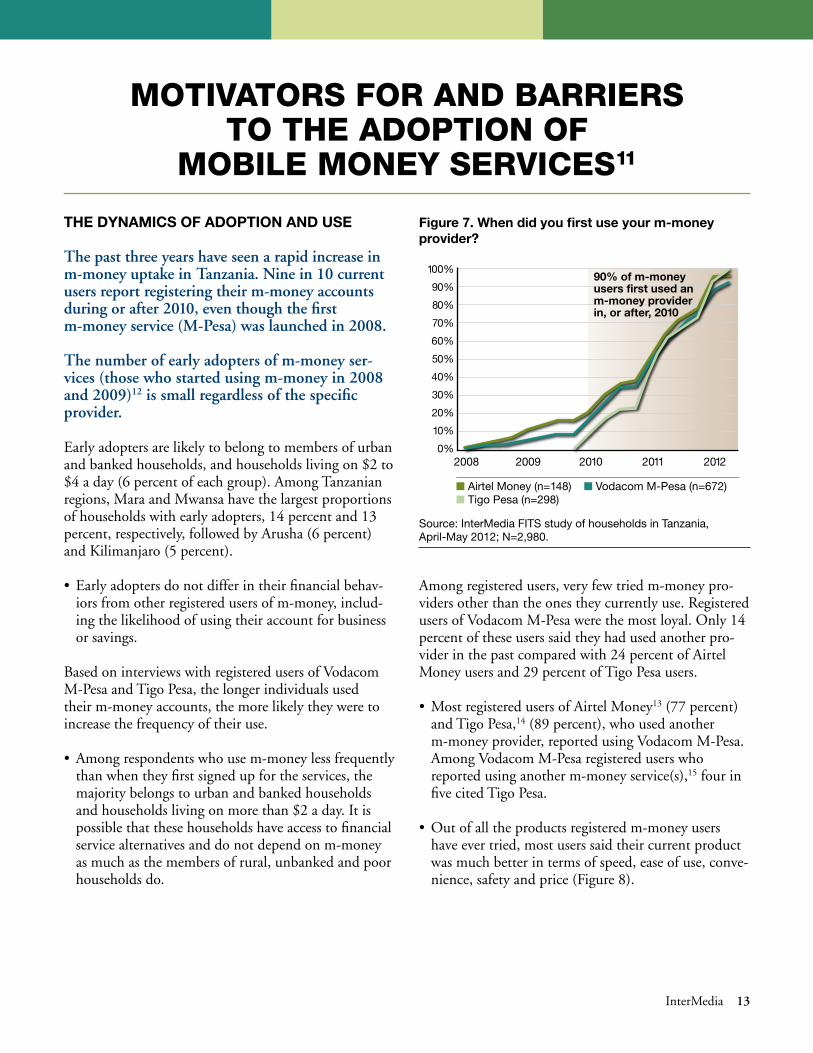
The past three years have seen a rapid increase in m-money uptake in Tanzania. Nine in 10 current users report registering their m-money accounts during or after 2010, even though the first m-money service (M-Pesa) was launched in 2008.
The number of early adopters of m-money ser-vices (those who started using m-money in 2008 and 2009)12 is small regardless of the specific provider.
Early adopters are likely to belong to members of urban and banked households, and households living on $2 to $4 a day (6 percent of each group) . Among Tanzanian regions, Mara and Mwansa have the largest proportions of households with early adopters, 14 percent and 13 percent, respectively, followed by Arusha (6 percent) and Kilimanjaro (5 percent) .
• Earlyadoptersdonotdifferintheirfinancialbehav-iors from other registered users of m-money, includ-ing the likelihood of using their account for business or savings .
Based on interviews with registered users of Vodacom M-Pesa and Tigo Pesa, the longer individuals used their m-money accounts, the more likely they were to increase the frequency of their use .
• Amongrespondentswhousem-moneylessfrequentlythan when they first signed up for the services, the majority belongs to urban and banked households and households living on more than $2 a day . It is possible that these households have access to financial service alternatives and do not depend on m-money as much as the members of rural, unbanked and poor households do .
MoTiVaTors for and barriers To The adopTion of
Mobile Money serViCes11
Among registered users, very few tried m-money pro-viders other than the ones they currently use . Registered users of Vodacom M-Pesa were the most loyal . Only 14 percent of these users said they had used another pro-vider in the past compared with 24 percent of Airtel Money users and 29 percent of Tigo Pesa users .
• MostregisteredusersofAirtelMoney13 (77 percent) and Tigo Pesa,14 (89 percent), who used another m-money provider, reported using Vodacom M-Pesa . Among Vodacom M-Pesa registered users who reported using another m-money service(s),15 four in five cited Tigo Pesa .
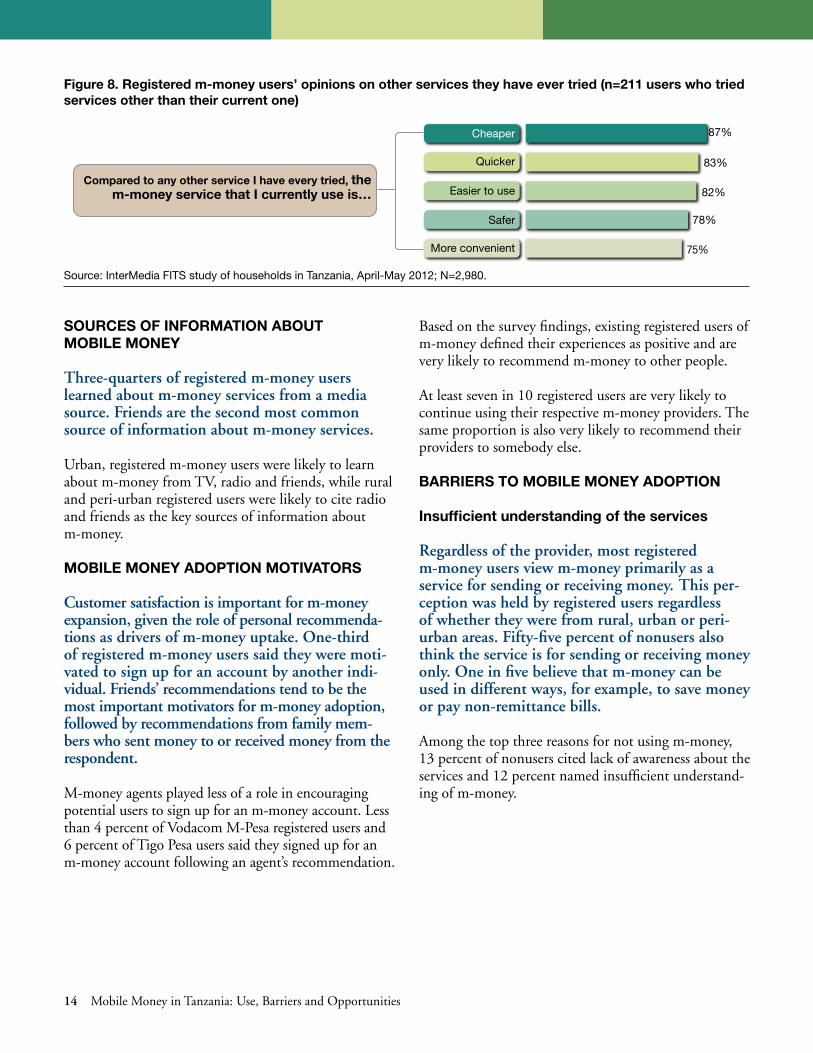
• Outofalltheproductsregisteredm-moneyusershave ever tried, most users said their current product was much better in terms of speed, ease of use, conve-nience, safety and price (Figure 8) .
100%
90%
80%
70%
60%
50%
40%
30%
20%
10%
0%2008 2009 2010 2011 2012
■ Airtel Money (n=148) ■ Vodacom M-Pesa (n=672) ■ Tigo Pesa (n=298)
90% of m-money users first used an m-money provider in, or after, 2010
figure 7. When did you first use your m-money provider?
Source: InterMedia FITS study of households in Tanzania, April-May 2012; N=2,980.
14 Mobile Money in Tanzania: Use, Barriers and Opportunities
SourcES of information about mobilE monEy
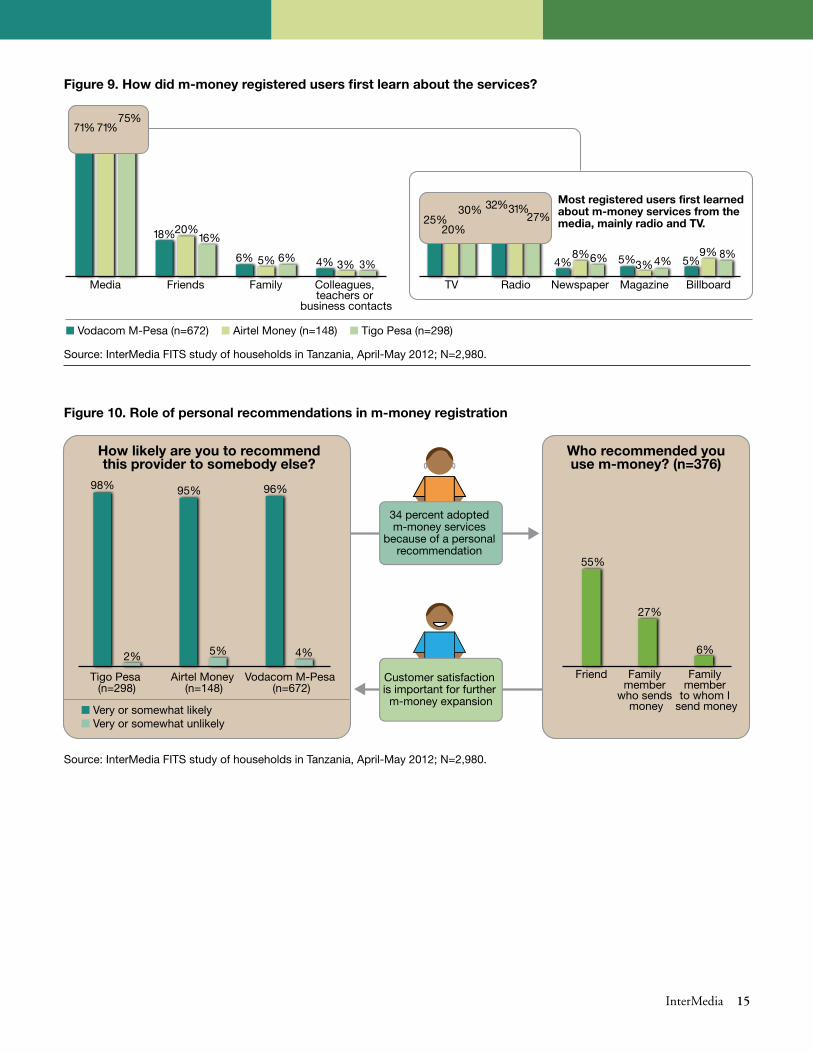
Three-quarters of registered m-money users learned about m-money services from a media source. Friends are the second most common source of information about m-money services.
Urban, registered m-money users were likely to learn about m-money from TV, radio and friends, while rural and peri-urban registered users were likely to cite radio and friends as the key sources of information about m-money .
mobilE monEy adoPtion motivatorS
Customer satisfaction is important for m-money expansion, given the role of personal recommenda-tions as drivers of m-money uptake. One-third of registered m-money users said they were moti-vated to sign up for an account by another indi-vidual. Friends’ recommendations tend to be the most important motivators for m-money adoption, followed by recommendations from family mem-bers who sent money to or received money from the respondent.
M-money agents played less of a role in encouraging potential users to sign up for an m-money account . Less than 4 percent of Vodacom M-Pesa registered users and 6 percent of Tigo Pesa users said they signed up for an m-money account following an agent’s recommendation .
Based on the survey findings, existing registered users of m-money defined their experiences as positive and are very likely to recommend m-money to other people .
At least seven in 10 registered users are very likely to continue using their respective m-money providers . The same proportion is also very likely to recommend their providers to somebody else .
barriErS to mobilE monEy adoPtion
insufficient understanding of the services
Regardless of the provider, most registered m-money users view m-money primarily as a service for sending or receiving money. This per-ception was held by registered users regardless of whether they were from rural, urban or peri-urban areas. Fifty-five percent of nonusers also think the service is for sending or receiving money only. One in five believe that m-money can be used in different ways, for example, to save money or pay non-remittance bills.
Among the top three reasons for not using m-money, 13 percent of nonusers cited lack of awareness about the services and 12 percent named insufficient understand-ing of m-money .
figure 8. registered m-money users’ opinions on other services they have ever tried (n=211 users who tried services other than their current one)
Source: InterMedia FITS study of households in Tanzania, April-May 2012; N=2,980.
More convenient
Safer
Easier to use
Quicker
Cheaper 87%
83%
82%
78%
75%
Compared to any other service I have every tried, the m-money service that I currently use is…
InterMedia 15
figure 9. how did m-money registered users first learn about the services?
Colleagues, teachers or
business contacts
FamilyFriendsMedia BillboardMagazineNewspaperRadioTV
71%71%75%
6%
20%
6%
16%18%
5% 4% 3%3%
Most registered users first learned about m-money services from the media, mainly radio and TV.
■ Vodacom M-Pesa (n=672) ■ Airtel Money (n=148) ■ Tigo Pesa (n=298)
5%
20%
4%
30%25%
3% 5%8%9%
4% 6%8%
31%27%
32%
Source: InterMedia FITS study of households in Tanzania, April-May 2012; N=2,980.
figure 10. role of personal recommendations in m-money registration
Vodacom M-Pesa (n=672)
Airtel Money (n=148)
Tigo Pesa (n=298)
Family member
to whom I send money
Family member
who sends money
Friend
98%
5%
95%
2%
96%
4%
■ Very or somewhat likely ■ Very or somewhat unlikely
55%
6%
27%
How likely are you to recommend this provider to somebody else?
Who recommended you use m-money? (n=376)
34 percent adopted m-money services
because of a personal recommendation
Customer satisfaction is important for further
m-money expansion
Source: InterMedia FITS study of households in Tanzania, April-May 2012; N=2,980.
16 Mobile Money in Tanzania: Use, Barriers and Opportunities
Problems with mobile money agents
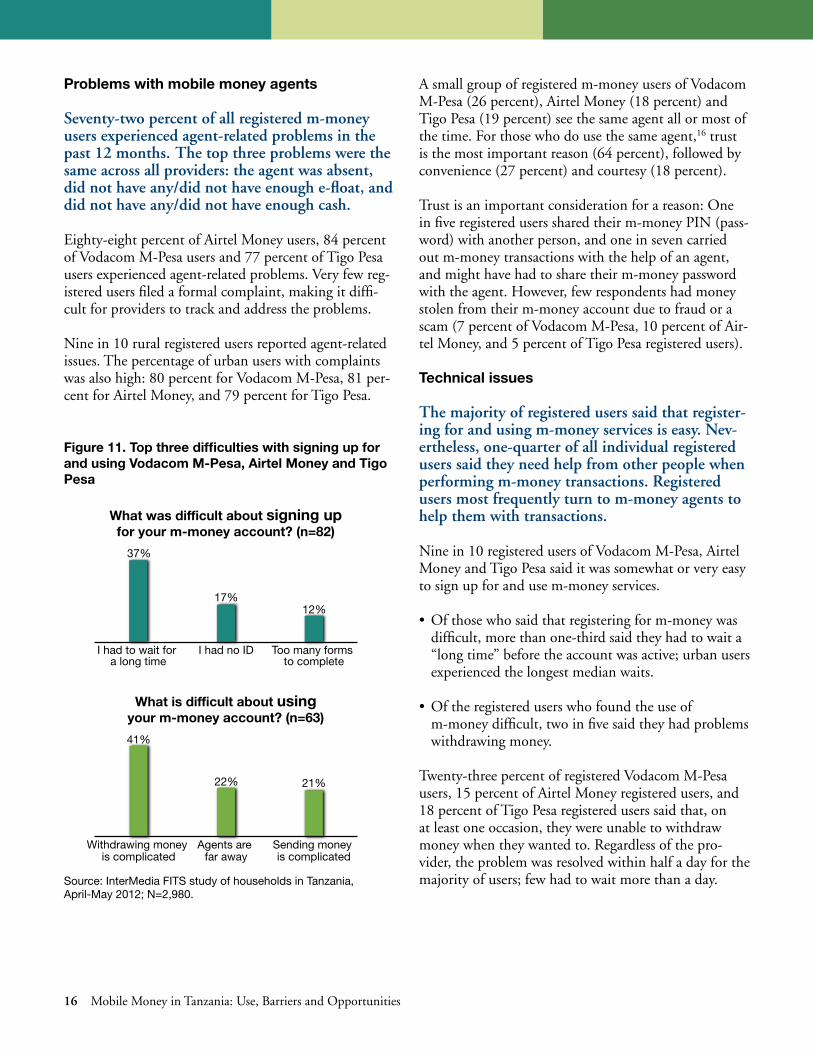
Seventy-two percent of all registered m-money users experienced agent-related problems in the past 12 months. The top three problems were the same across all providers: the agent was absent, did not have any/did not have enough e-float, and did not have any/did not have enough cash.
Eighty-eight percent of Airtel Money users, 84 percent of Vodacom M-Pesa users and 77 percent of Tigo Pesa users experienced agent-related problems . Very few reg-istered users filed a formal complaint, making it diffi-cult for providers to track and address the problems .
Nine in 10 rural registered users reported agent-related issues . The percentage of urban users with complaints was also high: 80 percent for Vodacom M-Pesa, 81 per-cent for Airtel Money, and 79 percent for Tigo Pesa .
A small group of registered m-money users of Vodacom M-Pesa (26 percent), Airtel Money (18 percent) and Tigo Pesa (19 percent) see the same agent all or most of the time . For those who do use the same agent,16 trust is the most important reason (64 percent), followed by convenience (27 percent) and courtesy (18 percent) .
Trust is an important consideration for a reason: One in five registered users shared their m-money PIN (pass-word) with another person, and one in seven carried out m-money transactions with the help of an agent, and might have had to share their m-money password with the agent . However, few respondents had money stolen from their m-money account due to fraud or a scam (7 percent of Vodacom M-Pesa, 10 percent of Air-tel Money, and 5 percent of Tigo Pesa registered users) .
technical issues
The majority of registered users said that register-ing for and using m-money services is easy. Nev-ertheless, one-quarter of all individual registered users said they need help from other people when performing m-money transactions. Registered users most frequently turn to m-money agents to help them with transactions.
Nine in 10 registered users of Vodacom M-Pesa, Airtel Money and Tigo Pesa said it was somewhat or very easy to sign up for and use m-money services .
• Ofthosewhosaidthatregisteringform-moneywasdifficult, more than one-third said they had to wait a “long time” before the account was active; urban users experienced the longest median waits .
• Oftheregistereduserswhofoundtheuseofm-money difficult, two in five said they had problems withdrawing money .
Twenty-three percent of registered Vodacom M-Pesa users, 15 percent of Airtel Money registered users, and 18 percent of Tigo Pesa registered users said that, on at least one occasion, they were unable to withdraw money when they wanted to . Regardless of the pro-vider, the problem was resolved within half a day for the majority of users; few had to wait more than a day .
figure 11. top three difficulties with signing up for and using vodacom m-Pesa, airtel money and tigo Pesa
Source: InterMedia FITS study of households in Tanzania, April-May 2012; N=2,980.
Sending money is complicated
Agents are far away
Withdrawing money is complicated
Too many forms to complete
I had no IDI had to wait for a long time
41%
21%22%
What is difficult about using your m-money account? (n=63)
37%
12%17%
What was difficult about signing up for your m-money account? (n=82)

InterMedia 17
• Amongthetopfivereasonsfornotbeingabletowithdraw money,17 three were due to problems with agents: the agent’s system was down (28 percent of respondents), the agent was not available (26 percent) or the agent did not have enough cash (22 percent) .
• One-halfoftherespondents(49percent)wereunableto withdraw money because the provider’s network was down .
mobilE monEy uSE for PErSonal SavinGS
More than half (53 percent) of registered m-money users said they have left money on their accounts for more than a few days.
Of those who reported storing money on their accounts (with any provider) for more than a few days,18 an overwhelming majority (78 percent) did so by putting money on the account with the intention of personally withdrawing it later as opposed to leaving it there after a transfer, or putting money on an account to store up for a transfer .
Vodacom M-Pesa and Tigo Pesa registered users were slightly more likely to keep money on their accounts than Airtel Money registered users .
Vodacom M-Pesa and Airtel Money registered users stored money mainly to save for a specific future pur-chase; Tigo Pesa registered users were setting money
aside mostly for emergencies . This may reflect the demographics of each provider’s customer base: many of the Airtel Money and Vodacom M-Pesa registered users come from poor rural households and have to save to be able to afford a number of commodities .
Most of the registered users of Tigo Pesa are from urban households living above the poverty line . While these households have more cash flow, they also might be vul-nerable to economic shocks because they tend to rent housing, and a cash shortfall might push them out of their homes .
Regardless of the specific provider, the two most common reasons cited by registered users for not leaving money on an m-money account19 were always needing money immediately (33 percent), or not want-ing to use m-money for savings because it is not a bank (16 percent) .
mobilE monEy uSE for buSinESS
About one-fifth (21 percent) of registered users of Vodacom M-Pesa use mobile money for business purposes versus 12 percent each of Airtel Money and Tigo Pesa registered users.
Of those registered m-money users who use m-money for business purposes, the majority purchased inventory . There was no difference among rural, urban and peri-urban registered users in the way they used m-money for business .
figure 12. reasons for storing money on registered m-money accounts
Source: InterMedia FITS study of households in Tanzania, April-May 2012; N=2,980.
Vodacom M-Pesa (n=270)
Airtel m-money (n=42)
Tigo Pesa (n=135) 66%
15%
39%
14%
57%
64%
50%
61%
12%
Most Tigo Pesa registered users save for emergencies
■ Specific future purchase ■ Emergency ■ To have extra income later (no specific purpose)
Vodacom M-Pesa and Airtel Money users save for planned purchases

18 Mobile Money in Tanzania: Use, Barriers and Opportunities
Registered users of Vodacom M-Pesa, Airtel Money and Tigo Pesa, who use their m-money accounts for busi-ness purposes,20 learn about and adopt m-money ser-vices in the same way as all registered users in this study . Specifically, 74 percent of business users of m-money first learned about the services from the media (TV, radio, newspapers, magazines and billboards) and 17 percent from friends .
Thirty-seven percent of the group registered because of a personal recommendation . Friends (19 percent), fam-ily members who send them money (7 percent), and
family members from whom they receive money (3 per-cent) were the top three motivators of m-money regis-tration for those who use m-money for business .
lESSonS from rEGiStErEd mobilE monEy uSErS’ rEcEnt ExPEriEncES With mobilE monEy aGEntS
One-third of Vodacom M-Pesa, Airtel Money and Tigo Pesa registered users performed their most recent transactions with their regular agents. Fourteen percent said they did not have an agent they used regularly. Most chose an agent based on either seeing an advertisement or convenience (e.g., agent was nearby), and about one-quarter of registered users went to an agent they already knew.
Registered users’ most recent experiences with m-money services were generally positive . However, 51 percent of rural registered users and 31 percent, each, of urban and peri-urban registered users reported previous problems with their agents .
Among all registered m-money users, the most cited problems with agents were: the agent was absent (26 percent), did not have any or enough cash (24 percent), or did not have any or enough e-float (23 percent) .
figure 13. registered users who use their m-money accounts for business (n=191)
Source: InterMedia FITS study of households in Tanzania, April-May 2012; N=2,980.
I pay employees
I pay bills (not for
inventory)
I receive payments
(from customers)
Buy inventory and other things
I need for my business
74%
10%
23%
7%
M-money is more likely to be used for transactions with suppliers than with customers
figure 14. registered users’ most recent experiences performing m-money transactions with an agent (for all datapoints, numbers represent median answers)
Source: InterMedia FITS study of households in Tanzania, April-May 2012; N=2,980.
Takes 5 minutes and $0.3–$0.6
in transaction fees
It takes users 15 minutes and 1-2km and no
transportation fee to get to an agent’s office
Vodacom M-Pesa (n=672)
Airtel Money (n=148)
Tigo Pesa (n=298)
Problematic Transaction
Successful Transaction
72% of registered users had problems with
m-money agents in the past 12 months
InterMedia 19
hoUseholds’ finanCial roUTines and The role of Mobile Money
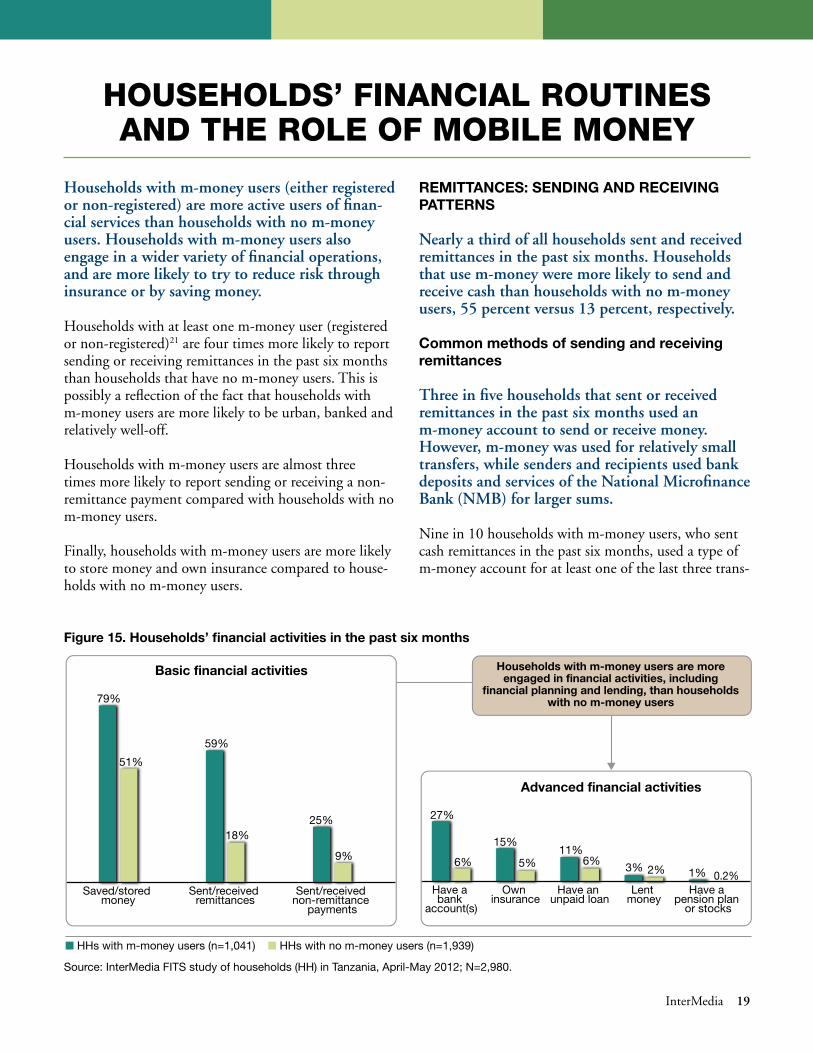
Households with m-money users (either registered or non-registered) are more active users of finan-cial services than households with no m-money users. Households with m-money users also engage in a wider variety of financial operations, and are more likely to try to reduce risk through insurance or by saving money.
Households with at least one m-money user (registered or non-registered)21 are four times more likely to report sending or receiving remittances in the past six months than households that have no m-money users . This is possibly a reflection of the fact that households with m-money users are more likely to be urban, banked and relatively well-off .
Households with m-money users are almost three times more likely to report sending or receiving a non-remittance payment compared with households with no m-money users .
Finally, households with m-money users are more likely to store money and own insurance compared to house-holds with no m-money users .
rEmittancES: SEndinG and rEcEivinG PattErnS
Nearly a third of all households sent and received remittances in the past six months. Households that use m-money were more likely to send and receive cash than households with no m-money users, 55 percent versus 13 percent, respectively.
common methods of sending and receiving remittances
Three in five households that sent or received remittances in the past six months used an m-money account to send or receive money. However, m-money was used for relatively small transfers, while senders and recipients used bank deposits and services of the National Microfinance Bank (NMB) for larger sums.
Nine in 10 households with m-money users, who sent cash remittances in the past six months, used a type of m-money account for at least one of the last three trans-
figure 15. households’ financial activities in the past six months
Source: InterMedia FITS study of households (HH) in Tanzania, April-May 2012; N=2,980.
Sent/received non-remittance
payments
Sent/received remittances
Saved/stored money
Have a pension plan
or stocks
Lent money
Have an unpaid loan
Own insurance
Have a bank
account(s)
79%
51%
59%
18%25%
9%
■ HHs with m-money users (n=1,041) ■ HHs with no m-money users (n=1,939)
6%2%
27%
3% 1% 0.2%6%
11%15%
5%
Basic financial activities
Advanced financial activities
Households with m-money users are more engaged in financial activities, including
financial planning and lending, than households with no m-money users
20 Mobile Money in Tanzania: Use, Barriers and Opportunities
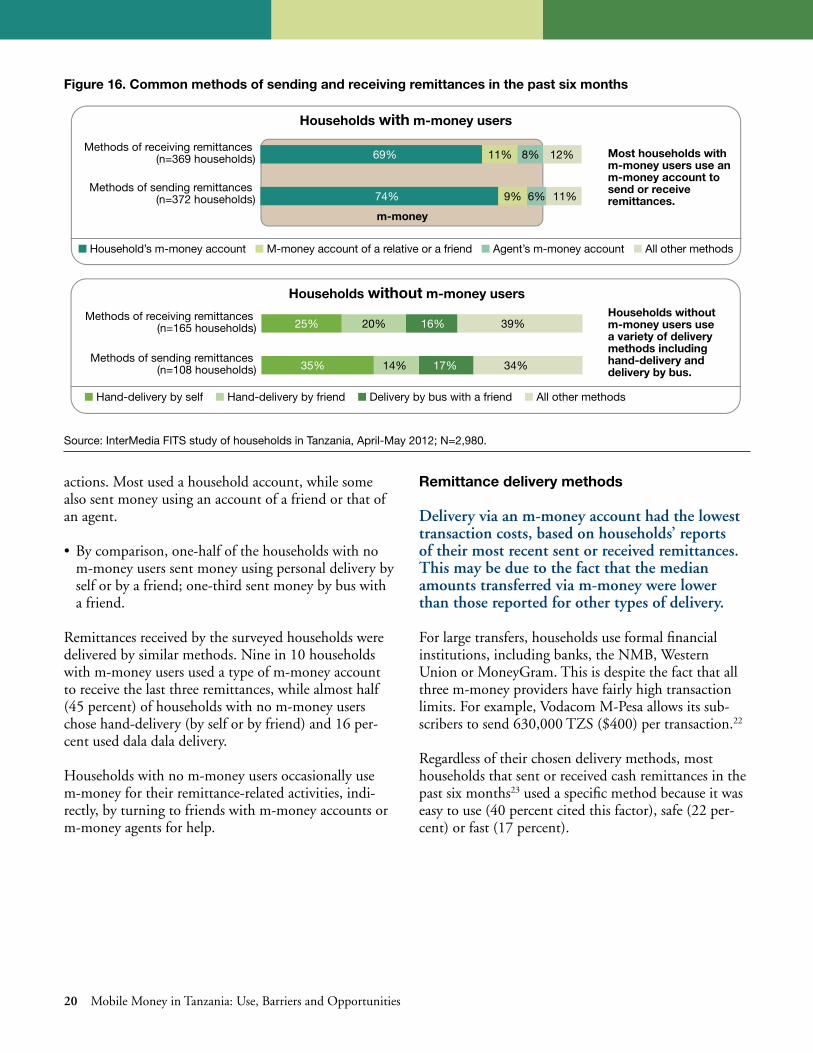
actions . Most used a household account, while some also sent money using an account of a friend or that of an agent .
• Bycomparison,one-halfofthehouseholdswithnom-money users sent money using personal delivery by self or by a friend; one-third sent money by bus with a friend .
Remittances received by the surveyed households were delivered by similar methods . Nine in 10 households with m-money users used a type of m-money account to receive the last three remittances, while almost half (45 percent) of households with no m-money users chose hand-delivery (by self or by friend) and 16 per-cent used dala dala delivery .
Households with no m-money users occasionally use m-money for their remittance-related activities, indi-rectly, by turning to friends with m-money accounts or m-money agents for help .
remittance delivery methods
Delivery via an m-money account had the lowest transaction costs, based on households’ reports of their most recent sent or received remittances. This may be due to the fact that the median amounts transferred via m-money were lower than those reported for other types of delivery.
For large transfers, households use formal financial institutions, including banks, the NMB, Western Union or MoneyGram . This is despite the fact that all three m-money providers have fairly high transaction limits . For example, Vodacom M-Pesa allows its sub-scribers to send 630,000 TZS ($400) per transaction .22
Regardless of their chosen delivery methods, most households that sent or received cash remittances in the past six months23 used a specific method because it was easy to use (40 percent cited this factor), safe (22 per-cent) or fast (17 percent) .
figure 16. common methods of sending and receiving remittances in the past six months
Source: InterMedia FITS study of households in Tanzania, April-May 2012; N=2,980.
Methods of sending remittances (n=372 households)
Methods of receiving remittances (n=369 households)
Methods of sending remittances (n=108 households)
Methods of receiving remittances (n=165 households)
12%69% 11%
9% 6% 11%74%
8% Most households with m-money users use an m-money account to send or receive remittances.
■ Household’s m-money account ■ M-money account of a relative or a friend ■ Agent’s m-money account ■ All other methods
m-money
Households with m-money users
39%25% 20%
14% 17% 34%35%
16%Households without m-money users use a variety of delivery methods including hand-delivery and delivery by bus.
■ Hand-delivery by self ■ Hand-delivery by friend ■ Delivery by bus with a friend ■ All other methods
Households without m-money users

InterMedia 21
In most cases when both remittance-sending and remit-tance-receiving households had an m-money user,24 an m-money account (any type, any provider) was used for delivering cash remittances, even for larger amounts .
Although the safety of remittances is one of the top concerns, only 4 percent of households that sent or received cash remittances in the past six months25 had remittances lost (2 percent) or stolen (2 percent) .
common reasons for remittance-related activities
About one-third of all remittances sent or received by surveyed households were intended for regular financial support (specifically, 36 percent of sent remittances26 and 35 percent of received remit-tances).27 Emergency help was a close second.
Twenty percent of all sent or received remittances in the past six months28 were in response to an emergency . Twelve percent of all remittances were business-related transactions .
The top three reasons for sending and receiving remit-tances in the past six months were the same regardless of the delivery method (Figure 18) .
common groups of remittance senders and recipients29
Parents and children permanently or temporarily living in other locations are among the top three groups of senders and recipients of remittances. In addition, friends, peers and acquaintances are an important part of remittance-related activities.
The top three recipients and senders for hand-deliv-ered remittances,30 and remittances delivered using m-money,31 were the same: family members cur-rently living in different households, or friends and acquaintances .
Money transfers among friends, peers and acquain-tances32 were equally likely to be sent or received for business, regular support or emergency help . Sixty-six percent of these remittances were delivered using an m-money account .
distance patterns for remittances33
Almost all remittances sent or received by the surveyed households were to destinations within Tanzania; only 1 percent were sent to or received from abroad.
figure 17. costs of sending and receiving cash remittances using selected delivery methods (n=828)
delivery method
last three remittances (aggregate amounts) sent/received
% of households using this method for at least
one remittance
amount sent/received (median)
all-inclusive cost of delivery (median)
tzS $ tzS $
M-money delivery via household’s account (any provider) 51 38,375 24.49 1,500 0.96
Hand-delivery (by self or by friend) 23 40,000 25.53 1,550 0.99
M-money delivery via a third-party account (any provider) 13 30,000 19.14 1,600 1.02
Bus/dala dala delivery with a friend or a driver/courier 12 40,750 26.00 2,000 1.28
M-money delivery via an agent’s account (any provider) 8 25,000 15.95 1,500 0.96
Direct deposit into a bank account 2 240,000 153.16 3,625 2.31
National Microfinance Bank (Pesa Fasta) 2 61,000 38.93 1,450 0.93
Western Union or MoneyGram 1 53,750 34.30 1,675 1.07
Source: InterMedia FITS study of households in Tanzania, April-May 2012; N=2,980.
22 Mobile Money in Tanzania: Use, Barriers and Opportunities
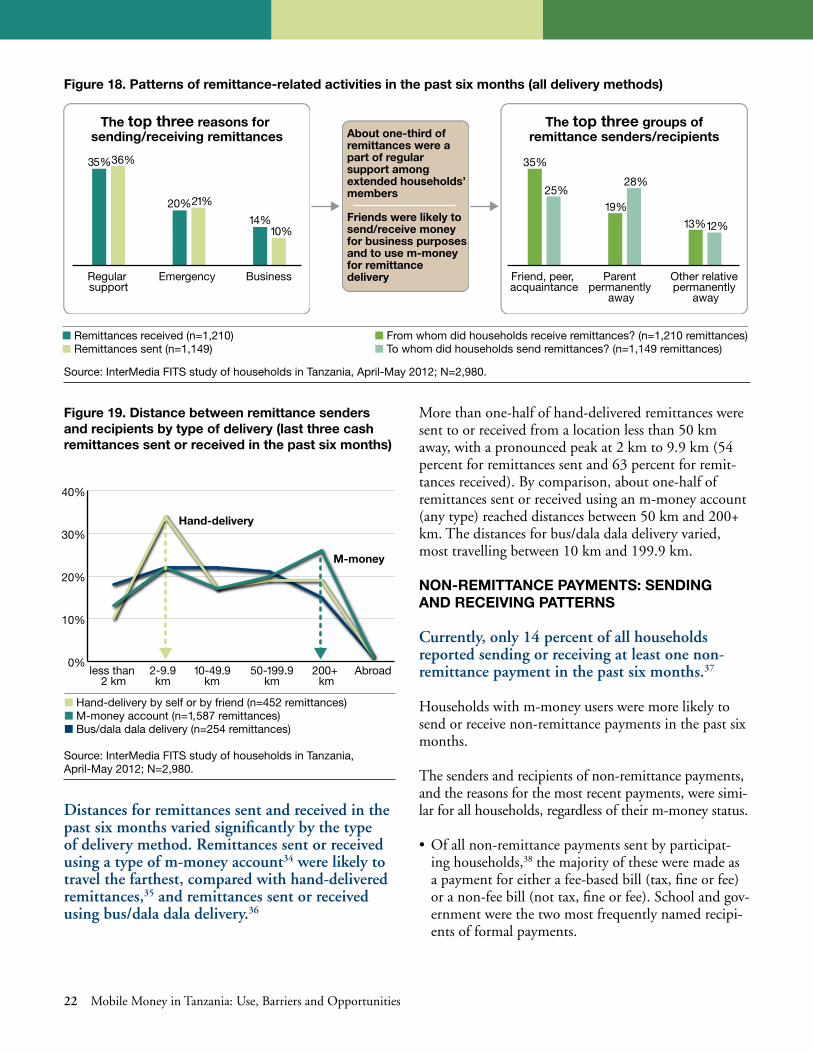
Distances for remittances sent and received in the past six months varied significantly by the type of delivery method. Remittances sent or received using a type of m-money account34 were likely to travel the farthest, compared with hand-delivered remittances,35 and remittances sent or received using bus/dala dala delivery.36
figure 18. Patterns of remittance-related activities in the past six months (all delivery methods)
Source: InterMedia FITS study of households in Tanzania, April-May 2012; N=2,980.
figure 19. distance between remittance senders and recipients by type of delivery (last three cash remittances sent or received in the past six months)
0%
10%
20%
30%
40%Bus/dala dala delivery (n=254 remittances)
Hand delivery by self or by friend (n=452 remittances)
M-money account (n=1,587 remittances)
Abroad200+ km
50-199.9km
10-49.9km
2-9.9km
less than 2 km
■ Hand-delivery by self or by friend (n=452 remittances) ■ M-money account (n=1,587 remittances) ■ Bus/dala dala delivery (n=254 remittances)
Hand-delivery
M-money
Source: InterMedia FITS study of households in Tanzania, April-May 2012; N=2,980.
More than one-half of hand-delivered remittances were sent to or received from a location less than 50 km away, with a pronounced peak at 2 km to 9 .9 km (54 percent for remittances sent and 63 percent for remit-tances received) . By comparison, about one-half of remittances sent or received using an m-money account (any type) reached distances between 50 km and 200+ km . The distances for bus/dala dala delivery varied, most travelling between 10 km and 199 .9 km .
non-rEmittancE PaymEntS: SEndinG and rEcEivinG PattErnS
Currently, only 14 percent of all households reported sending or receiving at least one non-remittance payment in the past six months.37
Households with m-money users were more likely to send or receive non-remittance payments in the past six months .
The senders and recipients of non-remittance payments, and the reasons for the most recent payments, were simi-lar for all households, regardless of their m-money status .
• Ofallnon-remittancepaymentssentbyparticipat-ing households,38 the majority of these were made as a payment for either a fee-based bill (tax, fine or fee) or a non-fee bill (not tax, fine or fee) . School and gov-ernment were the two most frequently named recipi-ents of formal payments .
BusinessEmergencyRegular support
Other relative permanently
away
Parent permanently
away
Friend, peer, acquaintance
21%
36%
10%
20%
35%
14%
About one-third of remittances were a part of regular support among extended households’ members
Friends were likely to send/receive money for business purposes and to use m-money for remittance delivery
■ Remittances received (n=1,210) ■ Remittances sent (n=1,149)
28%
13%12%
35%
19%
25%
The top three reasons for sending/receiving remittances
The top three groups ofremittance senders/recipients
■ From whom did households receive remittances? (n=1,210 remittances) ■ To whom did households send remittances? (n=1,149 remittances)
InterMedia 23
Of non-remittance payments received by households in the past six months,39 a majority of the payments were wages, making employers the leading senders of formal payments, followed closely by the government .
• Contrarytowhatmightbeexpected,householdsthatreceived wages from their employer via m-money were equally split between urban and rural, with a plurality concentrated in the Dar es Salaam region, followed by Kilimanjaro and Arusha .
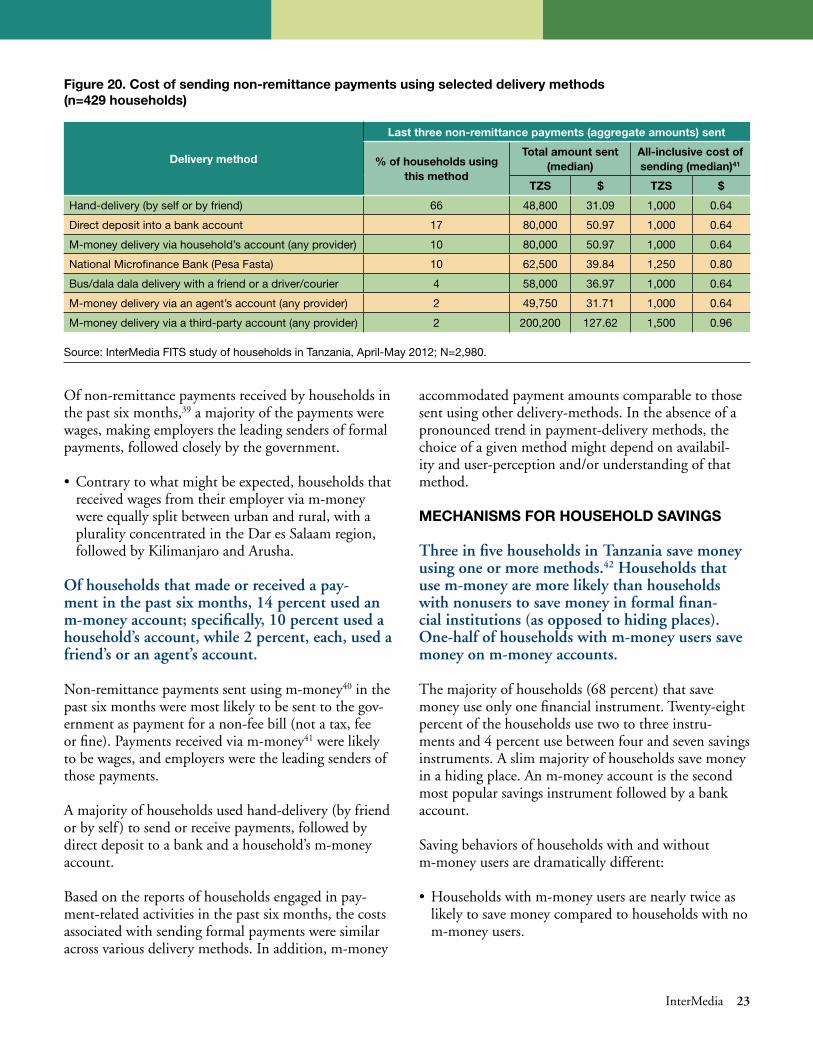
Of households that made or received a pay-ment in the past six months, 14 percent used an m-money account; specifically, 10 percent used a household’s account, while 2 percent, each, used a friend’s or an agent’s account.
Non-remittance payments sent using m-money40 in the past six months were most likely to be sent to the gov-ernment as payment for a non-fee bill (not a tax, fee or fine) . Payments received via m-money41 were likely to be wages, and employers were the leading senders of those payments .
A majority of households used hand-delivery (by friend or by self ) to send or receive payments, followed by direct deposit to a bank and a household’s m-money account .
Based on the reports of households engaged in pay-ment-related activities in the past six months, the costs associated with sending formal payments were similar across various delivery methods . In addition, m-money
accommodated payment amounts comparable to those sent using other delivery-methods . In the absence of a pronounced trend in payment-delivery methods, the choice of a given method might depend on availabil-ity and user-perception and/or understanding of that method .
mEchaniSmS for houSEhold SavinGS
Three in five households in Tanzania save money using one or more methods.42 Households that use m-money are more likely than households with nonusers to save money in formal finan-cial institutions (as opposed to hiding places). One-half of households with m-money users save money on m-money accounts.
The majority of households (68 percent) that save money use only one financial instrument . Twenty-eight percent of the households use two to three instru-ments and 4 percent use between four and seven savings instruments . A slim majority of households save money in a hiding place . An m-money account is the second most popular savings instrument followed by a bank account .
Saving behaviors of households with and without m-money users are dramatically different:
• Householdswithm-moneyusersarenearlytwiceaslikely to save money compared to households with no m-money users .
figure 20. cost of sending non-remittance payments using selected delivery methods (n=429 households)
delivery method
last three non-remittance payments (aggregate amounts) sent
% of households using this method
total amount sent (median)
all-inclusive cost of sending (median)41
tzS $ tzS $
Hand-delivery (by self or by friend) 66 48,800 31.09 1,000 0.64
Direct deposit into a bank account 17 80,000 50.97 1,000 0.64
M-money delivery via household’s account (any provider) 10 80,000 50.97 1,000 0.64
National Microfinance Bank (Pesa Fasta) 10 62,500 39.84 1,250 0.80
Bus/dala dala delivery with a friend or a driver/courier 4 58,000 36.97 1,000 0.64
M-money delivery via an agent’s account (any provider) 2 49,750 31.71 1,000 0.64
M-money delivery via a third-party account (any provider) 2 200,200 127.62 1,500 0.96
Source: InterMedia FITS study of households in Tanzania, April-May 2012; N=2,980.
24 Mobile Money in Tanzania: Use, Barriers and Opportunities
• Householdsusingm-moneyarealmostfivetimesmore likely than non-using households to employ institutional savings instruments, including bank accounts, stocks and pension plans .
• Lessthanone-thirdofhouseholdswithm-moneyusers save money in a hiding place, while two in five households with no m-money users do so .
Saving money with another person is unpopular among all household subgroups . Among different methods of saving money with another person, advance purchases or deposits with a shopkeeper were the least secure . Eighteen percent of households using these savings methods reported their money lost or stolen in the past 12 months .
Households’ savings kept in village-level savings groups also appeared at risk . For example, 18 percent of house-holds saving money with a merry-go-around lost some of their savings in the past 12 months . Only 3 per-cent of households that saved their money in a bank reported money lost or stolen .
Among households that saved money using an m-money account,43 10 percent reported some of their savings lost or stolen . This is comparable to the average proportion of saving households who reported losing some money from their savings in the past 12 months across different types of savings mechanisms (9 percent) .
inSurancE and loanS
M-money is not a regular feature of households’ lending and insurance activities but is used in some cases. Currently, 6 percent of all house-holds that own insurance,44 and 11 percent of households that have engaged in any type of loan-related activities,45 used an m-money account for related transactions, including credit and payment transfers.
Eight percent of all surveyed households owned any type of insurance in the past six months . The majority of those households have only one type of insurance, with medical insurance mentioned most frequently (6 percent) . The percentage of households reporting any other insurance is at or below 2 percent .
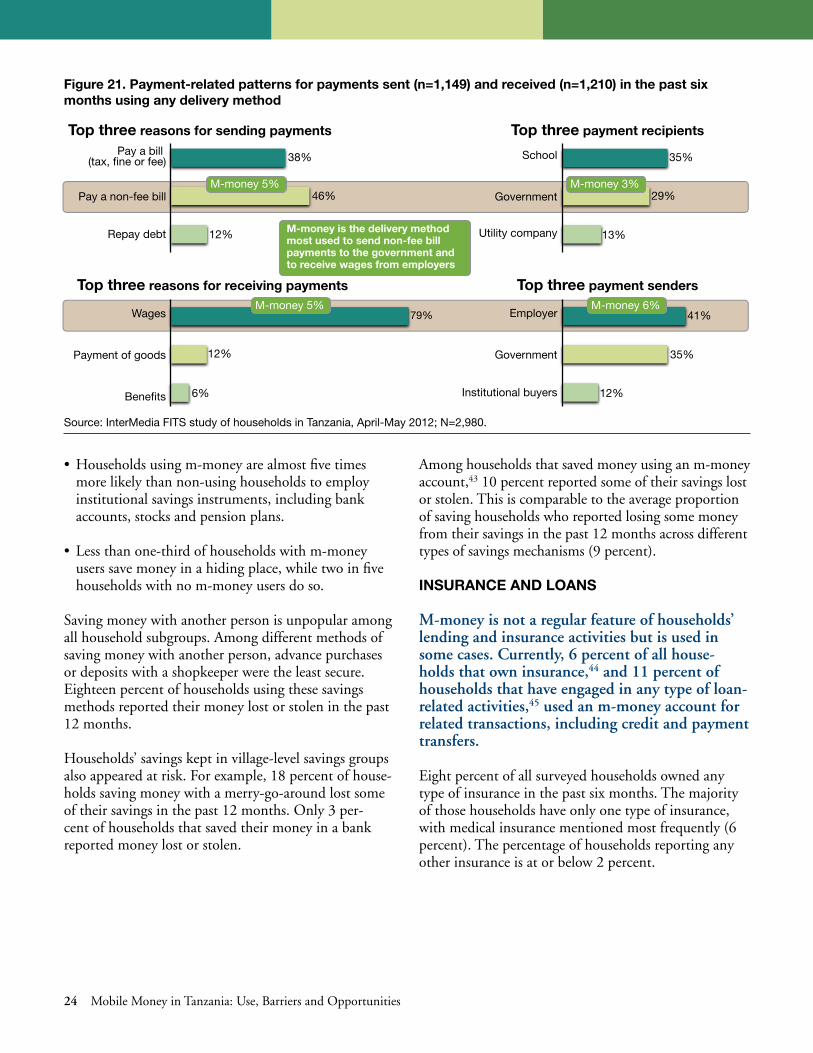
figure 21. Payment-related patterns for payments sent (n=1,149) and received (n=1,210) in the past six months using any delivery method
Source: InterMedia FITS study of households in Tanzania, April-May 2012; N=2,980.
Repay debt
Pay a non-fee bill
Pay a bill (tax, fine or fee)
Utility company
Government
School
Benefits
Payment of goods
Wages
Institutional buyers
Government
Employer
M-money is the delivery method most used to send non-fee bill payments to the government and to receive wages from employers
38%
46%
12%
79%
12%
6%
35%
29%
13%
41%
35%
12%
Top three reasons for sending payments Top three payment recipients
Top three reasons for receiving payments Top three payment sendersM-money 5%
M-money 5%
M-money 6%
M-money 3%
InterMedia 25
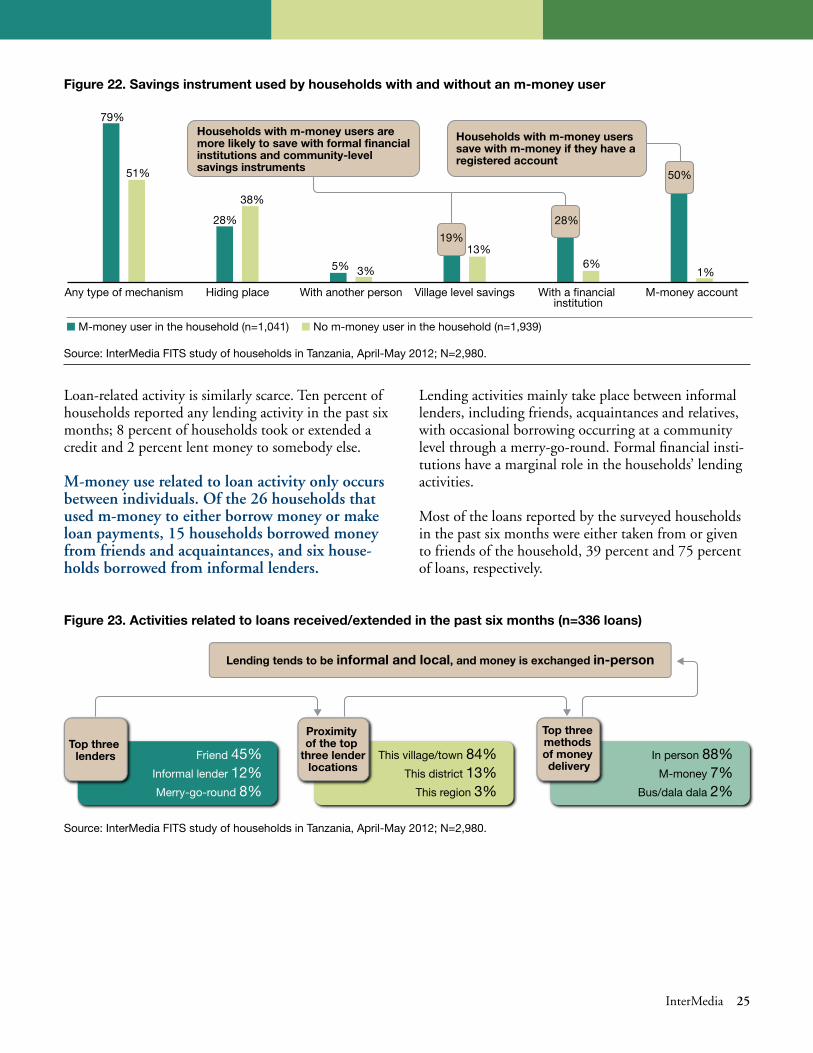
figure 22. Savings instrument used by households with and without an m-money user
Source: InterMedia FITS study of households in Tanzania, April-May 2012; N=2,980.
M-money accountWith a financial institution
Village level savingsWith another personHiding placeAny type of mechanism
51%
79%
5%
38%
13%
28%
3%
■ M-money user in the household (n=1,041) ■ No m-money user in the household (n=1,939)
19%
50%
1%
28%
6%
Households with m-money users are more likely to save with formal financial institutions and community-level savings instruments
Households with m-money users save with m-money if they have a registered account
Loan-related activity is similarly scarce . Ten percent of households reported any lending activity in the past six months; 8 percent of households took or extended a credit and 2 percent lent money to somebody else .
M-money use related to loan activity only occurs between individuals. Of the 26 households that used m-money to either borrow money or make loan payments, 15 households borrowed money from friends and acquaintances, and six house-holds borrowed from informal lenders.
Lending activities mainly take place between informal lenders, including friends, acquaintances and relatives, with occasional borrowing occurring at a community level through a merry-go-round . Formal financial insti-tutions have a marginal role in the households’ lending activities .
Most of the loans reported by the surveyed households in the past six months were either taken from or given to friends of the household, 39 percent and 75 percent of loans, respectively .
figure 23. activities related to loans received/extended in the past six months (n=336 loans)
Friend 45% Informal lender 12% Merry-go-round 8%
Top three lenders This village/town 84%
This district 13%This region 3%
In person 88% M-money 7%
Bus/dala dala 2%
Proximity of the top
three lenderlocations
Top three methods of money delivery
Lending tends to be informal and local, and money is exchanged in-person
Source: InterMedia FITS study of households in Tanzania, April-May 2012; N=2,980.

26 Mobile Money in Tanzania: Use, Barriers and Opportunities
• Ofallreportedloanstakenoutbyhouseholdsinthepast six months,46 12 percent were given out by a formal agency, including banks, microfinance institu-tions or an employer .
Households that have insurance are likely to have at least one m-money user and be banked. House-holds with unpaid loans are likely to be unbanked and have no m-money users. These households also are likely to be living below the poverty line.
figure 24. demographic characteristics of households that owned insurance (n=249) and had an unpaid loan (n=236)
No m-money user in HH
Poor (consumption
<$2/day)
UnbankedRural
64%61%
52%
74%
51%
65%
36%
53%
Households that had an unpaid debt were more likely than households that had insurance to be unbanked, poor and have no m-money users
■ HHs that have insurance (n=249) ■ HHs with an unpaid loan (n=236)
Source: InterMedia FITS study of households (HH) in Tanzania, April-May 2012; N=2,980.
InterMedia 27
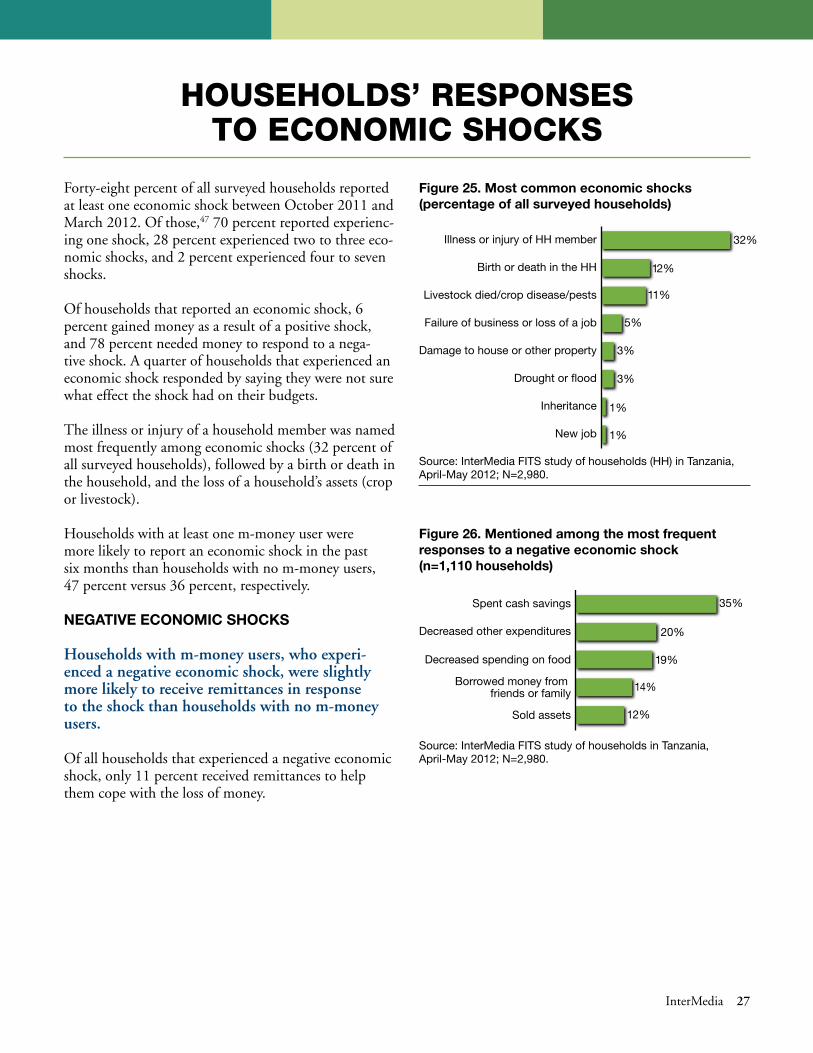
Forty-eight percent of all surveyed households reported at least one economic shock between October 2011 and March 2012 . Of those,47 70 percent reported experienc-ing one shock, 28 percent experienced two to three eco-nomic shocks, and 2 percent experienced four to seven shocks .
Of households that reported an economic shock, 6 percent gained money as a result of a positive shock, and 78 percent needed money to respond to a nega-tive shock . A quarter of households that experienced an economic shock responded by saying they were not sure what effect the shock had on their budgets .
The illness or injury of a household member was named most frequently among economic shocks (32 percent of all surveyed households), followed by a birth or death in the household, and the loss of a household’s assets (crop or livestock) .
Households with at least one m-money user were more likely to report an economic shock in the past six months than households with no m-money users, 47 percent versus 36 percent, respectively .
nEGativE Economic ShockS
Households with m-money users, who experi-enced a negative economic shock, were slightly more likely to receive remittances in response to the shock than households with no m-money users.
Of all households that experienced a negative economic shock, only 11 percent received remittances to help them cope with the loss of money .
hoUseholds’ responses To eConoMiC shoCKs
figure 25. most common economic shocks (percentage of all surveyed households)
figure 26. mentioned among the most frequent responses to a negative economic shock (n=1,110 households)
New job
Inheritance
Drought or flood
Damage to house or other property
Failure of business or loss of a job
Livestock died/crop disease/pests
Birth or death in the HH
Illness or injury of HH member 32%
12%
3%
5%
11%
1%
3%
1%
Sold assets
Borrowed money from friends or family
Decreased spending on food
Decreased other expenditures
Spent cash savings 35%
20%
19%
12%
14%
Source: InterMedia FITS study of households in Tanzania, April-May 2012; N=2,980.
Source: InterMedia FITS study of households (HH) in Tanzania, April-May 2012; N=2,980.

28 Mobile Money in Tanzania: Use, Barriers and Opportunities
figure 27. mentioned among the most frequent responses to a positive economic shock (n=81 households)
Sent remittances
Worked less
Bought assets
Sent children to school or moved them to a better school
Rented more land
Increased other expenditures 27%
16%
15%
6%
14%
6%
Source: InterMedia FITS study of households in Tanzania, April-May 2012; N=2,980.
Among households with m-money users, who reported the loss of money due to an economic shock, 13 per-cent received remittances to help them cope with a shock compared with 9 percent of households with no m-money users .
The most common household response to a negative economic shock was to deplete the household’s cash savings, followed by decreasing expenditures on food and other necessities .
PoSitivE Economic ShockS
Of households that gained money as a result of a positive shock, only 6 percent, or five households, sent gifts or remittances to their family or friends. Four of those households reported an m-money user.
Common responses to an increased money flow were to spend more on various products/services, to rent more land, and to send children to school or send them to a better school .
InterMedia 29
Almost all households that use m-money have registered m-money accounts and use them for remittances .
Based on the survey findings, the limited use of m-money services other than for remittances, in part, might be related to the surveyed households’ under-standing of the services, the level of trust established with the m-money agents and how well the agents per-form .
• Currently,thebulkofregisteredm-moneyusersanda slim majority of nonusers perceive m-money as a service for informal cash transfers among friends or relatives . Few registered m-money users also use the service to save money, purchase insurance products (currently offered by Vodacom M-Pesa and Ezy Pesa only), or conduct business transactions .
• AccordingtointerviewswithregisteredusersofVod-acom M-Pesa, Airtel Money and Tigo Pesa, estab-lishing trust is central to stable relationships with
ConClUsions
m-money agents . In addition, households engaging in cash transfers report the second most important fac-tor in their choice of a delivery method is safety . The number one factor is convenience .
• Basedontheexperiencesofregisteredm-moneyusers,some m-money agents deliver inconsistent perfor-mances—they are absent or are not able to help with transactions due to low liquidity .
Media advertisements appear to be effective vehicles for providing initial information about m-money services and m-money agents .
Households with m-money users are twice as likely to save money (including for emergencies), and five times more likely to use formal financial institutions to store money, than households with nonusers . They also are more likely than households with no m-money users to protect their wealth by purchasing various insurance products .
30 Mobile Money in Tanzania: Use, Barriers and Opportunities
1 https://www .cia .gov/library/publications/the-world-factbook/geos/tz .html .
2 http://data .worldbank .org/country/tanzania .
3 Ibid .
4 Ibid .
5 http://www .dailynews .co .tz/business/?n=19130&cat=business .
6 http://www .developingtelecoms .com/mobile-money-service-provider-profiles .html .
7 http://www .ifc .org/ifcext/gfm .nsf/Attachments-ByTitle/Tool6 .8 .CaseStudy-M-PESATanzania/$FILE/Tool+6 .8 .+Case+Study+-+M-PESA%2C+Tanzania .pdf .
8 http://www .telecompaper .com/news/tigo-launches-money-transfer-service-in-tanzania .
9 http://mobilemoneyafrica .com/zantel-tanzania-rebrands-mobile-cash-service-z-pesa-as-ezypesa .
10 For more information on the m-money use and related behav-iors at an individual level in Tanzania, see “Mobile Money for the Unbanked: Lessons from Tanzania” and “Tanzania Mobile Money: Tracker Survey,” www .audiencescapes .org .
11 The analysis in the section on motivators for and barriers to the adoption of m-money services is based on the results of the interviews with registered users of Vodacom M-Pesa, Airtel Money and Tigo Pesa . Due to the small number of Ezy Pesa registered users (n=2) the analysis of those users is not possible and is not included in this section .
12 n=94
13 n=35
14 n=85
15 n=91
16 n=249 for registered users of Vodacom M-Pesa, Airtel Money and Tigo Pesa combined .
17 Due to a small number of Airtel registered users and Tigo Pesa registered users who were unable to ever withdraw money when they wanted to (n=21 and n=54, respectively), the analysis in this paragraph presents the findings for all registered users who reported this problem (n=226) .
18 n=570
19 n=513
endnoTes 20 n=191
21 n=1,041
22 http://www .ilo .org/dyn/migpractice/migmain .showPractice?p_lang=en&p_practice_id=70 .
23 n=828
24 n=504
25 n=828
26 n=1,149
27 n=1,210
28 n=2,359
29 The “remittance recipients” question is asked of those who sent remittances . The “remittance senders” question is asked of those who received remittances .
30 n=385
31 n=1,503
32 n=701
33 The “remittance recipients” question is asked of those who sent remittances . The “remittance senders” question is asked of those who received remittances .
34 n=1,503
35 n=385
36 n=204
37 n=429
38 n=573
39 n=442
40 n=55
41 n=32
42 n=1,812
43 n=550
44 n=249
45 n=236
46 n=264
47 n=1,420

InterMedia 31
about intErmEdiaInterMedia (www .intermedia .org) is a nonprofit consulting group with expertise in applied research and evaluation . We help clients understand, inform and engage people worldwide—especially in challenging environments . InterMedia’s offices are located in Washington, D .C ., London and Nairobi, and we work with a global network of research partners .
Clients active in international development, global media and strategic communication come to us for insight on how people gather, interpret, share, and use information from all sources and on all platforms . We provide guidance and impact assessment for strategies focused on engagement, behavior change, content delivery and the use of com-munication technologies for social good .
InterMedia promotes knowledge-sharing through a range of online and offline resources, including AudienceScapes (www .audiencescapes .org)—a research dashboard providing data and analysis of media and communication environments in developing countries . We are also committed to strengthening research capacity in the countries where we work .
Contact us at: generalinfo@intermedia .org .
acknoWlEdGmEntSAbout the author: Anastasia Mirzoyants, Ph .D ., is associate director of research at InterMedia and principal author of this report . She leads implementation of the Financial Inclusion Tracker Surveys (FITS) project in Uganda, Paki-stan and Tanzania . At InterMedia, Ms . Mirzoyants specializes in research focused on assessing financial services for the poor, and understanding the impact of traditional media and digital communications in developing markets . She received her doctoral degree from the University of Toledo, Ohio .
This report could not have been prepared without the contributions of a number of InterMedia staff who provided additional research and support for the project:
Tim Cooper, Director of ResearchPeter Goldstein, Director of Foundation RelationsMax Richman, Research AnalystDixie Awugvi, Senior Research Manager, InterMedia AfricaAbdinasir Abdi, Operations Manager, InterMedia AfricaMichelle Kaffenberger, Research Manager
rESEarch SuPPort tEamData quality control: SwissPeaks | Editor and Graphic Designer: Mary Ann Fitzgerald, Diane Buric
A special note of thanks and gratitude goes to InterMedia’s data collection partners on this study: TNS RMS in Nairobi, without whom this project would not have been possible . InterMedia also would like to acknowledge Sonja Gloeckle, former senior research manager at InterMedia for all of her work during the initial stages of this project .
In addition, InterMedia would like to thank the Bill & Melinda Gates Foundation (BMGF) Financial Services for the Poor program, and personally thank Dr . Jake Kendall, BMGF’s Senior Program Officer, Innovation and Research, Financial Services for the Poor, as well as Dr . Tavneet Suri, Associate Professor, MIT Sloan School of Management, for the productive partnership on this project .
This study was carried out with funding from the Bill & Melinda Gates Foundation (BMGF) . All survey materials and data resulting from this study are the property of the BMGF, but the findings and conclusions within are those of the authors and do not necessarily reflect positions or policies of the BMGF .
This report was published by InterMedia, February 2013 .
HeadquartersWashington, D .C . Tel: +1 .202 .434 .9310
InterMedia EuropeLondon, U .K .Tel: +44 .207 .831 .8724
InterMedia AfricaNairobi, KenyaTel: +254 .720 .109183
For general inquiriesgeneralinfo@intermedia .org