mo n t h l y r e v ie w - st. louis fed · mo n t h l y r e v ie w ... fact the records of...
TRANSCRIPT

M o n t h l y R e v i e wF E D E R A L R E S E R V E B A N K O F A T L A N T A
V olum e X X X III A tlanta, Georgia, June 30, 1948 Num ber 6
S i x t h D i s t r i c t L i v e s t o c k I n d u s t r y :
An Appraisal of EfficiencyT h r o u g h the developm ent o f pastures and new com bina
tions o f grazing crops m any D istrict farm ers are in creasing their incom e from livestock . O nly in recent years have either research institutions or ind ividual farm ers capitalized on the fu ll feed-producing poten tia lities o f the D istrict states. T he lon g m ild w inters and the abundant ra in fa ll can be assets in the production o f feed and grazing crops. In fact the records o f experim ent stations and som e farm ers in dicate that a greater w eight o f grazing m aterial can be grow n during the six fa ll and w inter m onths than can be grow n during the six spring and sum mer m onths.
T he advantage in the production o f livestock feed that D istrict farm ers m ay have over farm ers in m ore northerly latitudes does not lie in higher y ie ld s o f a sin g le crop but in the alm ost continuous production p ossib le w ith an efficient com bination o f grazing crops and pastures. S ince the com binations o f feed crops are alm ost lim itless, m any farm ers are experim enting to find the m ost efficient system for their ow n particular operations. E xperim ent stations in D istrict states a lso are conducting a w ide variety o f tests on feed crops, and m ost o f the results offer encouragem ent to D istrict producers.
Just recently the B ell M ina Substation o f the A labam a E xperim ent Station released inform ation on an experim ent it had conducted w ith the feed ing o f beef cattle on a com bination o f two so il-b u ild ing legum es, reseeding crim son c lo v er and Lespedeza serecia. T his com bination, the results show ed, m ay provide year-round grazing o f h igh feed in g value from the sam e land year after year— lespedeza in the spring and sum mer and crim son clover in the late fa l l and winter. T his forage system prom ises the production o f high- qu ality feed w ithout the annual work o f preparation and reseeding. A s stated in the first progress report, covering the five m onths M ay-Septem ber 1947, th is com bination produced 41 7 pounds o f beef to the acre. In term s o f the num ber o f feed units required to produce that am ount o f beef, the com bination w as the equivalent o f alm ost 8 0 bushels o f corn.
A t the W est Tennessee E xperim ent Station at Jackson, another experim ent was conducted to determ ine the results o f feed in g producing Jersey cow s on an a ll-roughage ration and the effect that w ould be produced by adding fu ll-gra in feed ing to such a ration. T he herd, m ostly purebred, w as d ivided into two groups. One w as given pasture, hay, and s i lage, and the other the sam e ration w ith grain added at a rate o f one pound to each three pounds o f m ilk produced
daily . M idw ay in the four-year test the ration w as reversed for these groups, the grain being discontinued fo r one group but added to the other. P relim inary results show that the cow s w hen fed grain averaged 10,579 pounds o f m ilk per cow per year and those receiving no grain averaged 8 ,043 pounds. R oughage feed in g alone thus produced 7 6 percent as m uch m ilk as com bined roughage and fu ll-gra in feed ing did.
In both o f these experim ents, the one w ith b eef cattle and the one w ith dairy cattle, excellen t livestock w ere grazed on productive pastures and crops under superior m anagem ent. It is, therefore, im probable that state or D istrict average rates o f production could in the near future approach the rates obtained in these experim ents. N evertheless, h igh and efficient m ilk and b eef production can be obtained from recom m ended grazing and roughage program s.
A s a result o f the increased productivity o f pastures and land devoted to grazing crops, D istrict farm ers have shown an increasing interest in expanding livestock production on their farm s. The trends are shown m ore c lear ly when the various classes o f livestock are converted to anim al units. One anim al unit is taken as the equivalent o f a mature cow or horse in the consum ption o f feed. T he num ber o f such anim al units on the farm s o f D istrict states in 1947 w as 23 percent larger than the average num ber on farm s during 1930-39. In 1930-39, 62 percent o f the anim al units in D istrict states was com posed o f cattle and calves, but in 1947 this percentage had risen to 70 . T hese figures indicate that livestock developm ent in the Southeastern states is taking a definite trend tow ard cattle and calves or, in other words, anim als w hich can utilize grazing crops m ost efficiently. The num ber o f hogs had increased 15 percent, or less than h a lf the rate o f increase for cattle. The num ber o f chickens on farm s increased about 7 percent, and that o f turkeys declined 33 percent. Sheep num bers, long on the wane, w ere down 22 percent.
N ot on ly has there been a significant increase in the total number o f anim al units on D istrict farm s, but apparently there has a lso been an increase in the production rates o f m ost classes o f livestock . U nfortunately no production-rate data on m eat anim als are availab le because o f the m any d ifferent w eights and ages at w hich these anim als are sold . D ata are availab le, how ever, for dairy cow s and chickens, although chickens are n eg lig ib le w ith respect to their consum ption o f feed from pastures and grazing crops. O f a ll
Digitized for FRASER http://fraser.stlouisfed.org/ Federal Reserve Bank of St. Louis

58 Monthly Review o f the Federal Reserve B a n k o f A tlan ta fo r Ju n e 1948
the m easures o f the efficiency w ith w hich feed crops are bein g converted into incom e, m ilk production is therefore probab ly the best that is availab le .
T he average m ilk production per cow in D istrict states during 1947 w as 11 percent above the 1930-39 rate, but the total production was 18 percent greater than the 1930-39 average. F lorida show ed the greatest gain in production per cow , 25 percent, and L ouisiana the sm allest, 3 .5 percent.
TOTAL ANIMAL UNITS ON FARMS IN DISTRICT STATES
Livestock 1930-39 1947 PercentChange
Cattle and calves............. ...................... 6,001,000 8,337,000 38.92Hogs and p ig s .......................................... 1,137,200 1,311,000 15.29Chickens..................................................... 408,320 436,730 6.95Sheep and lam bs.................................... 102,240 79,560 -22.19Turkeys....................................................... 3,210 2,140 -33.34Mules and colts....................................... 1,557,000 1,245,000 -20.04Horses and colts...................................... 471,000 528,000 12.10
Total......................................................... 9,679,970 11,939,430 23.34Percent of
cattle in to ta l.................................... 62 70 —
In part these gains in num bers o f livestock and in production per anim al com e from the increased production o f feed. In 1947 the production o f feed units w as 55 percent greater than the 1930-39 average. T his estim ate, however, is necessarily rough because there is no accurate w ay o f m easuring how m uch cam e from pastures.
Low Livestock Production RatesThe increased am ount o f feed availab le during recent years together w ith h igh prices for m ilk and m ilk products during and since the war has resulted in D istrict dairym en doing two th ings: first, feed ing their cow s m ore heavily , as is in d icated by an increase o f 11 percent in 1947 over the 1930-39 average in the am ount o f m ilk produced per cow ; and, second, adding m ore cow s to their herds. The latter is evident from the fact that total production o f m ilk in D istrict states in 1947 had increased by 18 percent over the 1930-39 average, or at a faster rate than the increase in production per cow. The gains m ade in D istrict states, how ever, w ere ex ceeded by the gains m ade by dairym en throughout the nation, show ing that D istrict farm ers have m erely shared in the increased dem and for dairy products rather than that they have m ade inroads on that part o f the m ilk m arket usually supplied by dairy farm ers outside the area. In 1947 the average production o f 3 ,284 pounds o f m ilk per cow in Sixth D istrict states was on ly two thirds o f the national average.
MILK PRODUCTION PER COW IN DISTRICT STATES FOR SELECTED YEARS
StateYearly Production
(Pounds) PercentIncrease
1930-39 1941 1943 1945 1947 1947/1930-39
G eorgia............. 3,137 3,240 3,200 3,200 3,340 6.47Florida............... 3,034 3,300 3,750 3,900 3,800 25.24Tennessee.......... 3,352 3,510 3,570 3,640 3,820 13.96Alabama............. 3,103 3,260 3,200 3,350 3,430 10.53M ississippi...... 2,673 2,600 2,580 2,730 2,840 6.24Louisiana........... 2,309 2,250 2,340 2,324 2,390 3.50Six States
A verage..........United States
2,953 3,038 3,076 3,160 3,284 11.21A verage........ 4,355 4,741 4,604 4,797 5,000 14.81
One reason often given for the low rates o f production o f livestock and livestock products in D istrict states is that m ost farm ers keep on ly enough livestock for their fam ilies’ use. W here a farm er has no m ore than one or two cow s on h is farm and se lls no dairy products he has little incentive
to feed h is cow s for h igh production or to breed them for that purpose. A lthough the reason is a p lau sib le one, it is o n ly partly correct. In A labam a, fo r exam ple, m ore than a third o f a ll the cow s in 1939 w ere fa m ily m ilk cow s and produced at a rate 15 percent above the state average for a ll cow s. Com pared w ith the five-to-nine-cow group, the one-cow group a lone produced at a rate 60 percent h igher in F lorida, 54 percent h igher in A labam a, 52 percent h igher in G eorgia, 30 percent h igher in L ouisiana, 21 percent h igher in T ennessee, and 20 percent h igher in M ississip p i.
FARMS WITH MILK COWS IN SIX DISTRICT STATES AND TOTAL IN UNITED STATES, 1939
Area Number ol Farms Farms with Few er Than Three Cowswith Cows Number Percent
G eorgia.................F lorida...................
158,226 137,092 86.6426,924 21,921 81.41
T ennessee .. . . . . . . . . 195,157 145,125 74.36Alabama................. 181,579 161,597 88.99M ississippi........... 191,907 146,988 76.59Louisiana............... 103,600 81,740 78.89Six S tates............. 857,393 694,463 80.99United S tates. . . . 4,663,431 2,358,606 50.57
D airym en w ho have large herds and w ho se ll m ilk for Grade “A ” use have production rates considerab ly h igher than the state averages. T he farm ers m ost in need o f in creasing their rate o f production , therefore, are apparently those who se ll m ilk to processin g p lan ts that m ake cheese, butter, evaporated m ilk , and other products. F or the m ost part these five-to-nine-cow herds b elon g to the operators o f fam ily-sized farm s w ho are seeking to supplem ent their crop incom e w ith incom e from livestock , and it is these farm ers who cou ld u tilize im proved pastures and grazing crops to the best advantage. T heir units are too sm all to afford the h igh investm ent in equipm ent necessary fo r the production o f Grade “A ” m ilk . M oreover, in addition to havin g problem s o f producing feed , they face p rob lem s in breeding for higher-capacity production because they do not have enough cow s or sufficient incom e to ju stify their keep ing a b u ll that w ould im prove the q u ality o f herd replacem ents. T h is problem has been reduced som ew hat in recent years, how ever, w ith the establishm ent in som e o f the D istrict states o f artificial-breeding associations that offer farm ers w ith sm all herds an opportunity to im prove their cattle strains at a reasonable cost.
MILK PRODUCTION PER COW IN DISTRICT STATES IN 1939 BY SIZE OF HERD
(Pounds)
StateSize of Herd All Cows
in StateOne Cow Two Cows 5 to 9 Cows 50 to 74 Cows
G eo rg ia .... 3,731 2,928 2,461 5,083 3,323Florida___ 3,039 2,221 1,896 4,691 3,494Tennessee. 3,793 3,260 3,138 4,978 3,463A labam a... 3,823 3,005 2,478 4,458 3,337Mississippi 3,114 2,672 2,588 4,072 2,834Louisiana.. 2,715 2,342 2,084 3,997 2,571
Low production rates seem to constitute one o f the m ost serious handicaps to dairym en in D istrict states. In part the increase in total m ilk production has cotne from m ore low- capacity cow s on rather p oor ly develop ed pastures.
T here is a definite relation betw een the rate o f production and the efficiency o f production . O f a ll the various factors affecting m ilk costs, the rate o f production per cow is perhaps the m ost im portant. O ne reason is that as m ilk production increases, the percentage o f feed required by the cow for her body m aintenance declines and, as a consequence,Digitized for FRASER
http://fraser.stlouisfed.org/ Federal Reserve Bank of St. Louis

M o n t h l y R e v i e w o f the Federal Reserve B ank o f A tlan ta fo r Ju n e 1948 5 9
m ore o f her feed is converted into m ilk . A nation-w ide study o f m ilk-production cost records revealed that the returns over feed cost becam e stead ily greater as the y ie ld o f m ilk increased. By increasing their m ilk cow s’ present average production, 3 ,284 pounds, to 4 ,000 pounds D istrict farm ers w ould reduce their feed cost per unit 14 percent. I f D istrict dairy farm ers brought their production up on ly to the national average o f 5 ,000 pounds, they could reduce their feed cost per 100 pounds o f m ilk 21 percent. I f they cou ld increase it to 7 ,500 pounds, their reduction in feed cost w ould total 38 percent.
Feed Production UpSince m ost feed crops are harvested in bushels, pounds, or tons, they can be converted read ily into feed units. For estim ating D istrict production a bushel o f corn was chosen as a standard feed unit because the acreage devoted to corn in the S ix States is by far the largest o f any other feed crop. A ll hay and concentrate feeds produced by farm ers in the S ix States can then be reduced to their feed ing va lu e in term s o f bushels o f corn, or feed units. W here such a crop as a lfa lfa or lespedeza is grazed, the acreage can be assum ed to produce the sam e num ber o f feed units it w ould y ie ld if it were harvested for hay.
A n assum ption used by the A labam a experim ent station, nam ely that an acre o f pasture should produce as m any feed units as an acre o f tam e hay w ould , fac ilita tes an estimate o f the number o f feed units produced on pasture acreage. The acre o f tam e hay used was a w eighted com posite o f a ll the tam e hays grown, w hich resulted in an estim ated feed value per acre o f pasture slig h tly m ore than that o f a ton o f tam e hay, or about the feed equivalent o f 15 bushels o f corn. A n acre o f im proved perm anent pasture should produce m ore than the feed equivalent o f 15 bushels o f corn, but, on the other hand, there are large unim proved pasture acreages in the S ix States that w ill not produce a feed ing equivalent o f 15 bushels o f corn.
1,000
800
600
200
M ost o f the 55-percent difference between the 1947 production o f feed units and the 1930-39 average cam e from the increase in pasture. Feed units supplied by pasture a lone were m ore than double the 1930-39 average; feed units supp lied by hay and roughage increased 38 percent, and those by concentrates, that is corn, sm all grains, and peanuts, in creased 7 percent. W hen it is ap p lied to the total acreage o f open pasture in D istrict states the assum ption that one acre
is equal to an acre o f tam e hay m ay exaggerate the feeding value o f pasture. But even i f the assum ed value were cut in h a lf the production o f total feed units w ould show a gain o f 39 percent over the 1930-39 average.
DISTRICT STATES FEED UNITS BY SOURCE, FOR SELECTED YEARS
YearConcentrates Roughages Pasture
Number(Ths'nds)
Percent
Number(Ths'nds)
Percent
Number(Ths'nds)
Percent
1930-39 Average. 250,896 100 55,662 100 182,445 1001941....................... 351,692 140 82,573 148 307,678 1691943....................... 291,040 116 77,592 139 286,650 1571945....................... 301,578 120 89,932 162 469,442 2571947....................... 268,811 107 77,113 138 411,993 226
Feed Units Increase Faster than Animal UnitsW ith the 23-percent increase in the num ber o f livestock on D istrict-state farm s by January 1, 1947, and the 55-percent increase in 1947 feed production, there was about 25 percent m ore farm -produced feed per anim al than there was during the 1930’s. M easured in term s o f feed units relative to the num ber o f anim al units, the 1947 production o f concentrates was down 13 percent from the am ount availab le during the base period, h ay and roughage com bined was up12 percent, and pasture was up 84 percent. The increase in feed units per anim al does not mean that D istrict livestock are now being given as much feed as they can u tilize efficiently . Indeed, the continued low rates o f livestock production indicate that a greater quantity and a better quality o f feed w ould be profitable for m ost D istrict producers.
FEED UNITS AND ANIMAL UNITS IN DISTRICT STATES FOR SELECTED YEARS
YearFeed Units1 Animal Units Feed Units per
Animal UnitNumber
(Ths'nds) Percent Number(Ths'nds) Percent Number
(Ths'nds) Percent
1930-39 Average . . . 489,003 100 9,680 100 50.5 1001941........................... 741,943 152 10,455 108 71.0 1401943............................ 655,282 134 11,623 120 56.4 1121945............................ 860,952 176 12,309 127 69.9 1381947........................... 757,917 155 11,939 123 63.5 126*Each acre of pasture is counted as an acre of tame hay. ________________
A n evaluation o f progress in total feed production and in the am ount produced per anim al unit m ust include the consideration that the Sixth D istrict states do not m ake up a natural livestock area in the sense that they have abundant native grasses, that grains can be produced at low cost, or that land is low priced in relation to its productivity. N e ither is the area “naturally” adapted as far as the background o f its farm p eop le is concerned; for on ly a fraction o f D istrict farm ers have had experience in producing liv e stock and livestock products for market. M oreover, until recently there were com paratively few markets o f that type.
The two basic feeds in livestock production are grass and grain. A lthough grasses grow w ell in m ost o f the D istrict states, there are on ly a few areas o f prairie w here nutritive grasses do not have to be p lanted and cared for. The Black B elt o f A labam a and M ississipp i is one o f the m ain exceptions. T hough there are, o f course, native grasses w hich w ill take over abandoned fields, few o f them are nutritious; and in pastures that are not seeded or given other care broom sage is lik ely to predom inate. In com parison w ith y ie ld s in other sections o f the U nited States, D istrict grain y ie ld s are low , w ith corn averaging on ly about 60 percent o f the nation ’s average production rate. The 1930-39 average y ield o f corn in G eorgia, for exam ple, was less than 10 bushels an
Digitized for FRASER http://fraser.stlouisfed.org/ Federal Reserve Bank of St. Louis

60 M o n t h l y R e v i e w o f the Federal Reserve B a n k o f A tlan ta fo r Ju n e 1948
acre, and the 1947 y ie ld w as o n ly 15 bushels, w hereas the U nited States figures w ere 23 .5 and 2 8 .6 bushels per acre. Low grain y ie ld s have discouraged m any farm ers from in creasing their livestock num bers. A lthough som e grain is needed in feed ing m ost classes o f livestock, it has been found that a m uch larger portion o f the total feed requirem ents o f beef and dairy cattle than w as prev iously thought p ossib le can be obtained from grazing crops. T he goal o f livestock researchers is a system that w ill furn ish year-round grazing from a m inim um num ber o f crops, preferab ly perennial or reseeding crops.
A dequate feed is o f param ount im portance, but the production o f livestock and livestock products to obtain m aximum net incom e involves a com bination o f m any factors, in clud ing breeding and m anagem ent. M oreover, the efficiency o f any one o f these factors is partly dependent on the efficiency o f the com bination in w hich they are a ll used. B y em phasizing one part o f h is livestock program w ithout g iv ing adequate attention to its effect on the w hole, a farm er m ay reduce the efficiency o f the entire operation by throw ing it out o f balance. T he unbalance m ay m inim ize the va lue o f feed crops and thus engender a pessim istic attitude toward them when, in reality , it m ay be other factors that are responsib le for h is less-than-expected returns.
T herefore it m ay be tim ely for farm ers to check on their pasture y ie ld s and on the num ber and quality o f the liv e stock being used to convert forage into cash receipts. A n im als lack ing the capacity to m ake efficient use o f grass and legum es m ay be uneconom ical, esp ec ia lly on h igh ly d eveloped pasturage.
T here are, o f course, m any reasons w hy attem pts to in crease livestock production in D istrict states have not m et w ith greater success. A lack o f experience, the sm all size o f the farm s, a h igh percentage o f tenancy, h igher acre incom e from cotton and tobacco, and an apathy toward the confining requisites o f livestock production are som e o f them . Each o f these lim itin g factors has been a serious handicap to m any farm ers. Perhaps the m ost basic and continuing problem has been that o f provid ing various classes o f liv e stock w ith feed and pasture, but for those farm ers w ho can adopt new system s o f forage crops the problem is becom ing m uch less acute.
Excessive Feed CostsW ith the production o f feed units apparently increasing at a faster rate than anim al units are, it w ould seem that the relative cost o f the feed purchased w ould decline, but that has not happened. Farm ers in D istrict states spent 30 percent o f their receipts from livestock and livestock products for purchased feed in 1929, 27 percent in 1939, and 39 percent in 1944. It m ay be that feed prices have increased faster than the prices o f livestock and livestock products or that there has been a qualitative increase in the type o f feed purchased, but it is surprising to find an increase in feed units being accom panied by an increasingly larger percentage o f livestock receipts spent for feed . D uring 1944 farm ers in four o f the D istrict states spent m ore than two out o f each five dollars they received from livestock for feed . T here are instances in w hich it is m ore profitable to buy feed than raise it, and m any D istrict farm ers w ill probably a lw ays purchase feed from one another and from farm ers in other areas. It is u n likely , how ever, that the region w ill perm a
nently expand its livestock num bers un til th is upw ard trend o f h igh cash costs o f feed is reversed.
In the D istrict states, com pared w ith established livestock- producing states, the am ount o f m oney spent for purchased feed per d ollar o f livestock receipts is relatively higher,. For exam ple, in 1929 when D istrict states spent about 30 percent o f their livestock receipts for feed , C olorado spent 12, W yom ing 11, W isconsin 9, and M innesota 6 percent. T en years later the D istrict states w ere spen d ing 27 percent o f their livestock receipts for feed w h ile C olorado w as spending 12, W yom ing 9, W isconsin 11, and M innesota 8. Even in two o f the N ew E ngland states, w here m ost o f the feedstuff must be im ported from the M idw est, the am ount o f m oney spent for feed during 1939 was o n ly 42 percent o f livestock receipts, in M assachusetts, and 37 percent, in Connecticut.
PERCENT OF LIVESTOCK RECEIPTS SPENT FOR FEED IN DISTRICT STATES, 1929, 1939, 1944
State 1929 1939 1944
G eorgia....................................................... 28 26 44Florida......................................................... 44 43 44
16 16 3031 27 39
M ississippi................................................. 48 29 40Louisiana..................................................... 48 40 54Six States A verage................................ 30 27 39
The large percentage o f their cash receipts that D istrict farm ers spent for feed m ay ind icate the livestock industry is in a precarious p osition . O rdinarily it is o n ly in the specia l areas where market conditions perm it, as they do in the fluid-m ilk regions o f the N ortheast, that farm ers can depend profitably on purchased hay and concentrates. It is doubtfu l if the Southeast is a specia l area in the sam e sense that New E ngland is.
Perhaps the efficiency o f the sm all num ber o f com m ercial livestock producers in the Southeast tends to be lost in the D istrict average figures, and even in the state averages. D oubtless m any o f the D istrict farm ers rival the M idwestern or M ountain-State stockm en in efficiency, but as a group they have not d isp layed the efficiencies in production w hich w ould enable them in tim es o f severe reg ion al com petition to h old on to their present gains.
Efficiency in Dollar TermsOn a m ajority o f the D istrict farm s, land is the m ost lim ited resource; and therefore a param ount need o f m ost D istrict farm ers is to increase their incom e per acre o f farm land. W here sm all- and m edium -sized farm s have been sh ifted to livestock operations, h igh production is necessary to m aintain incom es as h igh as those afforded by cotton and tobacco grow ing. Even w here no such sh ift has been m ade, the p ossib ilities o f obtain ing h igher farm incom e are greater when pastures and livestock both produce at h igh rates.
A s w ith p hysica l gains, an exact m easure o f the m oney returns from pastures is im p ossib le . T he subtraction o f known costs from incom e, how ever, g ives som e rough m easure o f the cash contribution they m ake.
In 1944 farm ers in D istrict states received 359 m illion d o llars from the sa le o f livestock and livestock products but spent 141 m illion do llars for feed . Even i f a ll o f the 218- m illion -d o llar d ifference cou ld have been im puted to pasture, it w ould have m eant a cash incom e o f o n ly $10 an acre. O bviously, th is cash-incom e figure does not represent the fu ll value o f livestock and livestock products produced on pastures and feed crops since about h a lf o f the m ilk and pork and about a third o f the eggs produced by D istrict
Digitized for FRASER http://fraser.stlouisfed.org/ Federal Reserve Bank of St. Louis

M o n t h l y R e v i e w o f the Federal Reserve B a n k o f A tlan ta fo r Ju n e 1948 61
farm ers are consum ed on the farm s where they are produced. But these figures do indicate that D istrict pastures are returning a low average rate o f cash incom e and, thus, further illustrate the need to increase the q uality o f pastures.
The cost o f estab lish ing an acre o f perm anent pasture ranges from $35 to $45, and annual m aintenance costs range from $6 to $8. I f the pasture did not need to be reestablished for five years, the yearly cost o f an acre o f im proved pasture w ould be about $15. Returns from the sale o f livestock and livestock products obtained w ith the use o f im proved pasture and grazing crops should at present prices range from about $30 an acre for beef to $75 for Grade “A ” m ilk . Som e farm ers find the in itia l cost o f establish ing pastures a real barrier, but over a period o f tim e the in vestm ent o f those who can surm ount it should be a profitab le one.
In 1947 the low m ilk production o f 3 ,284 pounds per cow m ay have been attributable to the low capacity o f the cow s as m uch as to the poor quality o f pastures and feed crops in D istrict states. W ith that y ie ld the sa le o f m ilk for Grade “B ” uses, at $3 .30 a hundred pounds, w ould total on ly $108 per cow per year and that for Grade “A ” purposes, at $5 .50 a hundred pounds, w ould total $180 . The high rate o f 8 ,043 pounds o f m ilk per cow obtained at the W est T ennessee station from roughage feed ing a lone w ould, at these prices, have returned $265 if it had been sold for Grade “B” use or $440 if so ld for Grade “A ” purposes.
Need for Increased Capacity of PasturesThere w ere availab le to each anim al unit in 1945 on ly 1.75 acres o f open pasture. This h igh ratio o f livestock to total pasture m ay be one o f the factors that are lim iting the production rates o f D istrict livestock. O nly pastures that have been greatly im proved can efficiently carry so heavy a rate o f grazing. Pasture, though, is a very general term that m eans little unless it refers to a specific pasture. Som e of them, particu larly abandoned fields w hich m ay have been fenced, w ill furnish very little grazing, but som e im proved pastures to w hich m inerals and the fu ll rate o f recom m ended seed have been applied w ill produce at a h igh rate— high enough at tim es to support m ore than one anim al to the acre.
H igh ly productive pastures u sually produce feed m ost e fficiently . It costs no m ore to fence a good pasture than it does to fence a poor one, and other overhead costs per unit o f feed decrease w ith greater production per acre. M oreover, an im proved pasture w ill provide needed m inerals and proteins that unim proved pastures w ill furnish on ly to a lim ited extent or not at a ll. D oubtless there are m any acres o f unim proved pasture on land on w hich it w ould be uneconom ical or unw ise in other respects to attempt the b u ild in g o f high-capacity pastures. Som e o f the lighter, sandy so ils in the D istrict fa ll in this category, but the capacity on fertile so ils that w ill respond to m inerals and seeding could be raised by fertilization , seeding, and good m anagem ent.
It m ay be that D istrict farm ers have not obtained the m axim um grazing from their pastures. The ideal pasture m anagem ent w ould be that w hich w ould make young grow ing grasses and legum es availab le to livestock. O vergrazing cuts down on the am ount o f feed an acre w ill produce, and undergrazing results in m ore fibrous plants o f low er feed ing value. M oreover, there should be a balance between feed from pasture and feed in the form o f concentrates, such as corn.
Good pasturage and grazing crops generally su p p ly the most econom ical feed up to a certain capacity, and the efficient livestock m anager uses concentrates to supplem ent grazing rather than the other w ay around.
Grains are necessary in the ration because the maximum am ount o f roughage an anim al can h old provides less feed units than a high-production anim al can utilize efficiently. M oreover, certain classes o f anim als, such as poultry and hogs, require m ost o f their feed in concentrate form . But even w ith these two groups the feed units supp lied from pasture are im portant in reducing costs. Farmers som etim es fa il to consider that young, grow ing pasture grasses and legum es have a h igh protein content and that supplem enting them w ith a concentrate or grain m ixture h igh in protein m ay not result in h igher y ield s, and therefore m ay be uneconom ical. T he A labam a and Tennessee experim ents c learly show that pastures and grazing crops can produce sufficient feed for h igh rates o f production o f som e classes o f livestock, even w ithout the addition o f concentrates.
SummaryD istrict farm ers are increasing their numbers o f livestock and the acreage planted to pasture and grazing crops, but few o f them have achieved m axim um efficiency in the production o f livestock and livestock products. It has been w idely dem onstrated that farm ers in the Southeast can achieve efficiency in the production o f feedstuffs. In recent years a system o f forage production that w ill y ie ld abundant grazing throughout the year has been v irtually attained, w ith som e grazing program s y ie ld in g a total production o f feed units that far surpasses that w hich can be obtained from annual hay and grain crops. But apparently the prevalent practice has been to add m ore poor-quality anim als to pastures that are producing at on ly a fraction o f their capacity. U nless farm ers in the D istrict states im prove their efficiency by increasing the production rates o f livestock and by in creasing the carrying capacity o f pastures and grazing crops, recent gains in livestock developm ent m ay be jeopardized. The econom ic security o f D istrict stock farm ers lies in the efficiency o f their operations rather than in an increase in the num ber o f anim als a lone. J ohn L. L iles
B a n k A n n o u n c e m e n t s
On June 1 the Farmers and Merchants Bank, Pied-
mont, Alabama, began remitting at par. This bank,
which was organized in 1915, has at present capital
stock amounting to $30 ,000 , surplus and undivided
profits to $40,484, and deposits of $1 ,026,670. C. W.
Thompson is president, J. S . Tole vice president, and
Miss Myrtle Fain cashier.
Digitized for FRASER http://fraser.stlouisfed.org/ Federal Reserve Bank of St. Louis

6 2 M o n t h l y R e v i e w o f the Federal R eserve B a n k o f A tlan ta fo r Ju n e 1948
G r o w t h a n d P r o s p e c t s o f B a n k R e a l E s t a t e L e n d i n g
a l t h o u g h difficulties in financing, rather than short- Z tL ages o f m aterials, m any observers believe, set the lim it to future residential construction in the Sixth D istrict, the reports o f S ixth D istrict mem ber banks as a group g ive no ind ication that their expansion in real-estate lend ing has stopped. By the first o f the year their aid in financing the recent residentia l-bu ild ing boom had raised their total real- estate loans 155 percent since the end o f 1945, w hen heavy postw ar construction got under w ay. Real-estate loans at the mem ber banks had grow n so m uch that, even though the banks’ total loans had increased 43 percent, their real-estate loans w ere alm ost tw ice as im portant in relation to their total loans as they had been two years earlier. M oreover, the w eekly reports o f m em ber banks in lead ing D istrict cities show no sign that the trend has reached its peak. D uring the first five m onths o f 1948 real-estate loans at those banks in creased 11 percent, whereas total loans declined 3 percent.
At the nonm em ber banks, reports o f the insured banks in the Sixth D istrict states indicate, the rate o f expansion in real-estate lend ing was not quite as great. Their real-estate loans increased 117 percent between the end o f 1945 and1948. Such loans o f a ll insured banks rose 166 percent in A labam a, 128 percent in F lorida, 125 percent in Georgia, 150 percent in L ouisiana, 107 percent in M ississip p i, and 136 percent in T ennessee.
The banks c la ssify their real-estate loans into three general types: loans on farm land, loans on residential real estate, and those on other nonfarm real estate. R esidential real-estate loans exceed the com bined totals o f the other two types, and their growth during the two-year period accounted for three fifths o f the 129-m illion -d ollar increase in S ixth D istrict mem ber-bank real-estate loans. On a percentage basis the increase in residential real-estate loans at the D istrict’s mem ber banks, 187 percent, was greater than that of the m em ber banks in any o f the other Federal Reserve d istricts.
T he unprecedented residential construction exp la in s the large dem and for such loans. A ccording to F. W . D odge C orporation figures, contracts awarded for that type o f construction in the S ixth D istrict rose from 62 m illio n dollars in 1945, to 331 m illion in 1946, and to 374 m illio n in 1947. In 1938 they had am ounted to on ly 81 m illion dollars. The D istrict’s 1947 contracts exceeded its 1945 contracts 504 percent, w hereas the increase for the Eastern states covered by the F. W . D odge figures was 459 percent.
H ow m uch o f the dem and for hom e financing in the D istrict was m et by total m ortgage credit or what part o f this total was m ade up o f mem ber-bank credit cannot be exactly determ ined. T rad itionally , how ever, banks have not been the ch ief source o f residential-construction financing. N ational data com piled by the Federal H om e Loan Bank A dm inistration show that in the two years o f 1946 and 1947 hom e loans on one-to-four-fam ily residences m ade by a ll types o f lend ing institutions increased m ore than 10 b illio n dollars. Com m ercial banks accounted for approxim ately 2 .8 b illio n dollars o f that am ount. T heir m ortgage loans increased at greater rates than those o f the other lend ing institutions did, but am ounted to o n ly 17.5 percent o f a ll the m ortgage
loans outstanding at the end o f 1947, com pared w ith 12.9 percent at the end o f 1945. Even i f none o f the increase resulted from loans m ade for the purchase o f o ld houses, real-estate loans at the D istrict’s m em ber banks cou ld have financed no m ore than 18 percent o f the total residential construction in the D istrict during that period and the loans o f both m em bers and nonm em bers no m ore than 20 percent.
O f m uch m ore im portance in the nation, and probab ly in the D istrict, are the loans m ade by savings-and-loan associations. In the U nited States those outstanding at the end o f 1947 on one-to-four-fam ily residences m ade up about 30 percent o f the total m ortgages o f that type. Insurance com panies and m utual savings banks h eld around 10 percent each, and ind ividual and other lenders about 30 percent.
T his d istrict’s m em ber banks have been consistently less active in real-estate lend ing than banks in other sections o f the country have. In 1928, the first year for w hich statistics were collected , m em ber banks in the D istrict had real-estate loans am ounting to o n ly 9 .7 percent o f their total loans, whereas the m em ber banks throughout the country had a proportion o f 12 .4 percent. T en years later the real-estate loans o f a ll U nited States m em ber banks m ade up 20 .5 percent o f their total loans, but those o f the Sixth D istrict m em ber banks accounted for o n ly 13 .4 percent o f their total. At the beginn ing o f the present loan expansion the D istrict ratio w as o n ly 8 .3 percent; the U nited States ratio was 15.2. D espite the strik ing expansion in D istrict m em ber-bank loans since 1945, the 1947 ratio o f real-estate loans to total loans is sign ificantly low er than the ratio o f 21 .9 for a ll mem ber banks. It is sm aller than that in a ll but tw o o f the other Federal R eserve districts.
Banks are lim ited in their real-estate lend ing by the statutes o f the governm ental unit under w hich they are chartered. T he am ount a N ational bank can lend on real estate, for exam ple, is lim ited to its total unim paired cap ital or 60 percent o f its tim e deposits, w hichever is greater. In most cases the latter is the larger. S im ilar lim itations are im posed on State banks. But in addition to lim itin g the total, at m any banks the am ount o f tim e deposits otherw ise influences real- estate lending. T hese deposits, com posed to a considerable degree o f savings deposits, are gen era lly regarded as providing better opportunities for bankers to m ake longer-term loans, such as real-estate loans, than dem and deposits provide,.
A lthough at the larger m em ber banks o f the D istrict tim e deposits constitute in general a greater proportion o f total deposits than they do at the sm all banks, real-estate loans m ake up a sm aller proportion o f total loans. T hey com pose 39 percent o f total loans at banks w ith deposits o f less than a m illion dollars and o n ly 7 percent at banks w ith deposits o f m ore than 100 m illion . One reason for the apparent anom aly is that the sm aller banks often require real-estate m ortgages as security even for com m ercial and industrial loans. There is, how ever, a general tendency for banks? o f the sam e size to have a greater proportion o f real-estate loans when their tim e deposits are h igh than they do when their tim e deposits form a sm all proportion o f their total deposits.
Bankers do not make decisions about the loans they grant, o f course, sim p ly by consu lting ratios or other m echanical
Digitized for FRASER http://fraser.stlouisfed.org/ Federal Reserve Bank of St. Louis

M o n t h l y R e v i e w o f the Federal R eserve B a n k o f A tlan ta fo r Ju n e 1948 6 3
guides. T hey base their decisions on the best alternative use of funds from the standpoint o f profitab ility and risk and a num ber o f other in tangib le factors. T he p ossib le future expansion in their real-estate lend ing cannot, therefore, be predicted m erely from a determ ination o f their lega l lim it. The lega l provisions o f the banking acts do, how ever, in add ition to setting a lim it upon lending, influence the attitude that bankers m ay take.
A t one out o f every 10 m em ber banks in the D istrict there was no possib ility o f real-estate-loan expansion at the beginn ing o f the year. In other w ords, it w as “ loaned up .” T he use o f the lim itations im posed by the N ational Banking A ct as the on ly criteria show s that about a fourth o f the banks had either exhausted their real-estate-lending capacity or used a ll but 25 percent o f it. On the other hand, m ore than h a lf had used up less than 50 percent o f their lega l m axim um . In general, the sm aller the bank w as, the greater the proportion o f its lend ing capacity that had been utilized . M oreover, conditions varied from state to state, even am ong banks o f sim ilar size.
SIXTH DISTRICT MEMBER BANKS WITH REAL ESTATE LOANS BELOW THE LEGAL MAXIMUM DECEMBER 31, 1947, BY AREA AND SIZE OF BANK
(Percentages)
Ratio of Real Estate Loans to Legal Maximum*
(Percent)
Area
Ala. Fla. Ga. La. Miss. Tenn. DistrictBelow 100........... 85 99 89 94 100 84 90Below 75............. 65 96 72 71 95 65 74Below 50............. 45 81 43 52 63 47 54Below 25............. 18 41 27 26 26 33 29
Ratio oi Real Estate Loans to Legal Maximum*
(Percent)
Size oi Bank (Total Deposits in Millions)
Below 1 1-10 10-100 More than 100Below 100..................... 70 89 94 100Below 75....................... 60 68 90 100Below 50....................... 20 46 74 93Below 25....................... 10 22 44 73
*Based on maximum allowed National banks. State banking law s regulating State member banks differ somewhat from state to state.
A pparently therefore it is not lega l sanctions that have kept the real-estate lend ing in m any banks dow n to m odest proportions. T he proportion o f real-estate loans to total loans at individual m em ber banks ranged from zero to m ore than 60 percent, but at h a lf the banks real-estate loans am ounted to less than 25 percent o f total loans. O nly 8 percent o f the banks had a real-estate-loan proportion o f m ore than 50 percent.
O pportunities to make other types o f loans, o f course, exp la in the relatively low rate o f real-estate-lending activity o f m any bankers, but other bankers have developed a conservative attitude partly because they distrust the perm anence o f present h igh real-estate values, particu larly those o f residences. So lon g as they have opportunities to em ploy funds profitably in other types o f lending, therefore, som e bankers prefer not to make real-estate loans. W hen they do m ake them , according to reports, they are insisting that ap praisa ls be considerably below the current se llin g price and that the potential buyer have a substantial cash equity in the hom e he is purchasing. Such attitudes as these seem m ore lik e ly to set a lim it to future real-estate lend ing by m ost o f the D istrict’s banks than does any exhaustion o f lend ing power.
C h a r l e s T . T a y l o r .
REAL ESTATE L O A N E X P A N S IO N
SIXTH DISTRICT MEMBER B A N K S
f. Real-estate-lending growth since the war's close has been caused chiefly by urban real-estate borrowing.
MILLIONS OF DOLLARS
1REPORTING MEM IN LEADING GITIE
BER BANKS IS , W EEKLY
/
S ' -
/ • ^ ^ R E A L - ELOA
1
Ui
___________________________________________________________________________________________________________________________________________yjz
_____________
-
J I L L 11 1 L IU , J J l i J . i l . l i l l .'38 '39 *40 '41 '42 '43 ’44 '45 '46 '47
110
100
90
80
70
60
50
40
30
20
10
0
2. Other types of loans as a group also expanded rapidly, but the proportion of real-estate loans increased.
1938 1939 1940 1941 1942 1943 1944 1945 1946 1947 1948
3. Although the rate of increase in member bank real- estate loans since 1945 has exceeded that in any other district, such loans constitute a smaller proportion of total loans than they do in all but two other districts.
RESERVE DISTRICT. PERCENT INCREASE 1945-47 PERCENT OF TOTAL
8 2 3883 L0ANS1947ATLANTADALLAS
SAN FRANCISCORICHMOND m m m mKANSAS CITYMINNEAPOLIS ■ ■ ■ ■ ■ ■ ■ST. LOUIS ■ ■ ■ ■ ■ ■ ■ m m mCLEVELAND ■ ■ ■ ■ ■ ■ ■CHICAGO ■ ■ ■ ■ ■ ■ ■ IPHILADELPHIA ■ ■ ■ ■ ■NEW YORK ■ ■ ■ ■ ■ ■ ■BOSTOMUNITED STATES
L I M M l 1 1 1 I M M ..J - L J ... f I J ....f
Digitized for FRASER http://fraser.stlouisfed.org/ Federal Reserve Bank of St. Louis

64 M o n t h l y R e v i e w o f the Federal R eserve B a n k o f A tla n ta fo r Ju n e 1948
D i s t r i c t B u s i n e s s
AgricultureFarm ers throughout the D istrict have fo llow ed w ith avid in terest the efforts o f C ongress to pass new farm leg isla tion to rep lace the existing statutes that exp ire at the end o f the year. T here have been few changes in farm leg isla tion since the beginn ing o f the war. For the past seven years the prices o f m ost D istrict crops have been supported at 9 0 percent o f parity. Cotton prices have been supported at 921/& percent.
Since the nation is no longer at war, how ever, the need for farm leg isla tion in clud ing price supports has changed. Im proving production techniques and m arket opportunities probably ca ll for a revaluation o f farm leg isla tion and a redefinition o f parity from tim e to tim e. In the upper H ouse, Senator A iken, o f V erm ont, sponsored a b ill to alter price- support features o f Federal farm program s and to reorganize action agencies in the D epartm ent o f A griculture. In the low er H ouse, R epresentative H ope, o f Kansas, introduced a b ill ca llin g for reorganization o f certain agencies o f the D epartm ent o f A griculture, but a lon g quite different lines. A lthough price supports w ere not included in the H ope b ill, it did not preclude them .
O f the m any differences betw een these two long-range b ills the greatest had reference to the level at w hich p o licy m aking and adm inistration w ould take p lace. The A iken B ill, am ong other things, provided for in itia tive and adm inistration by loca l com m ittees o f farm ers and p rofessional agricultural workers, w ith the farm ers outnum bering other representatives by at least one. On the other hand, the H ope B ill provided for the p lacin g o f in itiative and adm inistrative respon sib ility on the Secretary o f A griculture. N either o f these b ills passed. A new b ill ca llin g for a continuation o f present farm leg is la tion and price supports to June 30, 1950, except that the price support level for cotton w ould be reduced to 90 percent o f parity, was reported by the H ouse A gricultural Committee in p lace o f Mr. H ope’s proposa l.
T he agricultural b ill that w as passed in the c losin g hours o f the E ightieth Congress was a com prom ise between the H ouse and Senate proposals. T he new b ill continues price supports until January 1, 1950, w ith the fo llo w in g provisions to take effect January 1, 1949: (1 ) B asic com m odities, in c lud ing 1949 cotton, are to be supported at 90 percent o f parity; (2 ) H ogs, chickens, eggs, m ilk and its products, and1948 crop potatoes are to be supported at 90 percent o f parity. Other S tega ll and nonbasic com m odities supported
under the A ct o f Ju ly 1, 1941, w ill have a m inim um support o f 60 percent o f parity and a m axim um equal to the 1948 support levels.
Farm prices after January 1, 1950 , w ill be supported w ithin these rev isions: (1 ) basic com m odities— except to bacco— at 60-90 percent o f parity, depending on su pp ly— tobacco to be h eld at 90 percent o f p arity ; (2 ) nonbasic com m odities at leve ls from 0-90 percent o f parity, at the discretion o f the Secretary; (3 ) w oo l prices at 60 -90 percent o f parity u ntil production reaches 3 6 0 m illio n poun ds; (4 ) potatoes supported at 60-90 percent o f p arity ; (5 ) corn outside the com m ercial areas at 75 percent o f the support level in the com m ercial areas.
B eginn ing January 1, 1950, the m ethod o f com puting parity prices w ill a lso be revised. U nder the o ld m ethod the parity prices o f cotton, peanuts, and rice, fo r exam ple, w ere determ ined by m u ltip ly in g their 1910-14 average p rice by the current index o f prices paid for item s entering into fam ily liv in g expenses and farm -production costs. T he new form ula substitutes an adjusted base price for the 1910-14 average price. T his adjusted price o f the com m odity is the average p rice for the last 10 years d ivided by the average index o f prices received (1910-14 = 1 00 ) by farm ers for a ll crops and livestock during the sam e 10 years.
Two o f the D istrict’s im portant cash crops, tobacco and peanuts, are now at support levels, and therefore farm ers are p articu larly interested in those provisions o f the new b ill that w ill affect -the p rice leve ls at w hich these crops w ill be supported. A fter January 1, 1950, the prices o f tobacco w ill continue to be supported at 9 0 percent o f parity, but the support level on peanuts w ill drop to 75 percent o f parity i f the su p p ly is norm al. M oreover, the change in the m ethod o f ca lcu latin g parity w ill low er support prices on m ost o f the m ajor cash crops grow n by D istrict farm ers. T he declines in price-floor levels caused by the new m ethod o f com putation , how ever, w ill be cushioned by the provision that the decrease in parity prices sh a ll not exceed 5 percent in any one year.
In general, the effect o f low erin g support prices on peanuts and cotton m ore than those on corn and hogs w ill be to favor M idwestern farm ers over Southern farm ers, as show n in the table. One effect o f the new m ethod, how ever, m ay be to accelerate the sh ift that m any D istrict farm ers are m aking from the production o f cotton and tobacco to the production o f livestock and livestock products.
P A R I T Y A N D S U P P O R T P R I C E S F O R S E L E C T E D P R O D U C T S A S T H E Y A R E A T P R E S E N T A N D A S T H E Y W O U L D B E
U N D E R P R O V I S I O N S T O T A K E E F F E C T J A N U A R Y 1 9 5 0
C o m m o d i t y U n it
A v e r a g e P r ic e
R e c e i v e d b y F a r m e r s
M a y 15# 1 9 4 8
P arity P r ic e P r ic e F lo o r
U n d e r P r e s e n t
F o r m u l a
U n d e r N e w
F o r m u l a
U n d e r P r e s e n t
F o r m u l a
at 9 0 % o f P ar ity
U n d e r N e w
F o r m u l a
at 7 5 % o l P arity 1
A c t u a l
C h a n g e
P e r c e n t
C h a n g e
C o t t o n ................. lb . 3 5 .2 7 # 3 2 .4 5 # 2 2 7 .0 0 # * 2 9 .2 0 # * 2 0 .2 5 # * — 8 .9 5 # — 31
C o r n ---*............ b u . $ 2 .1 6 $ 1 .6 0 $ 1 .5 5 $ 1 .4 4 $ 1 .1 6 — $ 0 .2 8 — 19
P e a n u t s ............... lb . 1 0 .4 0 # 12.0 0 # 9 .4 6 # 1 0 .8 0 # 7 .1 0 # — 3 .7 0 # — 34
H o g s .................... c w t . $ 1 9 .6 0 $ 1 8 .2 0 $ 1 8 .5 0 $ 1 6 .3 8 $ 1 3 .8 8 — $ 2 .5 0 — 15
JOn a basis of 98-102 percent of normal supply. 2On a basis of 15/16 inch middling cotton.
Digitized for FRASER http://fraser.stlouisfed.org/ Federal Reserve Bank of St. Louis

M o n t h l y R e v i e w o f the Federal R eserve B a n k o f A tlan ta fo r Ju n e 1948 65
A gricu ltural price leg isla tion has benefited m ost D istrict farm ers in m any w ays. One o f the m ost im portant o f these benefits has been to reduce the uncertainty o f incom e because o f v io len t fluctuations in the price o f the com m odities they produce. P articu larly during the war years, p rice floors gave farm ers a great incentive to increase their production o f food crops. In return for guaranteeing that prices w ould not dec lin e below a reasonable level the nation w as rewarded by the greatest production o f food , feed , and fiber on record, at a tim e w hen they w ere m ost needed. A low ering o f support levels, beginn ing in 1950, w ill m erely return to the farm ers a part o f the price risk w hich the Governm ent shouldered during the w ar and has continued to bear.
Even though the new farm b ill continues price supports farm ers should not overlook the fact that their incom e w ill be large ly determ ined by their own industry and efficiency.
j . L . L.
S i x t h D i s t r i c t I n d e x e s
IndustryFavorable w eather conditions and a large volum e o f contract awards have com bined in recent m onths to accelerate b u ild ing and construction and to g ive prom ise o f continued activity. D uring the first quarter o f the year the total va lu e o f construction contracts awarded in th is d istrict, according to the F. W . D odge C orporation figures, w as 37 percent greater than it w as in the corresponding period a year ago . A n un usually large volum e for A p ril brought the total fo r the first four m onths up to 334 m illio n dollars, w hich represents an in crease o f 52 percent over the total for that part o f 1947. The A p ril total this year w as 95 percent greater than that last year. T here have not been m any m onths, even during the war years, w hen so large a vo lum e o f contracts w as let. R esidentia l contracts in A p ril w ere up 52 percent from residential contracts in M arch and 56 percent from those in A p ril 1947. Other awards were 77 percent greater than those in M arch
DEPARTMENT STORE SALES*
PlaceAdjusted** Unadjusted
May1948
Apr.1948
May1947
May1948
Apr.1948
May1947
DISTRICT 394 390 367 375 366 348437 455 405 415 394 385
Baton R ouge .. 428 407 390 424 391 386Birmingham.. 420 374 364 399 341 346C hattanooga... 363 350 375 363 338 375Jackson............. 347 374 328 326 358 308Jacksonville... 457 437 425 434 411 404Knoxville.......... 422 450 370 401 416 351
319 284 329 310 276 319Miami............... 382 352 350 336 359 308M ontgom ery... 384 375 367 361 346 345Nashville------- 502 396 470 492 395 461New O rleans.. 355 3§6 323 334 363 303
467 478 428 467 485 428
DEPARTMENT STORE STOCKS
PlaceAdjusted** Unadjusted
May1948
Apr.1948
May1947
May1948 1$48
May1947
DISTRICT............. 368 379 280 357 376 283Atlanta......... 449 451 393 457 480 360Birmingham— 278 305 225 285 316 211M ontgom ery... 404 352 334 410 380 304Nashville......... 537 531 445 545 589 415New O rlean s... 340 335 294 350 357 276
GASOLINE TAX COLLECTIONS***
PlaceAdjusted** Unadjusted
May1948
Apr.1948
May1947
May1948
Apr.1948
May1947
SIX STATES....... 188 182 166 189 187 168Alabama___ 195 192 171 199 195 174Florida............. 188 195 169 190 209 171G eorgia............. 181 WJ 162 181 176 162Louisiana......... 179 167 152 176 164 149Mississippi....... 192 171 164 188 175 160Tennessee........ 204 191 186 204 193 186
COTTON CONSUMPTION* ELECTRIC POWER PRODUCTION*
Place May1948 & May
1947Apr.1948
Mar.1948
Apr.1947
TOTAL ,, , 145 154 161 SIX STATES.. 344 341 303A labam a.. 152 165 191 HydroGeorgia. 146 152 152 generated 324 3$2 296Mississippi 97 104 101 Fuel-Tennessee. 120 132 121 generated 371 353 312
MANUFACTURING CONSTRUCTION CONTRACTSEMPLOYMENT*** Apr. Mar. Apr.
Apr.1948
Mar.1948
Place 1948 1948 1947Place Apr.
1947 DISTRICT.. . . 598 360r 307Residential 731 482r 469
SIX STATES. |144 146r 143 O ther......... 534 301r 228Alabama. 155 160 154 A labam a... 854 282 466Florida___ 122 125 120 Florida___ 780 365 427G eo rg ia ... 133 135 134 G eorg ia ... 654 410 309Louisiana.. 140 138 136 Louisiana.. 330 488 76Mississippi 149 153r 154 Mississippi 191 193 172Tennessee. 155 156 154 Tennessee. 432 497 256
CONSUMERS' PRICE INDEX
Item May1948
Apr.1948
May1947
ALL ITEMS.. 174 173 162Food.......... 215 214 197C lothing... Fuel., elec.;
and ic e . ..
201 201 181
134 133 122Home fur
nishings. . 192 196 174Misc........... 148 148 144Purchasing
power of dollar___ .57 .58 .62
*Daily average basis • ‘Adjusted for seasonal variation
***1939 monthly average «= 100; other indexes, 1935-39 — 100
ANNUAL RATE OF TURNOVER OF DEMAND DEPOSITS
U nadjusted .. Adjusted**.. Index**.........
May194818.720.181.5
Apr.194819.2 19.579.2
May194717.318.671.9
CRUDE PETROLEUM PRODUCTION IN COASTAL LOUISIANA
AND MISSISSIPPI*
Unadjusted. Adjusted**.,
May1948285289
Apr.1948283278
May1947253257
r Revised
Digitized for FRASER http://fraser.stlouisfed.org/ Federal Reserve Bank of St. Louis

66 Monthly Review o f the Federal R eserve B a n k o f A tlan ta fo r Ju n e 1948
S i x t h D i s t r i c t S t a t i s t i c s
CONDITION OF 28 MEMBER BANES IN SELECTED CITIES (In Thousands ol Dollars)
Item
Loans and investments—Total....................................
Loans—total..........................Commercial, industrial,
and agricultural loans. Loans to brokers and
dealers in secu rities ... Other loans for pur
chasing and carryingsecurities.........................
Heal estate lo a n s . ..............Loans to banks...................Other loans.........................
Investments—total...............U. S. direct obligations.. Obligations guaranteed
by U. S............................Other securities.................
Reserve with F. R. B ank .. . .Cash in vau lt.........................Balances with domestic
banks..................................Demand deposits ad justed .Time deposits.......................U. S. Gov't deposits...........Deposits of domestic banks Borrowings............................
June 16 1948
2,296,863811,650
497,002
6,216
58,97073,2045,639
170,6191,485,213
433,756
864,751186,706434,60240,514
214,6391,784,063
541,14033,147
451,467
May 19 1948
2,300,577829,636
512,660
6,439
58,14575,4275,964
171,0011,470,941
379,147
905,089186,705421,93741,529
203,8901,761,367
544,56742,525
445,224
June 18 1947
2,312,129705,854
404,506
7,718
81,79855,3424,425
152,0651,606,275
413,002
1,005,828187,445425,89839,880
194,7211,759,055
546,14115,606
479,0617,000
Percent Change June 16, 1948, IromMay 19
1948
± i— 5— 0 ■f 1 + 14— 4+ 0± i
± 0— 22 + 1
June 18 1947
— 0+ 15
+ 23
— 19
— 28 + 32 + 27
i *8■f 5
f+
10 1 0
+ 112 — 6
DEBITS TO INDIVIDUAL BANK ACCOUNTS (In Thousands ol Dollars)
PlaceNo. ol Banks
Reporting
May1948
Percent Change May 1948 Irom
1948Way1947
ffillMay1947
ALABAMA19,824Anniston........... 3 20,394 19,904 >+ 2 + 3
Birmingham---- 6 307,473 303,512 278,657 1+ 1 + }2Dothan............. 2 11,321 11,090 9,769 ,+ 2 + 16G adsden........... 3 17,530 17,785 17,557 ,— 1 — 0Mobile............... 5 137,158 139,550 126,476 — 2 + 8M ontgom ery... 3 71,366 67,639 65,010 + 6 + 10
FLORIDA253,407 232,211 0Jacksonville.. . . 3 253,305 —■ + ,2
Miami............... 7 233,333 252,454 198,508 —. 8 + 18G reater Miami* 12 322,606 356,246 281,993 i— 9 ,-h 14O rlando........... 3 52,184 54,833 43,459 — 5 + 20Pensacola......... 3 31,422 30,745 31,585 + 2 — 1St. Petersburg. 3 53,389 57,992 48,840 — 8 + 9Tampa............... 3 100,994 108,397 98,746 — 7 + 2
GEORGIA 17,086 13,637 + \ lAlbany............. 2 16,270 — 5Atlanta............. 4 803,176 786,828 729,671 + 2 rf 10A ugusta........... 3 51,233 57,534 49,268 11 ,+ 4Brunswick........ 2 9,437 8,647 8/529 + 9 + uColum bus........ 4 53,285 54,972 57,302 — 3 — 7Elberton........... 2 3,984 3,872 3,821 »+ 3 + 4Gainesville*. . . 3 14,209 14,002 12,662 + 1 t l lGriffin*............. 2 11,258 10,800 10,393 + 4 t 8Macon............... 3 57,305 62,440 56,396 '— 8 4* 2New nan........... 2 8,038 8,205 6,658 — 2 -j- 21Rome*............... 3 21,020 21,222 18,438 — 1 r f 14Savannah......... 4 96,115 86,418 80,454 + 11 + 19Valdosta........... 2 11,510 9,902 10,178 + 16 + 13
LOUISIANA+ 22Baton R ouge.. 3 90,706 88,517 74,528 + 2
Lake C harles.. 3 33,294 32,701 24,045 + 2 + 38New O rlean s .. 7 614,634 615,676 535,873 0 ■f 15
MISSISSIPPI14,776 15,730H attiesburg___ 2 15,085 + 2 — 4
Jackson............. 4 123,419 118,714 101,224 + 4 + 22Meridian........... 3 26,289 29,974 23,770 12 .+ 11V icksburg........ 2 22,766 23,593 20,727 — 4 + 10
TENNESSEE121,819Chattanooga. . . 4 135,555 135,725 — 0 + 11
Knoxville......... 4 109,241 107,981 101,042 .+ 1 + 8Nashville......... 6 277,729 280,979 249,017 — 1 f 12
SIXTH DISTRICT32 Cities......... 110 3,848,940 3,861,848 3,454,331 — 0 f 11
UNITED STATES333 C ities........ 97,593,000 102,354,000 87,840,000 — 5 + 11
Not included in Sixth District total
and two and a third tim es as large as those in A pril last year. For the first four m onths th is year residentia l awards were 43 percent greater than they w ere in that period last year and other contracts 59 percent greater.
Contract awards in A p ril w ere larger than they w ere in A pril last year in a ll s ix states o f the D istrict, but the gains over the M arch figures and the m ajor part o f those over the A pril 1947 figures were in A labam a, F lorida, and G eorgia. A n award o f 13 m illio n d o llars for a m anufacturing plant helped raise the A p ril aw ards in A labam a to 24 .5 m illion dollars. In F lorid a the total for A p ril o f 4 9 m illio n dollars was m ore than double that for M arch. T he G eorgia total in A pril, 2 4 m illion d ollars, represents a substantial increase over that for any other recent m onth.
Im proved logg in g conditions have resulted in increased production and, therefore, greater consum ption o f lum ber. There seem s to be no lack o f dem and for the better grades o f lum ber; reports are that dealers are m ore cautious and selective in their buying.
T extile activity, as it is m easured by the d a ily average rate o f consum ption o f cotton, declined in the D istrict during M'ay. Cotton m ills in the four S ixth D istrict states for w hich figures are availab le used 6 percent less cotton thaii they did in A pril and 10 percent less than they did in M ay o f last y e a r ; the consum ption rate for the country was 3 percent below that in M ay 1947. From January to M ay th is year the consum ption o f cotton in the D istrict declined 13 percent and during that period last year 9 percent.
D uring recent m onths em ploym ent in the construction in dustry has been increasing in a ll areas o f the D istrict and w ill, it is expected, continue to do so because o f the large volum e o f work already in progress and that under contract. In other lines there have been reports o f varying trends. Em ploym ent increased in the D istrict’s m anufacturing industries between Ju ly last year and February but declined slig h tly in February, M arch, and A p ril. A lthough factory em ploym ent increased s lig h tly in L ouisiana during A p ril, decreases occurred, it was reported, in the other five states.
The D istrict index for A p ril th is year is o n ly sligh tly higher than that for A p ril 1947; the indexes fo r A labam a, Florida, L ouisiana, and T ennessee show ed sligh t increases, and the indexes for G eorgia and M ississip p i decreases. In Georgia there was a decline in m anufacturing em ploym ent during A pril o f 1.9 percent below the M arch figure, w ith the principal decreases reported in the food and food-products group and the fin ished-textile-products group. T he increases o f 11.6 percent in prin ting and p ub lish in g , 14.1 percent in paper and paper products, and 7 .4 percent in w earing apparel over A pril 1947 em ploym ent in those fie ld s partly offset decreases in som e other groups. In L ouisiana em ploym ent in creases in nondurable-goods industries m ore than offset decreases in the durable-goods industries. T he princip al gains occurred in the corrugated-carton, fiber-container, and paper- and-pulp d iv ision s o f the paper industry and in the sugar and canning d ivision s o f the food industry. T he m ajor declines were in the transportation-equipm ent industry, for the most part in the sh ip b u ild in g d iv ision , and the lum ber and timber- products industry. In F lorida, A p ril em ploym ent in lum ber and lum ber products show ed an increase o f 2 .9 percent over M arch em ploym ent and was 13 .4 percent greater than a year ago. There w as an increase o f 3 .9 percent over the M arch total in the paper and paper-products industry, but there was a decline o f 23 .9 percent in the canning line, and a con-
Digitized for FRASER http://fraser.stlouisfed.org/ Federal Reserve Bank of St. Louis
M o n t h l y R e v i e w o f t h e F e d e r a l R e s e r v e B a n k o f A t l a n t a f o r J u n e 1 9 4 8 6 7
siderable reduction in shipyard employment. Shipyard layoffs, owing to the expiration of contracts, were also reported in the Mobile area.
Weekly production figures in the statements issued by the United States Bureau of Mines show that coal output in Alabama and Tennessee averaged a little more in May than it did in either February or January. It was greater, by less than one percent, however, in May this year than it was in corresponding weeks a year earlier; a gain in Tennessee more than offset a slight decrease in Alabama.
Steel-mill operations in the Birmingham-Gadsden area have in recent weeks been reported at the level that prevailed during the first two and a half months of the year. At the time of the coal strike the rate of activity declined from 102 percent of capacity for the week of March 16 to 41 percent for the week of April 13, but with the ending of the strike steel-mill operations began the climb back to 102 percent, which they reached the week of May 18 and have maintained since that time.
May was the first month this year in which more cars of revenue freight were loaded by the Association of American Railroads9 Southern district lines than were loaded in the corresponding period last year. The weekly statements of the association indicate that lines in the South loaded an average of 3 percent more cars in May this year. The average for the month was up 8 percent from that for April.
d . E . M .
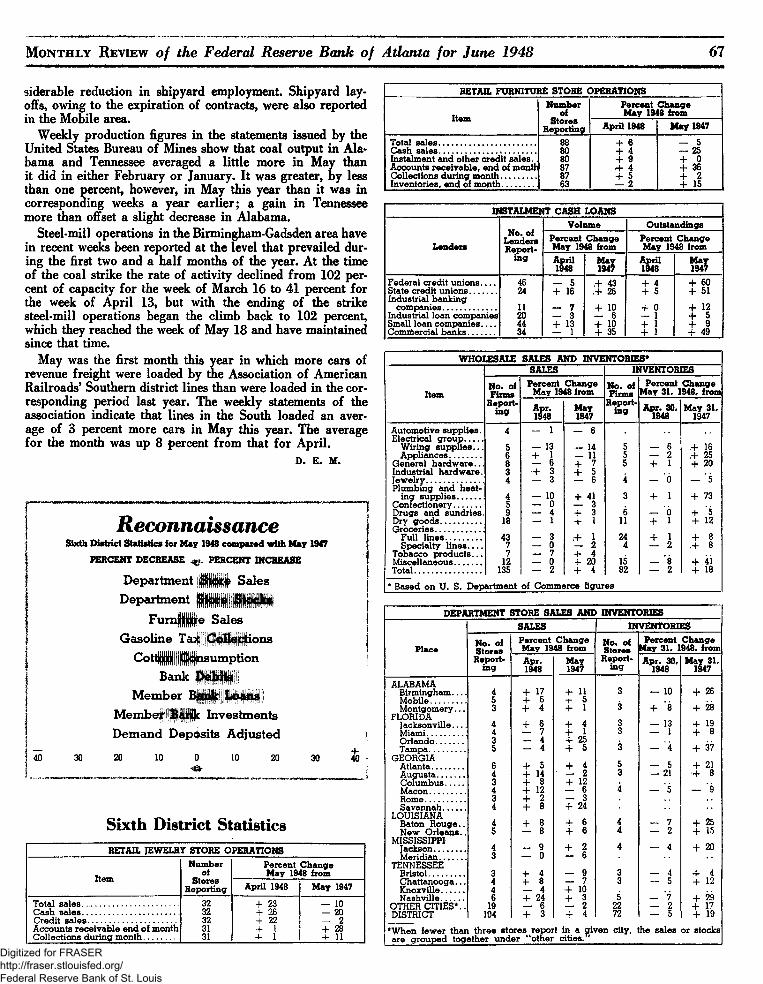
R e c o n n a i s s a n c eSixth D istrict S ta tis tics lo r M ay 1948 com pared w ith M ay 1947
PERCENT DECREASE ^ PERCENT INCREASE
Department j | i i | Sales Department I H I I i i i
F u m i ie Sales Gasoline T a f l i l i i o n s
Bank M i l Member B | j | | | | | | | | | |
M embejimHc Investments Demand Deposits Adjusted
4 0 3 0 2 0 10 0 10 2 0 3 0 4 ( H
S ix th D is tr ic t S ta tis tic sRETAIL JEWELRY STORE OPERATIONS
N um ber P ercen t C h an g eItem
of M a y 1948 fromS tores
R e p o r t in g A pril 1948 M ay 1947
T o ta l s a l e s . ..................................................... 3 2 4- 2 3 — 10C a s h s a l e s ........................................................ 3 2 - f 2 6 — 2 0C r e d it s a l e s ................................................... 3 2 4- 2 2 — 2A c c o u n ts r e c e iv a b l e e n d o f m o n th 31 4- 1 4- 2 8C o lle c t io n s d u r i n g m o n t h ..................... 31 4- 1 4- 11
RETAIL FURNITURE STORE OPERATIONSN um ber P ercen t C hange
Item of M ay 1948 fromS to res
R eporting April 1948 M ay 1947
T o ta l s a l e s ........................................................ 8 8 + 6 — 5C a s h s a l e s ................................. ...................... 8 0 + 4 — 2 5In s ta lm e n t a n d o th e r c r e d i t s a l e s . . 8 0 4- 9 4* 0A c c o u n ts r e c e iv a b l e , e n d o f m o n th 8 7 + 4 4* 3 6C o lle c tio n s d u r in g m o n t h .................... 8 7 4- 5 4- 2I n v e n to r ie s , e n d o f m o n t h .......... 6 3 — 2 4- 15
INSTALMENT CASH LOANS
No. of L enders
V olum e O uts tand ingsP ercen t C hange P ercen t C hange
L enders R eportin g
M ay 1948 from M ay 1948 fromApril1948
M ay1947
April1948
M ay1947
F e d e r a l c r e d i t u n i o n s . . . . 4 6 - 5 ,4- 43 4- 4 4- 60S ta te c r e d i t u n i o n s ................In d u s tr ia l b a n k i n g
2 4 4- 16 ,4- 2 6 4- 5 + 5 1
c o m p a n ie s ............................... 11 7 4- 10 4- 0 4* 12I n d u s tr ia l lo a n c o m p a n ie s 20 — 3 — 6 — 1
+ • 5S m all lo a n c o m p a n ie s ___ 44 4- 13 4- 10 4- 1 4- 9C o m m e rc ia l b a n k s ................ 34 — 1 4- 3 5 4- 1 4* 4 9
WHOLESALE SALES AND INVENTORIES*
Item
SALES INVENTORIES
No. of Firm s
R eportin g
P ercen t C hange M ay 1948 from No. of
F irm sR eport
in g
P ercen t C h an g e M ay 31, 1948, from
A pr.1948
M ay1947
A pr. 30, 1948
M ay 31, 1947
A u to m o tiv e s u p p l i e s . 4 — 1 — 6E le c tric a l g r o u p . . . . .
W ir in g s u p p l i e s . . . 5 — 13 — 14 5 — 6 ,+ 16A p p lia n c e s .................. 6 + 1 — 11 5 — 2 r f 2 5
G e n e r a l h a r d w a r e . . . 8 — 6 4- 7 5 4- 1 4- 2 0I n d u s tr ia l h a r d w a r e . 3 H- 3 + 5J e w e lr y ................................. 4 — 3 — 6 4 — 'o — ' 5P lu m b in g a n d h e a t
in g s u p p l i e s ...............C o n f e c tio n e r y ................
45
— 10 — 0 ± 1
3 4- 1 4- 73
D r u g s a n d s u n d r i e s . 9 — 4 4- 3 6 — o 4- 5D ry g o o d s ....................... 18 — 1 4- 1 11 4- 1 4- 12G r o c e r ie s ............................
F u ll l i n e s ..................... 4 3 — 3 + A 2 4 + 1 4- 8S p e c ia lty l i n e s . . . . 7 — 0 — 2 4 — 2 .4” 8
T o b a c c o p r o d u c t s . . . 7 — 7 4- 4M is c e lla n e o u s ................ 12 — 0 4- 20 15 — 8 + 4 i
1 35 — 2 4- 4 82 — 2 4- 18
* B a s e d o n U . S . D e p a r tm e n t o f C o m m e rc e f ig u r e s
DEPARTMENT STORE SALES AND INVENTORIESSALES INVENTORIES
PlaceNo. of S to res
P ercen t C hange M ay 1948 from No. of
S toresP ercen t C hange
May 31, 1948, fromR eport
in gA pr.1948
M ay1947
R eportin g Apr. 30,
1948M ay 31,
1947
ALABAMA
+ l l 10 4- 2 6B irm in g h a m ----- 4 + l l 3 —M o b ile ............. 5 4- 6 4- 5
*8 4- 2 8M o n tg o m e r y . . . 3 4- 4 4* 1 3 +FLO R ID A
4- 6 13 + ^J a c k s o n v il le -----M ia m i.......................
4 4- 4 3 —
4 *— 7 + 1 3 — 1 4- 8O r l a n d o ................ 3 — 4 4- 2 5
4- 3 75 — 4 4- 5 3 — *4
G E O R G IA
+ 2 iA tla n ta .................. 6 4- 5 + 4 5 — 5A u g u s t a ................C o lu m b u s ...........
4 4- 14 — 2 3 — 21 4- 83 + 8 + *2
M a c o n ..................... 4+ l i — 6 4 — 5 — 9
3 + 2 — 3S a v a n n a h ............. 4 4- 8 4- 2 4
L O U ISIA N A
+ §4- 6 4* 2 5B a to n R o u g e .. 4 4 — 7
N e w O rle a n s .. 5 — 8 4- 6 4 — 2 -j- 15M IS S IS S IP P I
4- 2 0J a c k s o n .................. 4 — 9+ 1
4 — 4
M e r id i a n ............... 3 — 0 — 6
TE N N ESSEEB r is to l ..................... 3 4- 4 — 9 3 — 4 4* 4C h a t t a n o o g a . . . 4 4- 8 — 7 3 — 5 4- 12K n o x v ille ............. 4 — 4 4- 10N a s h v il l e ............. 6 4- 2 4 4- 3 5 — 7 4- 2 9
O TH ER C I T I E S * .. 19 — 6 — 2 2 2 — 2 4- 17D IST R IC T 10 4 4- 3 4 - 4 7 2 — 5 4- 19
* W h e n f e w e r th a n th r e e s to r e s r e p o r t in a g iv e n c i ty , t h e s a le s a r e g r o u p e d t o g e t h e r u n d e r “ o th e r c i t i e s ."
o r s to c k s
Digitized for FRASER http://fraser.stlouisfed.org/ Federal Reserve Bank of St. Louis

6 8 M o n t h l y R e v i e w o f t h e F e d e r a l R e s e r v e B a n k o f A t l a n t a f o r J u n e 1 9 4 8
National Business Conditions
In d u s t r i a l output and department-store sales increased in May and were maintained at advanced levels in the early
part of June. The general level of wholesale commodity prices rose further in June, reflecting chiefly sharp increases in livestock. Substantial advances were announced in prices of automobiles and some other industrial products.
Industrial ProductionThe Board’s seasonally adjusted index of industrial production advanced four points in May to a level of 192 percent of the 1935-39 average, which was close to the record peacetime rate prevailing in the first quarter before output was curtailed by work stoppages at coal mines.
Production of durable goods in May was above the April rate but below first quarter levels. Production of iron and steel increased sharply as coal supplies were restored. Output of nonferrous metals and of stone, clay, and glass products was maintained at the high rate of recent months. Production of most other durable goods, however, declined further in May. Activity in the automobile industry was substantially curtailed as a result of steel shortages and a labor dispute at plants of a major producer, and the number of cars and trucks finished in May was about one fifth below the first quarter average.
Output in most nondurable goods industries in May was maintained at the April level or advanced somewhat. Petro- leum-refinery operations increased further; output of gasoline and fuel oil was 16 percent larger than in May of last year. Coke production recovered from the curtailment in April resulting from reduced coal supplies. Meat production showed a slight gain in May, reflecting settlement of a labor dispute at major packing establishments on May 21. Activity at cotton-textile and paperboard mills and at printing establishments was maintained at the April rate.
Minerals output rose to a new high level in May, owing mainly to a sharp increase in bituminous coal output and to a further rise in crude-petroleum production to a new record level. Production of iron ore was maintained in exceptionally large volume.
ConstrucfionValue of construction contracts awarded in May, as reported by the F. W. Dodge Corporation, increased further to a new postwar peak more than 10 percent above April and slightly above the previous high in May 1946. The increase reflected mainly large gains in awards for public works and for educational and hospital buildings. Value of awards for commercial structures increased further in May to the highest level in more than two years. Private residential awards also continued to increase. The number of new dwelling units started, according to the Bureau of Labor Statistics, was97,000 as compared with 90,000 in April and 73,000 in May 1947.
DistributionValue of department-store sales rose to a new high in May, after allowance for seasonal changes. The Board’s adjusted index for the month is estimated to be 308 percent of the1935-39 average as compared with 304 in April and an aver
age of 284 for the first quarter. Sales in the first half of June continued near this advanced level.
Loadings of railroad revenue freight in May and the first half of June were in substantially larger volume than in the preceding two months, mainly because of a sharp rise in coal shipments. Grain shipments showed a marked further gain during this period, reflecting chiefly an unusually early movement of the new wheat crop. Total freight carloadings in May and early June were at about die same level as during this period a year ago.
Commodity PricesThe general level of wholesale commodity prices advanced further in June to about the peak reached in January. The rise reflected chiefly sharp increases in livestock prices following settlement of the meat packing strike. Prices of most other farm products and foods showed little change.
Prices of industrial materials continued to show mixed changes in June with further declines reported for cotton goods and some other items and marked increases in secondary aluminum, tin, and wool. Prices of automobiles and various other manufactured products were raised.
The consumers’ price index increased .7 percent in May, reflecting mainly further advances in retail prices of meat. Retail prices of most other groups of items showed little change or increased slightly.
Bank CreditSubstantial Treasury cash payments in excess of receipts during late May and the first half of June reduced Treasury balances at Reserve Banks by about 600 million dollars and increased the reserves of commercial banks. A large gold inflow also supplied banks with reserve funds, offset in part by a currency outflow over the Memorial Day holiday.
Effective June 11, the Board of Governors increased reserve requirements against net demand deposits at central reserve city banks from 22 to 24 percent. These banks sold Government securities to the Reserve Banks as needed to meet the resulting increase of about 500 million dollars in their required reserves. An increase in Treasury deposits resulting from tax payments after the middle of June exercised a drain on bank reserves and caused additional sales of Government securities to the Federal Reserve.
Real-estate and consumer loans continued to increase at banks in leading cities during May and the first two weeks of June. Commercial loans were maintained at about the volume outstanding in the last half of April.
Security MarketsCommon stock prices advanced somewhat further from the middle of May to the third week of June, and trading remained relatively active.
The Treasury announced on June 10 increases in purchase limits for F and G bonds bought by savings institutions during the period July 1-15. Prices of marketable Government bonds, which had risen during May, declined in June.
T h e B o a r d o f G o v e r n o r s
Digitized for FRASER http://fraser.stlouisfed.org/ Federal Reserve Bank of St. Louis