mnship twin cities mobility folio
TRANSCRIPT
M N S H I P 2 0 1 8 - 2 0 3 7 P A G E 1 N O V E M B E R 2 0 1 5
Twin Cities MobilityA C R I T I C A L C O N N E C T I O N S I N V E S T M E N T
20-Year State Highway Investment Plan
Twin Cities Mobility is one of the 14 investment categories of MnSHIP, a fiscally constrained plan MnDOT uses to balance the needs and risks of Minnesota’s state highway network. Folios for each investment category describe potential levels of investment and associated outcomes. Through MnSHIP, MnDOT will create an investment direction that guides state highway capital investments for the next 20 years.
INVESTMENT CATEGORY DETAILS
What is Twin Cities Mobility?Through investments in Twin Cities Mobility, MnDOT aims to increase mobility in the metro area, increase trip reliability, and enhance travel options.
Why is Twin Cities Mobility important?Roughly half of all roadway travel in Minnesota occurs within the Twin Cities metropolitan area. Travel reliability is important to the entire state of Minnesota as it impacts the movement of people and goods with implications on quality of life, safety conditions, air quality, regional connectivity, and economic competitiveness. Not only is congestion costly to people, freight, and transit traveling on MnDOT roads, the same effects can spill over to local and county roads, leading to reduced fuel-efficiency and air quality, and slower travel times for all users. Some level of congestion is an accepted reality in the Twin Cities area, but effectively managing congestion while providing travel options can provide many benefits to those living in and traveling through the region and state.
How does investing in Twin Cities Mobility support the MN GO vision and the State Multimodal Transportation Policy?Investing in Twin Cities Mobility supports the guiding principles laid out in the 50-year vision for the state’s transportation system, Minnesota GO. These include:
• Emphasizing reliable and predictable options; • Ensuring regional connections; and • Leveraging public investments to achieve multiple purposes.
Building upon these principles, investment in Twin Cities Mobility strengthens multiple strategies identified in the Statewide Multimodal Transportation Plan (SMTP), notably:
• Apply multimodal solutions that ensure a high return-on-investment, given constrained resources, and that complement the unique social, natural and economic features of Minnesota;
• Collaborate with partners to provide greater accessibility and more efficient movement of goods and people throughout the Twin Cities metropolitan area; and
• Work together to support and implement both system-wide and project-specific approaches to avoid, minimize, and mitigate adverse impacts to Minnesota’s natural and cultural resources.
How has the planning context for Twin Cities Mobility changed since 2013 MnSHIP?Updates to the Metropolitan Council’s 2040 Transportation Policy Plan (TPP) (www.metrocouncil.org/Transportation/Planning-2.aspx) impacts the context in which MnSHIP addresses Twin Cities Mobility. MnDOT coordinates with the Metropolitan Council and Metro Transit on how to best align Twin Cities Mobility with the objectives in the TPP. In addition to the updated TPP, travel trends among Twin Cities transportation users is continuing to evolve. For instance, while the daily vehicle miles traveled is estimated to increase over the next 20 years, the number of miles traveled per resident is expected to decrease. This means that less people are choosing to drive. Increases in transit ridership reflects this outcome. Behavior changes like this have implications for investments in bus-only shoulders and MnPASS express lanes, which provide transit advantages.
How does MnDOT measure performance in Twin Cities Mobility?MnDOT indicators used to track Twin Cities congestion include the percent of urban freeway miles that are flowing below 45 miles per hour during weekday peak periods (5 to 10 a.m.; 2 to 7 p.m.).
The Federal Highway Administration will soon require MnDOT to develop different mobility measures as part of the new
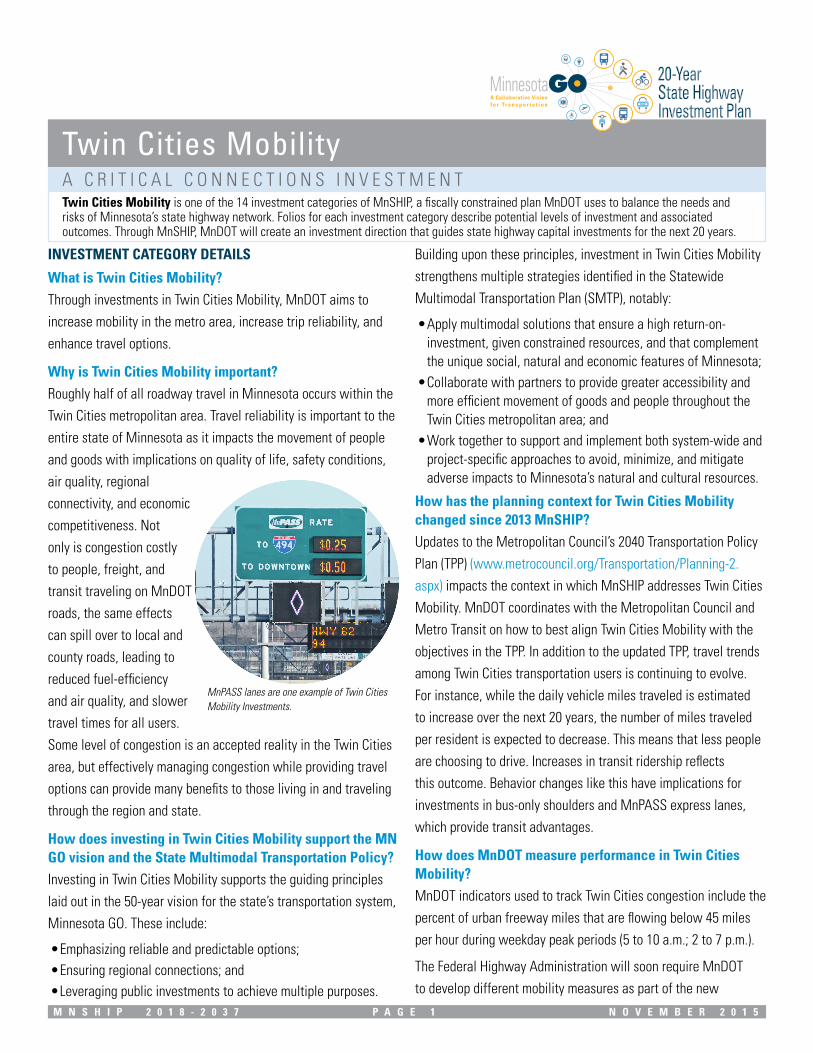
MnPASS lanes are one example of Twin Cities Mobility Investments.
M N S H I P 2 0 1 8 - 2 0 3 7 P A G E 2 N O V E M B E R 2 0 1 5 M N S H I P 2 0 1 8 - 2 0 3 7 P A G E 3 N O V E M B E R 2 0 1 5
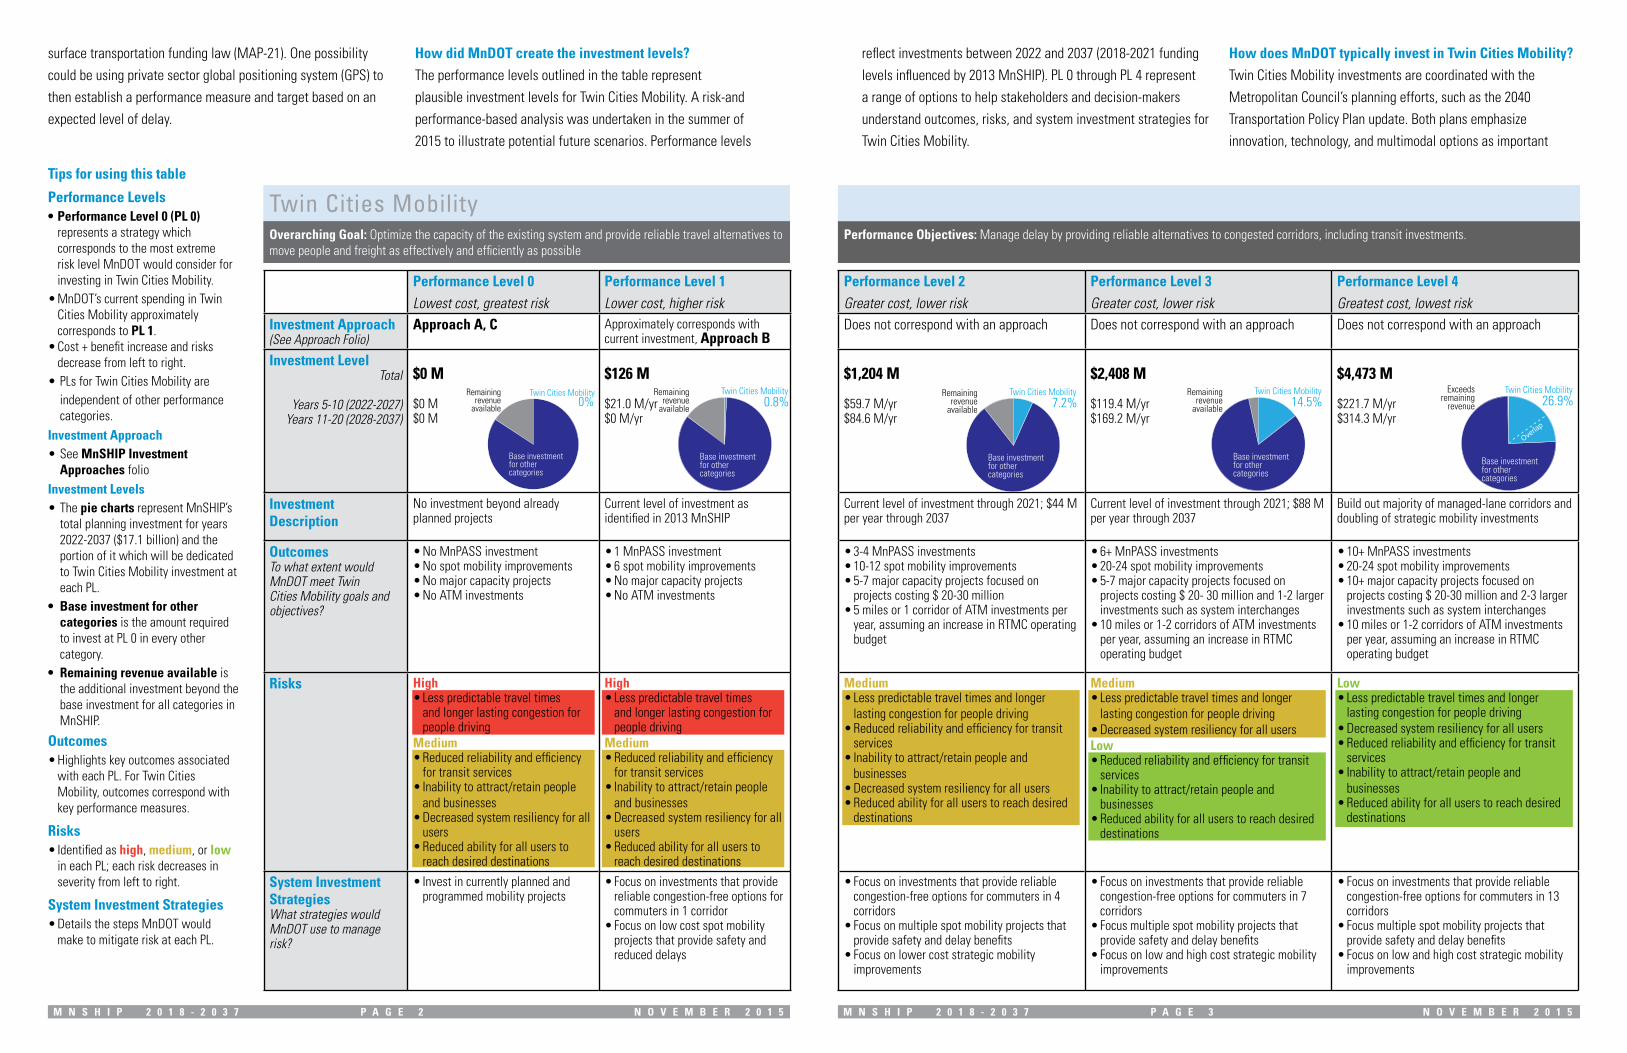
Performance Level 0Lowest cost, greatest risk
Performance Level 1Lower cost, higher risk
Performance Level 2Greater cost, lower risk
Performance Level 3Greater cost, lower risk
Performance Level 4Greatest cost, lowest risk
Investment Approach (See Approach Folio)
Approach A, C Approximately corresponds with current investment, Approach B
Does not correspond with an approach Does not correspond with an approach Does not correspond with an approach
Investment LevelTotal
Years 5-10 (2022-2027)Years 11-20 (2028-2037)
$0 M
$0 M$0 M
$126 M
$21.0 M/yr$0 M/yr
$1,204 M
$59.7 M/yr$84.6 M/yr
$2,408 M
$119.4 M/yr$169.2 M/yr
$4,473 M
$221.7 M/yr$314.3 M/yr
Investment Description
No investment beyond already planned projects
Current level of investment as identified in 2013 MnSHIP
Current level of investment through 2021; $44 M per year through 2037
Current level of investment through 2021; $88 M per year through 2037
Build out majority of managed-lane corridors and doubling of strategic mobility investments
OutcomesTo what extent would MnDOT meet Twin Cities Mobility goals and objectives?
• No MnPASS investment• No spot mobility improvements• No major capacity projects• No ATM investments
• 1 MnPASS investment• 6 spot mobility improvements• No major capacity projects• No ATM investments
• 3-4 MnPASS investments• 10-12 spot mobility improvements• 5-7 major capacity projects focused on
projects costing $ 20-30 million• 5 miles or 1 corridor of ATM investments per
year, assuming an increase in RTMC operating budget
• 6+ MnPASS investments• 20-24 spot mobility improvements • 5-7 major capacity projects focused on
projects costing $ 20- 30 million and 1-2 larger investments such as system interchanges
• 10 miles or 1-2 corridors of ATM investments per year, assuming an increase in RTMC operating budget
• 10+ MnPASS investments• 20-24 spot mobility improvements • 10+ major capacity projects focused on
projects costing $ 20-30 million and 2-3 larger investments such as system interchanges
• 10 miles or 1-2 corridors of ATM investments per year, assuming an increase in RTMC operating budget
Risks High• Less predictable travel times
and longer lasting congestion for people driving
Medium• Reduced reliability and efficiency
for transit services• Inability to attract/retain people
and businesses• Decreased system resiliency for all
users• Reduced ability for all users to
reach desired destinations
High• Less predictable travel times
and longer lasting congestion for people driving
Medium• Reduced reliability and efficiency
for transit services• Inability to attract/retain people
and businesses• Decreased system resiliency for all
users• Reduced ability for all users to
reach desired destinations
Medium• Less predictable travel times and longer
lasting congestion for people driving• Reduced reliability and efficiency for transit
services• Inability to attract/retain people and
businesses• Decreased system resiliency for all users• Reduced ability for all users to reach desired
destinations
Medium• Less predictable travel times and longer
lasting congestion for people driving• Decreased system resiliency for all usersLow• Reduced reliability and efficiency for transit
services• Inability to attract/retain people and
businesses• Reduced ability for all users to reach desired
destinations
Low• Less predictable travel times and longer
lasting congestion for people driving• Decreased system resiliency for all users• Reduced reliability and efficiency for transit
services• Inability to attract/retain people and
businesses• Reduced ability for all users to reach desired
destinations
System Investment StrategiesWhat strategies would MnDOT use to manage risk?
• Invest in currently planned and programmed mobility projects
• Focus on investments that provide reliable congestion-free options for commuters in 1 corridor
• Focus on low cost spot mobility projects that provide safety and reduced delays
• Focus on investments that provide reliable congestion-free options for commuters in 4 corridors
• Focus on multiple spot mobility projects that provide safety and delay benefits
• Focus on lower cost strategic mobility improvements
• Focus on investments that provide reliable congestion-free options for commuters in 7 corridors
• Focus multiple spot mobility projects that provide safety and delay benefits
• Focus on low and high cost strategic mobility improvements
• Focus on investments that provide reliable congestion-free options for commuters in 13 corridors
• Focus multiple spot mobility projects that provide safety and delay benefits
• Focus on low and high cost strategic mobility improvements
Remaining revenue
available
Base investment for other categories
Twin Cities Mobility 0%
Remaining revenue
available
Base investment for other categories
Twin Cities Mobility 0.8%
Remaining revenue
available
Base investment for other categories
Twin Cities Mobility 7.2%
Remaining revenue
available
Base investment for other categories
Twin Cities Mobility 14.5%
Exceeds remaining
revenue
Base investment for other categories
Twin Cities Mobility 26.9%
Overlap
Tips for using this table
Performance Levels• Performance Level 0 (PL 0)
represents a strategy which corresponds to the most extreme risk level MnDOT would consider for investing in Twin Cities Mobility.
• MnDOT’s current spending in Twin Cities Mobility approximately corresponds to PL 1.
• Cost + benefit increase and risks decrease from left to right.
• PLs for Twin Cities Mobility are independent of other performance categories.
Investment Approach• See MnSHIP Investment
Approaches folioInvestment Levels• The pie charts represent MnSHIP’s
total planning investment for years 2022-2037 ($17.1 billion) and the portion of it which will be dedicated to Twin Cities Mobility investment at each PL.
• Base investment for other categories is the amount required to invest at PL 0 in every other category.
• Remaining revenue available is the additional investment beyond the base investment for all categories in MnSHIP.
Outcomes• Highlights key outcomes associated
with each PL. For Twin Cities Mobility, outcomes correspond with key performance measures.
Risks• Identified as high, medium, or low
in each PL; each risk decreases in severity from left to right.
System Investment Strategies• Details the steps MnDOT would
make to mitigate risk at each PL.
Performance Objectives: Manage delay by providing reliable alternatives to congested corridors, including transit investments.
Twin Cities Mobility Overarching Goal: Optimize the capacity of the existing system and provide reliable travel alternatives to move people and freight as effectively and efficiently as possible
surface transportation funding law (MAP-21). One possibility could be using private sector global positioning system (GPS) to then establish a performance measure and target based on an expected level of delay.
How did MnDOT create the investment levels?The performance levels outlined in the table represent plausible investment levels for Twin Cities Mobility. A risk-and performance-based analysis was undertaken in the summer of 2015 to illustrate potential future scenarios. Performance levels
reflect investments between 2022 and 2037 (2018-2021 funding levels influenced by 2013 MnSHIP). PL 0 through PL 4 represent a range of options to help stakeholders and decision-makers understand outcomes, risks, and system investment strategies for Twin Cities Mobility.
How does MnDOT typically invest in Twin Cities Mobility?Twin Cities Mobility investments are coordinated with the Metropolitan Council’s planning efforts, such as the 2040 Transportation Policy Plan update. Both plans emphasize innovation, technology, and multimodal options as important
M N S H I P 2 0 1 8 - 2 0 3 7 P A G E 4 N O V E M B E R 2 0 1 5
congestion management strategies. They aim to address regional mobility issues through Active Traffic Management (ATM), spot mobility improvements, MnPASS express lanes, Major Capacity investments, transit, and alternative mode choice. These system-wide strategies include implementation of:
• Active Traffic Management (ATM) — ATM applications help to manage some of the effects of congestion, such as increasing reliability and reducing the number of incidents. Examples include traffic cameras, ramp meters, and changeable message signs that recommend speeds or alert freeway users to incidents ahead.
• Spot Mobility Improvements — Lower cost, high benefit projects to improve traffic flow and provide bottleneck relief. Examples include addressing safety hazards, improving intersection design, and constructing lanes to ease entering and exiting freeways.
• MnPASS express lanes (www.mnpass.org) provide buses, carpoolers, and other drivers a realiable congestion-free option. MnDOT currently operates two MnPASS express lanes on I-394 and I-35W, with another currently under construction (I-35E).
• Major Capacity Investments — Includes system-to-system interchanges, freight related improvements, and corridor level improvements.
Where is MnDOT headed?Under current funding levels (identified in 2013 MnSHIP), MnDOT
will invest approximately $126 million in Twin Cities Mobility through 2023. Post 2024, there are no funds identified for this investment area and no new projects would be undertaken. This level of funding corresponds with Performance Level 1 in the table on page 2.
What risks are addressed through increased Twin Cities Mobility investment?Generally, the more MnDOT invests in Twin Cities Mobility, the more MnDOT is able to reduce these key risks for automobile users, transit users, carpoolers, freight, and other system users:
• A future increase in travel demand will lead to longer periods of congestion and less predictable travel times for passengers and freight.
• Shipping, transit, and general travel times become less reliable because of incidents, such as crashes, construction, weather, and debris.
• Traffic congestion, unreliability and/or a lack of options compared to peer regions limits the ability of the Twin Cities to compete in attracting and retaining businesses and workers.
• Congestion hinders development of reliable and efficient transit and ride-sharing services and results in lower people-moving capacity.
• Inability to adapt to shifting travel and land use patterns, limits accessibility of desired destinations.
How is MnDOT enhancing financial effectiveness through Twin Cities Mobility?To maximize the benefit from Twin Cities Mobility investment, MnDOT priorities these strategies:
• Using technology to manage corridor congestion;• Encouraging the use of transit and carpooling through MnPASS,
bus-only shoulders and bus rapid transit, increasing the efficiency of the system; and
• Targeting investments in corridors that are at or near capacity during peak travel times; thereby making a larger impact (cost-benefit).
System Stewardship• Pavement Condition• Bridge Condition• Roadside Infrastructure
Condition• Jurisdictional Transfer• Facilities
Transportation Safety• Traveler Safety
Critical Connections• Greater Minnesota Mobility
• Bicycle Infrastructure• Accessible Pedestrian
InfrastructureHealthy Communities
• Regional + Community Improvement Priorities
Other• Project Delivery• Small Program
For more information, contact:Josh Pearson, AICP
Project Manager, 20-year State Highway Investment PlanMinnesota Department of Transportation
395 John Ireland Boulevard, MS 440St. Paul, MN 55155-1899
Find more information with these additional folios!
M N S H I P 2 0 3 7 P A G E 4 N O V E M B E R 2 0 1 5
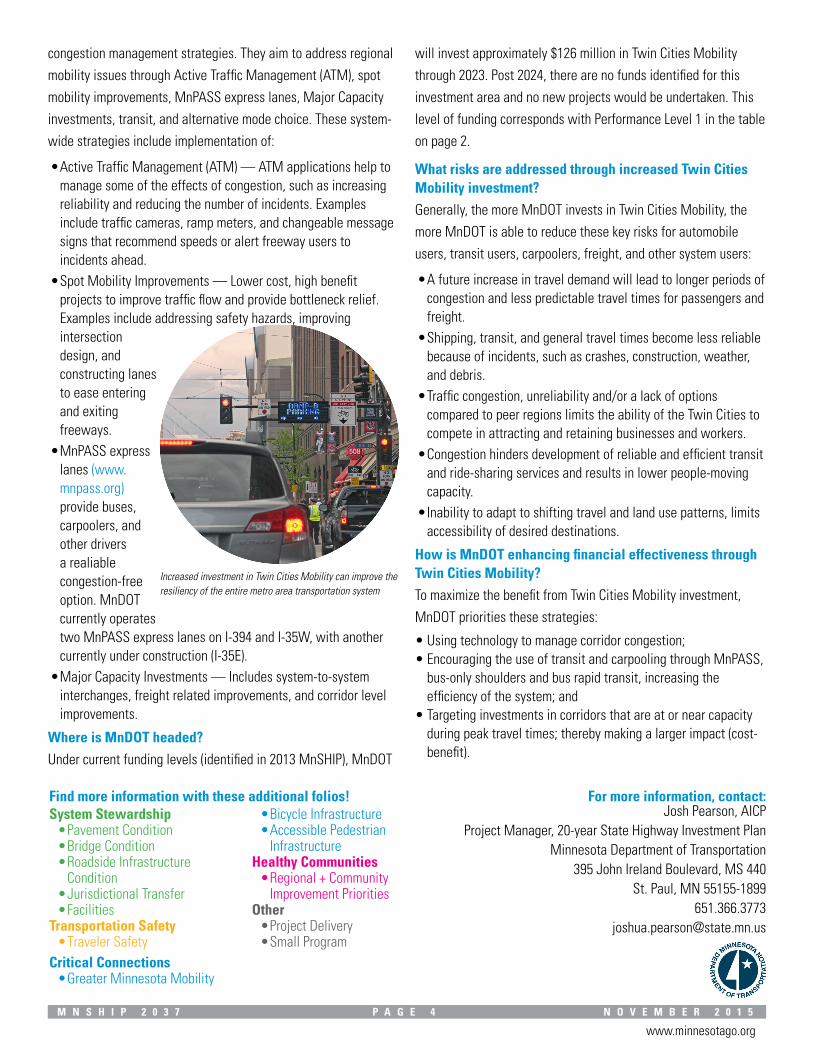
Increased investment in Twin Cities Mobility can improve the resiliency of the entire metro area transportation system
www.minnesotago.org