mms 2000-038
TRANSCRIPT

OCS ReportMMS 2000-038
SHELL LYDONIA CANYONBLOCK 357 No. 1 WELL
Geological and OperationalSummary
Edited by:Gary M. EdsonDonald L. OlsonAndrew J. Petty
U. S. Department of the InteriorMinerals Management ServiceGulf of Mexico OCS Region New OrleansOffice of Resource Evaluation May 2000

CONTENTS
Abbreviations, vi
Introduction, 1
Operational Summary, 2
Well Velocity Profile, 9
Lithologic Interpretation, 13
Biostratigraphy, 16
Formation Evaluation, 17
Geothermal Gradient, 22
Burial History, 24
Company-submitted Data, 26
Selected References, 27
iii

ILLUSTRATIONS
Figure 1. Map of the North Atlantic offshore area showing well locations, 3
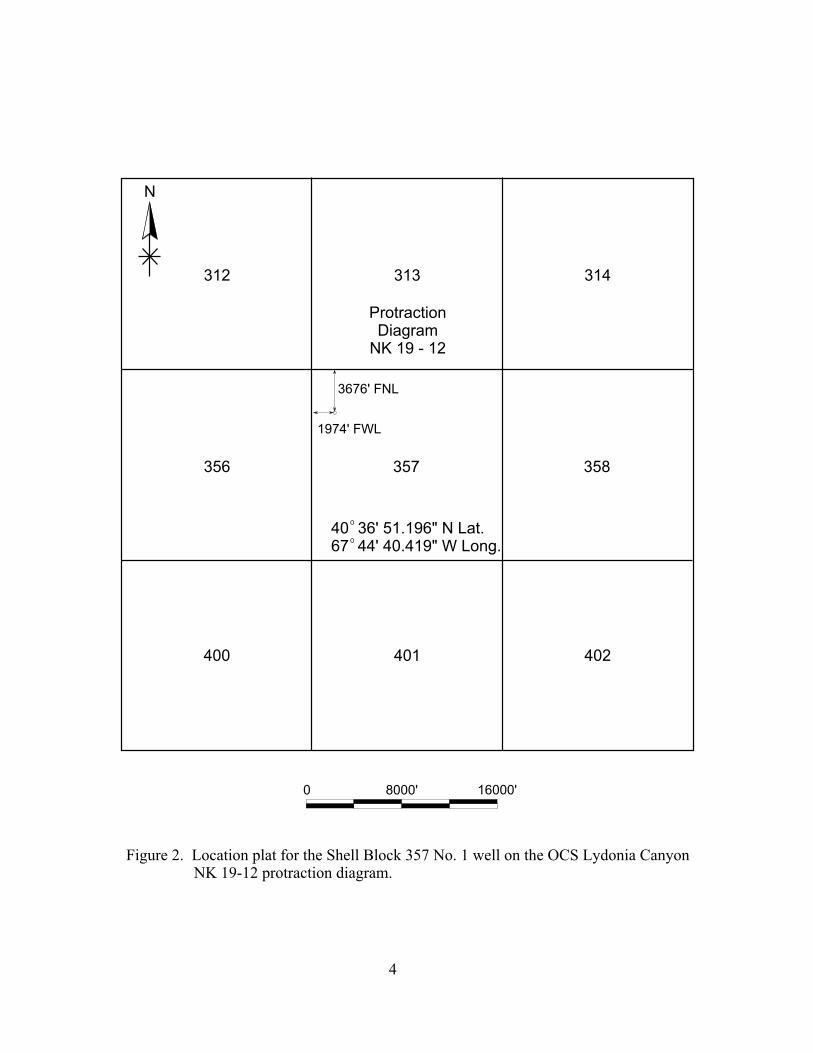
2. Location plat for the Shell Block 357 No. 1 well on the OCS Lydonia Canyon NK 19-12 protraction diagram, 4
3. Daily drilling progress for the Shell Lydonia Canyon Block 357 No. 1 well, 5
4. Casing diagram for the Shell Lydonia Canyon Block 357 No. 1 well, 7
5. Well velocity profile for the Shell Lydonia Canyon Block 357 No. 1 well, plotted against depth, 10
6. Well velocity profile for the Shell Lydonia Canyon Block 357 No. 1 well, plotted against two-way travel time, 11
7. Columnar chart of the lithology and biostratigraphy of the Shell Lydonia Canyon Block 357 No. 1 well, 14
8. Well temperatures and geothermal gradient for the Shell Lydonia Canyon Block 357 No. 1 well, 23
9. Burial diagram for the Shell Lydonia Canyon Block 357 No. 1 well, 25
iv

TABLES
Table 1. Well statistics, 6
2. Well velocity data, 9
3. Well velocity intervals, 9
4. Biostratigraphy, 16
5. Well logs, 17
6. Well log interpretation summary, 18
7. Sidewall core analysis summary, 19
8. Conventional core summary, 19
9. Dipmeter analysis summary, 20
10. Hydrocarbon shows, 21
v

ABBREVIATIONS
API -- American Petroleum Institutebbl -- barrelsBOP -- Blow out preventerCNL -- Compensated neutron logCPI -- Carbon Preference IndexCOST -- Continental Offshore Stratigraphic TestDST -- drill stem testEQMW -- equivalent mud weightFDC -- compensated formation density logFEL -- from east lineFNL -- from north lineFSL -- from south lineFWL -- from west linek -- permeabilityKB -- kelly bushingLS -- limestonem -- meter (s)md -- millidarcyMYBP -- million years before presentOCS -- Outer Continental Shelfppf -- pounds per footppg -- pounds per gallonppm -- parts per millionpsi -- pounds per square inchRO -- vitrinite reflectanceSS -- sandstoneSw -- water saturationTAI -- thermal alteration indexTD -- total depthTIOG -- threshold of intense oil generationTOC -- total organic carbonUTM -- Universal Transverse Mercatorφ -- porosity
vi
1
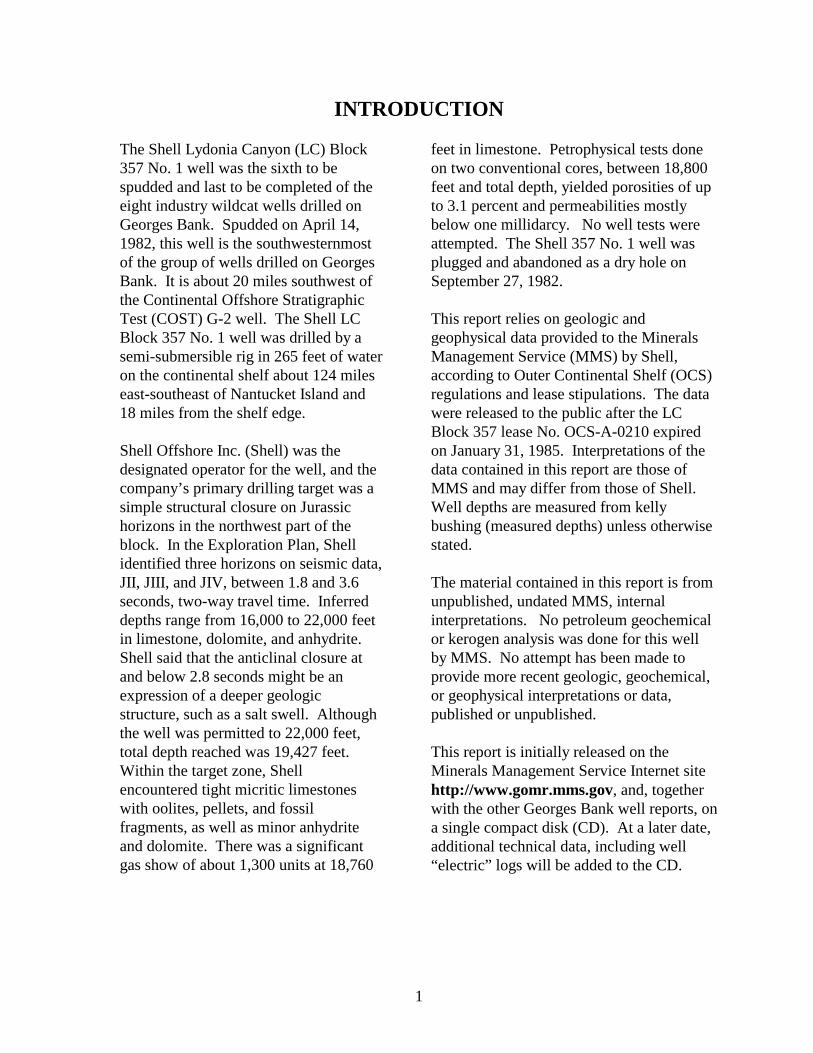
INTRODUCTION
The Shell Lydonia Canyon (LC) Block357 No. 1 well was the sixth to bespudded and last to be completed of theeight industry wildcat wells drilled onGeorges Bank. Spudded on April 14,1982, this well is the southwesternmostof the group of wells drilled on GeorgesBank. It is about 20 miles southwest ofthe Continental Offshore StratigraphicTest (COST) G-2 well. The Shell LCBlock 357 No. 1 well was drilled by asemi-submersible rig in 265 feet of wateron the continental shelf about 124 mileseast-southeast of Nantucket Island and18 miles from the shelf edge.
Shell Offshore Inc. (Shell) was thedesignated operator for the well, and thecompany’s primary drilling target was asimple structural closure on Jurassichorizons in the northwest part of theblock. In the Exploration Plan, Shellidentified three horizons on seismic data,JII, JIII, and JIV, between 1.8 and 3.6seconds, two-way travel time. Inferreddepths range from 16,000 to 22,000 feetin limestone, dolomite, and anhydrite. Shell said that the anticlinal closure atand below 2.8 seconds might be anexpression of a deeper geologicstructure, such as a salt swell. Althoughthe well was permitted to 22,000 feet,total depth reached was 19,427 feet. Within the target zone, Shellencountered tight micritic limestoneswith oolites, pellets, and fossilfragments, as well as minor anhydriteand dolomite. There was a significantgas show of about 1,300 units at 18,760
feet in limestone. Petrophysical tests doneon two conventional cores, between 18,800feet and total depth, yielded porosities of upto 3.1 percent and permeabilities mostlybelow one millidarcy. No well tests wereattempted. The Shell 357 No. 1 well wasplugged and abandoned as a dry hole onSeptember 27, 1982.
This report relies on geologic andgeophysical data provided to the MineralsManagement Service (MMS) by Shell,according to Outer Continental Shelf (OCS)regulations and lease stipulations. The datawere released to the public after the LCBlock 357 lease No. OCS-A-0210 expiredon January 31, 1985. Interpretations of thedata contained in this report are those ofMMS and may differ from those of Shell.Well depths are measured from kellybushing (measured depths) unless otherwisestated.
The material contained in this report is fromunpublished, undated MMS, internalinterpretations. No petroleum geochemicalor kerogen analysis was done for this wellby MMS. No attempt has been made toprovide more recent geologic, geochemical,or geophysical interpretations or data,published or unpublished.
This report is initially released on theMinerals Management Service Internet sitehttp://www.gomr.mms.gov, and, togetherwith the other Georges Bank well reports, ona single compact disk (CD). At a later date,additional technical data, including well“electric” logs will be added to the CD.

2
OPERATIONAL SUMMARY
The Shell Lydonia Canyon (LC) Block357 No. 1 well (figures 1 and 2) wasdrilled by the Zapata OffshoreCompany’s Saratoga semisubmersibledrilling rig to a total measured depth of19,427 feet. The well was spudded onApril 14, 1982, in 265 feet of water. Daily drilling progress for the well isshown in figure 3 and well statistics arepresented in table 1. Geologicexploration objectives were Jurassiccarbonate rocks between 2.8 and 3.4seconds two-way travel time, identifiedon seismic record sections andinterpreted to be at depths of 16,000 to22,000 feet. At the well location, thetarget strata form a simple structuralclosure over an inferred salt pillow atgreater depth.
The surface hole was drilled with 8.9-ppg mud and opened to 36 inches to adepth of 514 feet. The 30-inch surfacecasing was set at 495 feet with 2,000sacks of class H cement. A casingdiagram is shown in figure 4. Re-cement jobs were attempted after testingbecause of leakage around the outside ofthe surface casing. The marine riser wasconnected, the cement plug was drilledout, and drilling continued with a 17 1/2-inch bit to 1,219 feet and with mudweights from 9.0 to 10.0 ppg. The holewas logged and then opened to 26 inchesto a depth of 1,181 feet. In two attempts,the 20-inch casing could not be run intothe hole because of bridging. Afterrepeated reaming, washing, and re-cementing the surface casing, the 20-inch casing was run and set at 1,169 feetwith 1,030 sacks of class H cement.The blowout preventer and riser were
run and tested and the 20-inch casing wastested to 200 psi for 30 minutes. Thecement plug was drilled out and drillingcontinued with a 17 1/2-inch bit and 9.0- to9.1-ppg mud to 4,465 feet depth. The holewas logged and the 13 3/8-inch casing wasrun and set at 4,417 feet with 255 sacks ofclass H cement.
The casing was tested at 1,000 psi for 30minutes. Drilling resumed to 12,060 feetwith a 12 1/2-inch bit and 9.0 to 9.1 ppgmud. Repeated reaming was required tomaintain hole gauge. The hole was logged,and the 9 5/8-inch casing was run and set at12,011 feet with 2,760 sacks of class Hcement. The casing and plug were tested at2,700 psi, the ball joint repaired, and theBOP tested. The plug was drilled out,drilling and reaming resumed to 17,988 feetwith an 8 1/2-inch bit and mud weights from9.5 to 12.0 ppg, and the hole was logged. Drilling resumed to 18,845 feet with an 81/2-inch bit and 12.8- to 12.9-ppg mud. Agas show was encountered at 18,765 feet.
The hole was logged, cleaned, and sidewallcores run. A 7-inch liner was run andcemented with 800 sacks of class H cementto 18,630 feet. Pressure testing was done bybumping the plug to 2,000 psi, but thesetting sleeve failed. The top of the linerwas cemented and tested to 4,145 psi for 30minutes. With the use of a 5 7/8-inch bit,the cement plugs were drilled out, but thedrill pipe stuck at 18,752 feet. After backingoff, the bit, sub, and drill collar were left inthe hole. Fishing was partly successful, andthe bit was milled and the hole cleaned.

CONOCOBLK. 145 NO. 1
EXXONBLK. 975 NO. 1
COST NO. G-1
COSTNO. G-2
EXXONBLK. 133 NO. 1
MOBILBLK. 312 NO. 1
SHELLBLK. 357 NO. 1
SHELLBLK. 410 NO. 1
TENNECOBLK. 187 NO. 1
MOBILBLK. 273 NO. 1
EXPLANATION
Leased Tracts Sale 42 (1979)
Dry Hole
ChathamNK 19 - 8
Corsair CanyonNK 19 - 9
Hydrographer CanyonNK 19 - 11
0 10 20 STATUTE MILESAREA OF INTEREST
MA.
RI.Atlantic Ocean
68
68
41
40 4030' 00" 30' 00"
41
67
67
100 M
200
M
Lydonia CanyonNK 19 - 12
Figure 1. Map of the North Atlantic offshore area showing well locations. The Shell Lydonia Canyon Block 357 No. 1 well is highlighted in red. Bathymetry is in meters.
3
312 313 314
358357356
400 401 402
1974' FWL
40 36' 51.196" N Lat.67 44' 40.419" W Long.
Protraction Diagram
NK 19 - 12
N
0 8000' 16000'
3676' FNL
Figure 2. Location plat for the Shell Block 357 No. 1 well on the OCS Lydonia Canyon NK 19-12 protraction diagram.
4

120 150 18090603000
1,000
2,000
3,000
4,000
5,000
6,000
7,000
8,000
9,000
10,000
11,000
12,000
13,000
14,000
15,000
16,000
17,000
18,000
19,000
20,000
30" Casing at 495’
20“ Casing at 1,169'
13 3/8" Casing at 4,417’
9 5/8" Casing at 12,011’
7" Liner at 18,630’
Lo
gg
ing
Lo
gg
ing
Co
rin
g
On Location: .....4/5/82Spudded: ........4/14/82Reached TD: ..9/18/82Off Location:....9/27/82Days on Location: 176
Depth(Feet)
Days on Location
Ga
s S
ho
w
Drilling Problems, Equipment Repair, Fishing & Milling
Ab
an
do
nm
en
t
Off L
oca
tio
n
April May June July August September
On
Lo
ca
tion
Sp
ud
Figure 3. Daily drilling progress for the Shell Lydonia Canyon Block 357 No. 1 well.
5
6
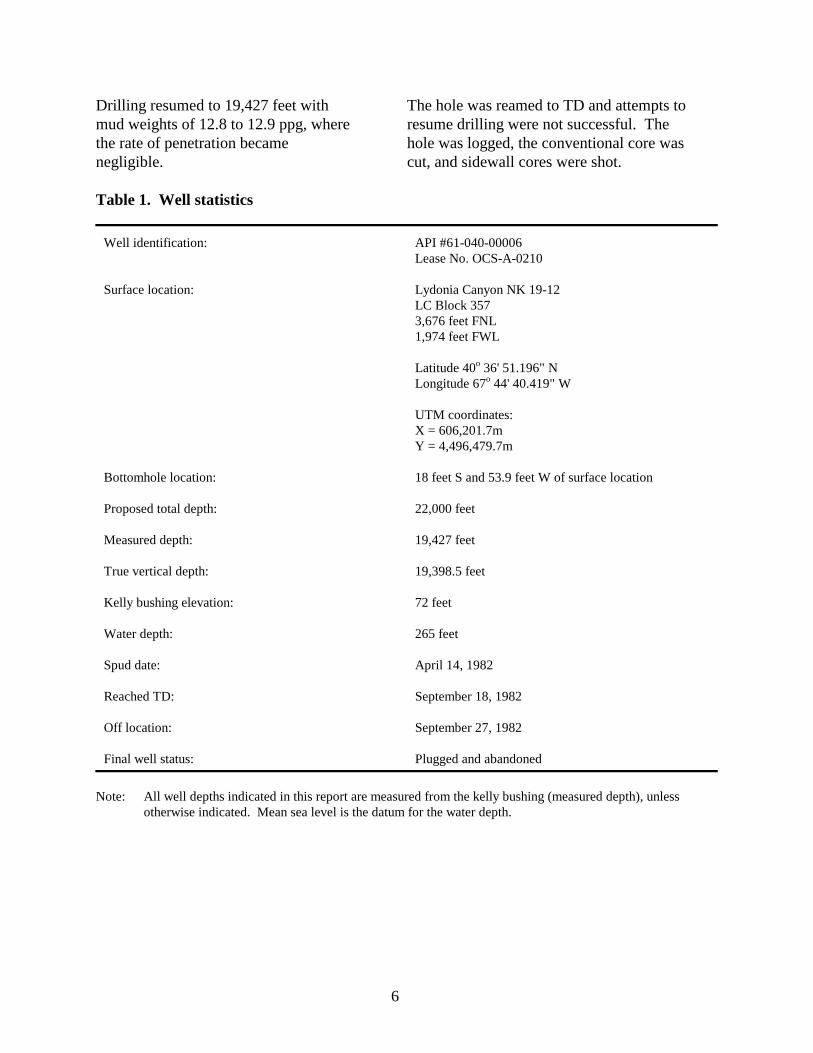
Drilling resumed to 19,427 feet withmud weights of 12.8 to 12.9 ppg, wherethe rate of penetration becamenegligible.
The hole was reamed to TD and attempts toresume drilling were not successful. Thehole was logged, the conventional core wascut, and sidewall cores were shot.
Table 1. Well statistics
Well identification:
Surface location:
Bottomhole location:
Proposed total depth:
Measured depth:
True vertical depth:
Kelly bushing elevation:
Water depth:
Spud date:
Reached TD:
Off location:
Final well status:
API #61-040-00006Lease No. OCS-A-0210
Lydonia Canyon NK 19-12LC Block 3573,676 feet FNL1,974 feet FWL
Latitude 40o 36' 51.196" NLongitude 67o 44' 40.419" W
UTM coordinates:X = 606,201.7mY = 4,496,479.7m
18 feet S and 53.9 feet W of surface location
22,000 feet
19,427 feet
19,398.5 feet
72 feet
265 feet
April 14, 1982
September 18, 1982
September 27, 1982
Plugged and abandoned
Note: All well depths indicated in this report are measured from the kelly bushing (measured depth), unlessotherwise indicated. Mean sea level is the datum for the water depth.

Depth Below KB (Feet)
72Level Sea
337Seafloor354Cut Casings 30" & 20" 470Cut Casing 3/8" 13 480Plug Cement of Top
4,417Set Casing 3/8" 13
11,500Cement of Top ~11,825Liner 7"Top
x x x x x x 30" Casing Set 495540Set EZSV 3/8" 13 600Cut Casing 5/8" 9 778Plug Cement Bottom,
1,169Set Casing 20"
12,011Set Casing 5/8"9
17,170Plug Cement Top
18,220Plug Cement Top
18,630Set Liner 7"
Total Measured Depth 19,427
Figure 4. Casing diagram for the Shell Lydonia Canyon Block 357 No. 1 well.
7
8
Abandonment procedures (figure 4)included setting cement plugs at 18,220,17,170, and 11,500 feet (tops of cement)with 100 sacks of class H cement foreach plug. A pressure test wasconducted at 11,500 feet with 1,000 psi,and the 9 5/8-inch casing was cut at 600feet and pulled. A packer was set andtested at 540 feet and 100 sacks weresqueezed below the retainer (bottom ofcement, 778 feet), and 75 sacks were
spotted on top (top of cement, 480 feet). The plug was tested at 1,000 psi and the13 3/8-inch casing was cut at 470 feet andpulled. The 13 3/8-inch annulus was testedat 400 psi, and the 20- and 30-inch casingswere cut and pulled at 354 feet. Allwellhead equipment and anchors wereretrieved. The site was cleaned by diversand surveyed by sidescan sonar, and the rigwas released on September 27, 1982.
9
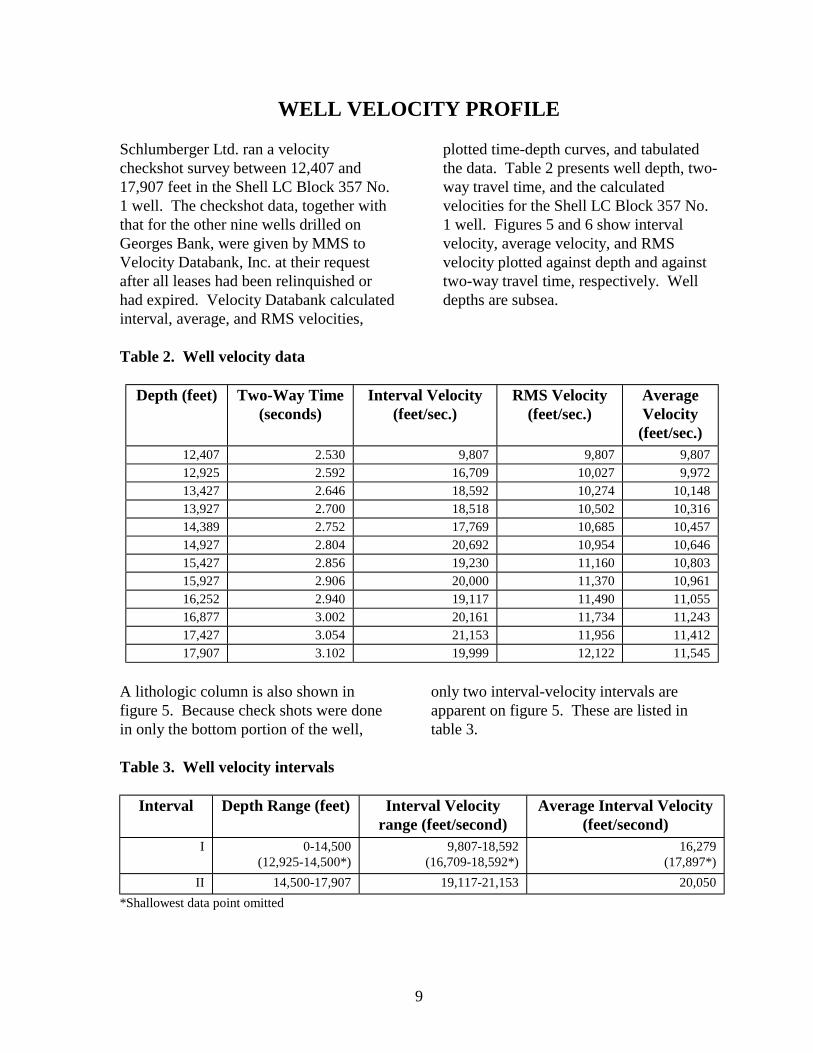
WELL VELOCITY PROFILE
Schlumberger Ltd. ran a velocitycheckshot survey between 12,407 and17,907 feet in the Shell LC Block 357 No.1 well. The checkshot data, together withthat for the other nine wells drilled onGeorges Bank, were given by MMS toVelocity Databank, Inc. at their requestafter all leases had been relinquished orhad expired. Velocity Databank calculatedinterval, average, and RMS velocities,
plotted time-depth curves, and tabulatedthe data. Table 2 presents well depth, two-way travel time, and the calculatedvelocities for the Shell LC Block 357 No.1 well. Figures 5 and 6 show intervalvelocity, average velocity, and RMSvelocity plotted against depth and againsttwo-way travel time, respectively. Welldepths are subsea.
Table 2. Well velocity data
Depth (feet) Two-Way Time(seconds)
Interval Velocity(feet/sec.)
RMS Velocity(feet/sec.)
AverageVelocity
(feet/sec.)12,407 2.530 9,807 9,807 9,80712,925 2.592 16,709 10,027 9,97213,427 2.646 18,592 10,274 10,14813,927 2.700 18,518 10,502 10,31614,389 2.752 17,769 10,685 10,45714,927 2.804 20,692 10,954 10,64615,427 2.856 19,230 11,160 10,80315,927 2.906 20,000 11,370 10,96116,252 2.940 19,117 11,490 11,05516,877 3.002 20,161 11,734 11,24317,427 3.054 21,153 11,956 11,41217,907 3.102 19,999 12,122 11,545
A lithologic column is also shown infigure 5. Because check shots were donein only the bottom portion of the well,
only two interval-velocity intervals areapparent on figure 5. These are listed intable 3.
Table 3. Well velocity intervals
Interval Depth Range (feet) Interval Velocityrange (feet/second)
Average Interval Velocity(feet/second)
I 0-14,500(12,925-14,500*)
9,807-18,592(16,709-18,592*)
16,279(17,897*)
II 14,500-17,907 19,117-21,153 20,050*Shallowest data point omitted

25,000
20,000
15,000
10,000
5,000
0 2,000 4,000 6,000 8,000 10,000 12,000 14,000 16,000 18,000
Interval Velocity
RMS Velocity
Average Velocity
Ve
loci
ty in
fe
et p
er
seco
nd
Depth in feet
No Samples
Not Determined
UpperCret.
LowerCretaceous
Upper Jurassic
Lower Jurassic
Interval I Interval II
?
Figure 5. Well velocity profile for the Shell Lydonia Canyon Block 357 No. 1 well, plotted against depth, with biostratigraphic ages and generalized lithologies. Intervals are explained in text.
10

25,000
20,000
15,000
10,000
5,000
00 0.5 1 1.5 2 2.5 3 3.5
Ve
locity
in
fe
et p
er
se
co
nd
Two-way travel time in seconds
Interval Velocity
RMS Velocity
Average Velocity
Figure 6. Well velocity profile for the Shell Lydonia Canyon Block 357 No. 1 well, plotted against two-way travel time.
11

12
Interval I This interval contains thefirst five data points and includes theentire column of water and rock to 14,389feet. With regard to interval velocities, thefirst value, 9,807 feet per second, at12,407 feet, has little practical value, sinceit also applies to the entire column ofwater and rock to that depth. In Table 3,the values in parentheses for Interval Iomit the shallowest data point and arerepresentative of the interval velocities at12,925 to 14,500 feet. These moderatelyhigh velocities correlate with limestone
with siliciclastic interbeds. According toShell Offshore, Inc. biostratigraphicanalysis, this part of the section isOxfordian (Late Jurassic).
Interval II This interval is identifiedon the basis of high interval velocities,which correlate with limestones. Thelower portion of the interval also containssome dolomite and anhydrite. Thisinterval is Early(?) to Late Jurassic,according to Shell’s biostratigraphy.

13
LITHOLOGIC INTERPRETATIONTaken and adapted from A. Rampertaap, MMS internal report
Well cuttings were collected at 30-footintervals from 540 to 13,020 feet and then10-foot intervals to total depth, 19,427 feetin the Shell LC Block 357 No. 1 well. Sample quality ranged from fair to good,based on amounts of cavings and degree ofwashing. Conventional cores from 18,815to 18,845 feet and 19,399 to 19,407 feet,together with 46 sidewall cores taken from15,189 to 18,782 feet, provided additionallithologic control.
The lithologic descriptions of this reportare based on examination of drill cuttings,supplemented by mud log sampledescriptions. Depths of lithologicboundaries are adjusted with reference toelectric logs. All depths are from kellybushing. Rocks penetrated are dividedinto gross lithologic-stratigraphic units,shown in figure 7.
From 540 to 580 feet, the section consistsof unconsolidated quartz sand, with redsiltstone fragments and traces of shelldebris and glauconite. From 580 to 1,200feet, there are no cutting samples. From1,200 to 1,300 feet, the interval consists ofcoarse sand with subrounded to roundedgrains and traces of shell fragments.
From 1,300 to 1,450 feet, the sectionconsists of coarse-grained quartz sand withsubrounded to rounded grains, silty clay,glauconitic sandstone fragments, andtraces of shell fragments. From 1,450 to2,400 feet, the section consists of darkgray clay with lesser amounts of sandysiltstone, and sandstone. There are tracequantities of shell fragments, and lignite isabundant at about 2,000 feet.From 2,400 to 3,150 feet, the section
consists of gray to black, calcareous,clayey siltstone or mudstone with traces ofsand, lignite (which may be cavings), andshell fragments.
From 3,150 to 3,510 feet, the sectionconsists of dark-gray to black calcareousmudstone with traces of sand, lignite, andfossil fragments. From 3,510 to 3,775feet, the section consists of medium tocoarse grained quartz sand with subangularto subrounded grains and traces of fossilfragments.
From 3,775 to 3,910 feet, the sectionconsists of dark-gray, calcareous mudstonewith traces of sand, glauconite, and fossilfragments. From 3,910 to 4,300 feet, thesection consists of brown to graycalcareous, sandy siltstone with traces ofshell fragments and glauconite pellets.
From 4,300 to 4,500 feet, the sectionconsists of brown to gray, calcareoussiltstone, limestone, and traces of fossilfragments and glauconite pellets. From4,500 to 4,775 feet, the section consists ofdark-gray, sandy siltstone with traces oflimestone, lignite, glauconite, and fossilfragments. From 4,775 to 5,350 feet, thesection consists of light-gray to graylimestone, coarse-grained sandstone, grayshale, calcareous siltstone, and clay. From5,350 to 6,450 feet, the section consists ofsandstone, shale, and calcareous sandysiltstone. The sandstone is very fine tocoarse, moderately sorted, and clear tolight gray with angular to subangulargrains and traces of pyrite, glauconite, andcoal. Most of the shale is light to medium

DE
PT
H IN
FE
ET
AGE
LIT
HO
LO
GY
PA
LYN
OL
OG
Y
NA
NN
OF
OS
SIL
FO
RA
MIN
IFE
RA
NO
N M
AR
INE
PALEOENVIRONMENT
0 50' 300' 600' 1500'SHELF SLOPE
INNER MIDDLE OUTER UPPER LOWER
Age Not Determined
LA
TE
CR
ETA
CE
OU
SE
AR
LY C
RE
TA
CE
OU
S
Campanian
Coniacian / Turonian
Turonian
Late Cenomanian
Albian
Aptian
Barremian
1000
500
1500
2000
2500
3000
3500
4000
4500
5000
5500
6000
6500
7000
7500
8000
8500
9000
9500
Hauterivian
Valanginian
10000
10500
11000
11500
12000
12500
13000
13500
14000
14500
15000
15500
16000
16500
17000
17500
18000
18500
19000
19500
Oxfordian
Kimmeridgian
LATE JURASSIC (?)
LA
TE
JU
RA
SS
IC
EARLY JURASSIC (?)
T.D. 19,427' Feet
Shale or Clay
Silty Shale
Sandy ShaleCalcareous ShaleShale with FossilsShale with Pyrite
Siltstone
Shaley Siltstone
Sandy Siltstone
Calcareous SiltstoneSiltstone with FossilsSiltstone with Pyrite
Shaley Limestone
Silty Limestone
Sandy LimestoneLimestone with Fossils
Limestone with Anhydrite
Sandstone
Oolitic Limestone
Shaley Sandstone
Silty Sandstone
Calcareous SandstoneSandstone with Pebblesand / or Fossils
Limestone
Dolomite
Anhydrite
Halite
Tuff or Ash
Glauconite
Fossils
Coal
Marker Fossil
Casing Point
HydrocarbonShow
Unconformity
EXPLANTION
xxx
xxx
xxx
xxx
xxx
xxx
xxx
xxx
Igneous
Santonian
NoSamples
NoSamples
KB72'
SeaFloor337'
Note: Biostratigraphy From Shell - Submitted Report
No MMS Paleo Available.
Total Sample Depth 19,395'
Note: No Microfossil Data or Paleoenvironment Analysis Available
30"Casingat 495’
20“Casingat 1,169'
13 3/8"Casingat 4,417'
9 5/8"Casingat 12,011'
7"Linerat 18,630'
Figure 7. Columnar chart of the lithology and biostratigraphy of the Shell Lydonia Canyon Block 357 No. 1 well. Lithologic interpretations from examination of cuttings; lithologic breaks picked from well logs. Stage tops from Shell. No paleobathymetry available.
14

15
gray; a small proportion is red. The sandysiltstone is light to dark gray with traces ofpyrite, glauconite, and coal.
From 6,450 to 7,075 feet, the sectionconsists of limestone, calcareoussandstone, and calcareous sandy siltstone. The limestone is light to dark gray withtraces of pyrite, shale, and quartz. Thesandstone has clear, angular to subangulargrains and traces of pyrite. The sandysiltstone is light to dark gray with traces ofpyrite. Silty clay occurs between 6,900and 6,920 feet. From 7,075 to 7,275 feet,the section is predominantly light-graylimestone and shale.
From 7,275 to 7,525 feet, the sectionconsists of white to gray, calcareoussiltstone with traces of shale. From 7,525to 7,900 feet, the section consists ofcalcareous siltstone that is light to darkgray, moderately well indurated, and hastraces of limestone. Light-gray, calcareousclay with traces of limestone occursbetween 7,810 to 7,900 feet. From 7,900to 8,875 feet, light-gray limestone gradesinto dark-gray siltstone and light- to dark-gray shale. Traces of pyrite, siltstone,shale, and limestone also occur. Chalkylimestone occurs between 8,550 and 8,650feet.
From 8,875 to 9,520 feet, the sectionconsists of calcareous, sandy shale, shale,limestone, and sandstone. The sandy shalecontains fine, rounded sand grains. Theshale is dark gray. The limestone is lightto dark gray with traces of lignite. Thesandstone is well sorted and fine grainedwith rounded quartz grains.
From 9,520 to 12,100 feet, the sectionconsists of limestone, sandstone, siltstone,
and shale. The limestone is white to darkgray with small amounts of pyrite. Thesandstone is dominantly light gray, finegrained, and moderately sorted withangular to subangular quartz grains. Traces of glauconite occur at 9,950 and10,200 feet. The siltstone is reddishbrown, gray, and light gray. The shale isdark gray.
From 12,100 to 13,110 feet, the sectionconsists of microcrystalline limestone withlesser amounts of sandstone, chalk, andsiltstone. The limestone is white tomedium gray with scattered oolites from12,900 to 13,100 feet. The dominantlithology from 13,110 to 13,510 feet iswhite to gray, microcrystalline limestone,in part oolitic, with traces of pyrite,anhydrite, sandstone, and siltstone. From13,510 to 13,750 feet, the section consistsof light- to medium-gray limestone withminor gray shale and traces of siltstone. From 13,750 to 14,400 feet, the sectionconsists of limestone with traces ofsiltstone. From 13,825 to 14,275 feet, thelimestone is oolitic with traces ofanhydrite at 13,910 feet.
At 14,040 feet a thin bed of chalkylimestone is present. From 14,400 to14,740 feet, the section consists of whiteto medium gray oolitic limestone. From14,740 to 19,427 feet, the section consistsentirely of limestone and dolomite withlimestone predominant in the uppersection to 19,110 feet and dolomitepredominant below 19,110 feet. Throughthe overall interval, the limestone gradesdownward from oolite to micrite. Smallamounts of anhydrite occur at 16,000,16,300, 16,430, 16,690, 16,910, 17,500,and 19,400 feet.

16
BIOSTRATIGRAPHY
This biostratigraphic summary is taken from areport submitted by Shell to MMS for the ShellLC Block 357 No. 1 well. No MMS
paleontological interpretations are available. This biostratigraphic summary also appears infigure 7.
Table 4. Biostratigraphy
Series Age DepthInterval (feet)
Not examined 0-514Not determined 514-1,330
Late Cretaceous at/in Campanian 1,300at/in late Santonian 1,630
Coniacian - Turonian 2,560in Turonian 2,660
at/in late Cenomanian 2,740Early Cretaceous at/in Albian 3,250
at/in Aptian 3,940in Barremian 5,080
at/in Hauterivian 5,650at/in Valanginian 6,400
Late Jurassic (?) 7,060Late Jurassic at/in Kimmeridgian 7,360
at/in Oxfordian 9,460Early Jurassic (?) 17,010
Total sample depth 19,395

17
FORMATION EVALUATIONTaken and adapted from R. Nichols, MMS internal report
Schlumberger Ltd. ran the followinggeophysical “electric” logs in the Shell LCBlock 357 No. 1 well to provide
information for stratigraphic correlationand for evaluation of formation fluids,porosity, and lithology:
Table 5. Well logs
Log Type Depth Interval (feet)Below KB
DISFL/Sonic (dual induction spherically focused log/sonic) 497-19,391BHC/Sonic (borehole compensated/sonic) 4,419-19,389FDC (compensated formation density) 1,172-19,392CNL/FDC (compensated neutron log/compensated formation density) 1,172-19,392LDT/GR (lithodensity tool/gamma ray) 4,419-12,038GR/Spectrometry (gamma ray/spectrometry) 4,419-19,392Caliper 4,419-18,840HDT (high-resolution dipmeter) 4,419-19,395FIL (fracture identification log) 12,013-18,840
Exploration Logging, Inc. (EXLOG)provided a formation evaluation “mud”log, which included a rate of penetrationcurve, sample description, and a graphicpresentation of any hydrocarbon showsencountered (515 to 19,434 feet). Inaddition, a pressure analysis log (500 to19,400 feet) and a drilling data pressurelog (520 to 19,430 feet) were provided. EXLOG’s deepest well depths are notconsistent with the operator’s measuredTD’s.
The “electric” logs, together with the“mud” log and other available data, wereanalyzed in detail to determine thethickness of potential reservoirs, averageporosities, and feet of hydrocarbonpresent. Reservoir rocks with porositiesless than 5 percent were disregarded. Acombination of logs was used in theanalysis, but a detailed lithologic andreservoir property determination fromsamples, conventional cores, and sidewallcores, in addition to full consideration ofany test results, is necessary to substantiatethe following estimates as shown intable 6.

18
Table 6. Well log interpretation summary
Series* DepthInterval
(feet)
PotentialReservoir1
(feet)
Ave φφφφ(%)
SW (%) Feet ofHydrocarbon
EK 3,358-3,400 42 34 **NC NC3,412-3,424 12 35 - -3,528-3,578 50 28 - -3,654-3,712 44 34 - -4,134-4,158 24 35 - -4,436-4,452 16 (35) - -4,734-4,804 19 33 - -4,854-4,864 10 29 - -5,036-5,044 8 29 - -5,356-5,384 28 29 - -5,428-5,448 16 29 - -5,490-5,673 83 29 - -5,718-5,760 38 32 - -5,882-5,908 24 30 - -5,938-5,958 20 32 - -6,066-6,128 58 29 - -6,144-6,182 38 28 - -6,210-6,250 40 32 - -6,302-6,322 20 30 - -6,572-6,593 13 23 - -6,673-6,720 24 23 - -6,822-6,833 11 26 - -7,726-7,736 8 28 67 -8,252-8,269 15 18 - -8,818-8,848 30 19 - -8,862-8,874 12 19 - -9,196-9,218 12 22 - -9,293-9,332 35 18 - -9,384-9,396 12 16 - -
10,255-10,266 11 15 - -10,374-10,389 15 15 - -10,466-10,480 14 16 - -10,912-10,924 9 13 - -
UJ
14,108-14,122 12(?) 6 54+ -2
Continued

19
Table 6. Well log interpretation summary--continuedSeries* Depth Interval
(feet)Potential
Reservoir1
(feet)
Ave φφφφ(%)
SW (%) Feet ofHydrocarbon
UJ 14,575-14,586 11 5 -15,450-15,470 18 5 - -15,688-15,774 41 10 - -16,148-16,192 26 9 - -
EJ(?) 18,755-18,772 6 6 17 6(?)3
19,274-19,284 (5) (< 5) - -*Biostratigraphy from company-submitted report**Not calculated1Generally in beds > 10 feet thick and > 5%
2Mud log response = 3 units (C1-2)3Mud log response = 1,300 units (C1-2)
The electric logs were of acceptablequality. However, SP shifts were reportedat 9,715, 13,950, 15,200, and 15,280 feet. Additional SP shifts may be present at4,430, 17,800, 18,235, and 18,875 feet. The CNL/FDC tool stuck at 14,225 feetand the readings from 14,168 to 14,248feet appear to be in error. From 6,900 to
19,391 feet, washouts indicated by thecaliper log appear to affect the densityporosity reading severely and cause falseannulus responses by the medium readinginduction log.
Sidewall core porosities (table 7) comparefavorably to “electric” log porosities,
Table 7. Sidewall core analysis summary
Depth Interval(feet)
Lithology PorosityRange (%)
Permeability Range(md)
15,189-18,782 Limestone, fine xln 1-31 NC**Not calculated1Described as leached and vuggy with some open fractures
particularly the values calculated from thesonic log. The sidewall coring process may have induced fractures in the harderlimestone sections.
Two conventional cores were taken in thiswell with results as follows:
Table 8. Conventional core summary
CoreNo.
Depth Interval(feet)
Recov.(feet)
Lith. φφφφ Range(%)
PermeabilityRange (md)
GrainDensity(g/cc)
1 18,815-18,845 27 LS 0.2-1.7 0.009-0.02 2.70-2.752 19,399-19,407 7 LS/Dol 1.2-3.1 0.02-61.6 2.71-2.82
20
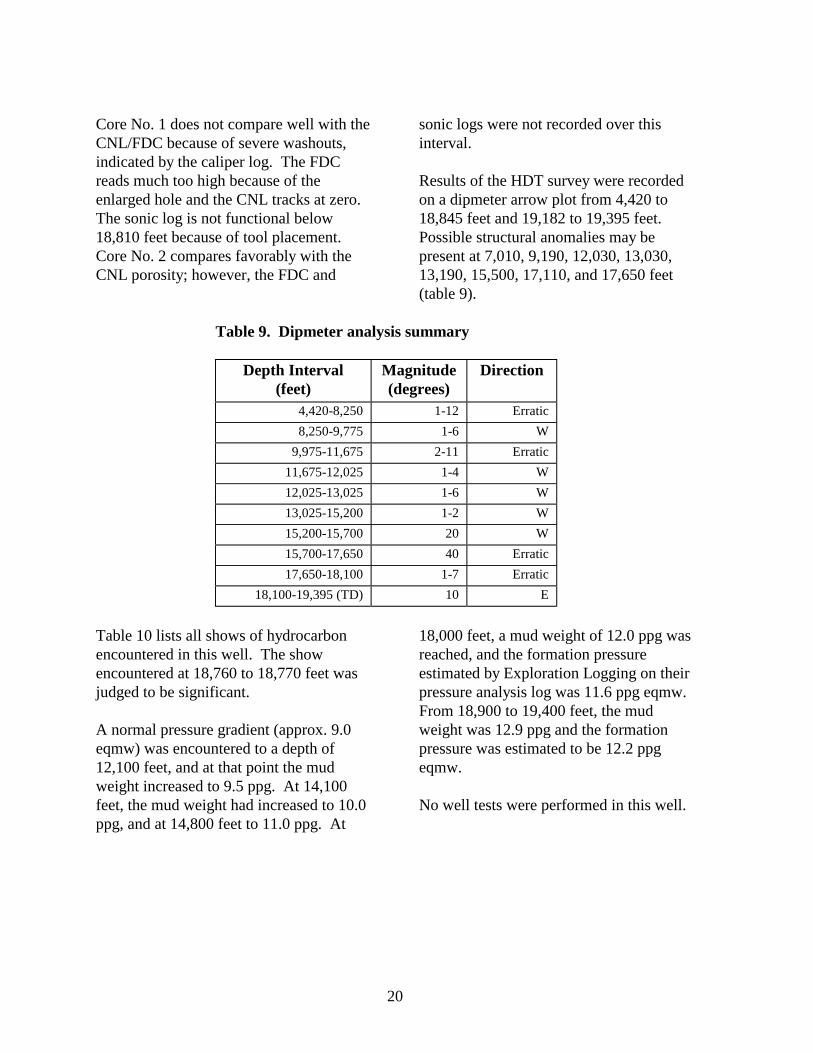
Core No. 1 does not compare well with theCNL/FDC because of severe washouts,indicated by the caliper log. The FDCreads much too high because of theenlarged hole and the CNL tracks at zero. The sonic log is not functional below18,810 feet because of tool placement. Core No. 2 compares favorably with theCNL porosity; however, the FDC and
sonic logs were not recorded over thisinterval.
Results of the HDT survey were recordedon a dipmeter arrow plot from 4,420 to18,845 feet and 19,182 to 19,395 feet. Possible structural anomalies may bepresent at 7,010, 9,190, 12,030, 13,030,13,190, 15,500, 17,110, and 17,650 feet(table 9).
Table 9. Dipmeter analysis summary
Depth Interval(feet)
Magnitude(degrees)
Direction
4,420-8,250 1-12 Erratic8,250-9,775 1-6 W
9,975-11,675 2-11 Erratic11,675-12,025 1-4 W12,025-13,025 1-6 W13,025-15,200 1-2 W15,200-15,700 20 W15,700-17,650 40 Erratic17,650-18,100 1-7 Erratic
18,100-19,395 (TD) 10 E
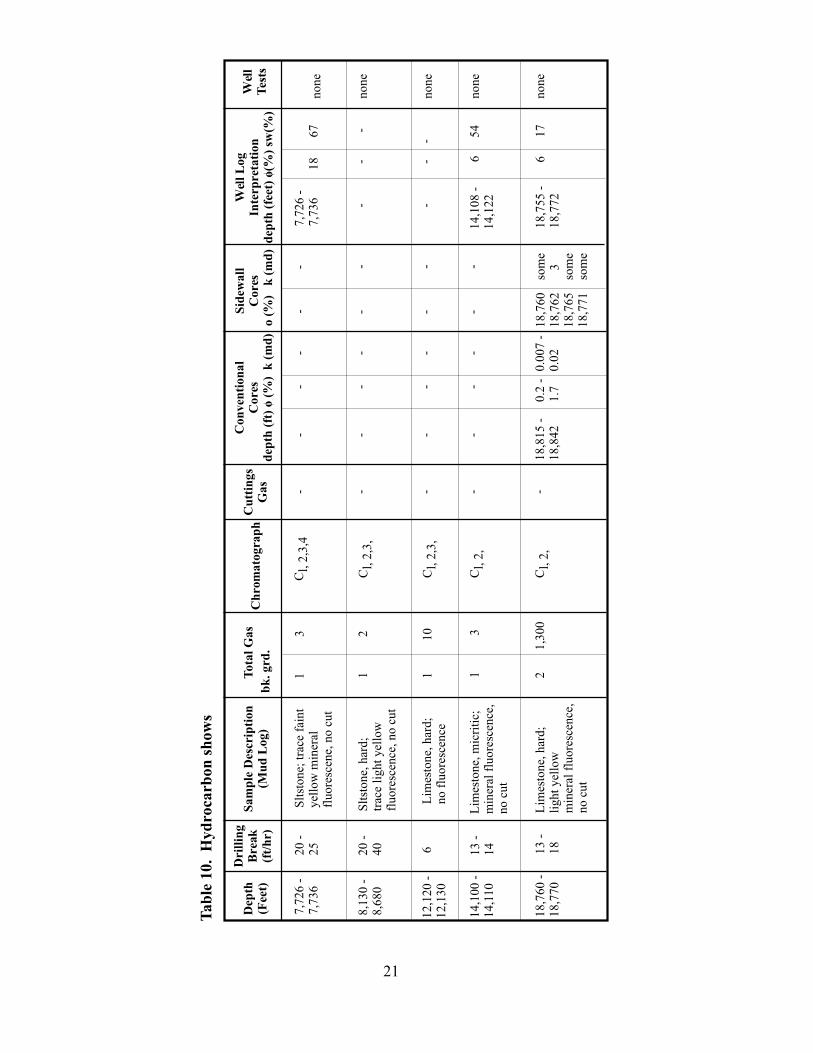
Table 10 lists all shows of hydrocarbonencountered in this well. The showencountered at 18,760 to 18,770 feet wasjudged to be significant.
A normal pressure gradient (approx. 9.0eqmw) was encountered to a depth of12,100 feet, and at that point the mudweight increased to 9.5 ppg. At 14,100feet, the mud weight had increased to 10.0ppg, and at 14,800 feet to 11.0 ppg. At
18,000 feet, a mud weight of 12.0 ppg wasreached, and the formation pressureestimated by Exploration Logging on theirpressure analysis log was 11.6 ppg eqmw.From 18,900 to 19,400 feet, the mudweight was 12.9 ppg and the formationpressure was estimated to be 12.2 ppgeqmw.
No well tests were performed in this well.
Dep
th(F
eet)
Dri
llin
gB
reak
(ft/
hr)
Sam
ple
Des
crip
tion
(Mu
d L
og)
Tot
al G
asC
hro
mat
ogra
ph
Cu
ttin
gsG
asW
ell
Tes
tsb
k. g
rd.
7,72
6 -
7,73
620
-25
13
- - - - -
- - - -
- - - -
- - - -
- - -
- - -
- -
- -
-
-
--
Slt
ston
e; t
race
fai
ntye
llow
min
eral
fluo
resc
ene,
no
cut
C
l,2,3
,4
C
l,2,3
,
C
l,2,3
,
C
l,2,
C
l,2,
Sid
ewall
Core
s o
(%
) k
(m
d)
Con
ven
tion
al
Core
sd
epth
(ft
) o (
%)
k (
md
)
Wel
l L
og
Inte
rpre
tati
on
dep
th (
feet
) o(%
) sw
(%)
7,7
26 -
7,7
36
18
67
none
none
none
none
none
8,1
30 -
8,6
80
20 -
40
Slt
stone
, har
d;tr
ace
light
yel
low
fluore
scen
ce, n
o c
ut
12
12,1
20
-12,1
30
6L
imes
tone,
har
d;
no f
luor
esce
nce
110
14,1
00
-14,1
10
13 -
14
Lim
esto
ne,
mic
riti
c;m
iner
al f
luore
scen
ce,
no c
ut
13
14,1
08
-14,1
22
654
18,7
60
-18,7
70
13 -
18
Lim
esto
ne,
har
d;
light
yell
ow
min
eral
flu
ore
scen
ce,
no c
ut
21,3
00
18,8
15
-18,8
42
0.2
-1.7
0.0
07 -
0.0
2
som
e18,7
71
so
me
18,7
65
3
18,7
62
so
me
18,7
60
18,7
55
-18,7
72
617
Ta
ble
10
. H
yd
roca
rbo
n s
ho
ws
21

22
GEOTHERMAL GRADIENT
Figure 8 shows bottomhole temperaturesfor seven logging runs in the Shell LCBlock 357 No. 1 well plotted againstdepth. A temperature of 60 0F is assumedat the seafloor at an indicated depth of 337feet (265-foot water depth plus 72-footkelly bushing elevation). Shown also is a
straight-line graph between the seafloorand total-depth temperatures in order torepresent an overall geothermal gradientfor the well, which is 1.36 0F/100 ft. Calculated geothermal gradients for allGeorges Bank wells range from 1.06 to1.40 oF/100 ft.

0
2,000
4,000
6,000
8,000
10,000
0 25 50 75 100 125 150 175 200 225 250 275 300 325 350 375
12,000
14,000
16,000
18,000
20,000
22,000
De
pth
in F
ee
t
FTemperature o
( )
Well Temperatures
Geothermal Gradient(1.36 F/100 ft)
o
Figure 8. Well temperatures and geothermal gradient for the Shell Lydonia Canyon Block 357 No. 1 well. Well temperatures from bottomhole temperatures of logging runs. Geothermal gradient based on bottomhole temperature of deepest logging run.
320 Fat 19,397’
o
23
24
BURIAL HISTORY
The burial history model for thestratigraphic section penetrated by theShell LC Block 357 No. 1 well (figure 9)is based on biostratigraphic determinationscontained in a report submitted by Shell toMMS (figure 7; table 4) and theCretaceous and Jurassic time scales of VanHinte (1976a and 1976b). In general,burial diagrams for Georges Bank wellsshow rapid Lower and Middle Jurassicsubsidence followed by moderate and thenlow burial rates through the rest of theMesozoic and Cenozoic Eras. The ShellLC Block 357 No. 1 profile is consistent
with those of the other Georges Bankwells in which Early Jurassic markerfossils were identified, the Mobil LCBlock 312 No. 1 and the Tenneco LCBlock 187 No. 1 wells.
In constructing figure 9, no adjustmentshave been made for sedimentarycompaction or for section removed byerosion. In their report, Shell applied“at/in” to most age designations; see theBiostratigraphy chapter of this report.

170180 160 150 140 130 120 110 100 90 80 70 60 50 40 30 20 10 00
Millions of Years Before Present
10,000
11,000
12,000
13,000
14,000
15,000
16,000
17,000
18,000
9,000
8,000
7,000
6,000
5,000
4,000
3,000
2,000
1,000
De
pth
in F
ee
t
UpperCretaceous
LowerCretaceous
Upper Jurassic
(?)Jurassic Lower
CampanianSantonian
Albian
BarremianHauterivian
Aptian
ValanginianKimmeridgian
Oxfordian
ConiacianCenomanian
Figure 9. Burial diagram for the Shell Lydonia Canyon Block 357 No. 1 well. Based on stage tops from Shell ( see figure 7 ).
25

26
COMPANY-SUBMITTED DATA
Data and reports were submitted by ShellOffshore, Inc., to MMS when the Shell LCBlock 357 No. 1 well was drilled, asrequired by Federal regulations and leasestipulations. Items of general geological,geophysical, and engineering usefulnessare listed below. Items not listed includeroutine submittals required by regulationand detailed operations information, suchas the Exploration Plan, Application forPermit to Drill, daily drilling reports,monthly reports, well location survey, anddrilling pressure and temperature datalogs. Well “electric” logs are listed in theFormation Evaluation chapter. Listedand unlisted company reports and data areavailable through the Public InformationUnit, Minerals Management Service, Gulf
of Mexico OCS Region, 1201 ElmwoodPark Boulevard, New Orleans, Louisiana70123-2394; telephone (504)736-2519 or1-800-200-GULF, FAX (504)736-2620. Well logs are available on microfilm fromthe National Geophysical Data Center, 325Broadway Street, Boulder CO 80303-3337, attn. Ms Robin Warnken; telephone(303)497-6338, FAX (303)497-6513; e-mail [email protected].
At a later date, additional originaltechnical data, including well logs, will beadded to the compact disk (CD) version ofthe Georges Bank well reports. The CDwill be available from the Gulf of MexicoOCS Region Public Information Unit.
SELECTED COMPANY-SUBMITTED DATA
Velocity survey computation (wellvelocity and well seismic tool data),Schlumberger Ltd., Wireline Testing,Houston TX, undated.
Physical formation (mud) log, ExplorationLogging of U.S.A., Inc., undated.
Core analysis data (conventional coreNo. 1; porosity, air permeability, and graindensity), Shell Development Co.,Petrophysical Services Laboratory,Houston TX, 08/27/82.
Core analysis data (conventional core No.2; porosity, air permeability, and graindensity), Shell Development Co.,
Petrophysical Services Laboratory,Houston TX, 10/06/82.
Sidewall cores (lithologic descriptions),Shell Offshore, Inc., New Orleans LA,undated.
Paleontological summary (stage tops),Shell Offshore, New Orleans LA,10/05/82.
Source rock study (lithologic descriptions,kerogen analysis, vitrinite reflectance,molecular geochemical analysis), ShellDevelopment Co., Geochemical Services,Houston TX, 08/18/82.

27
SELECTED REFERENCES
This list is compiled from published and unpublished Minerals Management Service andUSGS Conservation Division reports on Georges Bank wells. Not all of the references couldbe located and verified.
Albrecht, P., 1970, Etude de constituents organiques des series sedimentaries de Logbaba et Messel. Transformations deagenetiques: Universite de Strasbourg, Memoires du Service de la CargeGeologique d’Alsac et de Lorraine, no. 32, 119 p.
Amato, R.V. and J.W. Bebout, 1978, Geological and Operational Summary, COST No. GE-1 Well, SoutheastGeorgia Embayment Area, South Atlantic OCS: U. S. Geological Survey Open-File Report 78-668,122 p.
Amato, R. V. and J. W. Bebout (eds.), 1980, Geologic and Operational Summary, COST No. G-1 Well,Georges Bank Area, North Atlantic OCS: U. S. Geological Survey Open-File Report 80-268, 112 p.
Amato, R.V., and E.K. Simonis (eds.), 1979, Geologic and Operational Summary, COST No. B-3 Well,Baltimore Canyon Trough Area, Mid-Atlantic OCS: U.S. Geological Survey Open-File Report 79-1159, 118 p.
Amato, R.V. and E.K. Simonis,(eds.), 1980, Geologic and Operational Summary, COST No. G-2 Well,Georges Bank Area, North Atlantic OCS: U. S. Geological Survey Open-File Report 80-269, 116 p.
BBN-Geomarine Services Co., 1975, COST wellsite G-1, Georges Bank, engineering geology interpretation ofhigh-resolution geophysical data: Houston, Texas, 11 p.
Ballard, R. D. and E. Uchupi, 1975, Triassic rift structure in Gulf of Maine: American Association of PetroleumGeologists Bulletin, v. 59, no. 7, p. 1041-1072.
Bayliss, G. S., 1980, Source-rock evaluation reference manual: Houston, Texas, Geochem Laboratories, Inc., 80p.
Bebout, J. W., 1980, Observed stratigraphic distribution of spores, pollen, and incertae sedis palynomorphs inthe Tertiary section of the COST No. B-2 well, Baltimore Canyon, Atlantic Outer Continental Shelf: Palynology, v. 4, p. 181-196.
Bebout, J. W., 1981, An informal palynologic zonation for the Cretaceous System of the United States Mid-Atlantic (Baltimore Canyon area) Outer Continental Shelf: Palynology, v. 5, p. 159-194.
Berggren, W.A., D.V. Kent, C.C. Swisher III, and M.P. Aubry, 1995, A revised Cenozoic geochronology andchronostratigraphy; in Geochronology Time Scales and Global Stratigraphic Correlation, SEPMSpecial Publication no. 54, p. 129-212.
Bhat, H., N. J. McMillan, J. Aubert, B. Porthault, and M. Surin, 1975, North American and African drift--therecord in Mesozoic coastal plain rocks, Nova Scotia and Morocco, in Yorath, C. J., E. R. Parker, andD. J. Glass, (eds.), Canada’s Continental Margins and Offshore Petroleum Exploration: CanadianSociety of Petroleum Geologists Memoir 4, p. 375-389.
Brideau, W. W. and W. C. Elsick, (eds.), 1979, Contributions of stratigraphic palynology (v. 2), MesozoicPalynology: American Association of Stratigraphic Palynologists Contributions Series No. 4.

28
Bronnimann, P., 1955, Microfossils incertae sedis from the Upper Jurassic and Lower Cretaceous of Cuba: Micropaleontology, v. 1, pp. 28, 2 pl., 10 text.
Bujak, J. P., M. S. Barss, and G. L. Williams, 1977, Offshore east Canada’s organic type and color andhydrocarbon potential: Oil and Gas Journal, v. 75, no. 15, p. 96-100.
Bujak, J. P. and M. J. Fisher, 1976, Dinoflagellate cysts from the Upper Triassic of Arctic Canada: Micropaleontology, v. 22, p. 44-70, 9 pls.
Bujak, J. P, and G. L. Williams, 1977, Jurassic palynostratigraphy of offshore eastern Canada, in Swain, F. M.,(ed.), Stratigraphic Micropaleontology of Atlantic Basin and Borderlands: New York, ElsevierScientific Publishing Co., p. 321-339.
Bukry, D., 1969, Upper Cretaceous coccoliths from Texas and Europe: University of Kansas PaleontologicalContributions, Art. 5 (Protista 2), p. 1-9, 50 pl., 1 text.
Burk, C. A. and C. L. Drake, (eds.), 1974, Geology of Continental Margins: New York, Springer-Verlag, 1,009p.
Burke, K., 1975, Atlantic evaporites formed by evaporation of water spilled from Pacific, Tethyan, and southernoceans: Geology, v. 3, no. 11, p. 613-616.
Cepek, P. and W. W. Hay, 1970, Zonation of the Upper Cretaceous using calcareous nannoplankton: Palaontologische Abhandlungen, Abtelung B Palabotanik, Band III, Heft 3/4, p. 333-340.
Cita, M. B. and S. Gartner, 1971, Deep Sea Upper Cretaceous from the western North Atlantic: in ProceedingsII International Planktonic Conference, Roma, 1970: Rome, Edizioni Tecnoscienza, v. 1, p. 287-319.
Clarke, R. F. A, and J. P. Verdier, 1967, An investigation of microplankton assemblages from the chalk of theIsle of Wight, England: Verhandelingen der Koninklijke Nederlandische Akademie vanWetenschappen, Afdeeling Natuurkunde, and Eerste Reeks, 24, p. 1-96.
Claypool, G. E., C. M. Lubeck, J. P. Baysinger, and T. G Ging, 1977, Organic geochemistry, in Scholle, P. A.,(ed.), Geological studies on the COST No. B-2 well, U. S. Mid-Atlantic Outer Continental Shelf area: U. S. Geological Survey Circular 750, p. 46-59.
Connan, J. 1974, Time-temperature relation in oil genesis: American Association of Petroleum GeologistsBulletin, v. 58, no. 12, p. 2516-2521.
Core Laboratories, Inc., 1976, Core studies, COST Atlantic well No. G-1, Georges Bank, Offshore AtlanticOcean: Dallas, Texas, 153 p.
Core Laboratories, Inc., 1977a, Core studies, COST Atlantic well No. G-2, Georges Bank, Offshore AtlanticOcean: Dallas, Texas, 298 p.
Core Laboratories, Inc., 1977b, Geochemical service report, COST G-2 Atlantic well, Georges Bank, offshoreMassachusetts, U. S. A.: Dallas, Texas, 147 p.
Council on Environmental Quality, 1974, OCS oil and gas--An environmental assessment--A report to thePresident by the Council on Environmental Quality: Washington, D. C. (U. S. Government PrintingOffice), Stock No. 4000-00322, v. 1, 214 p.
Cousminer, H. L., W. E. Steinkraus, and C. E. Fry, 1982, Biostratigraphy and thermal maturation profile, Exxon133 No. 1 (OCS-A-0170) well section: Unpublished Report, Minerals Management Service.

29
Cousminer, H. L., W. E. Steinkraus, and R. E. Hall, 1984, Biostratigraphic restudy documents Triassic/Jurassicsection in Georges Bank COST G-2 well (abstract): Proceedings of the American Association ofPetroleum Geologists, Annual Meeting, San Antonio, Texas, v. 68, no. 4, p. 466.
Cousminer, H. L., 1984, Canadian dinoflagellate zones (Middle Jurassic to Middle Eocene) in Georges BankBasin (abstract): Proceedings of the American Association of Stratigraphic Palynologists, Arlington,Virginia, v. 9, p. 238.
Davey, R. J. and J. P. Verdier, 1974, Dinoflagellate cysts from the Aptian type sections at Gargas and LaBedoule, France: Paleontology, v. 17, pt. 3, p. 623-653.
Davey, R. J., 1979, The stratigraphic distribution of dinocysts in the Portlandian (latest Jurassic) to Barremian(Early Cretaceous) of northwest Europe: American Association of Stratigraphic PalynologistsContributions, Series No. 5B, p. 49-81.
Davies, E. H., 1985, The miospore and dinoflagellate cyst oppel-zonation of the Lias of Portugal: Palynology, v.9, p. 105-132.
Dorhofer, G. and E. H. Davies, 1980, Evolution of archeopyle and tabulation in Rhaetogonyaulaciandinoflagellate cysts: Royal Ontario Museum, Life Sciences Miscellaneous Publications, p. 1-91, fig. 1-40.
Dow, W. G., 1974, Application of oil-correlation and source-rock data to exploration in Williston Basin: American Association of Petroleum Geologists Bulletin, v. 58, no. 7, p. 1253-1262.
Dow, W. G., 1977, Kerogen studies and geological interpretations: Journal of Geochemical Exploration, v. 7, p.79-99.
Drake, C. L., J. I. Ewing, and H. Stockard, 1968, The continental margin of the eastern United States: CanadianJournal of Earth Science, v. 5, no. 4, p. 993-1010.
Drake, C. L., M. Ewing, and G. H. Sutton, 1959, Continental margins and geosynclines--The east coast of NorthAmerica north of Cape Hatteras, in Aherns, L. H., and others, (eds.), Physics and Chemistry of theEarth, v. 3: New York, Pergamon, p. 110-198.
Eliuk, L. S., 1978, the Abenaki Formation, Nova Scotia, Canada--A depositional and diagenetic model for aMesozoic carbonate platform: Bulletin of Canadian Petroleum Geology, v. 26, no. 4, p. 424-514.
Emery, K. O. and E. Uchipi, 1972, Western North Atlantic Ocean--Topography, rocks, structure, water, life, andsediments: American Association of Petroleum Geologists Memoir 17, 532 p.
Evitt, W. R., (ed.), 1975, Proceedings of a forum on dinoflagellates: American Association of StratigraphicPalynologists Contributions, Series No. 4, 76 p.
Folger, D. W., 1978, Geologic hazards on Georges Bank--an overview: Geological Society of AmericaAbstracts with Programs, v. 10, no. 1, p. 42.
Fry, C. E., 1979, Geothermal gradient, in Amato, R. V. and E. K. Simonis (eds.), Geologic and OperationalSummary, COST No. B-3 well, Baltimore Canyon Trough Area, Mid-Atlantic OCS: U. S. GeologicalSurvey Open-File Report 79-1159, p. 64-65.
Gartner, S., Jr., 1968, Coccoliths and related calcareous nannofossils from Upper Cretaceous deposits of Texasand Arkansas: University of Kansas Paleontological Contributions, no. 48, Protista, v. 48, Art. 1, p. 1-56.

30
GeoChem Laboratories, Inc., 1976, Hydrocarbon source facies analysis, COST Atlantic G-1 well, GeorgesBank, offshore Eastern United States: Houston, Texas, 10 p.
GeoChem Laboratories, Inc., 1977, Hydrocarbon source facies analysis, COST Atlantic G-2 well, GeorgesBank, offshore eastern United States: Houston, Texas, 66 p.
Gibson, T. G., 1970, Late Mesozoic-Cenozoic tectonic aspects of the Atlantic coastal margin: GeologicalSociety of America Bulletin, v. 81, no. 6, p. 1813-1822.
Gitmez, G. U. and W. A. S. Sarjeant, 1972, Dinoflagellate cysts and acritarchs from the Kimmeridgian (UpperJurassic) of England, Scotland and France: Bulletin of the British Museum of Natural History:Geology, v. 21, p. 171-257.
Given, M. M., 1977, Mesozoic and Early Cenozoic geology of offshore Nova Scotia: Bulletin of CanadianPetroleum Geology, v. 25, p. 63-91.
Gocht, H., 1970, Dinoflagellaten-Zysten aus dem Bathonium des erdolfeldes Aldorf (Northwest-Setuschland): Palaeontographics, Abt. B., v. 129, p. 125-165.
Gorka, H., 1963, Coccolithophorides, Dinoflagellates, Hystrichosphaerides et microfossiles incertae sedis duCretace superier de Pologne: Acta Palaeontological Polonica, v. 8, p. 1-82.
Gradstein, F.M., F.P.Achterberg, J.G. Ogg, J.Hardenbol, P. van Veen, and Z. Huang, 1995, A Triassic, Jurassic,and Cretaceous time scale; in Geochronology Time Scales and Stratigraphic Correlation, SEPMSpecial Publication no. 54, p. 95-126.
Grose, P. L. and J. S. Mattson, 1977, The Argo Merchant oil spill--A preliminary scientific report: NationalOceanic and Atmospheric Administration Environmental Research Laboratories, 129 p.
Grow, J. A., R. E. Mattick, and J. S. Schlee, 1979, Multichannel seismic depth sections and interval velocitiesover continental shelf and upper continental slope between Cape Hatteras and Cape Cod, in Watkins, J.S., L. Montadert, and P. W. Dickerson, (eds.), Geological and Geophysical Investigations ofContinental Margins: American Association of Petroleum Geologists Memoir 29, p. 65-83.
Harwood, R. J., 1977, Oil and gas generation by laboratory pyrolysis of kerogen: American Association ofPetroleum Geologists Bulletin, v. 61, no. 12, p. 2082-2102.
Hill, M. E., III, 1976, Lower Cretaceous Nannofossils from Texas and Oklahoma: Paleontographica, AbtelungB, 156, Lfg. 4-6, p. 103-179.
Hunt, J. M., 1967, The origin of petroleum in carbonate rocks: in G. V. Chilingar, H. S. Bissell, and R. W.Fairbridge, (eds.), Carbonate Rocks: New York, Elsevier, p. 225-251.
Hunt, J. M., 1974, Hydrocarbon and kerogen studies, in C. C von der Borch and others, Initial Reports of theDeep Sea Drilling Project, v. 22: Washington, D. C., U. S. Government Printing Office, p. 673-675.
Hunt, J. M., 1978, Characterization of bitumens and coals: American Association of Petroleum GeologistsBulletin, v. 62, no. 2, p. 301-303.
Hunt, J. M., 1979, Petroleum Geochemistry and Geology: San Francisco, W. H. Freeman Co., p. 273-350.
Hurtubise, D. O. and J. H. Puffer, 1985, Nepheline normative alkalic dolerite of the Georges Bank Basin, NorthAtlantic, part of an Early Cretaceous eastern North American alkalic province: Geological Society ofAmerica, Northeastern Section, 20th Annual Meeting, 1985, v. 17, no. 1, p. 25.

31
Hurtubise, D. O., J. H. Puffer, and H. L. Cousminer, 1987, An offshore Mesozoic igneous sequence, GeorgesBank Basin, North Atlantic: Geological Society of America Bulletin, v. 98, no. 4, p. 430-438.
International Biostratigraphers, Inc., 1976, Biostratigraphy of the COST G-1 Georges Bank test: Houston,Texas, 16 p.
International Biostratigraphers, Inc., 1977, Biostratigraphy of the COST G-2 Georges Bank test: Houston,Texas, 16 p.
Jansa, L. F. and J. A. Wade, 1975, Geology of the continental margin off Nova Scotia and Newfoundland, in W.J. M van der Linden and J. A. Wade (eds.), Offshore Geology of Eastern Canada: Geological Survey ofCanada Paper 74-30, v. 2, p. 51-105.
Jansa, L. F., G. L. Williams, J. A. Wade, and J P. Bujak, 1978, COST B-2 well (Baltimore Canyon) and itsrelation to Scotian Basin (abstract): American Association of Petroleum Geologists Bulletin, v. 62, no.3, p. 526.
Jansa, L. F. and J. Wiedmann, 1982, Mesozoic-Cenozoic development of the eastern North American andnorthwest African continental margins: a comparison, in V. von Rad, K. Hinz, M.Sarnthein, and E.Seibold (eds.), Geology of the Northwest African Continental Margin: Berlin, Springer-Verlag, p. 215-269.
Jones, R. W. and T. A. Edison, 1978, Microscopic observations of kerogen related to geochemical parameterswith emphasis on thermal maturation, in D. F Oltz (ed.), Geochemistry: Low TemperatureMetamorphism of Kerogen and Clay Minerals: Society of Economic Paleontologists and Mineralogists,Pacific Section, Annual Meeting, Los Angeles, p. 1-12.
Kent, D. V. and F. M. Gradstein, 1986, A Jurassic to Recent chronology, in P. R. Vogt and B. E. Tucholke(eds.), The Geology of North America, vol. M, The Western North Atlantic Region: Geological Societyof America, p. 45-50.
King, L. H. and B. MacLean, 1975, Geology of the Scotian Shelf and adjacent areas: Canadian GeologicalSurvey Paper 74-23, p. 22-53.
Kinsman, D. J. J., 1975, Rift Valley basins and sedimentary history of trailing continental margins, in A. G.Fisher and S. Judson, (eds.), Petroleum and Global Tectonics: Princeton, Princeton University Press,p. 83-126.
Kjellstrom, G., 1973, Maastrichtian microplankton from the Hollviken borehole No. 1 in Scania, southernSweden: Sveriges Geologiska Undersokning, Afhandligar och Uppsatser, v. 7, p. 1-59.
Landes, K. K. 1967, Eometamorphism and oil and gas in time and space: American Association of PetroleumGeologists Bulletin, v. 51, no. 6, p. 828-841.
LaPlante, R. E., 1974, Hydrocarbon generation in Gulf Coast tertiary sediments: American Association ofPetroleum Geologists Bulletin, v. 58, no. 7, p. 1281-1289.
Larskaga, Ye. S. and D. V. Zhabreu, 1964, Effects of stratal temperatures and pressures on the composition ofdispersed organic matter (from the example of the Mesozoic-Cenozoic deposits of the WesternCiccaspian region): Dokl. Akad. Nauk SSSR, v. 157, no. 4, pp. 135-139.
Lentin, J. K. and G. L. Williams, 1981, Fossil Dinoflagellates, Index to Genera and Species: Bedford Institute ofOceanography Report Series B1-R-81-12, p. 1-345.
32
Louis, M. C. and B. P. Tissot, 1967, Influence de la temperature et de la pression sur la formation deshydrocarbures dans les argiles a kerogen [Influence of temperature and pressure on the generation ofhydrocarbons in shales containing kerogen], in 7th World Petroleum Congress, Proceedings, (Mexico),v. 2: Chichester, International, John Wiley and Sons, p. 47-60.
Lowell, J. D., G. J. Genik, T. H. Nelson, and P. M. Tucker, 1975, Petroleum and plate tectonics of the southernRed Sea, in A. G Fisher and S. Judson, (eds.), Petroleum and Global Tectonics: Princeton UniversityPress, Princeton, p. 129-153.
McIver, N. L., 1972, Cenozoic and Mesozoic stratigraphy of the Nova Scotia shelf: Canadian Journal of EarthSciences, v. 9, p. 54-70.
MacLean, B.C., and J.A. Wade, 1992, Petroleum geology of the continental margin south of the islands of St.Pierre and Miquelon, offshore eastern Canada; Bulletin of Canadian Petroleum Geology, v. 40, no. 3,p. 222-253.
Maher, J. C., 1971, Geologic Framework and Petroleum Potential of the Atlantic Coastal Plain and ContinentalShelf: U. S. Geological Survey Professional Paper 659, 98 p.
Martini, E., 1971, Standard Tertiary and Quaternary calcareous nannoplankton zonation in Proceedings IIInternational Planktonic Conference, Roma, 1970: Rome, Edizioni Tecnoscienza, p. 739-785.
Mattick, R. E., R. Q. Foote, N. L. Weaver, and M. S. Grim, 1974, Structural framework of United StatesAtlantic Outer Continental Shelf north of Cape Hatteras: American Association of PetroleumGeologists Bulletin, v. 58, no. 6, 1179-1190.
Miller, R. E., H. E. Lerch, G. E. Claypool, M. A. Smith, D. K. Owings, D. T. Lignon, and S. B. Eisner, 1982,Organic geochemistry of the Georges Bank basin COST Nos. G-1 and G-2 wells, in P. A. Scholle andC. R. Wenkam (eds.), Geological Studies of the COST Nos. G-1 and G-2 Wells, Unites States NorthAtlantic Outer Continental Shelf: U. S. Geological Survey Circular 861, p. 105-142.
Miller, R. E., R. E. Mattick, and H. E. Lerch, 1981, Petroleum geochemistry and geology of Cenozoic andMesozoic sedimentary rocks from Georges Bank basin (abstract): American Association of PetroleumGeologists Bulletin, v. 65, no. 9, p. 1667.
Miller, R. E., D. M. Schultz, G. E. Claypool, H. E. Lerch, D. T. Lignon, C. Gary, and D. K. Owings, 1979,Organic geochemistry, in , P. A Scholle (ed.), Geological Studies of the COST GE-1 Well, UnitedStates South Atlantic Outer Continental Shelf Area: U. S. Geological Survey Circular 800, p. 74-92.
Miller, R. E., D. M. Schultz, G. E. Claypool, M. A. Smith, H. E. Lerch, D. Ligon, D. K. Owings, and C. Gary,1980, Organic geochemistry, in P.A. Scholle (ed.), Geological Studies of the COST No. B-3 Well,United States Mid-Atlantic Continental Slope Area: U. S. Geological Survey Circular 833, p. 85-104.
Miller, R. E., D. M. Schultz, H. E. Lerch, D. T. Lignon, and P. C. Bowker, 1986, in Edson, G. M.(ed.), ShellWilmington Canyon 586-1 Well, Geological and Operation Summary: Minerals Management Service,OCS Report MMS 86-0099, p. 37-44.
Miller, R. E., D. M. Schultz, H. E. Lerch, D. T. Lignon, and P. C. Bowker, 1987, in Edson, G. M. (ed.), ShellWilmington Canyon 587-1 Well, Geological and Operation Summary: Minerals Management Service,OCS Report MMS 87-0074, p. 39-46.
Momper, J. A., 1978, Oil migration limitations suggested by geological and geochemical considerations, inPhysical and Chemical Constraints on Petroleum Migration: American Association of PetroleumGeologists, Continuing Education Course Note Series No., 8, p. B1-B60.

33
Morbey, S. J., 1975, The palynostratigraphy of the Rhaetian Stage Upper Triassic in the KerdelbachgrabenAustria: Paleontographica Abtrlung B, v. 152, p. 1-75, p. 1-19.
Murray, G. E., 1961, Geology of the Atlantic and Gulf Coastal Provinces of North America: New York, Harper,692 p.
Orr, W. L., 1974, Changes in sulfur content and isotopic ratios of sulfur during petroleum maturation--study ofBig Horn Basin Paleozoic oils: American Association Petroleum Geologists Bulletin, v. 58, no. 11, p.2295-2318.
Perry, W. J., J. P. Minard, E. G. A. Weed, E. I. Robbins, and E. C. Rhodehamel, 1975, Stratigraphy of theAtlantic continental margin of the United States north of Cape Hatteras--brief survey: AmericanAssociation of Petroleum Geologists Bulletin, v. 59, no. 9, p. 1529-1548.
Phillipi, G. T., 1957, Identification of oil-source beds by chemical means, in 20th International GeologicalCongress Proceedings: Mexico City (1956), Sec. 3, p. 25-38.
Phillipi, G.T., 1965, On the depth, time, and mechanism of petroleum generation: Geochim. Cosmochim. Acta,v. 29, p. 1021.
Postuma, J. A., 1971, Manual of Planktonic Foraminifera: New York, Elsevier, 420 p.
Pusey, W. C., III, 1973, The ESR-kerogen method--how to evaluate potential gas and oil source rocks: WorldOil, v. 176, no. 5, p. 71-75.
Reinhardt, P., 1966, Zur taxonomie and biostratigraphie des fossilen nannoplanktons aus dem Malm, der Kreideund dem Alttertiar Mitteleuropas [Taxonomy and biostratigraphy of Malm, Cretaceous, and earlyTertiary nannoplanktoanic faunas of central Europe], Frieberger Forschungshefte, Reihe C: Geowissenschaften, Mineralogie-Geochemie, 196 Paleont.: Leipzig, Bergakademie Freiberg, p. 5-61.
Ricciardi, K. (ed.), 1989, Exxon Lydonia Canyon 133-1 Well, Geological and Operational Summary: MineralsManagement Service OCS Report MMS 89-0007, 46 p.
Riding, J. B., 1984, Dinoflagellate cyst range-top biostratigraphy of the uppermost Triassic to lowermostCretaceous of northwest Europe: Palynology, v.8, p. 195-210.
Robbins, E. I. and E. C. Rhodehamel, 1976, Geothermal gradients help predict petroleum potential of ScotianShelf: Oil & Gas Journal, v. 74, no. 9, p. 143-145.
Rona, P. A., 1973, Relations between rates of sediment accumulation on continental shelf, sea-floor spreading,and eustasy inferred from central North Atlantic: Geological Society of America Bulletin, v. 84, no. 9,p. 2851-2872.
Ryan, W. B. F., M. B. Cita, R. L. Miller, D. Hanselman, B. Hecker, and M. Nibbelink, 1978, Bedrock geologyin New England submarine canyons: Oceanologia Acta, v. 1, no. 2, p. 233-254.
Sarjeant, W. A. S., 1979, Middle and Upper Jurassic dinoflagllate cysts--the world excluding North America: American Association of Stratigraphic Palynologists Contributions Series no. 5-B, p. 133-157.
Schlee, J. S., J. C. Behrendt, J. A. Grow, J. M. Robb, R. E. Mattick, P. T. Taylor, and B. J. Lawson, 1976,Regional geologic framework off northeastern United States: American Association of PetroleumGeologists Bulletin, v. 60, no. 6, p. 926-951.
34
Schlee, J. S., W. P. Dillon, and J. A. Dillon, 1979, Structure of the continental slope off the eastern UnitedStates, in L. J.Doyle and O. H. Pilkey, (eds.), Geology of Continental Slopes: Society of EconomicPaleontologists and Mineralogists Special Publication 27, p. 95-117.
Schlee, J.S. and K.D. Klitgord, 1988, Georges Bank basin: a regional synthesis; in R.E. Sheridan and J.A. Grow(eds.), The Geology of North America, vol. I-2, The Atlantic Continental Margin, Geological Societyof America, p. 243-268.
Schlee, J. S., R. G. Martin, R. E. Mattick, W. P. Dillon, and M. M. Ball, 1977, Petroleum geology of the U. S.Atlantic--Gulf of Mexico margins, in V. S Cameron (ed.), Exploration and Economics of the PetroleumIndustry--New Ideas, Methods, New Developments: Southwestern Legal Foundation: New York,Mathew Bender and Co., v. 15, p. 47-93.
Schlee, J. S., R. E. Mattick, D. J. Taylor, O. W. Girard, E. C., Rhodehamel, W. J. Perry, and K. C. Bayer, 1975,Sediments, structural framework, petroleum potential, environmental conditions and operationconsiderations of the United States North Atlantic Outer Continental Shelf: U. S. Geological Survey,Open-File Report 75-353, 179 p.
Scholle, P. A. and C. R. Wenkam (eds.), 1982, Geological studies of the COST Nos. G-1 and G-2 wells, UnitedStates North Atlantic OCS: U. S. Geological Survey Circular 861, 193 p.
Schultz, L. K. and R. L. Grover, 1974, Geology of Georges Bank Basin: American Association of PetroleumGeologists Bulletin, v. 58, no. 6, p. 1159-1168.
Schwab, K.W., P. van Gijzel, and M.A. Smith, 1990, Kerogen evolution and microscopy workshop short course,International Symposium on Organic Petrology, Zeist, the Netherlands, January 10 and 11, 1990(unpublished).
Shell Canada Limited, 1970a, Well history report, Oneida O-25, 50 p.
Shell Canada Limited, 1970b, Well history report, Mohawk B-93, 25 p.
Shell Canada Limited, 1972, Well history report, Mohican I-100, 76 p.
Sheridan, R. E., 1974a, Conceptual model for the block-fault origin of the North American Atlantic continentalmargin geosyncline: Geology, v. 2, no. 9, p. 465-468.
Sheridan, R. E., 1974b, Atlantic continental margin of North America, in C. A. Burk and C. L. Drake, (eds.),Geology of Continental Margins: New York, Springer-Verlag, p. 391-407.
Sheridan, R. E., 1976, Sedimentary basins of the Atlantic margin of North America: Tectonophysics, v. 36, p.113-132.
Sherwin, D. F., 1973, Scotian Shelf and Grand Banks, in R. G. McCrossan (ed.), Future Petroleum Provinces ofCanada--Their Geology and Potential: Canadian Society of Petroleum Geologists Memoir 1, p. 519-559.
Singh, C., 1971, Lower Cretaceous microfloras of the Peace River area, northwestern Alberta: Research Councilof Alberta Bulletin 28, 2 volumes, 542 p.
Smith, H. A., 1975, Geology of the West Sable structure: Bulletin of Canadian Petroleum Geology, v. 23, no. 1,p. 109-130.

35
Smith, M. A., 1979, Geochemical analysis, in R. V. Amato and E. K. Simonis (eds.), Geologic and OperationalSummary, COST No. B-3 Well, Baltimore Canyon Trough Area, Mid-Atlantic OCS: U. S. GeologicalSurvey Open-File Report 79-1159, p. 81-99.
Smith, M. A., 1995, Assessment of U.S. Atlantic hydrocarbon resources using new geochemical technology:U.S. Geological Society of America, Abstracts with programs, 1995 Annual Meeting, New Orleans,LA.
Smith, M.A., R.V. Amato, M.A. Furbush, D.M. Pert, M.E. Nelson, J. S. Hendrix, L.C. Tamm, G. Wood, Jr., andD.R. Shaw, 1976, Geological and Operational Summary, COST No. B-2 Well, Baltimore CanyonTrough Area, Mid-Atlantic OCS: U. S. Geological Survey Open-File Report 76-774, 79 p.
Smith, M.A., and P. van Gijzel, 1990, New perspectives on the depositional and thermal history of GeorgesBank; in W.J.J. Fermont and J.W. Weegink (eds.), Proceedings, International Symposium on OrganicPetrology, Zeist, the Netherlands.
Smith, M. A. and D. R. Shaw, 1980, Geochemical analysis, in R. V. Amato and J. W. Bebout (eds.), Geologicand Operational Summary, COST No. G-1 well, Georges Bank Area, North Atlantic OCS: U. S.Geological Survey Open-File Report 80-268, p. 81-94.
Smith, M. A., 1980, Geochemical analysis, in R.V. Amato and E.K. Simonis (eds.), Geologic and OperationalSummary, COST No. G-2 Well, Georges Bank Area, North Atlantic OCS: U. S. Geological SurveyOpen-File Report, 80-269, p. 77-99.
Smith, R. A., J. R. Stack, and R. K. Davis, 1976, An oil spill risk analysis for the Mid-Atlantic OuterContinental Shelf lease area: U. S. Geological Survey Open-File Report 76-451, 24 p.
Staplin, F. L., 1969, Sedimentary organic matter, organic metamorphism, and oil and gas occurrence: Bulletinof Canadian Petroleum Geology, v. 17, no. 1, p. 47-66.
Steinkraus, W. E., 1980, Biostratigraphy, in R. V. Amato and J. W. Bebout, (eds.), Geologic and OperationSummary, COST No. G-1 Well, Georges Bank, North Atlantic OCS: U. S. Geological Survey Open-File Report 80-268, p. 39-51.
Stewart, H. B., Jr. and G. F. Jordan, 1964, Underwater sand ridges on Georges Shoal, in R. L. Miller (ed.),Papers in Marine Geology, Shepard Commemorative Volume: New York, Macmillan, p. 102-114.
Tamm, L. C., 1978, Electric log interpretations, in R. V. Amato and J. W. Bebout (eds.), Geological andOperational Summary, COST No. GE-1 Well, Southeast Georgia Embayment Area, South AtlanticOCS: U. S. Geological Survey Open-File Report 78-668, 61-75.
Thierstein, H. R., 1971, Tentative Lower Cretaceous calcareous nannoplankton zonation: Ecolgae GeologicaeHelvetiae, v. 64, p. 459-487.
Tissot, B., B. Durand, J. Espitalie, and A. Combaz, 1974, Influence of nature and digenesis of organic matter information of petroleum: American Association of Petroleum Geologists Bulletin, v. 58, no. 3, p. 499-506.
Tissolt, B. P. and D. H. Welte, 1978, Petroleum Formation and Occurrence, A New Approach to Oil and GasExploration: Berlin, Springer-Verlag, p. 123-201.
Tschudy, R. H., 1973, Complexiopollis Pollen Lineage in Mississippi Embayment Rocks: U. S. GeologicalSurvey Professional Paper 743-C, p. C1-C15.

36
Uchupi E. and K. O. Emery, 1967, Structure of continental margin off Atlantic coast of United States: American Association of Petroleum Geologists Bulletin, v. 51, no. 2, p. 223-234.
U. S. Department of Commerce, 1973, Environmental Conditions within Specified Geographical Regions--Offshore East and West Coast of the United States and in the Gulf of Mexico: Washington, D. C.,National Oceanographic Data Center, National Oceanographic and Atmospheric Administration, 735 p.
Van Gijzel, P., 1990, Transmittance colour index (TCI) of amorphous organic matter: a new thermal maturityindicator for hydrocarbon source rocks, and its correlation with mean vitrinite reflectance and thermalalteration index (TAI); in W.J.J. Fermont and J.W. Weegink, eds., Proceedings, InternationalSymposium on Organic Petrology, Zeist, the Netherlands.
Van Hinte, J. E., 1976a, A Jurassic time scale: American Association of Petroleum Geologists Bulletin, v. 60,no. 4, p. 489-497.
Van Hinte, J. E., 1976b, A Cretaceous time scale: American Association of Petroleum Geologists Bulletin, v.60, no. 4, p. 498-516.
Vassoyevich, N. B., Yu. I. Korchagina, N. V. Lopatin, and V. V. Chernyshev, 1969, Glavanaya fazanefteobrazovaniya [Principal phase of oil formation]: Moskovskogo Universiteta Vestnik, Ser. 4,Geologii, v. 24, no. 6, p. 3-27: English translation in International Geology Review, 1970, v. 12, no.11, p. 1,276-1,296.
Wade, H.A., 1977, Stratigraphy of Georges Bank Basin-- interpretation from seismic correlation to the westernScotian Shelf: Canadian Journal of Earth Science, v. 14, no. 10, p. 2274-2283.
Wade, J.A., G.R.Campbell, R.M. Proctor, and G.C. Taylor, 1989, Petroleum Resources of the Scotian Shelf,Geological Survey of Canada Paper 88-19.
Walper, J. L. and R. E. Miller, 1985, Tectonic evolution of Gulf Coast basins, in B. F. Perkins and G. B. Martin(eds.), Habitat of Oil and Gas, Program and Abstracts, Fourth Annual Research Conference, Gulf CoastSection: Austin, Society of Economic Paleontologists and Mineralogists Foundation, EarthEnterprises, p. 25-42.
Waples, D. W., 1980, Time and temperature in petroleum formation--application of Lopatin’s method topetroleum exploration: American Association of Petroleum Geologists Bulletin, v. 64, no. 6, p. 916-926.
Weed, E. G. A., J. P. Minard, W. J. Perry, Jr., E. C. Rhodehamel, and E. I. Robbins, 1974, Generalized pre-Pleistocene geologic map of the northern United States Atlantic continental margin: U. S. GeologicalSurvey Miscellaneous Geologic Investigations Map I-861, Scale 1:1,000,000.
Williams, G. L., 1974, Dinoflagellate and spore stratigraphy of the Mesozoic-Cenozoic offshore EasternCanada, in Offshore Geology of Eastern Canada: Geological Survey of Canada Paper 74-30, v. 2, p.107-161.
Williams, G. L., 1977, Dinocysts--their classification, Biostratigraphy, and paleoecology, in A. T. S. Ramsay(ed.), Oceanic Micropaleontology, v. 2, New York, Academic Press, p. 1,231-1,326.
Williams, G. L. and W. W. Brideaux, 1975, Palynologic analyses of Upper Mesozoic and Cenozoic rocks of theGrand Banks, Atlantic Margin: Geological Survey of Canada Bulletin, v. 236, p. 1-163.
Woollam, R. and J. B. Riding, 1983, Dinoflagellate cyst zonation of the English Jurassic: Institute of GeologicalSciences Report, v. 83, No. 2, p. 1.

37
Worsley, T. R., 1971, Calcareous nannofossil zonation of Upper Jurassic and Lower Cretaceous sediments fromthe Western Atlantic, in Proceedings II, International Planktonic Conference, Roma, 1970: Rome,Edizioni Tecnoscienza, p. 1301-1321.