mmid system with polarization diversity for id and vital ... · pdf filemmid system with...
TRANSCRIPT
MMID system with polarization diversity for ID and vital
signal detection
A Degree Thesis
Submitted to the Faculty of the
Escola Tècnica d'Enginyeria de Telecomunicació de
Barcelona
Universitat Politècnica de Catalunya
by
Gerard Farrero Cierco
In partial fulfilment
of the requirements for the degree in
TELECOMMUNICATION SYSTEMS ENGINEERING
Advisor: Ke Wu, Tarek Djerafi, José Lázaro
Barcelona, January 2016
1
Abstract
The chipless RFID tag presented in this thesis is based in the millimetre wave technology
and exploits the advantage offered by the polarization and frequency diversity for
detecting and identifying. The RFID tag and reader consist on a ring slot etched on the
top of a circular Substrate Integrated Waveguide (SIW) cavity. Adding a gap as a shot in
the ring slot, it is possible to detect different linear polarization depending of the angle
position of the gap.
Moreover, a new system of identification of the vital signal detection is proposed using
RFID technology. The detection is based in different circular polarization tags located in
the chest of different individuals. The received signal power corresponding to the chest
vibration is analysed in order to compare the response of different tags. Use of this type
of technology allows identifying different individual and monitoring their vital signal with a
small, compact and low cost system based in the millimetre wave frequency.
2
Resum
En aquesta tesi es presenta un Sistema RFID passiu basat en tecnologia d'ones
mil·limètriques que explota l'avantatge que ofereix la diversitat de polarització i
freqüència per detectar i identificar. L'etiqueta i el lector RFID consisteixen en una ranura
en forma d'anell gravada a la part superior d'una cavitat circular dissenyada amb
tecnologia de guia d'ona integrada en substrat. Afegint una ranura causant un curtcircuit
en l'anell és possible detectar diferents tipus de polarització lineal depenent de la posició
de la ranura.
A més, es proposa un nou sistema de detecció del senyal vital usant tecnologia RFID. La
detecció es basa en diferents etiquetes RFID col·locades al pit de diferents individus. La
senyal rebuda corresponent a la vibració del pit és analitzada comparant diferents
respostes de diferents etiquetes. L'ús d'aquest tipus de tecnologia permet identificar
diferents individus monitoritzant els seus senyals vitals amb un sistema petit, compacte i
barat basat en freqüències d'ones mil·limètriques.
3
Resumen
En esta tesis se presenta un Sistema RFID pasivo basado en tecnología de ondas
milimétricas que explota la ventaja que ofrece la diversidad de polarización y frecuencia
para detectar e identificar. La etiqueta y el lector RFID consisten en una ranura en forma
de anillo grabada en la parte superior de una cavidad circular diseñada con tecnología de
guía de onda integrada en sustrato. Añadiendo un hueco causando un cortocircuito en el
anillo es posible detectar diferentes tipos de polarización lineal dependiendo de la
posición del hueco.
Además, se propone un nuevo sistema de detección de las señales vitales usando
tecnología RFID. La detección se basa en diferentes etiquetas RFID colocadas en el
pecho de diferentes individuos. La señal recibida correspondiente a la vibración del
pecho es analizada comparando distintas respuestas de distintas etiquetas. El uso de
este tipo de tecnología permite identificar distintos individuos monitorizando sus señales
vitales con un sistema pequeño, compacto y barato basado en frecuencias de ondas
milimétricas.

4
“To my parents, Jordi and Maria del Carmen, for their support and encouragement throughout these last months. This project wouldn’t have been possible without their help”

5
Acknowledgements
I would like to express my gratitude to Professor Ke Wu and Professor Tarek Djerafi for
accepting me to work with them in their millimetre wave radiofrequency team and making
possible the realization of my final degree thesis. Moreover, my thankfulness to all the
technicians of the École Polytechnique de Montréal those provide me all the
instrumentation for the fabrication process of my system.
I appreciate also the contribution and dedication to my advisor José Lázaro for helping
me with the delivery reports.
Special thanks go to my advisor Tarek Djerafi for all the time that he has spent on my
project follow-up and for helping me every time I had a problem. Furthermore, I
appreciate his new ideas and corrections.
Finally, I would like to express thanks for welcoming me and provide me an office to all
the administration and international staff of the École Polythecnique de Montréal.

6
Revision history and approval record
Revision Date Purpose
0 28/12/2015 Document creation
1 15/01/2016 Document revision
2 25/01/2016 Document revision
DOCUMENT DISTRIBUTION LIST
Name e-mail
Gerard Farrero Cierco [email protected]
Ke Wu [email protected]
Tarek Djerafi [email protected]
Jose Antonio Lazaro [email protected]
Written by: Reviewed and approved by:
Date 21/01/2016 Date 25/01/2016
Name Gerard Farrero Name José Lázaro
Position Project Author Position Project Supervisor

7
Table of contents
Abstract ................................................................................................................................. 1
Resum .................................................................................................................................. 2
Resumen .............................................................................................................................. 3
Acknowledgements .............................................................................................................. 5
Revision history and approval record................................................................................... 6
Table of contents .................................................................................................................. 7
List of Figures ....................................................................................................................... 9
List of Tables: ..................................................................................................................... 10
1. Introduction .................................................................................................................. 11
1.1. Goal ...................................................................................................................... 11
1.2. Overview .............................................................................................................. 11
1.3. Requirements and Specifications ........................................................................ 12
1.4. Work plan ............................................................................................................. 12
1.4.1. Work Packages and Tasks .......................................................................... 12
1.4.2. Time Plan...................................................................................................... 16
1.5. Incidences and Modifications .............................................................................. 17
2. State of the art of the technology used or applied in this thesis: ............................... 17
2.1. RFID Architecture ................................................................................................ 17
2.2. Substrate Integrated Waveguide ......................................................................... 18
2.3. Antenna Polarization............................................................................................ 19
2.4. Vital signal detection systems ............................................................................. 21
3. Antenna for reader/tag polarization diversity .............................................................. 23
3.1. Polarization RFID system .................................................................................... 23
3.2. Results ................................................................................................................. 26
4. Vital signal detection: .................................................................................................. 27
4.1. Microwaves’ penetration in the tissue ................................................................. 28
4.2. Vital signal detection system ............................................................................... 29
4.3. Chipless TAG design ........................................................................................... 29
4.4. Setup measurement ............................................................................................ 31
4.5. Security consideration ......................................................................................... 32
4.6. Signal processing ................................................................................................ 33
4.6.1. Filtering ......................................................................................................... 33
4.6.2. Center ........................................................................................................... 33

8
4.6.3. Autocorrelation ............................................................................................. 33
4.6.4. Fast Fourier Transform (FFT) ...................................................................... 33
4.7. Results ................................................................................................................. 34
5. Budget ......................................................................................................................... 37
6. Conclusions ................................................................................................................. 38
7. Future development .................................................................................................... 39
Bibliography: ....................................................................................................................... 40
Glossary .............................................................................................................................. 43
9
List of Figures
Figure 1: Gant Diagram ...................................................................................................... 16
Figure 2: RFID architecture ................................................................................................ 18
Figure 3: SIW structure ...................................................................................................... 19
Figure 4: Polarization ellipse .............................................................................................. 20
Figure 5: Linear polarization example ................................................................................ 20
Figure 6: Circular polarization example ............................................................................. 20
Figure 7: RFID tags geometry ............................................................................................ 23
Figure 8: RFID reader geometry ........................................................................................ 24
Figure 9: S11 simulation with the gap placed at 0º of the slot ring ................................... 25
Figure 10: S11 simulation with the gap placed at 90º of the slot ring ............................... 25
Figure 11: S11 simulation with the gap placed at 45º of the slot ring ............................... 26
Figure 12: Return loss of the RFID reader ......................................................................... 26
Figure 13: S21 measured of the three linear polarization RFID tags ......................... 27
Figure 14: Proposed RFID vital signal detection system ................................................... 28
Figure 15: Propagation of the electromagnetic waves through the human tissue for
different frequencies ........................................................................................................... 28
Figure 16: Geometry of the circular polarization tag ......................................................... 30
Figure 17: Simulated return loss of circular polarization tag with different resonance
frequencies ......................................................................................................................... 31
Figure 18: Photo of the RFID vital signal detection setup .......................................... 32
Figure 19 Signal processing ............................................................................................... 33
Figure 20: Breathing signal using metallic plate at 50 cm ................................................. 34
Figure 21: Breathing signal using metallic plate at 1 m ..................................................... 34
Figure 22: Breathing signal using metallic plate at 2.5 m .................................................. 35
Figure 23: Breathing signal using metallic plate at 5 m ..................................................... 35
Figure 24: Individual’s vital signal measured wearing the tag at 1 m ................................ 36
Figure 25: Individual’s vital signal measured wearing the tag at 2.5 m .................... 36

10
List of Tables:
Table 1: Literature of vital signal detection ........................................................................ 22
Table 2: Dimensions of the proposed circular polarization tag ......................................... 30
Table 3: Relation Radius-Resonance frequency ............................................................... 31
Table 4: Project budget ...................................................................................................... 37
Table 5: Junior engineer cost ............................................................................................. 37

11
1. Introduction
Radio Frequency Identification (RFID) is a wireless non-contact technology which uses
radio frequency (RF) waves for data transmission between a transponder and a reader
for the automatically identification [1].
Millimetre Wave Identification (MMID) has appeared as an upgrade of conventional RFID
due to its advantages of using higher carrier frequency explained in [2-3]. It is possible to
achieve smaller tag antennas with narrow beams and higher gain and more compact
reader modules. This technology has become popular and has increased the attraction of
the researchers for developing RF systems for remotely monitoring of vital signal in the
last decades.
1.1. Goal
This project consists on an RFID system in the millimetre wave frequency with
polarization diversity for identification and vital signal detection. The main purpose of this
project is to detect the vital signal of an individual using an RFID system to also
determine its location.
Nevertheless, it is important to analyse the diversity polarisation which can offer the
possibility to identify more than one unique individual at the same time.
Therefore, we will work on the confection and design of a RFID tag with different
polarization responses to apply its advantages in vital signal detection.
1.2. Overview
This project has been adapted to my previous skills because it is an extension of a larger
project which in they are participating PhD students from the electrical department of
EPM. The first part of the project consists on the design of an ID system at millimeter
wave using all the instrumentation available in the millimeter wave lab. The second part is
to use this system for a specific application which is vital signal detection.
The ID system using RFID techniques has been proposed by my EPM supervisors, Ke
Wu and Tarek Djerafi. Nevertheless, we jointly discuss the application of this ID system
after my project supervisors provide me a list of ideas. We decided to work on a part of a
project of vital signal detection that the electrical department of the EPM has with the
Héma Québec company. Héma Québec is a company that wants to know the needs of
the Québec population for safe, optimal-quality blood and blood products, human tissues,
cord blood and cellular products; to develop and provide expertise and specialized,

12
innovative services in the field of human biological products. This project allows me to
combine my skills in the electromagnetic and radiofrequency field with the research of a
medical application.
My supervisors provide me all the starting tools that I need for the correct realization of
the project.
1.3. Requirements and Specifications
Project requirements:
- Advanced HFSS and ADS skills for understand and develop all the designs and
simulations
- Capacity of researching scientific papers
- Capacity of processing data using MATLAB
- Knowledge in electromagnetic and radiofrequency circuits and systems
- Advanced level of English for the written and oral communication
Project specifications:
Specifications Value
Resonance Frequency 35 GHz
Range 1-3 meter
1.4. Work plan
The development of this Final Degree thesis has followed the initial ideas. However, there
have been some incidences that will be commented on chapter 1.5 of this document.
1.4.1. Work Packages and Tasks
Work Packages:
Project: Review RFID systems documentation WP ref: 01
Major constituent: Documentation Sheet 01 of 06
Short description:
Read and understand papers related to the RFID
systems and vital signal detection.
Planned start date:
11/08/2015
Planned end date: 7/09/2015
Start event: 19/08/2015
End event: 14/09/2015
13
Internal task T1: Looking for RFID systems at millimeter-
wave
Internal task T2: Researching use of pin-diode for
polarization diversity
Internal task T3: Understanding vital signal detection
systems
Internal task T4: Learning HFSS software operation
Deliverables: Dates:
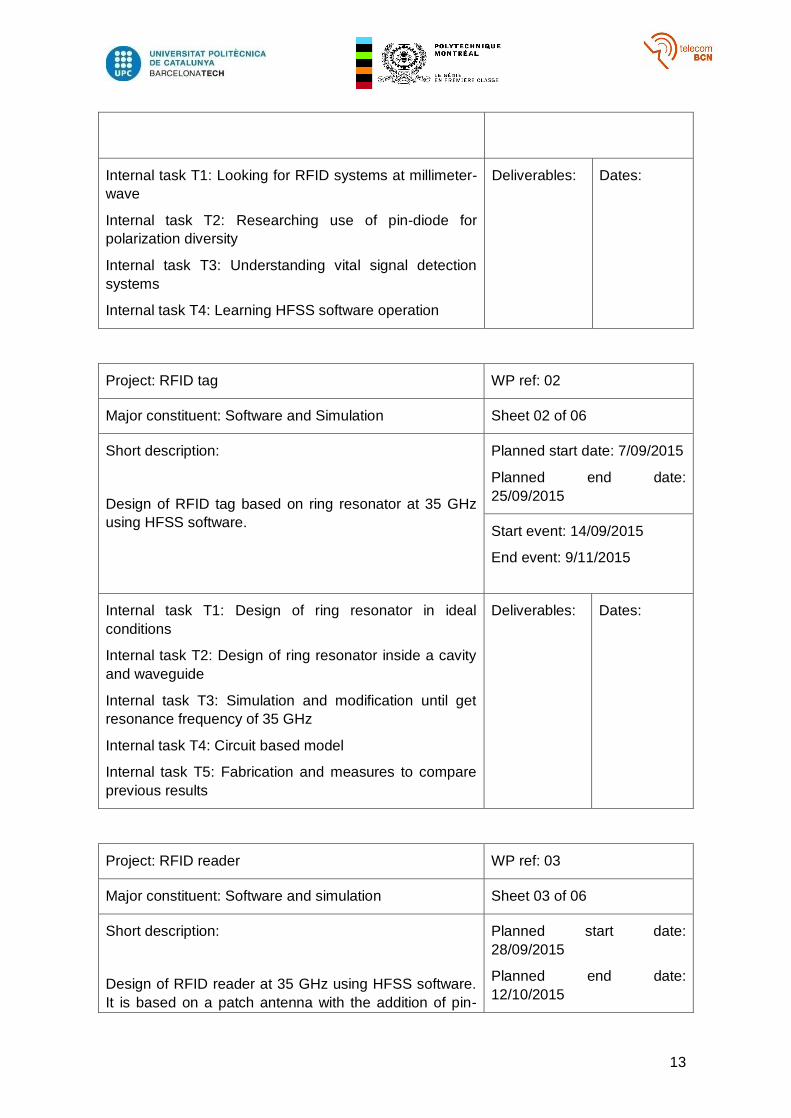
Project: RFID tag WP ref: 02
Major constituent: Software and Simulation Sheet 02 of 06
Short description:
Design of RFID tag based on ring resonator at 35 GHz
using HFSS software.
Planned start date: 7/09/2015
Planned end date:
25/09/2015
Start event: 14/09/2015
End event: 9/11/2015
Internal task T1: Design of ring resonator in ideal
conditions
Internal task T2: Design of ring resonator inside a cavity
and waveguide
Internal task T3: Simulation and modification until get
resonance frequency of 35 GHz
Internal task T4: Circuit based model
Internal task T5: Fabrication and measures to compare
previous results
Deliverables: Dates:
Project: RFID reader WP ref: 03
Major constituent: Software and simulation Sheet 03 of 06
Short description:
Design of RFID reader at 35 GHz using HFSS software.
It is based on a patch antenna with the addition of pin-
Planned start date:
28/09/2015
Planned end date:
12/10/2015

14
diode to get polarization diversity
Start event: 28/09/2015
End event: 9/11/2015
Internal task T1: Design of patch antenna with pin-diode
to control the polarization using HFSS software.
Internal task T2: Simulation and modification of pin-diode
position.
Internal task T3: Fabrication and measures to compare
previous results
Deliverables: Dates:
Project: Experimental measures WP ref: 04
Major constituent: Test Sheet 04 of 06
Short description:
Test the RFID system to see if the communication works
properly independently of the position of the tag and
antenna.
Planned start date:
19/10/2015
Planned end date:
26/10/2015
Start event: 16/11/2015
End event: 23/11/2015
Internal task T1: Test the RFID system to see if the
communication works properly independently of the
position of the tag and antenna.
Internal task T2: Test the tag using polarization diversity.
Internal task T3: Specifications compliance (Distance
range and resonance frequency).
Internal task T4: Modify some parameters if required.
Deliverables: Dates:
Project: Vital signal detection WP ref: 05
Major constituent: Application Sheet 05 of 06
Short description:
Use the increase of the frequency due to the heart pulse
to detect life without direct contact.
Planned start date:
26/10/2015
Planned end date: 9/11/2015
Start event: 19/10/2015
15
End event: 23/11/2015
Internal task T1: Detect vital signal using RFID system
Internal task T2: Processing the data using MATLAB to
determine the heartbeat and the breathing signal
Deliverables: Dates:
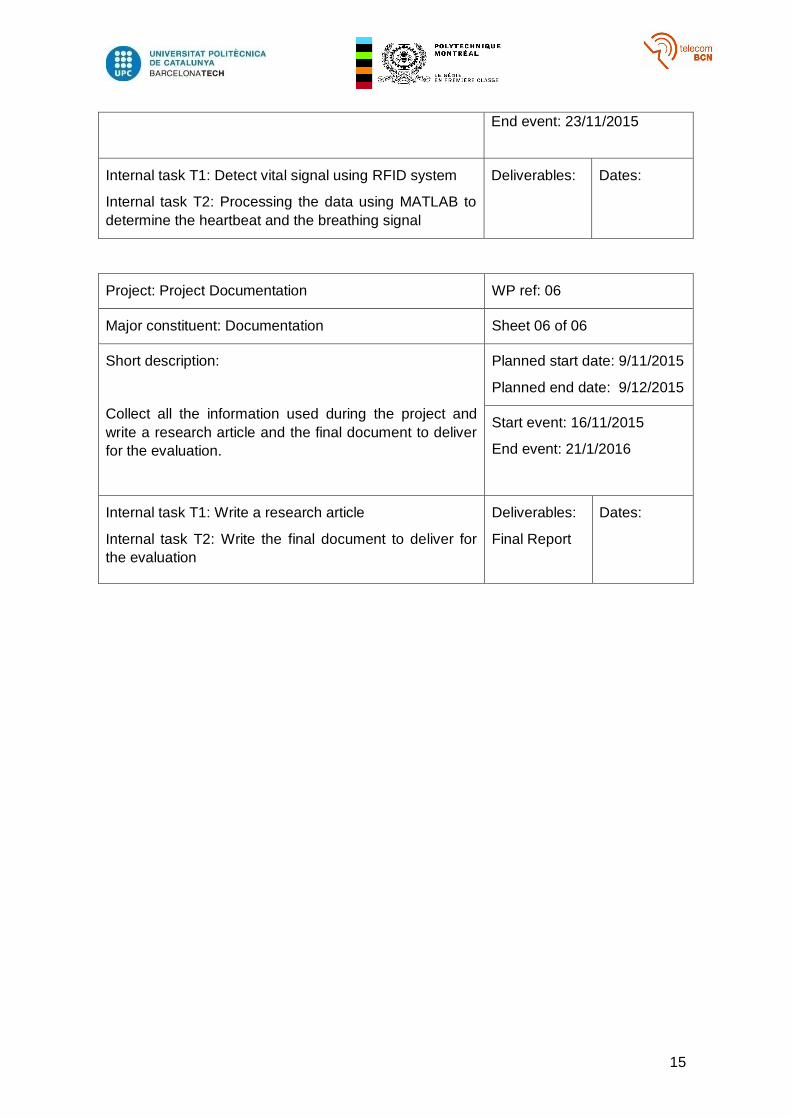
Project: Project Documentation WP ref: 06
Major constituent: Documentation Sheet 06 of 06
Short description:
Collect all the information used during the project and
write a research article and the final document to deliver
for the evaluation.
Planned start date: 9/11/2015
Planned end date: 9/12/2015
Start event: 16/11/2015
End event: 21/1/2016
Internal task T1: Write a research article
Internal task T2: Write the final document to deliver for
the evaluation
Deliverables:
Final Report
Dates:
16
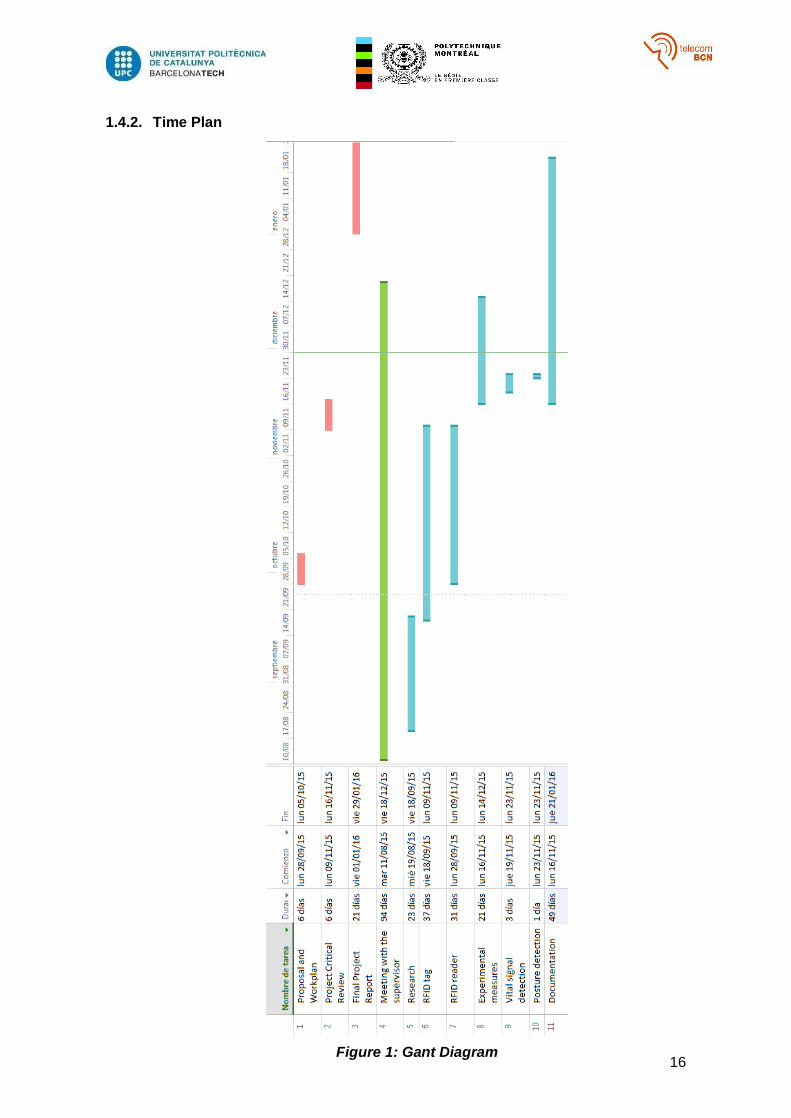
1.4.2. Time Plan
Figure 1: Gant Diagram
17
1.5. Incidences and Modifications
The whole work has roughly followed the planning set on point 1.4.1 and 1.4.2 of this
document. However, there have been some modifications which affect to the time plan of
the project from the Critical Review Document.
As it is said in the point 1.1 of Critical Review Document most of the incidences have
appeared in the fabrication and experimental measures process. We have some
problems with the ordered components which were kept in the costumes more time that
the expected. Moreover, the laser used in fabrication process broke which caused a one
week delays. These incidences were showed in the Critical documentation.
Because of these problems and the lack of time, T2 of the WP4 has been omitted and it
is just consider the polarization diversity between the tag and the reader and we
dedicated more time in the vital signal detection.
Finally, the writing of the article takes more time that the considered initially, so we have
to finish it during January working by mail with my supervisors of EPM.
2. State of the art of the technology used or applied in this
thesis:
RFID technology has assumed an important status in logistics, distribution, storage and
supply chain management, having lots of applications in different sectors, such as
industry, economy, health… RFID systems give reliability, fastness and security on
information managing [4].
Other sectors where it is used this technology are access control, electronic tolls on
motorways, vehicles keys, etc [5]. The frequency used in each one of these applications
depends on their needs. With high frequency, it is achieved longer distances and higher
read velocities. Nevertheless, it has an expensive cost.
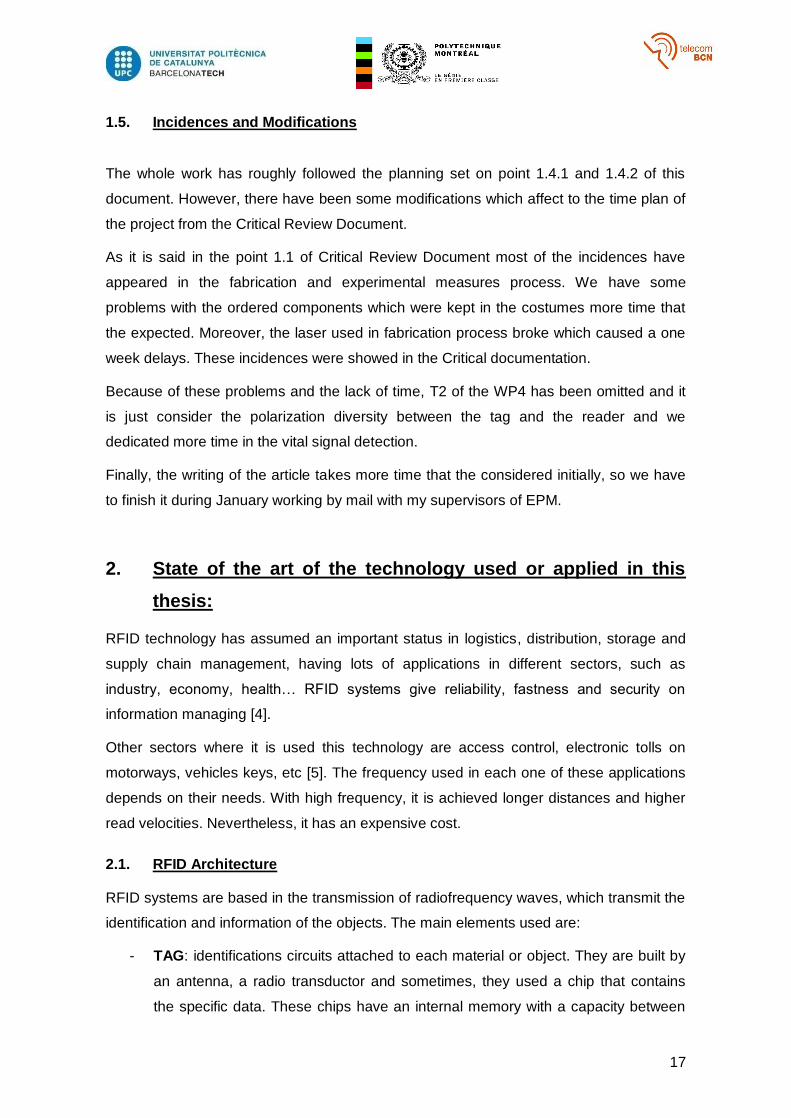
2.1. RFID Architecture
RFID systems are based in the transmission of radiofrequency waves, which transmit the
identification and information of the objects. The main elements used are:
- TAG: identifications circuits attached to each material or object. They are built by
an antenna, a radio transductor and sometimes, they used a chip that contains
the specific data. These chips have an internal memory with a capacity between
18
10 to 1000 bytes. Tag are classified in three different types depending on they
take the energy for their supply [6]:
o PASSIVES: these ones don’t have any power source. The only supply that
they receive come from the own electromagnetic waves that the tag
receive from the reader.
o ACTIVES: these ones have an own power source which supplies the
circuits and propagates the signal to the reader. These tags are powerful,
effectives and reliable but they are bigger and more expensive. Due to its
batteries these tags has a limited time life.
o SEMIACTIVES: these tags have an own power source. This power source
only works when the radiofrequency waves sent by the reader are
detected and it is only used to supply the chip.
- Reader: formed by an antenna, transceiver and a decoder [7-8]. The reader is the
component designed to read the information and digitizing in order to send it to
the system for the data processing.
- Antenna: sends and receives the electromagnetic waves to and from the tags to
obtain the information.
- Software: process and keeps the data.
Figure 2: RFID architecture
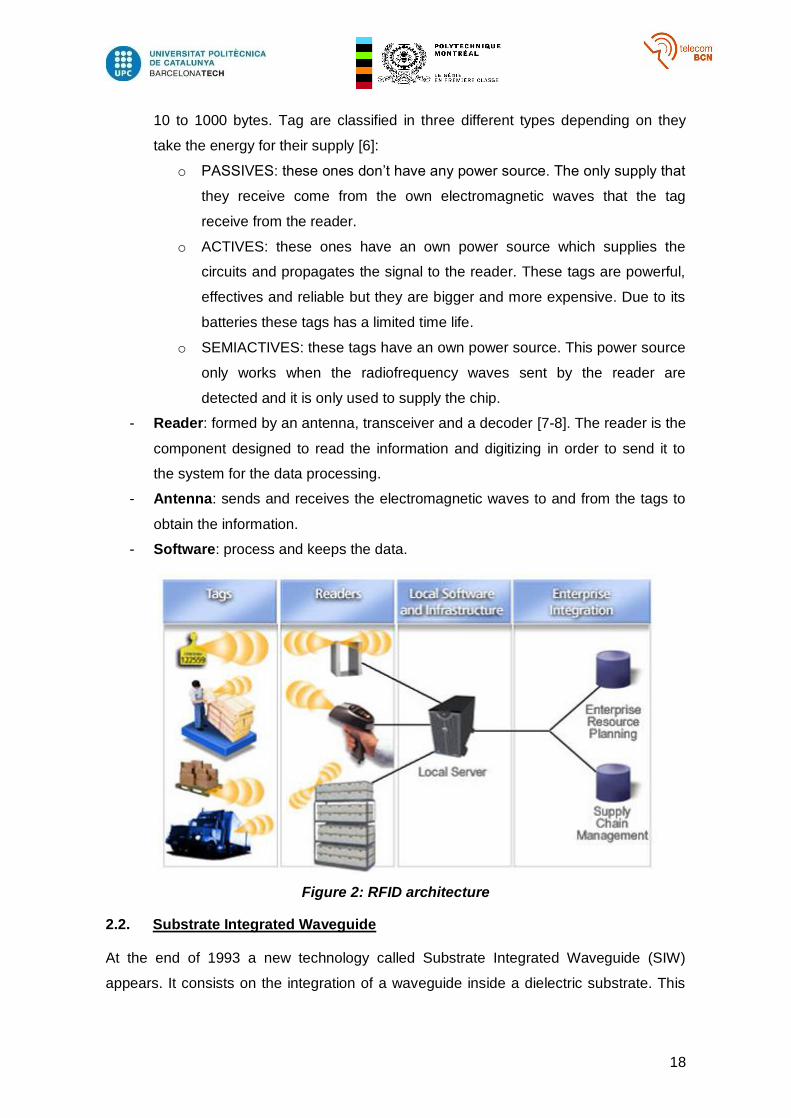
2.2. Substrate Integrated Waveguide
At the end of 1993 a new technology called Substrate Integrated Waveguide (SIW)
appears. It consists on the integration of a waveguide inside a dielectric substrate. This
19
technology improves the advantages of the conventional rectangular waveguide
decreasing its main disadvantages.
With the SIW technology the waves are locked inside the conductor walls travelling
through the dielectric substrate being reflected by these giving the advantages of the
conventional rectangular waveguide: lossless by conductor and good transmission [9].
SIW technology was created in order to work at high frequencies due to its small size and
easy structure. SIW could be constructed using integrated circuits techniques so that the
disadvantages of the conventional waveguide are removed.
Figure 3: SIW structure
The structure of figure X shows how the SIW works: (1) the ground plane works as the
bottom wall of the conventional waveguide, (2) the conductor plate works as the top wall
of the waveguide and (3) the via holes works as the side walls of the waveguide. The
waves travel through the SIW structure [10-11].
This type of technology is used in the design of the RFID components (RFID tag and
reader) of our work in order to take advantage of all its benefits.
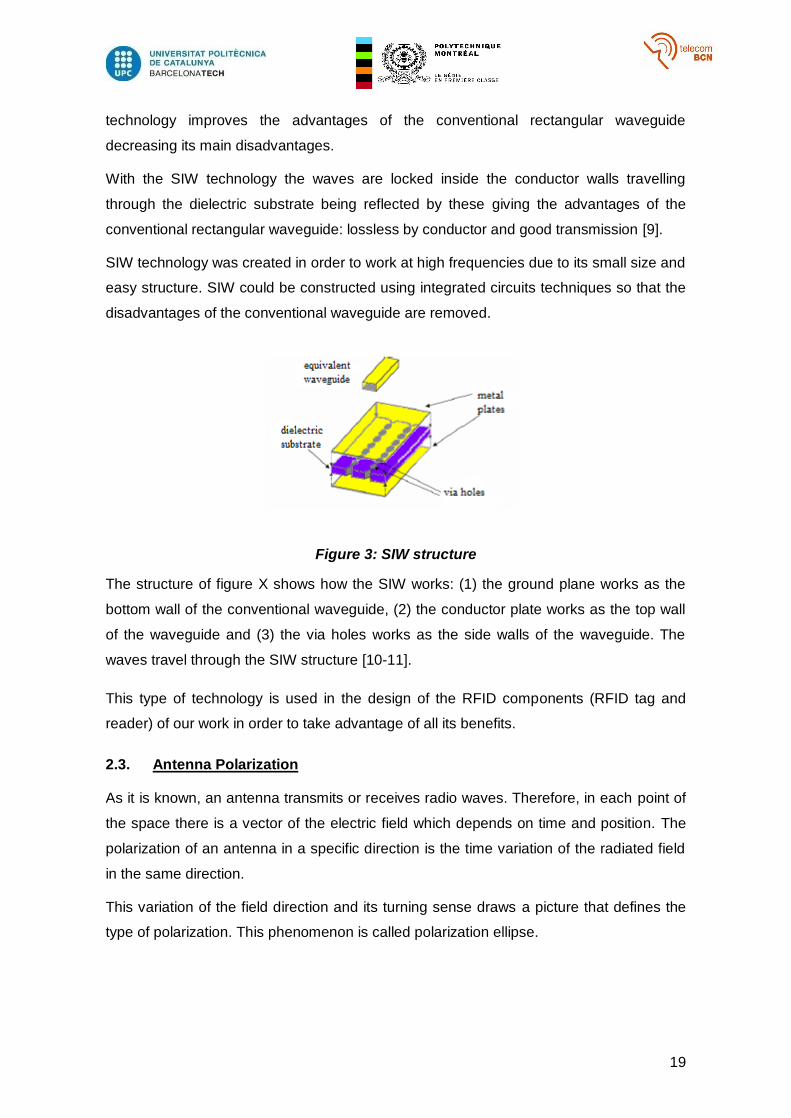
2.3. Antenna Polarization
As it is known, an antenna transmits or receives radio waves. Therefore, in each point of
the space there is a vector of the electric field which depends on time and position. The
polarization of an antenna in a specific direction is the time variation of the radiated field
in the same direction.
This variation of the field direction and its turning sense draws a picture that defines the
type of polarization. This phenomenon is called polarization ellipse.
20
Figure 4: Polarization ellipse
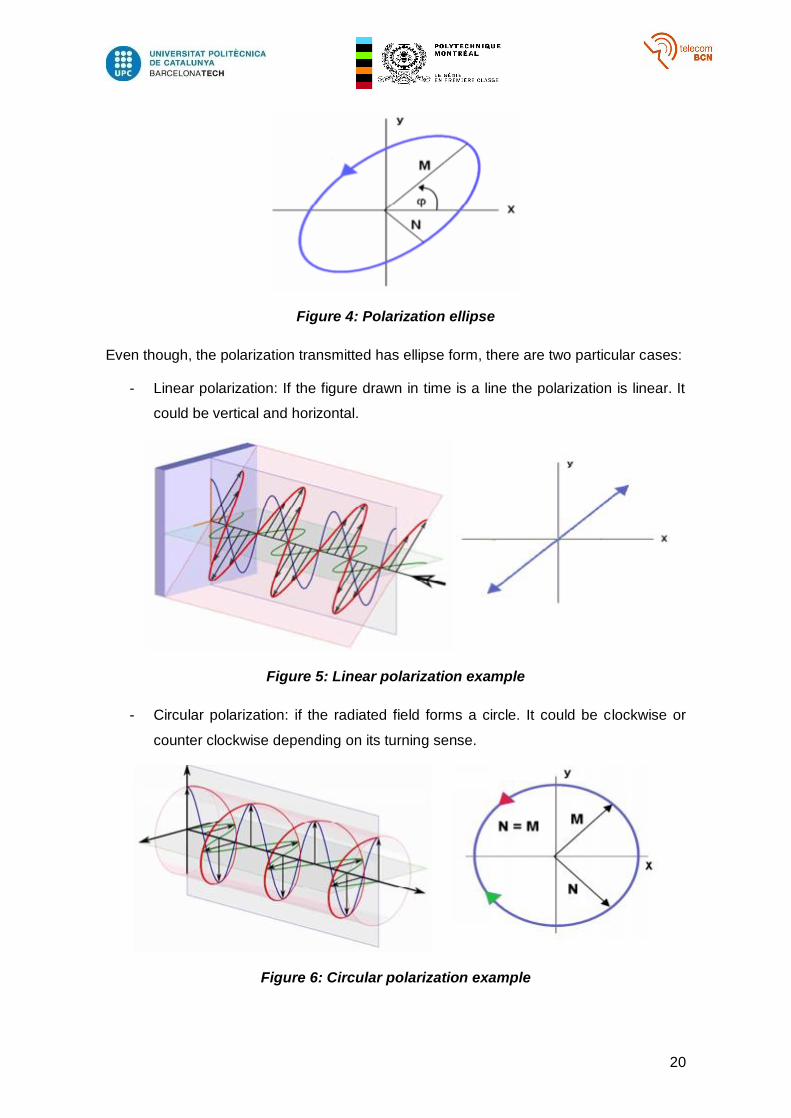
Even though, the polarization transmitted has ellipse form, there are two particular cases:
- Linear polarization: If the figure drawn in time is a line the polarization is linear. It
could be vertical and horizontal.
Figure 5: Linear polarization example
- Circular polarization: if the radiated field forms a circle. It could be clockwise or
counter clockwise depending on its turning sense.
Figure 6: Circular polarization example

21
It is defined a parameter in order to know the type of polarization. It is called Axial Ratio
(AR). The Axial Ratio is the ratio between the major axis and the minor axis of the
polarization ellipse.
2.4. Vital signal detection systems
At the end of the 70’s [12], the first systems for the measurement of respiratory and
cardiac movements have appeared. The proposed systems worked at X band and use
horn antennas to lead the energy of microwaves to the upper trunk of the subjects. The
first test was done to a rabbit at a distance of 30 cm.
From the 90s, the transceivers have been developed in order to do the data processing
separating the breathing signal from the small heartbeat. With this improvement the
subject did not to hold the breathing whereas the heartbeat signal was taken, with these
new systems it was possible to measure the breathing signal and the heartbeat at the
same time.
Chan and Lin [13] combine the analogic amplification and the filtering in order to separate
the vital signal. The cardiac and respiratory signal of the athletes was detected using the
Greneker system [14].
Recent works has been related to the wireless technology. A wireless LAN PCMCIA card
modified was used to detect the breathing and the heartbeat signals by Borique-Lübecke
[15]. A module which combines the transmitted and received signal based on the wireless
phone system was used to detect the vital signals by Lübecke [16-17]. This one uses
amplitude pulses of 0.4 W and a centre frequency of 1GHz. Heartbeat were detected at
distance of 1 meter and the respiratory frequencies were measured up to 3 meters.
Some works are described in the table below:
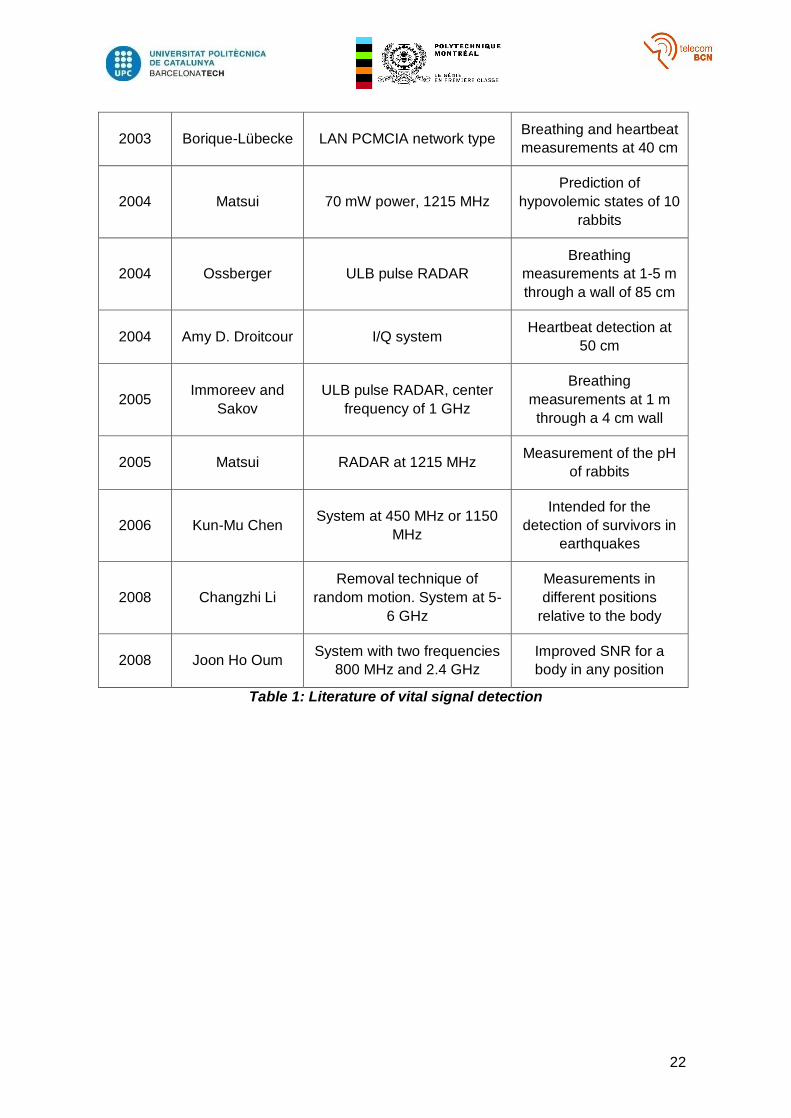
Year Author Description Results
1975 Lin X band, horn antennas Measurements to a
rabbit at 30 cm
1977 Lin 3mW power, horn antennas Intended for premature
babies
1987 Chan and Lin
AD converter at 8 bit, 80Hz
frequency clock. Operating at
10.5GHz. 10mW power, horn
antennas
Breathing and heartbeat
measurements at 5-7 cm
22
2003 Borique-Lübecke LAN PCMCIA network type Breathing and heartbeat
measurements at 40 cm
2004 Matsui 70 mW power, 1215 MHz
Prediction of
hypovolemic states of 10
rabbits
2004 Ossberger ULB pulse RADAR
Breathing
measurements at 1-5 m
through a wall of 85 cm
2004 Amy D. Droitcour I/Q system Heartbeat detection at
50 cm
2005 Immoreev and
Sakov
ULB pulse RADAR, center
frequency of 1 GHz
Breathing
measurements at 1 m
through a 4 cm wall
2005 Matsui RADAR at 1215 MHz Measurement of the pH
of rabbits
2006 Kun-Mu Chen System at 450 MHz or 1150
MHz
Intended for the
detection of survivors in
earthquakes
2008 Changzhi Li
Removal technique of
random motion. System at 5-
6 GHz
Measurements in
different positions
relative to the body
2008 Joon Ho Oum System with two frequencies
800 MHz and 2.4 GHz
Improved SNR for a
body in any position
Table 1: Literature of vital signal detection
23
3. Antenna for reader/tag polarization diversity
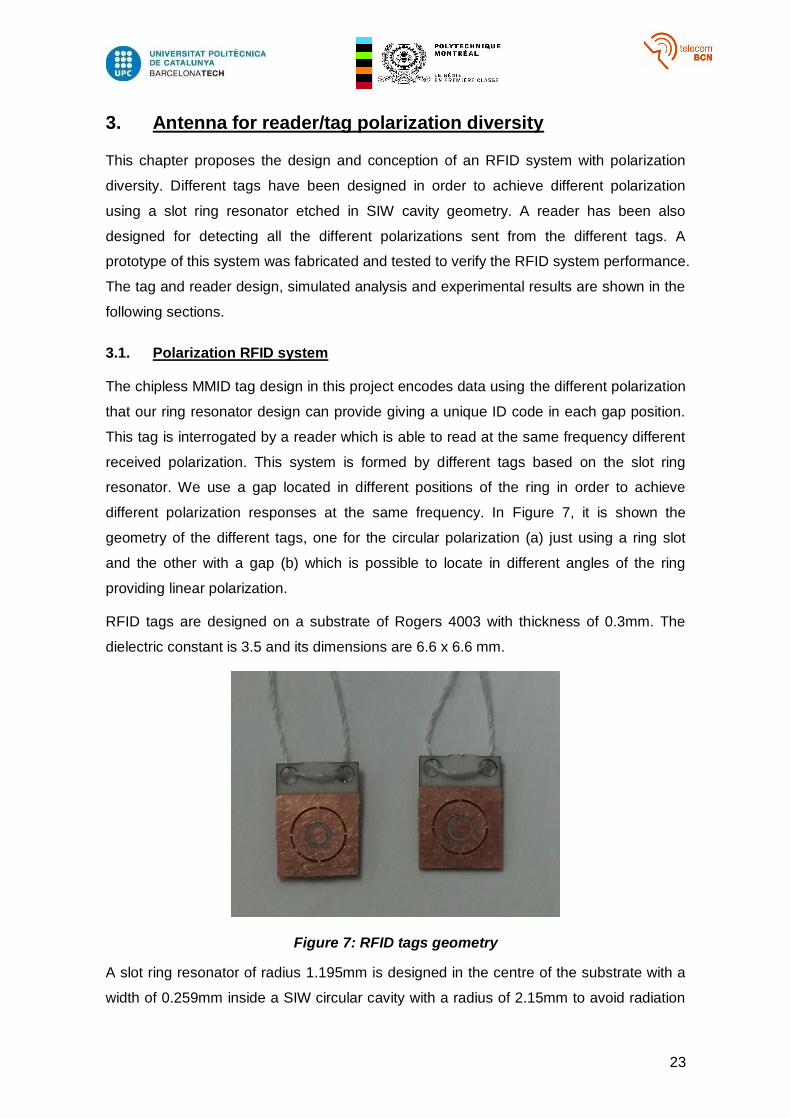
This chapter proposes the design and conception of an RFID system with polarization
diversity. Different tags have been designed in order to achieve different polarization
using a slot ring resonator etched in SIW cavity geometry. A reader has been also
designed for detecting all the different polarizations sent from the different tags. A
prototype of this system was fabricated and tested to verify the RFID system performance.
The tag and reader design, simulated analysis and experimental results are shown in the
following sections.
3.1. Polarization RFID system
The chipless MMID tag design in this project encodes data using the different polarization
that our ring resonator design can provide giving a unique ID code in each gap position.
This tag is interrogated by a reader which is able to read at the same frequency different
received polarization. This system is formed by different tags based on the slot ring
resonator. We use a gap located in different positions of the ring in order to achieve
different polarization responses at the same frequency. In Figure 7, it is shown the
geometry of the different tags, one for the circular polarization (a) just using a ring slot
and the other with a gap (b) which is possible to locate in different angles of the ring
providing linear polarization.
RFID tags are designed on a substrate of Rogers 4003 with thickness of 0.3mm. The
dielectric constant is 3.5 and its dimensions are 6.6 x 6.6 mm.
Figure 7: RFID tags geometry
A slot ring resonator of radius 1.195mm is designed in the centre of the substrate with a
width of 0.259mm inside a SIW circular cavity with a radius of 2.15mm to avoid radiation

24
loss. These dimensions have been designed with the objective of achieving a resonance
frequency at 32.5 GHz. This design corresponds to the circular polarization tag. However,
the linear polarization has been obtained adding a gap in the slot ring of a width of
0.3355mm. Moving the angle of the gap it is possible to reach more than one linear
polarization at the same resonance frequency.
The reader design is based in the same technology as the chipless tag [18-19]. It is made
on a Rogers 4003 substrate with thickness 0.3mm. Its dimensions are 9 x 6 mm. The slot
ring resonator has the same dimensions as in the tag; the difference is that in order to
obtain the different polarizations sent by the tag, the reader adds pin-diode to do a
switching function. The aim is to produce a short in different positions depending the
angle of the linear polarization that it is wanted to detect.
Figure 8: RFID reader geometry
In order to test the reader antenna, a 50 Ohm microstrip is connected to the SIW
transition.
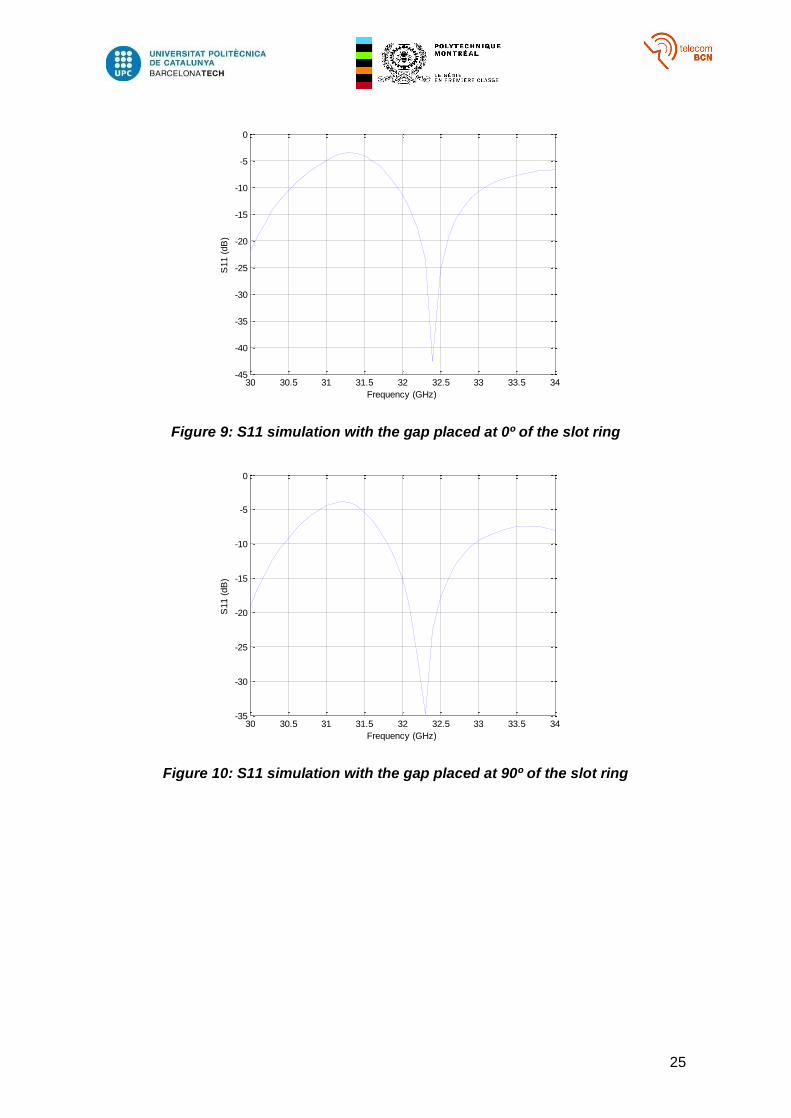
In the following plots, it is shown the different simulation responses to the different angles
of linear polarization. It is possible to see that the resonance frequency is always close to
32.5 GHz. By using this method we can encode different bits using the polarization
diversity that this tag allows.
25
Figure 9: S11 simulation with the gap placed at 0º of the slot ring
Figure 10: S11 simulation with the gap placed at 90º of the slot ring
30 30.5 31 31.5 32 32.5 33 33.5 34-45
-40
-35
-30
-25
-20
-15
-10
-5
0
Frequency (GHz)
S11 (
dB
)
30 30.5 31 31.5 32 32.5 33 33.5 34-35
-30
-25
-20
-15
-10
-5
0
Frequency (GHz)
S11 (
dB
)

26
Figure 11: S11 simulation with the gap placed at 45º of the slot ring
For the correct measurements of the polarization diversity between the reader and the
tag, it has been verified the resonance frequency of the reader. It is shown in Figure 12
that this frequency is the same as in the different tags.
Figure 12: Return loss of the RFID reader
3.2. Results
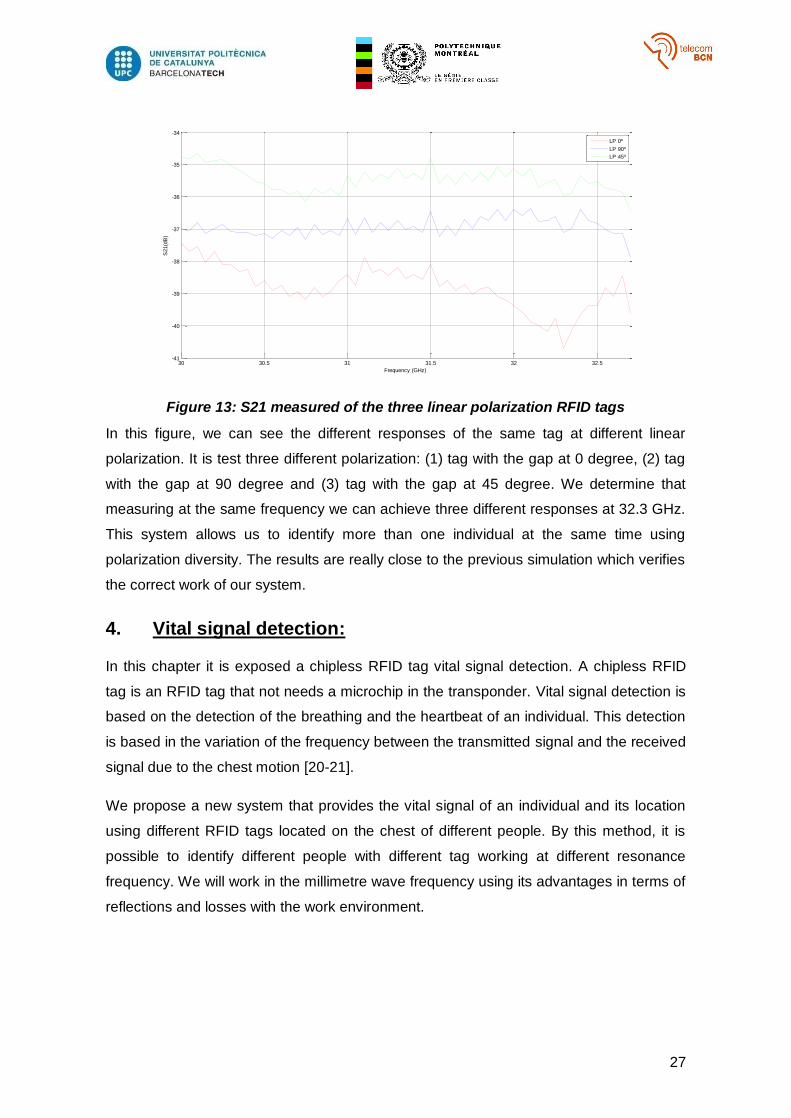
For the measurement, it is used a VNA in order to detect the different S parameters of the
tag and the reader. It is possible to verify that the simulation results are really close to the
real measures as it is illustrated in Figure 13.
30 30.5 31 31.5 32 32.5 33 33.5 34-35
-30
-25
-20
-15
-10
-5
0
Frequency (GHz)
S11 (
dB
)
30 30.5 31 31.5 32 32.5 33 33.5 34-35
-30
-25
-20
-15
-10
-5
0
Frequency (GHz)
S11 (
dB
)
27
Figure 13: S21 measured of the three linear polarization RFID tags
In this figure, we can see the different responses of the same tag at different linear
polarization. It is test three different polarization: (1) tag with the gap at 0 degree, (2) tag
with the gap at 90 degree and (3) tag with the gap at 45 degree. We determine that
measuring at the same frequency we can achieve three different responses at 32.3 GHz.
This system allows us to identify more than one individual at the same time using
polarization diversity. The results are really close to the previous simulation which verifies
the correct work of our system.
4. Vital signal detection:
In this chapter it is exposed a chipless RFID tag vital signal detection. A chipless RFID
tag is an RFID tag that not needs a microchip in the transponder. Vital signal detection is
based on the detection of the breathing and the heartbeat of an individual. This detection
is based in the variation of the frequency between the transmitted signal and the received
signal due to the chest motion [20-21].
We propose a new system that provides the vital signal of an individual and its location
using different RFID tags located on the chest of different people. By this method, it is
possible to identify different people with different tag working at different resonance
frequency. We will work in the millimetre wave frequency using its advantages in terms of
reflections and losses with the work environment.
30 30.5 31 31.5 32 32.5-41
-40
-39
-38
-37
-36
-35
-34
S21(d
B)
Frequency (GHz)
LP 0º
LP 90º
LP 45º
28
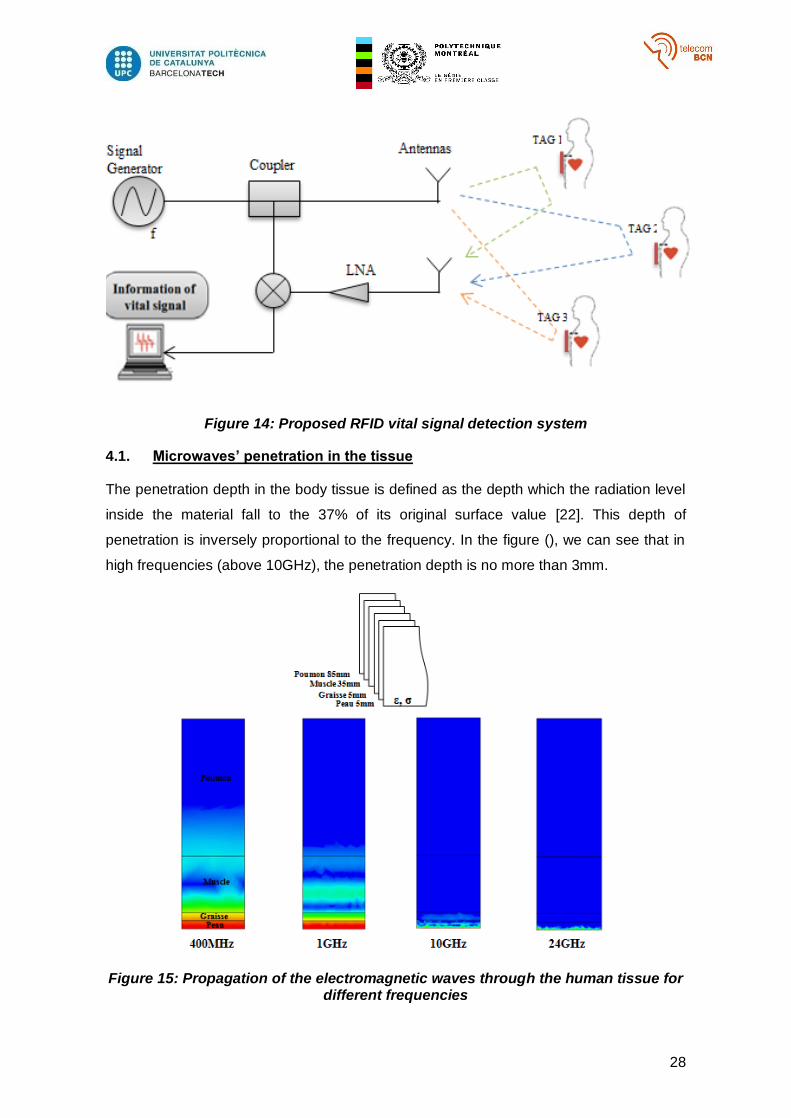
Figure 14: Proposed RFID vital signal detection system
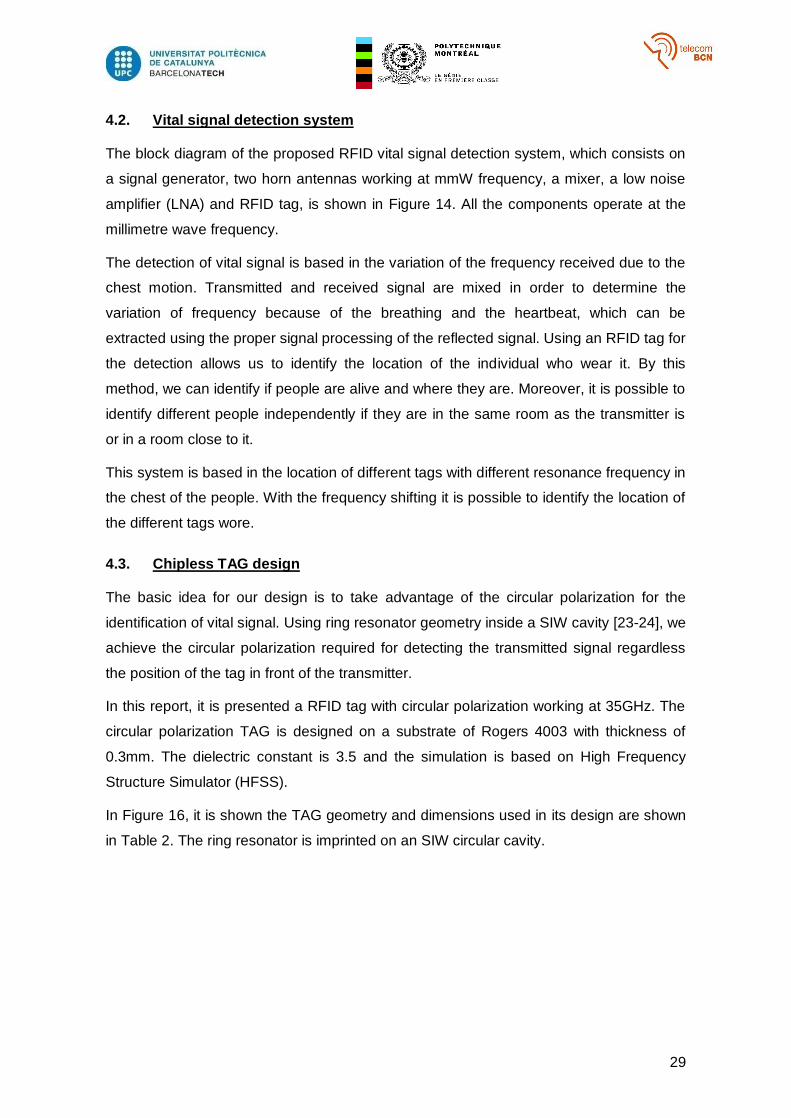
4.1. Microwaves’ penetration in the tissue
The penetration depth in the body tissue is defined as the depth which the radiation level
inside the material fall to the 37% of its original surface value [22]. This depth of
penetration is inversely proportional to the frequency. In the figure (), we can see that in
high frequencies (above 10GHz), the penetration depth is no more than 3mm.
Figure 15: Propagation of the electromagnetic waves through the human tissue for different frequencies
29
4.2. Vital signal detection system
The block diagram of the proposed RFID vital signal detection system, which consists on
a signal generator, two horn antennas working at mmW frequency, a mixer, a low noise
amplifier (LNA) and RFID tag, is shown in Figure 14. All the components operate at the
millimetre wave frequency.
The detection of vital signal is based in the variation of the frequency received due to the
chest motion. Transmitted and received signal are mixed in order to determine the
variation of frequency because of the breathing and the heartbeat, which can be
extracted using the proper signal processing of the reflected signal. Using an RFID tag for
the detection allows us to identify the location of the individual who wear it. By this
method, we can identify if people are alive and where they are. Moreover, it is possible to
identify different people independently if they are in the same room as the transmitter is
or in a room close to it.
This system is based in the location of different tags with different resonance frequency in
the chest of the people. With the frequency shifting it is possible to identify the location of
the different tags wore.
4.3. Chipless TAG design
The basic idea for our design is to take advantage of the circular polarization for the
identification of vital signal. Using ring resonator geometry inside a SIW cavity [23-24], we
achieve the circular polarization required for detecting the transmitted signal regardless
the position of the tag in front of the transmitter.
In this report, it is presented a RFID tag with circular polarization working at 35GHz. The
circular polarization TAG is designed on a substrate of Rogers 4003 with thickness of
0.3mm. The dielectric constant is 3.5 and the simulation is based on High Frequency
Structure Simulator (HFSS).
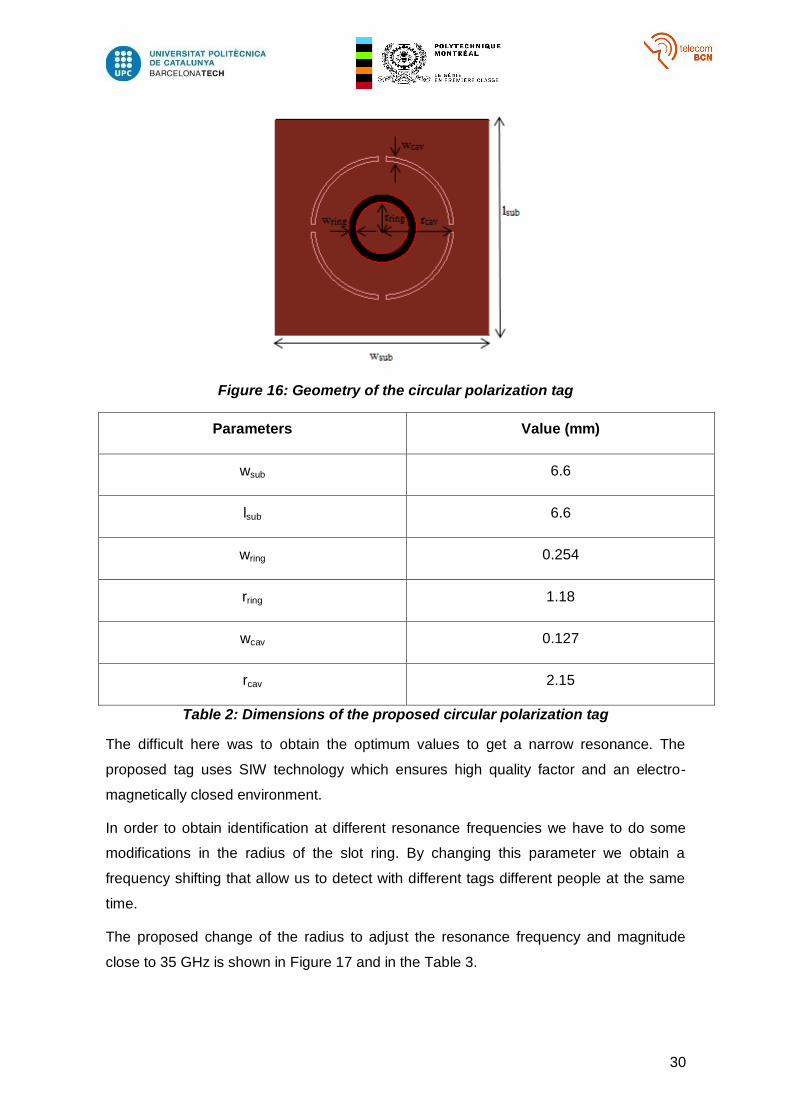
In Figure 16, it is shown the TAG geometry and dimensions used in its design are shown
in Table 2. The ring resonator is imprinted on an SIW circular cavity.
30
Figure 16: Geometry of the circular polarization tag
Parameters Value (mm)
wsub 6.6
lsub 6.6
wring 0.254
rring 1.18
wcav 0.127
rcav 2.15
Table 2: Dimensions of the proposed circular polarization tag
The difficult here was to obtain the optimum values to get a narrow resonance. The
proposed tag uses SIW technology which ensures high quality factor and an electro-
magnetically closed environment.
In order to obtain identification at different resonance frequencies we have to do some
modifications in the radius of the slot ring. By changing this parameter we obtain a
frequency shifting that allow us to detect with different tags different people at the same
time.
The proposed change of the radius to adjust the resonance frequency and magnitude
close to 35 GHz is shown in Figure 17 and in the Table 3.

31
Figure 17: Simulated return loss of circular polarization tag with different resonance frequencies
Radius (mm) Frequency (GHz)
1.18 35.7
1.195 35.1
1.22 34.3
Table 3: Relation Radius-Resonance frequency
Each one of the frequencies achieved with the variation in the radius dimension of each
tag allows us to identify different people wearing them. Depending on the signal
transmitted we can see from which tag we receive signal and its variation frequency.
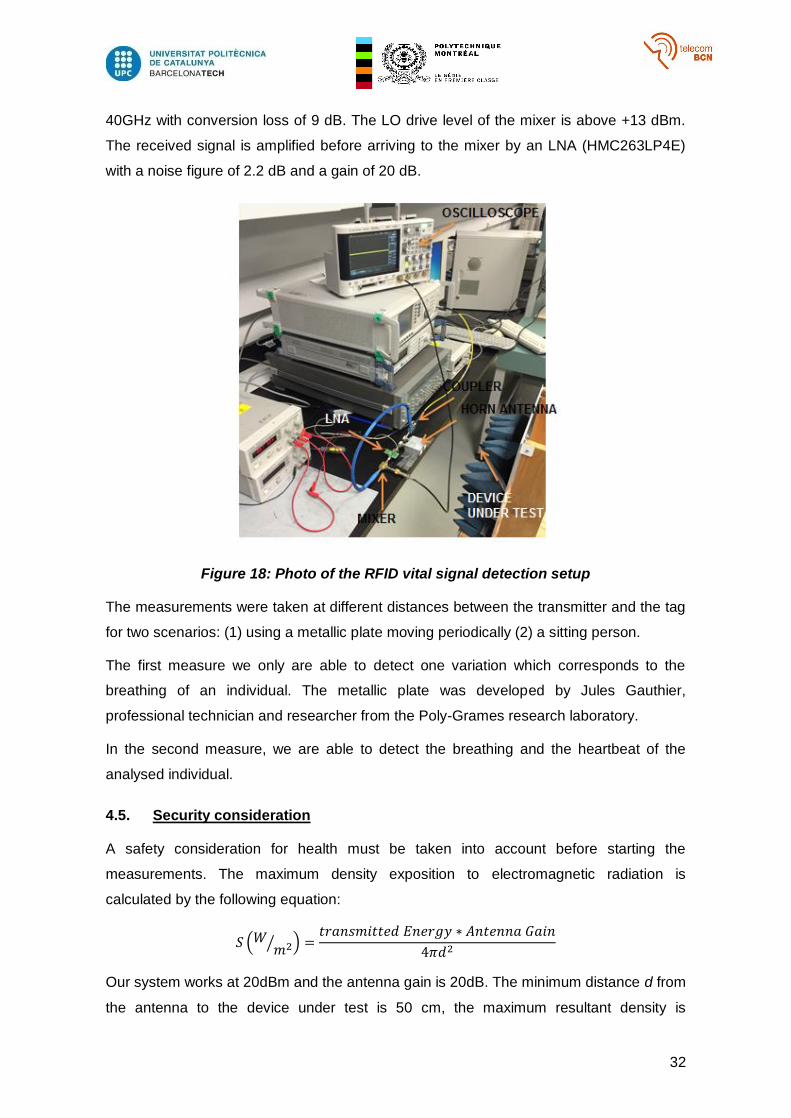
4.4. Setup measurement
As illustrated in Figure 18, a simplified prototype of the chipless tag vital signal detection
system was fabricated using the following components: a signal generator (1MG3694A)
providing 35 GHz, a dual-band 3 dB coupler, a mixer (HMC329LM3) operating from 26-
32 33 34 35 36 37 38 39 40-38
-36
-34
-32
-30
-28
-26
-24
Frequency (GHz)
S21 (
dB
)
32
40GHz with conversion loss of 9 dB. The LO drive level of the mixer is above +13 dBm.
The received signal is amplified before arriving to the mixer by an LNA (HMC263LP4E)
with a noise figure of 2.2 dB and a gain of 20 dB.
Figure 18: Photo of the RFID vital signal detection setup
The measurements were taken at different distances between the transmitter and the tag
for two scenarios: (1) using a metallic plate moving periodically (2) a sitting person.
The first measure we only are able to detect one variation which corresponds to the
breathing of an individual. The metallic plate was developed by Jules Gauthier,
professional technician and researcher from the Poly-Grames research laboratory.
In the second measure, we are able to detect the breathing and the heartbeat of the
analysed individual.
4.5. Security consideration
A safety consideration for health must be taken into account before starting the
measurements. The maximum density exposition to electromagnetic radiation is
calculated by the following equation:
𝑆 (𝑊𝑚2⁄ ) =
𝑡𝑟𝑎𝑛𝑠𝑚𝑖𝑡𝑡𝑒𝑑 𝐸𝑛𝑒𝑟𝑔𝑦 ∗ 𝐴𝑛𝑡𝑒𝑛𝑛𝑎 𝐺𝑎𝑖𝑛
4𝜋𝑑2
Our system works at 20dBm and the antenna gain is 20dB. The minimum distance d from
the antenna to the device under test is 50 cm, the maximum resultant density is
33
3.19 𝑊𝑚2⁄ , which is lower than the safe level of density given by the Health Canada
regulations [25].
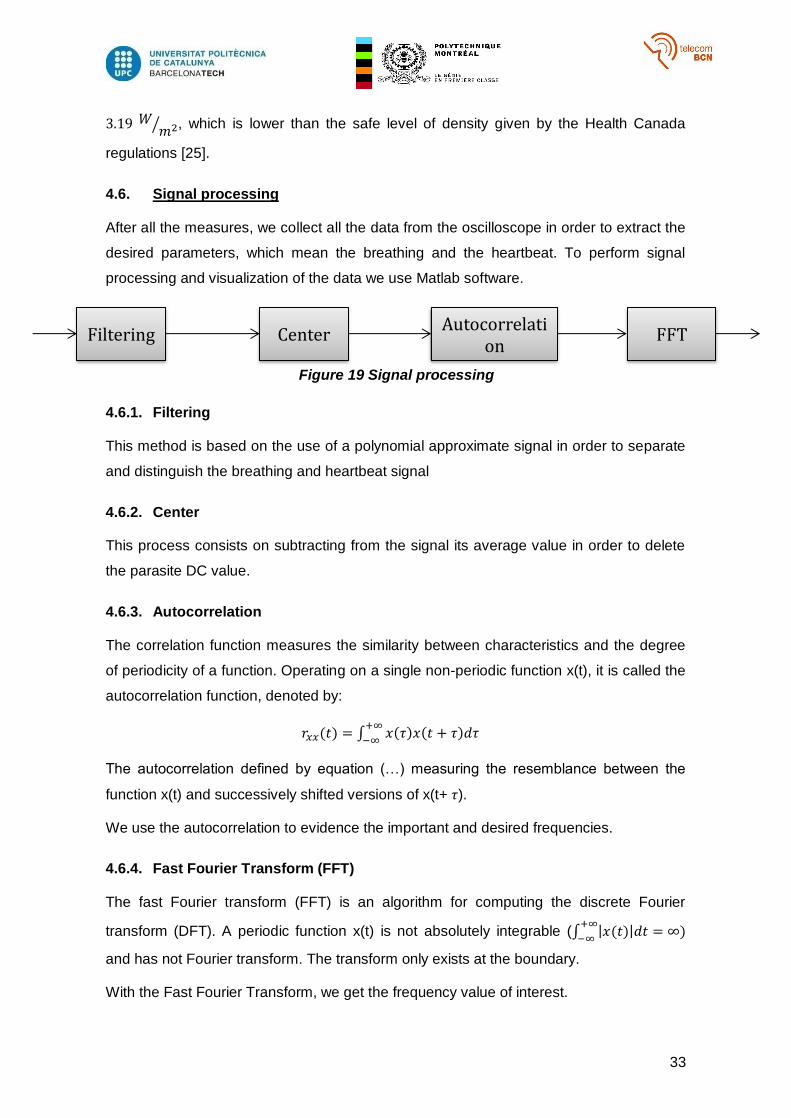
4.6. Signal processing
After all the measures, we collect all the data from the oscilloscope in order to extract the
desired parameters, which mean the breathing and the heartbeat. To perform signal
processing and visualization of the data we use Matlab software.
4.6.1. Filtering
This method is based on the use of a polynomial approximate signal in order to separate
and distinguish the breathing and heartbeat signal
4.6.2. Center
This process consists on subtracting from the signal its average value in order to delete
the parasite DC value.
4.6.3. Autocorrelation
The correlation function measures the similarity between characteristics and the degree
of periodicity of a function. Operating on a single non-periodic function x(t), it is called the
autocorrelation function, denoted by:
𝑟𝑥𝑥(𝑡) = ∫ 𝑥(𝜏)𝑥(𝑡 + 𝜏)𝑑𝜏+∞
−∞
The autocorrelation defined by equation (…) measuring the resemblance between the
function x(t) and successively shifted versions of x(t+ 𝜏).
We use the autocorrelation to evidence the important and desired frequencies.
4.6.4. Fast Fourier Transform (FFT)
The fast Fourier transform (FFT) is an algorithm for computing the discrete Fourier
transform (DFT). A periodic function x(t) is not absolutely integrable (∫ |𝑥(𝑡)|𝑑𝑡 = ∞)+∞
−∞
and has not Fourier transform. The transform only exists at the boundary.
With the Fast Fourier Transform, we get the frequency value of interest.
Filtering Center Autocorrelati
on FFT
Figure 19 Signal processing

34
4.7. Results
As we can see in the following figures we obtain the same result for the frequency
corresponding to the breathing at different distances between the transmitter and the tag
using the metallic plate. In order to avoid as much as it is possible the noise signal we put
some absorber in the metallic plate. It is detected a variation in terms of the amplitude
according to the increase of the distance measures but the frequency remains.
-1 0 1 2 3 4 5 6 7 8
0
10
20
30
40
50
60
70
80
X: 0.298
Y: 87.64
Frequency (Hz)
Am
plit
ude
Freq: 0.298Hz
0 1 2 3 4 5 6 7 8 9 100
10
20
30
40
50
60
70
80
X: 0.298
Y: 85.89
Frequency (Hz)
Am
plit
ude
Freq: 0.298Hz
Figure 20: Breathing signal using metallic plate at 50 cm
Figure 21: Breathing signal using metallic plate at 1 m

35
Figure 22: Breathing signal using metallic plate at 2.5 m
Figure 23: Breathing signal using metallic plate at 5 m
These results show the identification of the breathing using the metallic plate at distances
of: (1) 50 centimetre from the transmitter, (2) 1 meter from the transmitter, (3) 2.5 meter
from the transmitter and (4) 5 meter from the transmitter. All the results corresponding to
the breathing are identified at the same frequency which is 0.298GHz from the carrier.
These system shows that the increase of the distance implies the decrease of the
received power. Moreover, in the following plots, we can see that the same thing happen
when we make the measures over an individual.
0 2 4 6 8 10 120
10
20
30
40
50
60
70 X: 0.298
Y: 72.23
Frequency (Hz)
Am
plit
ude
0 1 2 3 4 5 6 7 8
10
20
30
40
50
60
X: 0.298
Y: 66.07
Frequency (Hz)
Am
plit
ude

36
Figure 24: Individual’s vital signal measured wearing the tag at 1 m
Figure 25: Individual’s vital signal measured wearing the tag at 2.5 m
In Figure 24 and 25, it is shown the results obtained when the measures were taken in an
individual at 1 meter and at 2.5 meter. It can be identified the breathing at the same
frequency as detected with the metallic plate and at the same time the heartbeat in a
higher frequency. The breathing is detected at 0.293GHz from the carrier whereas the
heartbeat is identified at 1.465 GHz from the carrier at both distances. We can see a
difference in terms of power. At 2.5 meter, we receive less power than at 1 meter. The
other peaks correspond to the harmonics of the breathing signal and to the
intermodulation product between the heartbeat and the breathing of the individual.
Using this system we are able to detect and identify the vital signal responses of the
different individuals at different distances from the transmitter.
0 0.5 1 1.5 2 2.5 3 3.5 40
0.01
0.02
0.03
0.04
0.05
0.06
0.07 X: 0.293
Y: 0.07145
Frequency (Hz)
Am
plit
ude
-1 0 1 2 3 4 5 6 70
0.005
0.01
0.015
0.02
0.025
0.03
0.035
0.04
X: 0.293
Y: 0.04391
Frequency (Hz)
Am
plit
ude
Heartbeat
Heartbeat

37
5. Budget
In this chapter it is analyzed all the costs and the budget of the project. The goal of this
project is not to sell a final product, this is a researching project. Therefore, we try to
minimize the costs of our components asking for samples to different companies.
We get samples for the substrate used in fabrication process which is RO4003, 12mil
from the ROGERS Corporation company. Moreover, we also get samples for the mixer
and the amplifier used in the experimental measures from Hittite company.
Software used are: (1) MATLAB, for the data processing, (2) HFSS, for designing and
simulation of the RFID system and (3) ADS, for the layouts designing.
Components/ Software Units Price
MATLAB 1 2000 €
HFSS 1 2500 €
ADS 1 250 €
Substrate RO4003 3 0 €
LNA HMC263LP4E 1 0 €
Mixer HMC329LM3 1 0 €
Table 4: Project budget
For the ADS software, the university has access to donated copies for a reduced price.
In the following table is it shown the budget considering that the remuneration of a junior
engineer is 8€ per hour.
Remuneration
per hour
Months
in the
project
Hours
per day
Total
days
worked
Total
hours
Total
Cost
Junior
engineer 8 € 5 7 100 700 5600 €
Table 5: Junior engineer cost
The global cost of the project would be 10350€.
38
6. Conclusions
An MMID system for vital signal detection has been developed. The proposed system is
easy to fabricate, inexpensive and it is based on the identification of different vital signal
using different tags with different resonance frequency. It is seen that the different usage
of different tags don’t affect to the response of the frequency of breathing and the
heartbeat. All the tags have shown the same responses in terms of frequency. The
system has been tested with a mechanic device and with a real person. Both
experimental results are very similar that means that our initial predictions were correct.
Moreover, it is developed a polarization diversity system using the same tag with the
addition of a gap at different position that allows the identification of different individual in
terms of polarization. Using the same frequency carrier, we are able to detect and identify
the position of different tags knowing which type of linear polarization is sent.
The results shows that the MMID system proposed for both detection (using polarization
and frequency diversity) are the expected ones. We can detect the breathing and the
heartbeat of different individuals at different distances using a circular polarization tag.
Furthermore, using linear polarization tags we can identify different individuals at the
same carrier frequency.
39
7. Future development
The result of this work has produced an improvement in the vital signal detection and
identification by just using polarization and frequency diversity. For this reason, further
studies can be developed in order to obtain higher results combining both type of
polarization at the same time.
Furthermore, as it has been thought at the beginning of this thesis, it is possible to use
different RFID tags placed in different positions of the body in order to detect the posture
of the individual measured. Placing three different tags, one at the chest, other one at the
thigh and the last one at the shinbone, we can see if the individual is standing, sitting or
lying looking from what tag we receive signal.
Finally, it is possible to make developments in terms of signal processing improving the
algorithms used in MATLAB, it is possible to:
- Develop a more advanced signal processing algorithm that will reduce the noise
effect from the environment or human organs.
- Develop an algorithm taking into account the body movement.
40
Bibliography:
[1] K. Finkenzeller, “RFID Handbook - 2nd Edition”, John Wiley & Sons, Ltd., London,
2003.
[2] P. Pursula, T. Vaha-Heikkila, A. Muller, D. Neculoiu, G. Konstantinidis, A. Oja, J.
Tuovinen, “Millimeter-Wave identification – A new shortrange radio system for low-
power high data-rate applications”, IEEE Microwave Theory and Techniques, vol. 56,
no. 10, October 2008.
[3] A. Muller, D. Neculoiu, P. Pursula, T. Vaha-Heikkila, F. Giacomozzi, J. Tuovinen,
“Hybrid integrated micromachined receiver for 77 GHz millimeter wave identification
systems”, 2007 European Microwave Conference, pp:1034-1037, Munich, Germany,
October 2007.
[4] U. Kraiser and W. Steinhagen, “A low-power transponder IC for high performance
identification systems” IEE J. Solid-State Circuits, vol. 30, no. 3, pp. 306-310, Mar.
1995
[5] Klaus Finkenzeller, RFID Handbook Fundamentals and Applications in Contactless
Smart Cards and Identification, Wiley, 1999, ISBN: 0-470-84402-7, pag. 427
[6] Vipul Chawala and Dong Sam Ha, Virginia Polytechnic Institute and State University.
Applications & Practice An Overview of Passive RFID.
[7] S. Preradovic and N. Karmakar. (2009, Aug.). Modern RFID readers. Microwave J.
[Online]. Available: http://www.mwjournal.com/article.asp?HH_ID-AR_4830
[8] S. Preradovic and N. Karmakar, and I. Balbin, “RFID transponders”, IEE Microwave
Mag., vol 9, no. 5, pp. 90-103, Oct. 2008.
[9] Y. Cassivi, L. Perregrini, P. Arcioni, M. Bressan, K. Wu, and G. Conciauro,
“Dispersion characterisitics of substrate integrated rectangular waveguide,” IEEE
Microwave Wireless Compon. Letters, vol. 12, no. 9, pp. 333 – 335, Sep. 2002.
[10] D. Deslandes and K. Wu, “Accurate Modeling, Wave Mechanisms, and Design
Considerations of Substrate Integrated Waveguide,” IEEE Trans. Microwave Theory
Tech., vol. 54, pp. 2516-2526, June 2006.
[11] D. Deslandes and K. Wu, “Integrated Microstrip and Rectangular Waveguide in
Planar Form,” IEEE Microwave and Wireless Components Letters, vol. 11, pp. 68-70,
Feb. 2001.
[12] J. C. Lin, “Non-invasive microwave measurement of respiration,” Proceedings of
the IEEE, vol. 63, no.10, p. 1530, 1975

41
[13] K.-M. Chen, Y. Huang, J. Zhang, and A. Norman, “Microwave life-detection
systems for searching subjects under earthquake rubble or behind barrier,” IEEE
Transactions of Biomedical Engineering, vol. 47, no. 1, pp. 105-114, 2000
[14] E. F. Greneker, “Radar sensing of heartbeat and respiration at a distance with
applications of the technology,” in Radar 97 Conference Proceedings, 1997, pp. 150-
154.
[15] O. Boric-Lubecke, G. Atwater, and V. M. Lubecke, “Wireless LAN PC card
sensing of vital signs,” in Proceedings of IEEE Topical Conference on Wireless
Communications Technology, 2003, pp. 206-207.
[16] V. Lubecke, O. Boric-Lubecke, and E. Beck, “A compact low-cost add-on module
for Doppler radar sensing of vital signs using a wireless communications terminal,” in
The IEEE Microwave Theory and Techniques Symposium Digest, 2002, pp. 1767-
1770.
[17] I. Y. Immoreev and S. Samkov, “Short-distance ultrawideband radars,” IEEE
Aerospace and Electronic Systems Magazine, vol 20, no. 6, pp. 9-14, 2005.
[18] K. Gong , Z. N. Chen , X. Qing , P. Chen and W. Hong , "Substrate integrated
waveguide cavity-backed wide slot antennafor 60-GHz bands" , IEEE Trans.
Antennas Propag. , vol. 60 , no. 12 , pp.6023 -6026 , 2012
[19] T. Zhang, W. Hong, Y. Zhang, and K. Wu, “Design and Analysis of SIW Cavity
Backed Dual-Band Antennas With a Dual-Mode Triangular-Ring Slot,” IEEE Trans.
Antennas Propag., 2014.
[20] L. Chioukh, H. Boutayeb, D. Deslandes, and K. Wu, “ harmonic radar system with
optimal detection of vital signs,” in IEEE Eur. Microw. Conf., Amsterdam, The
Netherlands, Oct. 2012, pp. 25–28.
[21] L. Chioukh, H. Boutayeb, D. Deslandes, and K. Wu, “Noise and sensitivity
analysis of harmonic radar system for vital sign detection,” in RF Wireless Technol.
Biomed. Healthcare Appl., Singapore, Dec. 2013, pp. 1–3.
[22] A. Doghri, A. Ghiotto, T. Djerafi, and K. Wu, “Compact and low cost substrate
integrated waveguide cavity and bandpass filter using surface mount shorted stubs,”
in Proc. IEEE MTT-S Int. Microw. Symp., Montreal, Jun. 2012, pp. 1-3. W.-K. Chen,
Linear Networks and Systems. Belmont, CA: Wadsworth, 1993, pp. 123–135.
[23] K. Wu, D. Deslandes and Y. Cassivi , "The substrate integrated circuits. A new
conceptfor high-frequency electronics and optoelectronics" , Proc. 6th Int. Conf.
Telecommun. Modern Satellite, Cableand Broadcasting , vol. 1 , pp.P-III -P-X , 2003

42
[24] C. Gabriel and S. Gabriel: “Compilation of the Dielectric Properties of Body
Tissues at RF and Microwave Frequencies”, Internet document; URL:
http://niremf.ifac.cnr.it/docs/DIELECTRIC/Report.html#Results.
[25] Consumer and Clinical Radiation Protection Bureau, “Limits of Human Exposure
to Radiofrequency Electromagnetic Energy in the Frequency Range from 3 kHz to
300 GHz”. Available: http://www.hc-sc.gc.ca/ewh-semt/consult/_2014/safety_code_6-
code_securite_6/final_finale-eng.php

43
Glossary
RFID: Radiofrequency Identification
MMID: Millimetre wave Identification
EPM: École Politechnique de Montréal
SIW: Substrate Integrated Waveguide
mmW: millimetre waves