mlpa 2016 annual investor conference - …€¦ · mlpa 2016 annual investor conference ......
TRANSCRIPT
1Boardwalk Louisiana Midstream: Sulphur HubPineville Compressor Station
MLPA 2016 Annual Investor ConferenceJune 2016
Pineville Compressor Station

2
Important Information
2
Forward-looking statements disclosureStatements made at this conference or in the materials distributed in conjunction with this conference that contain "forward-lookingstatements" include, but are not limited to, statements using the words “believe”, “expect”, “plan”, “intend”, “anticipate”, “estimate”,“project”, “should” and similar expressions, as well as other statements concerning our future plans, objectives, and expectedperformance, including statements with respect to the completion, cost, timing and financial performance of growth projects. Suchstatements are inherently subject to a variety of risks and uncertainties that could cause actual results to differ materially from thoseprojected.
Forward-looking statements speak only as of the date they are made, and the company expressly disclaims any obligation orundertaking to release publicly any updates or revisions to any forward-looking statement contained herein or made at thisconference to reflect any change in our expectations with regard thereto or any change in events, conditions or circumstances onwhich any such statement is based.
For information about important Risk Factors that could cause our actual results to differ from those expressed in the forward-lookingstatements contained in this presentation or discussed at this conference please see “Available Information and Risk Factors,” below.Given the Risk Factors referred to below, investors and analysts should not place undue reliance on forward-looking statements.
Available Information and Risk Factors
We file annual, quarterly and current reports and other information with the Securities and Exchange Commission, or “SEC”. Our SECfilings are available to the public over the internet at our website, www.bwpmlp.com, and at the SEC’s website www.sec.gov.
Our filings with the SEC contain important information which anyone considering the purchase of our debt securities or limitedpartnership units should read.
Our business faces many risks. We have described in our SEC filings some of the more material risks we face. There may be additionalrisks that we do not yet know or that we do not currently perceive to be material that may also impact our business. Each of the risksand uncertainties described in our SEC filings could lead to events or circumstances that may have a material adverse effect on ourbusiness, financial condition, results of operations or cash flows, including our ability to make distributions to our unitholders.
Our limited partnership units are listed on the New York Stock Exchange under the trading symbol “BWP”.
33Boardwalk Louisiana Midstream: Sulphur HubPineville Compressor StationPineville Compressor Station
Company Overview
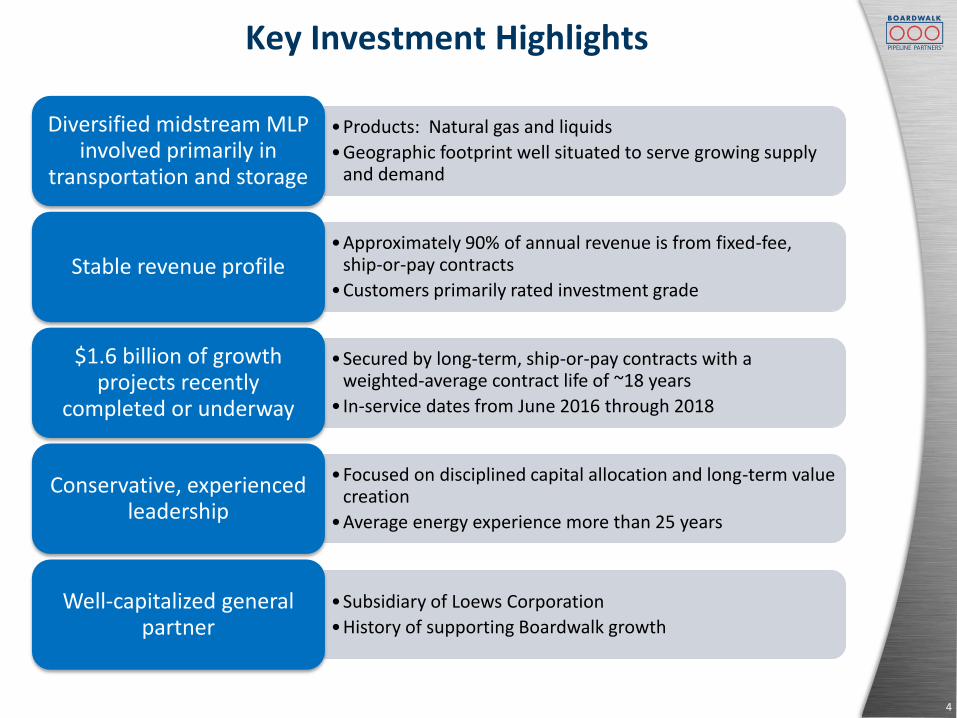
Key Investment Highlights
4
•Products: Natural gas and liquids
•Geographic footprint well situated to serve growing supply and demand
Diversified midstream MLP involved primarily in
transportation and storage
•Approximately 90% of annual revenue is from fixed-fee, ship-or-pay contracts
•Customers primarily rated investment grade Stable revenue profile
•Secured by long-term, ship-or-pay contracts with a weighted-average contract life of ~18 years
• In-service dates from June 2016 through 2018
$1.6 billion of growth projects recently
completed or underway
•Focused on disciplined capital allocation and long-term value creation
•Average energy experience more than 25 years
Conservative, experienced leadership
•Subsidiary of Loews Corporation
•History of supporting Boardwalk growthWell-capitalized general
partner
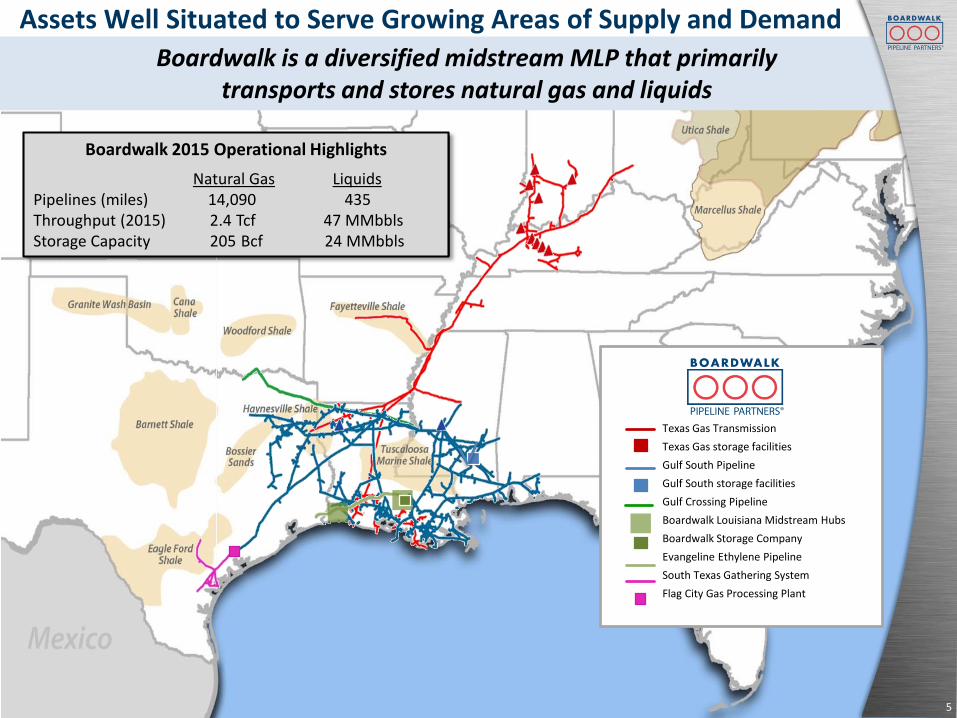
Texas Gas Transmission
Texas Gas storage facilities
Gulf South Pipeline
Gulf South storage facilities
Gulf Crossing Pipeline
Boardwalk Louisiana Midstream Hubs
Boardwalk Storage Company
Evangeline Ethylene Pipeline
South Texas Gathering System
Flag City Gas Processing Plant
Boardwalk 2015 Operational Highlights
Natural Gas LiquidsPipelines (miles) 14,090 435Throughput (2015) 2.4 Tcf 47 MMbblsStorage Capacity 205 Bcf 24 MMbbls
Boardwalk is a diversified midstream MLP that primarily transports and stores natural gas and liquids
Assets Well Situated to Serve Growing Areas of Supply and Demand
5

Organizational Structure
6
49% L.P. interest*2% G.P. interest
49% L.P. interest
BPHCLoews Corporation Subsidiary
Boardwalk Pipeline Partners, LPNYSE: BWP
Public Unitholders
Boardwalk Pipelines, LP
*As of March 31, 2016 and excluding incentive distribution rights
Boardwalk Midstream, LLC
Texas Gas Transmission, LLC
(Texas Gas)
Gulf Crossing Pipeline Company LLC
(Gulf Crossing)
Gulf South Pipeline Company, LP (Gulf South)
Boardwalk Field Services, LLC
(BFS)
Boardwalk Louisiana Midstream, LLC
(BLM)
Boardwalk Storage Company, LLC
Boardwalk Petrochemical Pipeline, LLC (Evangeline)
Boardwalk’s GP: Loews Corporation Subsidiary
7
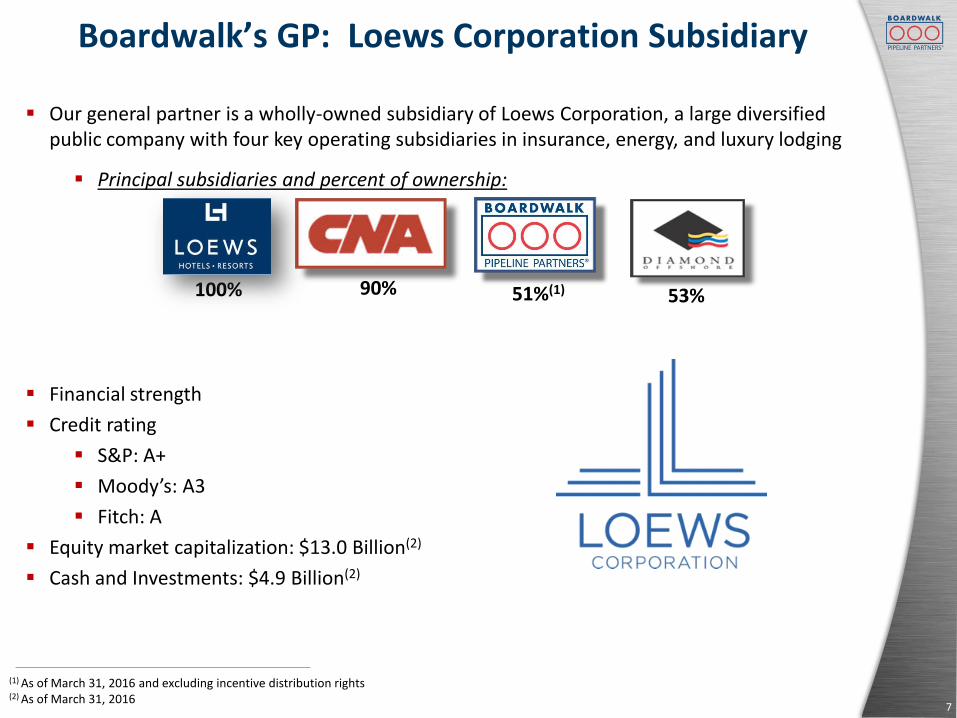
Our general partner is a wholly-owned subsidiary of Loews Corporation, a large diversified public company with four key operating subsidiaries in insurance, energy, and luxury lodging
Principal subsidiaries and percent of ownership:
Financial strength
Credit rating
S&P: A+
Moody’s: A3
Fitch: A
Equity market capitalization: $13.0 Billion(2)
Cash and Investments: $4.9 Billion(2)
(1) As of March 31, 2016 and excluding incentive distribution rights(2) As of March 31, 2016
100% 51%(1)90% 53%

88Boardwalk Louisiana Midstream: Sulphur HubPineville Compressor StationPineville Compressor Station
Strategy
Boardwalk Strategy
9
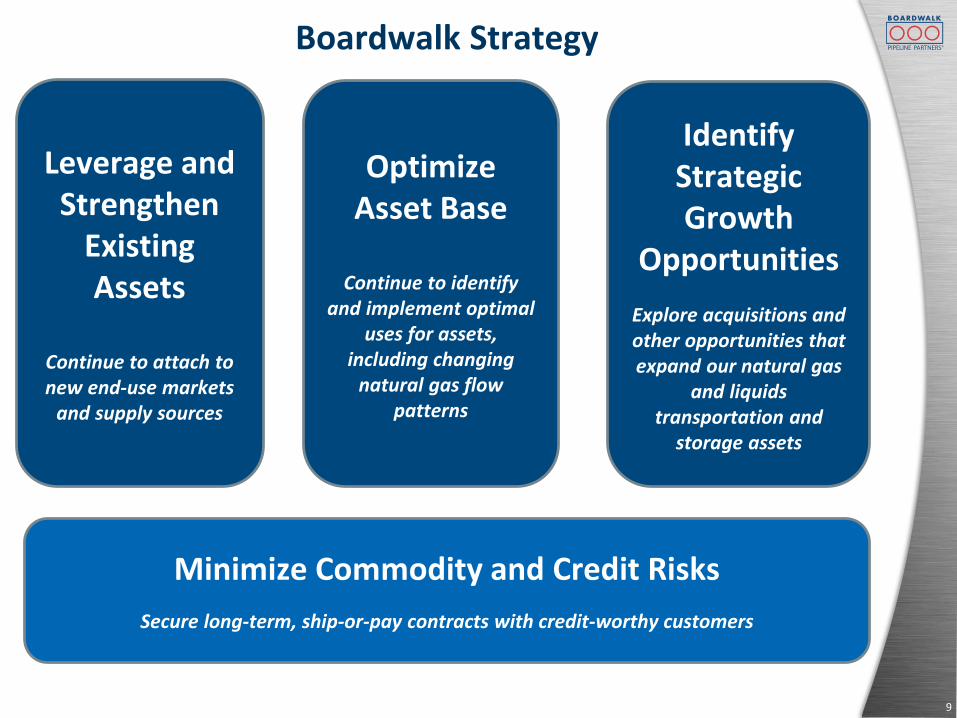
Leverage and Strengthen
Existing Assets
Continue to attach to new end-use markets
and supply sources
Identify Strategic Growth
Opportunities
Explore acquisitions and other opportunities that expand our natural gas
and liquids transportation and
storage assets
Optimize Asset Base
Continue to identify and implement optimal
uses for assets, including changing
natural gas flow patterns
Minimize Commodity and Credit Risks
Secure long-term, ship-or-pay contracts with credit-worthy customers

10
Ohio to Louisiana Access$115 million in capex
Capacity: 626,000 MMBtu/dIn service: June 2016
Sasol Ethane Cracker$145 million in capex
In service: Late 2017 (est)
Southern Indiana Lateral$75 million in capex
Capacity: 53,500 MMBtu/dIn service: Q3-2016 (est)
Western Kentucky Lateral$80 million in capex
Capacity: 230,000 MMBtu/dIn service: Q3-2016 (est)
(1) Subject to FERC approval (2) Subject to customary approvals
Brine Supply Agreements$45 million in capex
In service: Q4-2015 and Mid-2018 (est)
Coastal Bend Header$720 million in capex
Capacity: 1.4 Bcf/dIn service: 2018 (est) (1)
Power Plant in South Texas$80 million in capex
Capacity: 185,000 MMBtu/dIn service: Q3-2016 (est)
Northern Supply Access$310 million in capex
Capacity: 384,000 MMBtu/dIn service: H1-2017 (est)
Please refer to appendix for additional project information
$1.6 Billion of Growth Projects Recently Completed or Underway
Other Projects to Serve End-Use Markets$60 million in capex
In service: 2018 (est) (2)
10

1111Boardwalk Louisiana Midstream: Sulphur HubPineville Compressor StationPineville Compressor Station
Market Fundamentals
Assets Well Situated to Serve Growing Areas of Supply
12
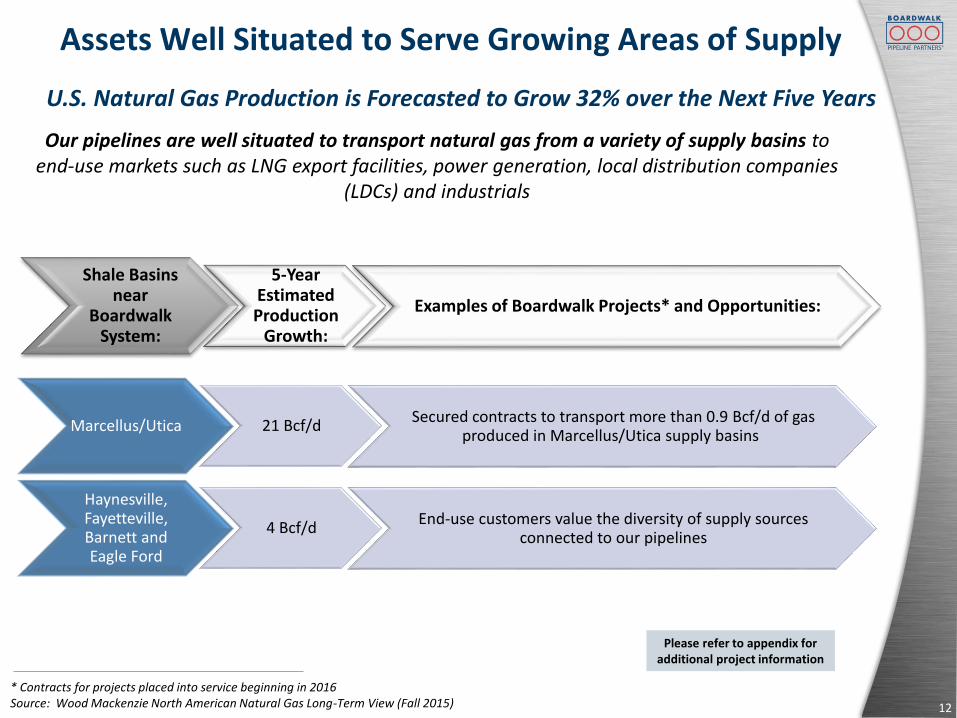
U.S. Natural Gas Production is Forecasted to Grow 32% over the Next Five Years
Shale Basins near
Boardwalk System:
5-Year Estimated Production
Growth:
Examples of Boardwalk Projects* and Opportunities:
Our pipelines are well situated to transport natural gas from a variety of supply basins to end-use markets such as LNG export facilities, power generation, local distribution companies
(LDCs) and industrials
* Contracts for projects placed into service beginning in 2016Source: Wood Mackenzie North American Natural Gas Long-Term View (Fall 2015)
Marcellus/Utica 21 Bcf/dSecured contracts to transport more than 0.9 Bcf/d of gas
produced in Marcellus/Utica supply basins
Haynesville, Fayetteville, Barnett and Eagle Ford
4 Bcf/dEnd-use customers value the diversity of supply sources
connected to our pipelines
Please refer to appendix for additional project information

Assets Well Situated to Serve Growing Areas of Demand
13
U.S. Natural Gas DEMAND and EXPORTS are Forecasted to Grow 26% over the Next 5 Years
Market:5-Year Estimated Demand Growth:
Examples of Boardwalk Projects* and Opportunities:
Our pipelines are well situated to transport natural gas from a variety of supply basins to end-use markets such as LNG export facilities, power generation, LDCs and industrials, and our flexible services
are valued by power plant operators
Our storage assets are well situated to store natural gas to absorbs swings at end-use market facilities, such as LNG export, power generation, LDCs and industrial
* Contracts for projects placed into service beginning in 2016Source: Wood Mackenzie North American Natural Gas Long-Term View (Fall 2015) for natural gas; IHS and Boardwalk for ethylene
Please refer to appendix for additional project information
Power and Industrials
(natural gas)
8 Bcf/d
Secured contracts to transport approximately 0.9 Bcf/d of natural gas to serve power and industrial customers
Our percentage of revenues from power plants more than quadrupled to 17% between 2010 and 2015
Industrials
(liquids)
5 billion pounds short net ethylene
capacity in E. Louisiana
Secured contracts to transport and store ethane, ethylene and brine to serve petrochemical customers
LNG
(natural gas)7 Bcf/d
Secured contracts to transport approximately 1.7 Bcf/d of natural gas to serve two LNG export facilities under
construction in the Gulf Coast
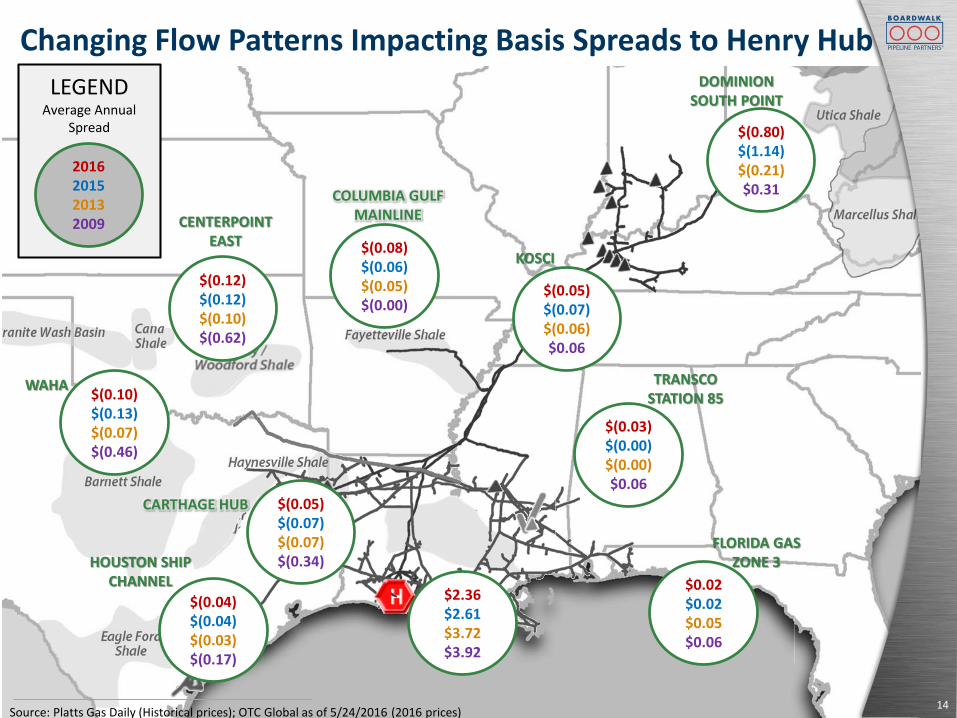
Changing Flow Patterns Impacting Basis Spreads to Henry Hub
14
14
Source: Platts Gas Daily (Historical prices); OTC Global as of 5/24/2016 (2016 prices)
LEGENDAverage Annual
Spread
CENTERPOINT EAST
HOUSTON SHIPCHANNEL
CARTHAGE HUB
KOSCI
TRANSCOSTATION 85
FLORIDA GAS ZONE 3
$(0.10)$(0.13)$(0.07)$(0.46)
WAHA
COLUMBIA GULF MAINLINE
$(0.12)$(0.12)$(0.10)$(0.62)
$(0.04)$(0.04)$(0.03)$(0.17)
$(0.05)$(0.07)$(0.07)$(0.34)
$(0.08)$(0.06)$(0.05)$(0.00)
$2.36$2.61$3.72$3.92
$(0.05)$(0.07)$(0.06)$0.06
$(0.03)$(0.00)$(0.00)$0.06
$0.02$0.02$0.05$0.06
2016201520132009
DOMINION SOUTH POINT
$(0.80)$(1.14)$(0.21)$0.31
14
1515Boardwalk Louisiana Midstream: Sulphur HubPineville Compressor StationPineville Compressor Station
Financial Highlights
16
Financial Highlights
Financial Profile
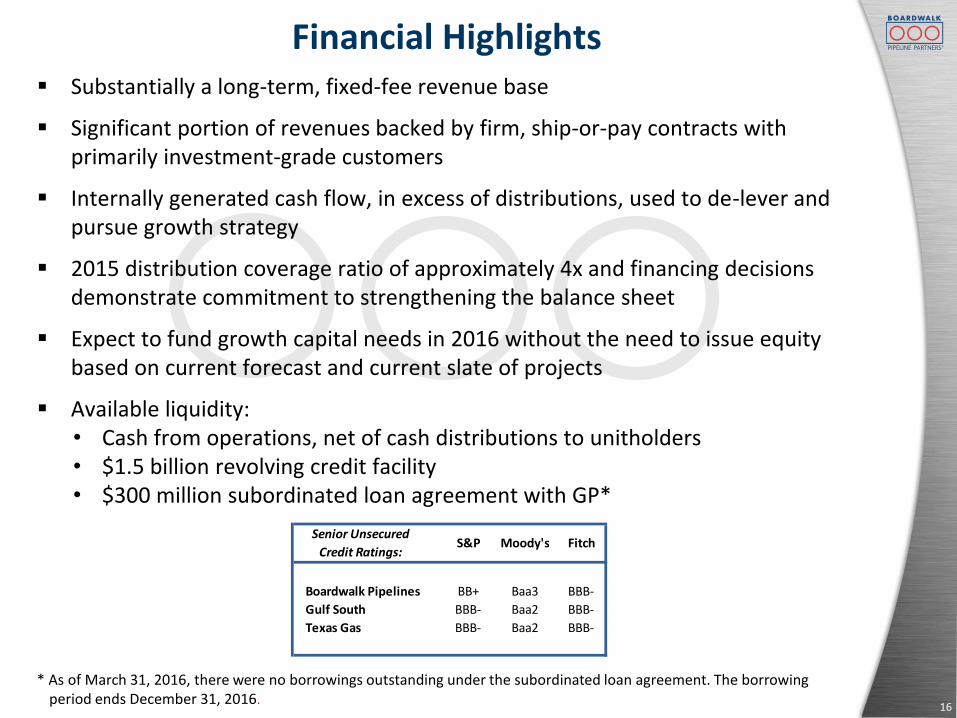
Substantially a long-term, fixed-fee revenue base
Significant portion of revenues backed by firm, ship-or-pay contracts with primarily investment-grade customers
Internally generated cash flow, in excess of distributions, used to de-lever and pursue growth strategy
2015 distribution coverage ratio of approximately 4x and financing decisions demonstrate commitment to strengthening the balance sheet
Expect to fund growth capital needs in 2016 without the need to issue equity based on current forecast and current slate of projects
Available liquidity:• Cash from operations, net of cash distributions to unitholders• $1.5 billion revolving credit facility• $300 million subordinated loan agreement with GP*
Boardwalk Pipelines BB+ Baa3 BBB-
Gulf South BBB- Baa2 BBB-
Texas Gas BBB- Baa2 BBB-
S&P Moody's FitchSenior Unsecured
Credit Ratings:
* As of March 31, 2016, there were no borrowings outstanding under the subordinated loan agreement. The borrowing period ends December 31, 2016.
EBITDA and Leverage Improving
17
($ m
illio
ns)
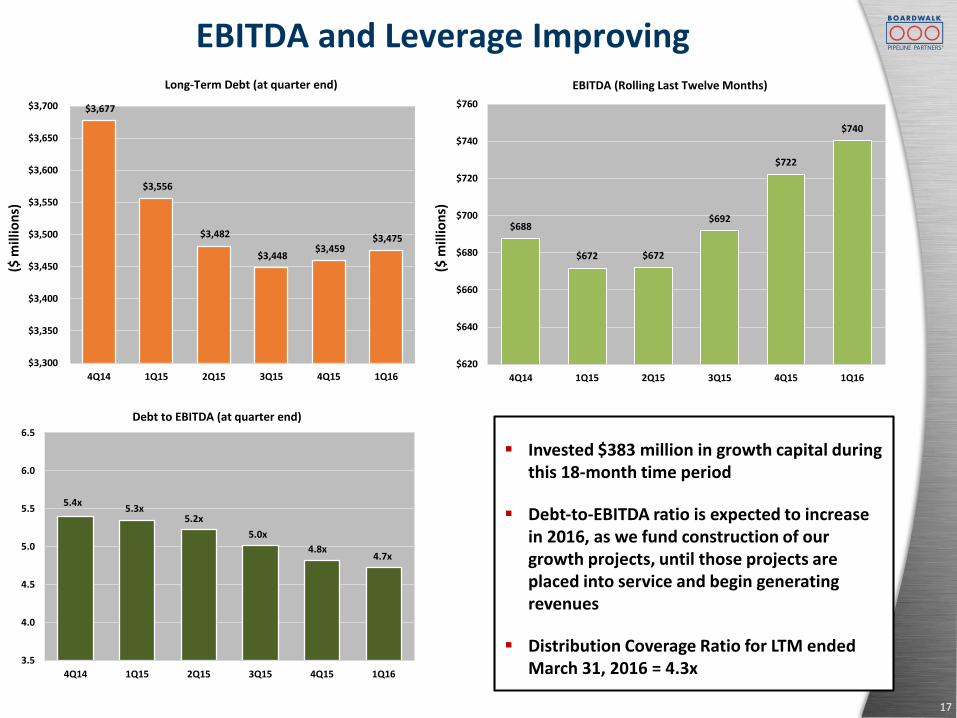
$3,677
$3,556
$3,482
$3,448 $3,459
$3,475
$3,300
$3,350
$3,400
$3,450
$3,500
$3,550
$3,600
$3,650
$3,700
4Q14 1Q15 2Q15 3Q15 4Q15 1Q16
Long-Term Debt (at quarter end)
3.5
4.0
4.5
5.0
5.5
6.0
6.5
4Q14 1Q15 2Q15 3Q15 4Q15 1Q16
Debt to EBITDA (at quarter end)
5.4x5.3x
5.2x
5.0x
4.8x4.7x
Invested $383 million in growth capital during this 18-month time period
Debt‐to‐EBITDA ratio is expected to increase in 2016, as we fund construction of our growth projects, until those projects are placed into service and begin generating revenues
Distribution Coverage Ratio for LTM ended March 31, 2016 = 4.3x
($ m
illio
ns)
$688
$672 $672
$692
$722
$740
$620
$640
$660
$680
$700
$720
$740
$760
4Q14 1Q15 2Q15 3Q15 4Q15 1Q16
EBITDA (Rolling Last Twelve Months)
Capitalization
18
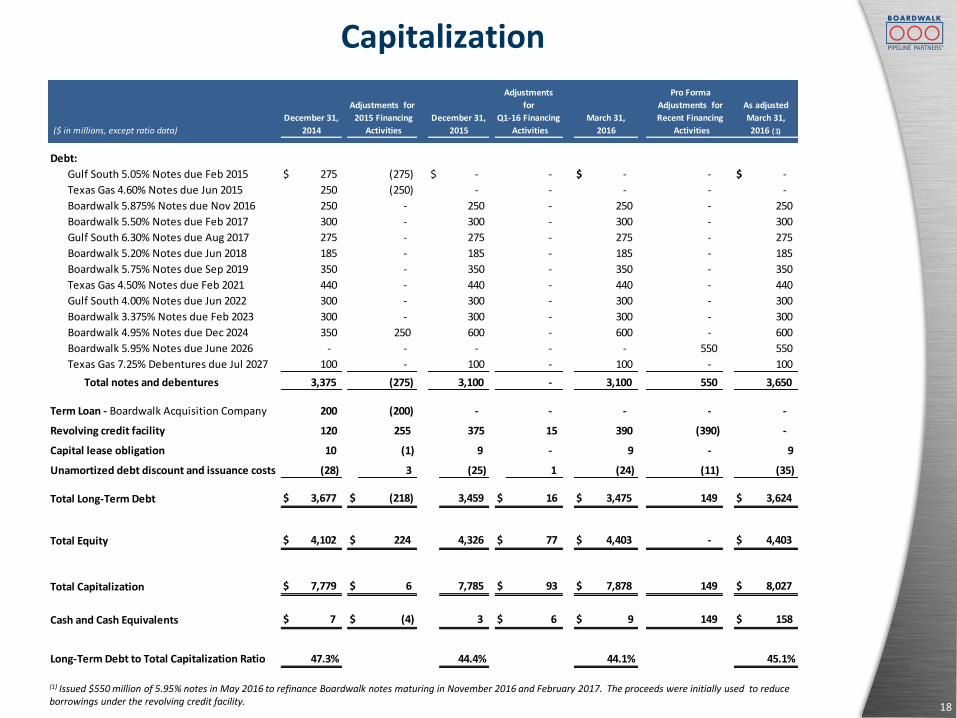
(1) Issued $550 million of 5.95% notes in May 2016 to refinance Boardwalk notes maturing in November 2016 and February 2017. The proceeds were initially used to reduce borrowings under the revolving credit facility.
($ in millions, except ratio data)
Gulf South 5.05% Notes due Feb 2015 $ 275 (275) $ - - $ - - $ -
Texas Gas 4.60% Notes due Jun 2015 250 (250) - - - - -
Boardwalk 5.875% Notes due Nov 2016 250 - 250 - 250 - 250
Boardwalk 5.50% Notes due Feb 2017 300 - 300 - 300 - 300
Gulf South 6.30% Notes due Aug 2017 275 - 275 - 275 - 275
Boardwalk 5.20% Notes due Jun 2018 185 - 185 - 185 - 185
Boardwalk 5.75% Notes due Sep 2019 350 - 350 - 350 - 350
Texas Gas 4.50% Notes due Feb 2021 440 - 440 - 440 - 440
Gulf South 4.00% Notes due Jun 2022 300 - 300 - 300 - 300
Boardwalk 3.375% Notes due Feb 2023 300 - 300 - 300 - 300
Boardwalk 4.95% Notes due Dec 2024 350 250 600 - 600 - 600
Boardwalk 5.95% Notes due June 2026 - - - - - 550 550
Texas Gas 7.25% Debentures due Jul 2027 100 - 100 - 100 - 100
Total notes and debentures 3,375 (275) 3,100 - 3,100 550 3,650
200 (200) - - - - -
120 255 375 15 390 (390) -
10 (1) 9 - 9 - 9
Unamortized debt discount and issuance costs (28) 3 (25) 1 (24) (11) (35)
$ 3,677 $ (218) 3,459 $ 16 $ 3,475 149 $ 3,624
$ 4,102 $ 224 4,326 $ 77 $ 4,403 - $ 4,403
$ 7,779 $ 6 7,785 $ 93 $ 7,878 149 $ 8,027
$ 7 $ (4) 3 $ 6 $ 9 149 $ 158
47.3% 44.4% 44.1% 45.1%
Cash and Cash Equivalents
Long-Term Debt to Total Capitalization Ratio
Term Loan - Boardwalk Acquisition Company
Revolving credit facility
Capital lease obligation
Debt:
As adjusted
March 31,
2016 (1)
Pro Forma
Adjustments for
Recent Financing
Activities
Total Equity
Total Capitalization
December 31,
2015
Adjustments
for
Q1-16 Financing
Activities
March 31,
2016
December 31,
2014
Adjustments for
2015 Financing
Activities
Total Long-Term Debt
$0
$100
$200
$300
$400
$500
$600
$700
$800
$900
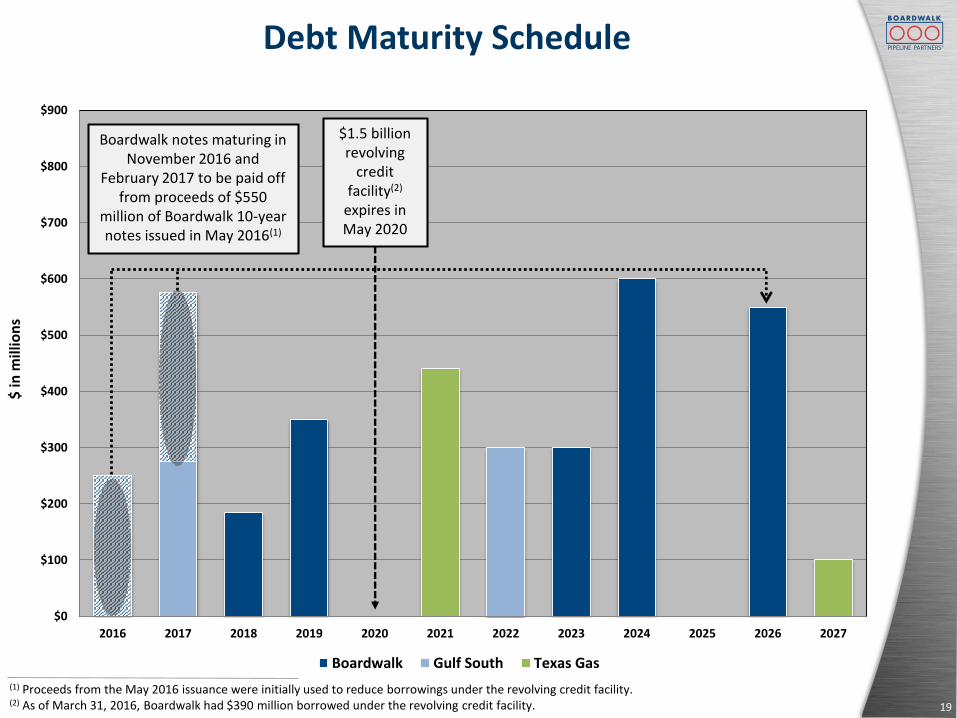
2016 2017 2018 2019 2020 2021 2022 2023 2024 2025 2026 2027
Boardwalk Gulf South Texas Gas
Debt Maturity Schedule$
in m
illio
ns
(1) Proceeds from the May 2016 issuance were initially used to reduce borrowings under the revolving credit facility.(2) As of March 31, 2016, Boardwalk had $390 million borrowed under the revolving credit facility. 19
$1.5 billion revolving
credit facility(2)
expires in May 2020
Boardwalk notes maturing in November 2016 and
February 2017 to be paid off from proceeds of $550
million of Boardwalk 10-year notes issued in May 2016(1)
Boardwalk Revenue Profile Backed by Firm, Long-term Contracts
20
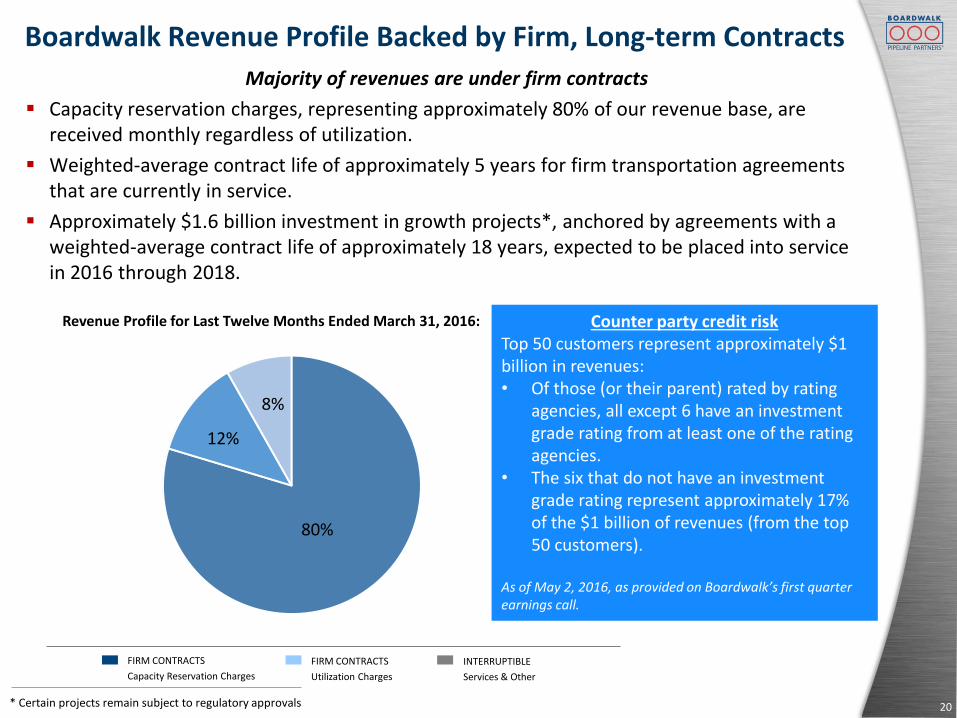
Majority of revenues are under firm contracts
Capacity reservation charges, representing approximately 80% of our revenue base, are received monthly regardless of utilization.
Weighted-average contract life of approximately 5 years for firm transportation agreements that are currently in service.
Approximately $1.6 billion investment in growth projects*, anchored by agreements with a weighted-average contract life of approximately 18 years, expected to be placed into service in 2016 through 2018.
FIRM CONTRACTS
Capacity Reservation Charges
FIRM CONTRACTS
Utilization Charges
INTERRUPTIBLE
Services & Other
* Certain projects remain subject to regulatory approvals
9%
12%
79%
12%
8%
80%
12%
9%
79%
Revenue Profile for Last Twelve Months Ended March 31, 2016:
80%
12%
8%
Counter party credit risk Top 50 customers represent approximately $1 billion in revenues: • Of those (or their parent) rated by rating
agencies, all except 6 have an investment grade rating from at least one of the rating agencies.
• The six that do not have an investment grade rating represent approximately 17% of the $1 billion of revenues (from the top 50 customers).
As of May 2, 2016, as provided on Boardwalk’s first quarter earnings call.
Contracted Firm Transportation Revenues
21
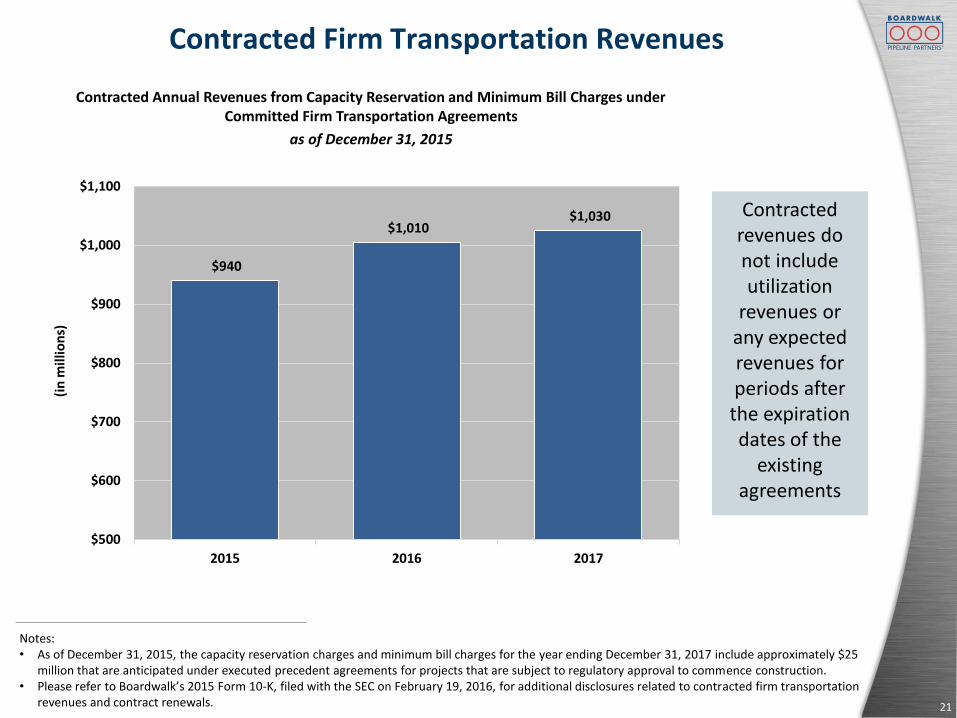
Contracted Annual Revenues from Capacity Reservation and Minimum Bill Charges under Committed Firm Transportation Agreements
as of December 31, 2015
Contracted revenues do not include utilization
revenues or any expected revenues for periods after the expiration dates of the
existing agreements
Notes:• As of December 31, 2015, the capacity reservation charges and minimum bill charges for the year ending December 31, 2017 include approximately $25
million that are anticipated under executed precedent agreements for projects that are subject to regulatory approval to commence construction.• Please refer to Boardwalk’s 2015 Form 10-K, filed with the SEC on February 19, 2016, for additional disclosures related to contracted firm transportation
revenues and contract renewals.
$940
$1,010 $1,030
$500
$600
$700
$800
$900
$1,000
$1,100
2015 2016 2017
(in
mil
lion
s)
2222Boardwalk Louisiana Midstream: Sulphur HubPineville Compressor StationPineville Compressor Station
Appendix
Boardwalk’s Growth Projects
23
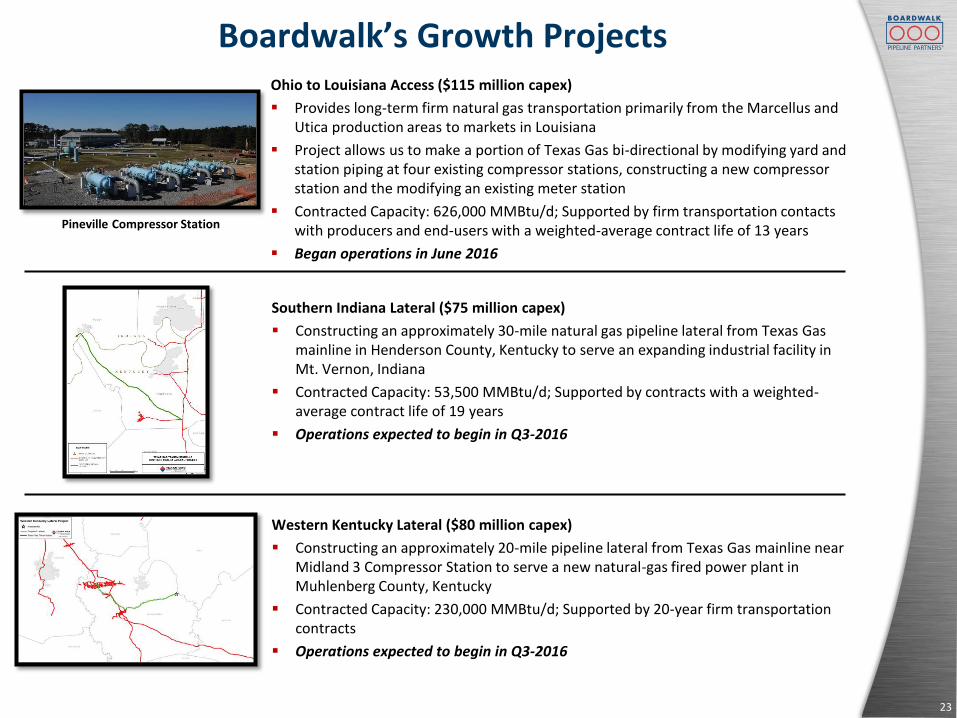
Ohio to Louisiana Access ($115 million capex)
Provides long-term firm natural gas transportation primarily from the Marcellus and Utica production areas to markets in Louisiana
Project allows us to make a portion of Texas Gas bi-directional by modifying yard and station piping at four existing compressor stations, constructing a new compressor station and the modifying an existing meter station
Contracted Capacity: 626,000 MMBtu/d; Supported by firm transportation contacts with producers and end-users with a weighted-average contract life of 13 years
Began operations in June 2016
Southern Indiana Lateral ($75 million capex)
Constructing an approximately 30-mile natural gas pipeline lateral from Texas Gas mainline in Henderson County, Kentucky to serve an expanding industrial facility in Mt. Vernon, Indiana
Contracted Capacity: 53,500 MMBtu/d; Supported by contracts with a weighted-average contract life of 19 years
Operations expected to begin in Q3-2016
Western Kentucky Lateral ($80 million capex)
Constructing an approximately 20-mile pipeline lateral from Texas Gas mainline near Midland 3 Compressor Station to serve a new natural-gas fired power plant in Muhlenberg County, Kentucky
Contracted Capacity: 230,000 MMBtu/d; Supported by 20-year firm transportation contracts
Operations expected to begin in Q3-2016
Pineville Compressor Station

Boardwalk’s Growth Projects
24
Project to serve a Power Plant Project in South Texas ($80 million capex)
Project consists of new receipt and delivery laterals, additional compression facilities and modification of our existing facilities to increase the operating capacity of certain sections of Gulf South Pipeline to serve a new natural gas-fired power plant in South Texas
Contracted Capacity: 185,000 MMBtud/d; Supported by a 20-year firm transportation contract
Operations expected to begin in Q3-2016
Northern Supply Access ($310 million capex)
Project will increase the firm north-to-south natural gas transmission capacity on Texas Gas by the addition of compression facilities and other system modifications
Project Capacity: 384,000 MMBtu/d
284,000 MMBtu/d contracted (1) (2)
100,000 MMBtu/d available (due to customer bankruptcy) (1)
Operations expected to begin in H1-2017
Approx. Amount of North-to-South Capacity Being Marketed:• 100,000 MMBtu/d (1) included in the Northern Supply Access Project (available due to customer bankruptcy)• 270,000 MMBtu/d of additional north-to-south capacity remaining (requires incremental capex)
(1) Originally the Northern Supply Access Project’s full capacity of 384,000 MMBtu/d was supported by precedent agreements. However, a customer in bankruptcy rejected its commitment to purchase 100,000 MMBtu/d of capacity in the project, and we havean unsecured claim in the bankruptcy proceedings.
(2) A second customer, with a contracted capacity of 30,000 MMBtu/d in the project, did not increase its required credit support per the terms of its credit support agreement. A firm transportation agreement with this customer has been executed, and we are in discussions regarding the required credit support.

Boardwalk’s Growth Projects
25
Coastal Bend Header ($720 million capex)
Constructing a 65-mile header pipeline and new compressor station that will transport natural gas to serve a liquefied natural gas (LNG) liquefaction terminal under construction near Freeport, Texas
Project will also expand and modify a portion of Gulf South Pipeline in Southeast Texas
Contracted Capacity: Approximately 1.4 Bcf/d with 20-year firm precedent agreements
Operations expected to begin in 2018
Project is subject to FERC approval
Sulphur Storage and Pipeline Expansion ($145 million capex)
Project to provide ethane and ethylene transportation and storage services to Sasol’s ethane cracker under construction near BLM’s Sulphur Hub
Will involve significant storage and infrastructure development to serve Sasol and other petrochemical customers near our Sulphur Hub
Operations expected to begin in late 2017
Brine Development Project ($45 million capex)
Executed agreements with a petrochemical customer in Louisiana to provide brine supply services, subject to certain minimum take requirements
The first portion of the project, which was placed into service in the fourth quarter 2015, consisted of constructing a pipeline to the customer’s facilities to supply brine over a three-year period
The second portion, expected to be placed into service in 2018, consists of providing brine supply services over a 15-year period through the development of additional wells and associated facilities
Construction of Sasol’s ethane cracker
Choctaw Hub

26
Incremental Loads to End-Use Markets
IN SERVICEConnection to power plant in Kentucky
• Firm transportation and no-notice service agreements to serve new combined-cycle power plant in Kentucky began November 1, 2014
• Commitment to deliver approximately 105,000 MMBtu/d with weighted-average contract life of approximately 9 years
EXECUTED AGREEMENTConnection to power plant in Indiana
• Executed 5-year firm and no-notice service agreements to serve new gas-fired power plant in Indiana with targeted in-service date of Q2-2017
• Commitments to deliver approximately 105,000 MMBtu/d
IN SERVICEConnection to industrial plant in Louisiana
• Executed 11-year firm transportation agreement to serve a new industrial plant in Louisiana with an in-service date of January 1, 2016
• Firm commitment to deliver approximately 100,000 MMBtu/d of natural gas
Recent contracts to provide approximately 490,000 MMBtu/d of natural gas deliveries to power and industrial plants with minimal capital requirements
IN SERVICEIncremental firm load to power plant in Indiana• Executed 5-year+ firm agreement to serve an
existing power plant connected to Texas Gas with a start date of January 1, 2016
• Firm commitment to deliver approximately 180,000 MMBtu/d

Key Investment Highlights
27
•Products: Natural gas and liquids
•Geographic footprint well situated to serve growing supply and demand
Diversified midstream MLP involved primarily in
transportation and storage
•Approximately 90% of annual revenue is from fixed-fee, ship-or-pay contracts
•Customers primarily rated investment grade Stable revenue profile
•Secured by long-term, ship-or-pay contracts with a weighted-average contract life of ~18 years
• In-service dates from June 2016 through 2018
$1.6 billion of growth projects recently
completed or underway
•Focused on disciplined capital allocation and long-term value creation
•Average energy experience more than 25 years
Conservative, experienced leadership
•Subsidiary of Loews Corporation
•History of supporting Boardwalk growthWell-capitalized general
partner
EBITDA Reconciliation
28
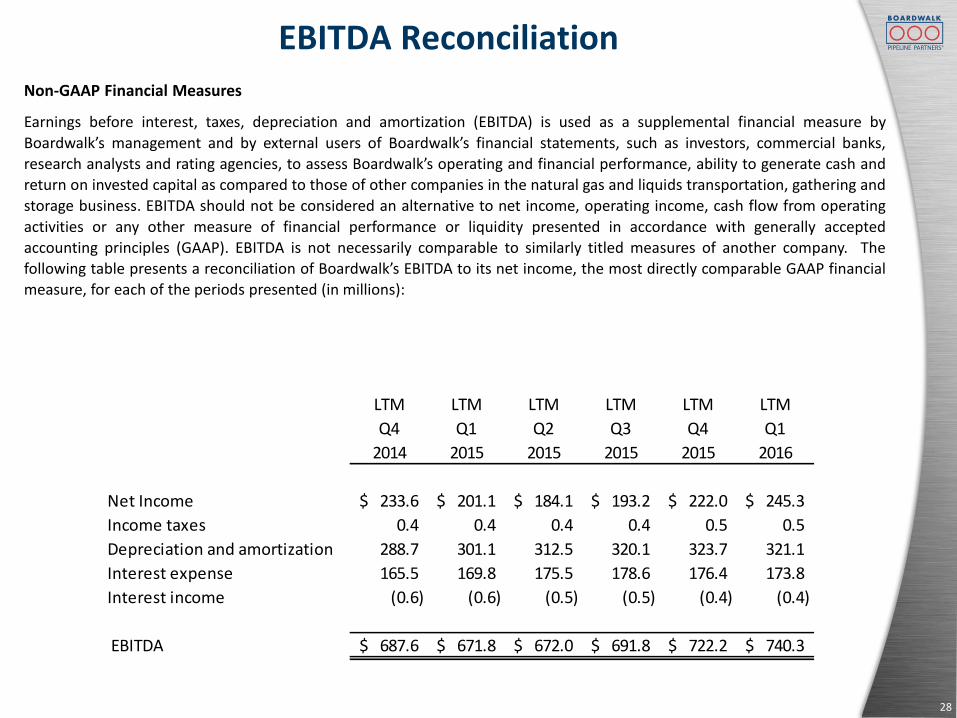
Non-GAAP Financial Measures
Earnings before interest, taxes, depreciation and amortization (EBITDA) is used as a supplemental financial measure by
Boardwalk’s management and by external users of Boardwalk’s financial statements, such as investors, commercial banks,
research analysts and rating agencies, to assess Boardwalk’s operating and financial performance, ability to generate cash and
return on invested capital as compared to those of other companies in the natural gas and liquids transportation, gathering and
storage business. EBITDA should not be considered an alternative to net income, operating income, cash flow from operating
activities or any other measure of financial performance or liquidity presented in accordance with generally accepted
accounting principles (GAAP). EBITDA is not necessarily comparable to similarly titled measures of another company. The
following table presents a reconciliation of Boardwalk’s EBITDA to its net income, the most directly comparable GAAP financial
measure, for each of the periods presented (in millions):
LTM LTM LTM LTM LTM LTM
Q4 Q1 Q2 Q3 Q4 Q1
2014 2015 2015 2015 2015 2016
Net Income 233.6$ 201.1$ 184.1$ 193.2$ 222.0$ 245.3$
Income taxes 0.4 0.4 0.4 0.4 0.5 0.5
Depreciation and amortization 288.7 301.1 312.5 320.1 323.7 321.1
Interest expense 165.5 169.8 175.5 178.6 176.4 173.8
Interest income (0.6) (0.6) (0.5) (0.5) (0.4) (0.4)
EBITDA 687.6$ 671.8$ 672.0$ 691.8$ 722.2$ 740.3$

29Boardwalk Louisiana Midstream: Sulphur HubPineville Compressor Station
MLPA 2016 Annual Investor ConferenceJune 2016
Pineville Compressor Station