mlip1572-0020
DESCRIPTION
airtelTRANSCRIPT

7/17/2019 MLIP1572-0020
http://slidepdf.com/reader/full/mlip1572-0020 1/36
India - Telecommunication Services 0102 - 2145 - 2014
© MARKETLINE THIS PROFILE IS A LICENSED PRODUCT AND IS NOT TO BE PHOTOCOPIED Page | 1
MarketLine Industry Profile
TelecommunicationServices in IndiaFebruary 2015
Reference Code: 0102-2145
Publication Date: February 2015
WWW.M ARKETLINE.COM
MARKETLINE. THIS PROFILE IS A LICENSED PRODUCT AND IS NOT TO BE PHOTOCOPIED

7/17/2019 MLIP1572-0020
http://slidepdf.com/reader/full/mlip1572-0020 2/36
India - Telecommunication Services 0102 - 2145 - 2014
© MARKETLINE THIS PROFILE IS A LICENSED PRODUCT AND IS NOT TO BE PHOTOCOPIED Page | 2
EXECUTIVE SUMMARY
Market valueThe Indian telecommunication services market grew by 6% in 2014 to reach a value of $42.4 billion.
Market value forecastIn 2019, the Indian telecommunication services market is forecast to have a value of $56.2 billion, an increase of 32.5%
since 2014.
Market volumeThe Indian telecommunication services market grew by 4.3% in 2014 to reach a volume of 935.1 million subscribers.
Market volume forecastIn 2019, the Indian telecommunication services market is forecast to have a volume of 1,034.4 million subscribers, an
increase of 10.6% since 2014.
Category segmentationWireless telecommunication services is the largest segment of the telecommunication services market in India,
accounting for 89.5% of the market's total value.
Geography segmentationIndia accounts for 7% of the Asia-Pacific telecommunication services market value.
Market rivalry
The low level of service di fferentiation escalates rivalry with players competing intensely via quali ty measures, brandawareness, functionality, and value pricing.

7/17/2019 MLIP1572-0020
http://slidepdf.com/reader/full/mlip1572-0020 3/36
India - Telecommunication Services 0102 - 2145 - 2014
© MARKETLINE THIS PROFILE IS A LICENSED PRODUCT AND IS NOT TO BE PHOTOCOPIED Page | 3
TABLE OF CONTENTS
Executive Summary..........................................................................................................................................................................2
Market value ..................................................................................................................................................................................2
Market value forecast...................................................................................................................................................................2
Market volume...............................................................................................................................................................................2
Market volume forecast ...............................................................................................................................................................2
Category segmentation................................................................................................................................................................2
Geography segmentation ............................................................................................................................................................2
Market ri valry .................................................................................................................................................................................2
Market Overview ...............................................................................................................................................................................7
Market definition............................................................................................................................................................................7
Market analysis .............................................................................................................................................................................7
Market Data........................................................................................................................................................................................8
Market value ..................................................................................................................................................................................8
Market volume...............................................................................................................................................................................9
Market Segmentation .....................................................................................................................................................................10
Category segmentation..............................................................................................................................................................10
Geography segmentation ..........................................................................................................................................................11
Market Outlook ................................................................................................................................................................................12
Market value forecast.................................................................................................................................................................12
Market volume forecast .............................................................................................................................................................13
Five Forces Analysis ......................................................................................................................................................................14
Summary ......................................................................................................................................................................................14
Buyer power.................................................................................................................................................................................15
Supplier power ............................................................................................................................................................................16
New entrants ...............................................................................................................................................................................17
Threat of substitutes...................................................................................................................................................................18
Degree of rivalry..........................................................................................................................................................................19
Leading Companies........................................................................................................................................................................20

7/17/2019 MLIP1572-0020
http://slidepdf.com/reader/full/mlip1572-0020 4/36
India - Telecommunication Services 0102 - 2145 - 2014
© MARKETLINE THIS PROFILE IS A LICENSED PRODUCT AND IS NOT TO BE PHOTOCOPIED Page | 4
Bharat Sanchar Nigam Limited.................................................................................................................................................20
Bharti Airtel Limited ....................................................................................................................................................................21
Mahanagar Telephone Nigam Limited ....................................................................................................................................25
Vodafone Group Plc ...................................................................................................................................................................27
Macroeconomic Indicators.............................................................................................................................................................31
Country Data ...............................................................................................................................................................................31
Methodology ....................................................................................................................................................................................33
Industry associations..................................................................................................................................................................34
Related MarketLine research....................................................................................................................................................34
Appendix...........................................................................................................................................................................................35
About MarketLine........................................................................................................................................................................35

7/17/2019 MLIP1572-0020
http://slidepdf.com/reader/full/mlip1572-0020 5/36
India - Telecommunication Services 0102 - 2145 - 2014
© MARKETLINE THIS PROFILE IS A LICENSED PRODUCT AND IS NOT TO BE PHOTOCOPIED Page | 5
LIST OF TABLES
Table 1: India telecommunication services market value: $ billion, 2010 –14(e) ....................................................................8
Table 2: India telecommunication services market volume: million subscribers, 2010 –14(e)..............................................9
Table 3: India telecommunication services m arket category segmentation: $ billion, 2014(e) ..........................................10
Table 4: India telecommunication services market geography segmentation: $ billion, 2014(e) ......................................11
Table 5: India telecommunication services market value forecast: $ billion, 2014 –19 ........................................................12
Table 6: India telecommunication services market volume forecast: million subscribers, 2014 –19 .................................13
Table 7: Bharat Sanchar Nigam Limited: key facts ...................................................................................................................20
Table 8: Bharti Airtel Limited: key facts .......................................................................................................................................21
Table 9: Bharti Airtel Limited: key financials ($).........................................................................................................................22
Table 10: Bharti Airtel Limited: key financials (Rs.) ...................................................................................................................22
Table 11: Bharti Airtel Limited: key financial ratios....................................................................................................................23
Table 12: Mahanagar Telephone Nigam Limited: key facts .....................................................................................................25
Table 13: Vodafone Group Plc: key facts ...................................................................................................................................27
Table 14: Vodafone Group Plc: key financials ($) .....................................................................................................................28
Table 15: Vodafone Group Plc: key financials (£) .....................................................................................................................28
Table 16: Vodafone Group Plc: key financial ratios ..................................................................................................................29
Table 17: India size of population (million), 2010 –14................................................................................................................31
Table 18: India gdp (constant 2005 prices, $ billion), 2010 –14...............................................................................................31
Table 19: India gdp (current prices, $ billion), 2010 –14 ...........................................................................................................31
Table 20: India inflation, 2010 –14 ................................................................................................................................................32
Table 21: India consumer price index (absolute), 2010 –14 .....................................................................................................32
Table 22: India exchange rate, 2010 –14.....................................................................................................................................32

7/17/2019 MLIP1572-0020
http://slidepdf.com/reader/full/mlip1572-0020 6/36
India - Telecommunication Services 0102 - 2145 - 2014
© MARKETLINE THIS PROFILE IS A LICENSED PRODUCT AND IS NOT TO BE PHOTOCOPIED Page | 6
LIST OF FIGURES
Figure 1: India telecommunication services market value: $ billion, 2010 –14(e) ...................................................................8
Figure 2: India telecommunication services market volume: million subscribers, 2010 –14(e) ............................................9
Figure 3: India telecommunication services market category segmentation: % share, by value, 2014(e) ......................10
Figure 4: India telecommunication services market geography segmentation: % share, by value, 2014(e) ...................11
Figure 5: India telecommunication services market value forecast: $ billion, 2014 –19.......................................................12
Figure 6: India telecommunication services market volume forecast: million subscribers, 2014 –19 ................................13
Figure 7: Forces driving competition in the telecommunication services market in India, 2014 ........................................14
Figure 8: Drivers of buyer power in the telecommunication s ervices market in India, 2014...............................................15
Figure 9: Drivers of supplier power in the telecommunication services m arket in India, 2014...........................................16
Figure 10: Factors influencing the likelihood of new entrants in the telecommunication services market in India, 201417
Figure 11: Factors influencing the threat of substitutes in the telecommunication services market in India, 2014 ........18
Figure 12: Drivers of degree of rivalry in the telecommunication services market in India, 2014......................................19
Figure 13: Bharti Airtel Limited: revenues & profitability...........................................................................................................23
Figure 14: Bharti Airtel Limited: assets & liabilities....................................................................................................................24
Figure 15: Vodafone Group Plc: revenues & profitability .........................................................................................................29
Figure 16: Vodafone Group Plc: assets & liabilities ..................................................................................................................30

7/17/2019 MLIP1572-0020
http://slidepdf.com/reader/full/mlip1572-0020 7/36
India - Telecommunication Services 0102 - 2145 - 2014
© MARKETLINE THIS PROFILE IS A LICENSED PRODUCT AND IS NOT TO BE PHOTOCOPIED Page | 7
MARKET OVERVIEW
Market definitionThe telecommunication services market consists of the fixed line telecoms market and the wireless telecommunication
services market.
The fixed-line telecommunications market is valued as the revenues obtained by operators for voice telephony and other
non-voice information transmission using fixed lines (wirelines), rather than wireless systems.
The wireless telecommunications services market is defined here as including cellular (mobile) phones, pagers and any
other wireless or cellular telecommunication service.
The market value is composed of revenues from end-users for subscription and usage, with revenues from other
operators, as in wholesale transactions, excluded. Revenues from wired internet services and value -added services are
included.
Market volum es are for the total number of fixed-l ine telephones and mobile subscribers.
All currency conversions were carried out at constant 2013 average annual exchange rates.
For the purposes of this report, North America consists of Canada, Mexico, and the United States.
South America comprises Argentina, Brazil, Chile, Colombia, and Venezuela.
Europe comprises Austria, Belgium, the Czech Republic, Denmark, Finland, France, Germany, Greece, Ireland, Italy,
Netherlands, Norway, Poland, Portugal, Romania, Russia, Spain, Sweden, Switzerland, Turkey, Ukraine, and the United
Kingdom.
Asia-Paci fic comprises Australia, China, India, Indonesia, Japan, Malaysia, New Zealand, Pakistan, Philippines,
Singapore, South Korea, Taiwan, and Thailand.
Middle East comprises Egypt, Israel, Kuwait, Saudi Arabia, and United Arab Emirates.
Market analysisThe Indian telecommunication services market has seen very strong growth in both value and volume, with the exception
of a decline in 2013. For the forecast period, the market is set to continue healthy growth in terms of value but volume
growth will decelerate considerably.
The Indian telecommunication services market is expected to generate total revenues of $42.4bn in 2014, representing a
compound annual growth rate (CAGR) of 5.2% between 2010 and 2014. In comparison, the South Korean and Chinese
markets will grow with CAGRs of 0.7% and 14.1% respectively, over the same period, to reach respective values of
$35.3bn and $230.4bn in 2014.
Market consumption volume is forecast to increase with a CAGR of 10.9% between 2010 and 2014, to reach a total of
935.1 million subscribers in 2014. The market's volume is expected to rise to 1,034.4 million subscribers by the end of
2019, representing a CAGR of 2% for the 2014-2019 period.
The wireless telecommunication services segment is expected to be the market's most lucrative in 2014, with total
revenues of $38.0bn, equivalent to 89.5% of the market's overall value. The fixed line telecommunication services
segment will contribute revenues of $4.5bn in 2014, equating to 10.5% of the market's aggregate value.
The performance of the market is forecast to accelerate, with an anticipated CAGR of 5.8% for the five -year period 2014
- 2019, which is expected to drive the market to a value of $56.2bn by the end of 2019. Comparatively, the South Korean
and Chinese markets will grow with CAGRs of 1.6% and 9.5% respectively, over the same period, to reach respective
values of $38.2bn and $362.7bn in 2019.

7/17/2019 MLIP1572-0020
http://slidepdf.com/reader/full/mlip1572-0020 8/36
India - Telecommunication Services 0102 - 2145 - 2014
© MARKETLINE THIS PROFILE IS A LICENSED PRODUCT AND IS NOT TO BE PHOTOCOPIED Page | 8
MARKET DATA
Market valueThe Indian telecommunication services market grew by 6% in 2014 to reach a value of $42.4 billion.
The compound annual growth rate of the market in the period 2010 –14 was 5.2%.
Table 1: India telecommunication services market value: $ billion, 2010 –14(e)
Year $ billion Rs. billion € billion % Growth
2010 34.7 2,027.3 26.1
2011 38.6 2,256.5 29.0 11.3
2012 41.3 2,417.0 31.1 7.1
2013 40.0 2,340.3 30.1 -3.2
2014(e) 42.4 2,481.7 31.9 6.0
CAGR: 2010 –14 5.2%
SOURCE: MARKETLINE M A R K E T L I N E
Figure 1: India telecommunication services market value: $ billion, 2010 –14(e)
SOURCE: MARKETLINE M A R K E T L I N E

7/17/2019 MLIP1572-0020
http://slidepdf.com/reader/full/mlip1572-0020 9/36
India - Telecommunication Services 0102 - 2145 - 2014
© MARKETLINE THIS PROFILE IS A LICENSED PRODUCT AND IS NOT TO BE PHOTOCOPIED Page | 9
Market volumeThe Indian telecommunication services market grew by 4.3% in 2014 to reach a volume of 935.1 million subscribers.
The compound annual growth rate of the market in the period 2010 –14 was 10.9%.
Table 2: India telecommunication services market volume: million subscribers, 2010 –14(e)
Year million subscribers % Growth
2010 618.1
2011 843.4 36.5
2012 949.5 12.6
2013 896.3 -5.6
2014(e) 935.1 4.3
CAGR: 2010 –14 10.9%
SOURCE: MARKETLINE M A R K E T L I N E
Figure 2: India telecommunication services market volume: million subscribers, 2010 –14(e)
SOURCE: MARKETLINE M A R K E T L I N E

7/17/2019 MLIP1572-0020
http://slidepdf.com/reader/full/mlip1572-0020 10/36
India - Telecommunication Services 0102 - 2145 - 2014
© MARKETLINE THIS PROFILE IS A LICENSED PRODUCT AND IS NOT TO BE PHOTOCOPIED Page | 10
MARKET SEGMENTATION
Category segmentationWireless telecommunication services is the largest segment of the telecommunication services market in India,
accounting for 89.5% of the market's total value.
The Fixed line telecommunication services segment accounts for the remaining 10.5% of the market.
Table 3: India telecommunication services market category segmentation: $ billion, 2014(e)
Category 2014 %
wireless telecommunicationservices
38.0 89.5%
fixed line telecommunicationservices
4.5 10.5%
Total 42.5 100%
SOURCE: MARKETLINE M A R K E T L I N E
Figure 3: India telecommunication services market category segmentation: % share, by value,2014(e)
SOURCE: MARKETLINE M A R K E T L I N E

7/17/2019 MLIP1572-0020
http://slidepdf.com/reader/full/mlip1572-0020 11/36
India - Telecommunication Services 0102 - 2145 - 2014
© MARKETLINE THIS PROFILE IS A LICENSED PRODUCT AND IS NOT TO BE PHOTOCOPIED Page | 11
Geography segmentationIndia accounts for 7% of the Asia-Pacific telecommunication services market value.
China accounts for a further 38.3% of the Asia-Pacific market.
Table 4: India telecommunication services market geography segmentation: $ billion, 2014(e)
Geography 2014 %
China 230.4 38.3
Japan 135.0 22.4
India 42.4 7.0
South Korea 35.3 5.9
Taiwan 10.9 1.8
Rest of Asia-Pacific 148.0 24.6
Total 602 100%
SOURCE: MARKETLINE M A R K E T L I N E
Figure 4: India telecommunication service s market geography segmentation: % share, by value,2014(e)
SOURCE: MARKETLINE M A R K E T L I N E

7/17/2019 MLIP1572-0020
http://slidepdf.com/reader/full/mlip1572-0020 12/36
India - Telecommunication Services 0102 - 2145 - 2014
© MARKETLINE THIS PROFILE IS A LICENSED PRODUCT AND IS NOT TO BE PHOTOCOPIED Page | 12
MARKET OUTLOOK
Market value forecastIn 2019, the Indian telecommunication services market is forecast to have a value of $56.2 billion, an increase of 32.5%
since 2014.
The compound annual growth rate of the market in the period 2014 –19 is predicted to be 5.8%.
Table 5: India telecommunication services market value forecast: $ billion, 2014 –19
Year $ billion Rs. billion € billion % Growth
2014 42.4 2,481.7 31.9 6.0%
2015 45.2 2,646.4 34.0 6.6%
2016 47.9 2,802.1 36.0 5.9%
2017 51.8 3,031.4 39.0 8.2%2018 53.7 3,141.0 40.4 3.6%
2019 56.2 3,289.6 42.3 4.7%
CAGR: 2014 –19 5.8%
SOURCE: MARKETLINE M A R K E T L I N E
Figure 5: India telecommunication services market value forecast: $ billion, 2014 –19
SOURCE: MARKETLINE M A R K E T L I N E

7/17/2019 MLIP1572-0020
http://slidepdf.com/reader/full/mlip1572-0020 13/36
India - Telecommunication Services 0102 - 2145 - 2014
© MARKETLINE THIS PROFILE IS A LICENSED PRODUCT AND IS NOT TO BE PHOTOCOPIED Page | 13
Market volume forecastIn 2019, the Indian telecommunication services market is forecast to have a volume of 1,034.4 million subscribers, an
increase of 10.6% since 2014.
The compound annual growth rate of the market in the period 2014 –19 is predicted to be 2%.
Table 6: India telecommunication services market volume forecast: million subscribers, 2014 –19
Year million subscribers % Growth
2014 935.1 4.3%
2015 962.3 2.9%
2016 984.8 2.3%
2017 1,003.7 1.9%
2018 1,020.0 1.6%
2019 1,034.4 1.4%
CAGR: 2014 –19 2.0%
SOURCE: MARKETLINE M A R K E T L I N E
Figure 6: India telecommunication services market volume forecast: million sub scribers, 2014 –19
SOURCE: MARKETLINE M A R K E T L I N E

7/17/2019 MLIP1572-0020
http://slidepdf.com/reader/full/mlip1572-0020 14/36
India - Telecommunication Services 0102 - 2145 - 2014
© MARKETLINE THIS PROFILE IS A LICENSED PRODUCT AND IS NOT TO BE PHOTOCOPIED Page | 14
FIVE FORCES ANALYSIS
The telecommunication services market will be analyzed taking fixed line and wireless service providers as players. The
key buyers will be taken as individual and corporate end users, and telecoms equipment providers as the key suppliers.
SummaryFigure 7: Forces driving competition in the telecommunication services market in India, 2014
SOURCE: MARKETLINE M A R K E T L I N E
The low level of service differentiation escalates rivalry with players competing intensely via quality measures, brand
awareness, functionality, and value pricing.
The telecommunication services market consists of the fixed line telecoms market and the wireless telecommunication
services market. The market continues to exhibit signs of natural monopoly, with state-owned entities dominating.
A fixed l ine telecoms company may own and operate its own physical network (exchanges, fiber optic cables, etc.). New
entrants into the fixed line market may be put off by the declining penetration of fixed line telephones and the increasing
popularity of wireless technologies. The market faces a strong threat from mobile phones and Internet applications
(particularly Voice over Internet Protocol (VoIP)).
The majority of wireless telecoms providers are 'facili ties-based'; owning and operating the infrastructure of networking
equipment, masts, base and stations. The number of suppliers is often low as few companies have the necessary ability
to supply complex, reliable and geographically extensive networks.
A major driver of wireless s ervice growth is the consistent international demand for communication. This pressure drives
mobile communication companies to research and develop new ways of carrying more information on specific
frequencies. The industry is highly regulated by the government which, along with the dominance of incumbent
operators, limits potential new players’ options.
Rivalry is increased in most fixed line telecoms markets, as end-user switching costs are not prohibitive and telecom
services are not strongly differentiated, which will intensify market competition. In the coming years, mobile devices with
Internet access will continue to lead the market and rivalry in the telecommunication market will likely depend on
development of wireless technology and variation in demand.

7/17/2019 MLIP1572-0020
http://slidepdf.com/reader/full/mlip1572-0020 15/36
India - Telecommunication Services 0102 - 2145 - 2014
© MARKETLINE THIS PROFILE IS A LICENSED PRODUCT AND IS NOT TO BE PHOTOCOPIED Page | 15
Buyer powerFigure 8: Drivers of buyer power in the telecommunication services market in India, 2014
SOURCE: MARKETLINE M A R K E T L I N E
The telecommunications market displays signs of classic oligopolistic behavior, with a small number of large incumbent
players and a high number of buyers (both individual and commercial). This weakens buyer power as the loss of a single
customer will not impact greatly on market players.
The inelastic nature of demand and the move to multi-play services should insure the market as a whole against any
major downturn, weakening buyer power.
The low levels of product differentiation leave players competing on quality, reliability, brand awareness, functionality and
value pricing to try to capture new, and retain existing, customers in the telecommunications market. However, as
services are inherently standardized, buyer power is strengthened.
Customer loyalty is low and buyers are largely price-driven. As such, buyers are prone to switching between the
available suppliers if they offer a better price. This strengthens buyer power. Switching costs vary, and include the
difficulty of leaving a long-term service contract early and the cost of unlocking a locked SIM card.
Overall, buyer power is assessed to be moderate.

7/17/2019 MLIP1572-0020
http://slidepdf.com/reader/full/mlip1572-0020 16/36
India - Telecommunication Services 0102 - 2145 - 2014
© MARKETLINE THIS PROFILE IS A LICENSED PRODUCT AND IS NOT TO BE PHOTOCOPIED Page | 16
Supplier powerFigure 9: Drivers of supplier power in the telecommunication services market in India, 2014
SOURCE: MARKETLINE M A R K E T L I N E
Many governments considered telecoms a natural monopoly and placed single state owned enterprises to act in the
market. In India, the state remains active in the sector with the two largest companies. This means that large companies
often own and operate their own physical network. These market players are referred to as asset-based carriers (ABC),
and their suppliers are usually large companies, granting them an extremely strong position within the market. There are
a limited number of such suppliers who provide reliable and extensive networks.
Alternatively, a virtual network operator (VNO) may offer telecoms services by purchasing access to an ABC's
infrastructure. Their suppliers are network owners, which once again are large companies. Switching costs within this
market are often high, as exiting long term supply contracts can be difficult. This is mitigated to some degree by the fact
that specialized suppliers are dependent on the income from the telecoms industry.
National governments are also important in this market, as they act as the gatekeepers to the electromagnetic spectrum
and bandwidth supply. Licenses are allocated either through periodic auctions or 'beauty contests' (competitions on the
basis of service provision, etc.). This is not simply a regulatory issue: bandwidth is allocated in periodic auctions, and the
amounts paid by successful bidders can be substantial.
Supplier power is assessed as strong overall.

7/17/2019 MLIP1572-0020
http://slidepdf.com/reader/full/mlip1572-0020 17/36
India - Telecommunication Services 0102 - 2145 - 2014
© MARKETLINE THIS PROFILE IS A LICENSED PRODUCT AND IS NOT TO BE PHOTOCOPIED Page | 17
New entrantsFigure 10: Factors influencing the likelihood of new entrants in the telecommunication servicesmarket in India, 2014
SOURCE: MARKETLINE M A R K E T L I N E
Switching costs between providers are low and the services provided by fixed -line telecom companies in lesser
developed markets are less likely to be differentiated, meaning competition from substitute providers is a probability.
However, in mature markets, established companies hold dominance, meaning that new entrants can face uninviting
total revenue performance.Entering the telecommunication services m arket as a facilities -based provider requires significant capital outlay in order
to build infrastructure that covers most of the geographical area of the country of interest. Companies presenting such
business models benefit from large scale operations, economies of scale, diversification and as such may be difficult to
compete with, as they can usually offer lower prices.
A potentially lower cost mode of entry is to operate as a MVNO (mobile virtual network operator). MVNOs rely on
wholesale access to the network infrastructure of facilities -based mobile network operators. However, a more cost-
effective option may be an acquisition of a company that already has a network in place. As of 2014, the Department of
Telecommunications is working with the Telecom Regulatory Authority of India to take steps towards allowing MVNOs to
successfully enter the market. Several MVNO-like trials have begun, such as Virgin Mobile's deal with Tata Docomo.
New entrants must also get the necessary infrastructure installed and set up billing and operational support systems ,
which represent another group of costs.
As a small number of large incumbent players exist in the industry, demand conditions require a firm to enter at a large
size or post entry prices will lead to an economic loss.
The Telecom Regulatory Authority of India significantly influences the height of new entrant barriers by setting rules and
regulations concerning access to distribution channels, infrastructure and networks, thereby prohibiting seller
concentration. The telecommunications sector is subject to domestic regulations which may discourage or even legally
forbid certain parties willing to enter the sector.
Overall, the threat of new entrants is assessed as moderate.

7/17/2019 MLIP1572-0020
http://slidepdf.com/reader/full/mlip1572-0020 18/36
India - Telecommunication Services 0102 - 2145 - 2014
© MARKETLINE THIS PROFILE IS A LICENSED PRODUCT AND IS NOT TO BE PHOTOCOPIED Page | 18
Threat of substitutesFigure 11: Factors influencing the threat of sub stitutes in the telecommunication services marketin India, 2014
SOURCE: MARKETLINE M A R K E T L I N E
The main substitute to the telecommunication services market is Internet-based communication. Email, messaging
services, social and business networking sites, and Internet calling programs (such as Skype or VoIP Buster) provide
cheaper alternatives to traditional telephone communication. Many of these options are free, just requiring an Internet
connection and the appropriate computer software.However the quality of Internet voice calling can be unreliable and often depends on the user’s Internet connection
speed and computer specifications. Moreover, in many cases these services are only available form fixed line or wireless
operators which increase user dependency on telecommunication companies.
Many players in this market will offer a range of packaged services including fixed-line connection Internet and television
subscription for example. The use of Internet from mobile phones is increasingly common. Therefore players are
generally also offering the substitute products, which lessen their threat somewhat.
Overall, the threat from substitutes is assessed as weak.

7/17/2019 MLIP1572-0020
http://slidepdf.com/reader/full/mlip1572-0020 19/36
India - Telecommunication Services 0102 - 2145 - 2014
© MARKETLINE THIS PROFILE IS A LICENSED PRODUCT AND IS NOT TO BE PHOTOCOPIED Page | 19
Degree of rivalryFigure 12: Drivers of degree of rivalry in the telecommunication services market in India, 2014
SOURCE: MARKETLINE M A R K E T L I N E
Rivalry within the telecommunication services market is intensified by the presence of large incumbents such as Bharat
Sanchar Nigam Ltd. and Mahanagar Telephone Nigam Limited. The low level of service differentiation escalates rivalry
with players competing intensely via quality measures, brand awareness, functionality, and value pricing.
Data services have become a key component of both fixed and wireless service providers' products and the emergence
of 3G and 4G wireless services have meant that the size and price of data packages offered by wireless telcos have
become a key means of service differentiation. Bharti Airtel launched the first 4G service in Kolkata in April 2012.
Competition could also increase should new firms be able to enter the market if additional radio spectrum is made
available for commercial wireless services. Competition is also expected to increase as a result of other technologies
and services that are being developed and will be introduced in the future, including potentially those using currently
unlicensed spectrum and 5G.
The convergence between telecommunications, technology, media and the consumer electronics market, is causing
lateral competition, as competition extends into converging markets which gives the opportunity for growth and at the
same time competitive threats in the wider converged market.
Rivalry within the telecommunication services market is moderate overall.

7/17/2019 MLIP1572-0020
http://slidepdf.com/reader/full/mlip1572-0020 20/36
India - Telecommunication Services 0102 - 2145 - 2014
© MARKETLINE THIS PROFILE IS A LICENSED PRODUCT AND IS NOT TO BE PHOTOCOPIED Page | 20
LEADING COMPANIES
Bharat Sanchar Nigam LimitedTable 7: Bharat Sanchar Nigam Limited: key facts
Head office:Bharat Sanchar Bhavan, Harish Chandra Mathur Lane, Janpath, NewDelhi-110 001, IND
Website: www.bsnl.co.in
Financial year-end: March
SOURCE: COMPANY WEBSITE M A R K E T L I N E
Bharat Sanchar Nigam Limited (BSNL) is a telecommunications operator engaged in providing different network related
services in India. It is a public limited company which provides services such as wireline, code division multiple access
(CDMA) mobile, global system for mobile communications (GSM) mobile, Internet, broadband, carrier services,
multiprotocol label switching-virtual private network (MPLS-VPN), Very Small Aperture Terminal (VSAT), Voice over
Internet Protocol (VoIP), Intelligent Network Services (INS) and Fiber To The Home (FTTH).
The company offers its services under the segments classified as landline, mobile, broadband and enterprise business
services.
BSNL's landline service includes BSNL Landline, telephone facilities, Intelligent Network Services, BSNL public call
office (PCO), PRI/BRI/Dial-up Internet and other Services which includes audio and video conferencing.
The company's mobile segment includes Global System for Mobile Communications (GSM), Code Division Multiple
Access (CDMA), WiMAX, CDMA data card and CDMA Fixed services.
The broadband services of BSNL include landline broadband, mobile broadband, WiMAX broadband, Dial -up Internet,
fiber broadband and CDMA broadband services.
The company's enterprise business services include enterprise voice and mobility, Internet data center (IDC) services,
enterprise data services, enterprise broadband, managed network services and other enterprise services including web
colocation, fleet tracking and web hosting.
The company functions with Mahanagar Telephone Nigam (MTNL) on a memorandum of understanding (MoU), for
providing services in metropolitan cities like Mumbai and New Delhi.
Key Metrics
The company recorded revenues of INR280bn (approximately $4.8bn) in the financial year ended March 2014 (FY2014),
an increase of 3.2% over the previous year. The company's net profit was INR70.2bn (approximately $1.2bn) in FY2014,
compared with a net profit of INR78.8bn (approximately $1.3bn) in the previous 12 month period.
7/17/2019 MLIP1572-0020
http://slidepdf.com/reader/full/mlip1572-0020 21/36
India - Telecommunication Services 0102 - 2145 - 2014
© MARKETLINE THIS PROFILE IS A LICENSED PRODUCT AND IS NOT TO BE PHOTOCOPIED Page | 21
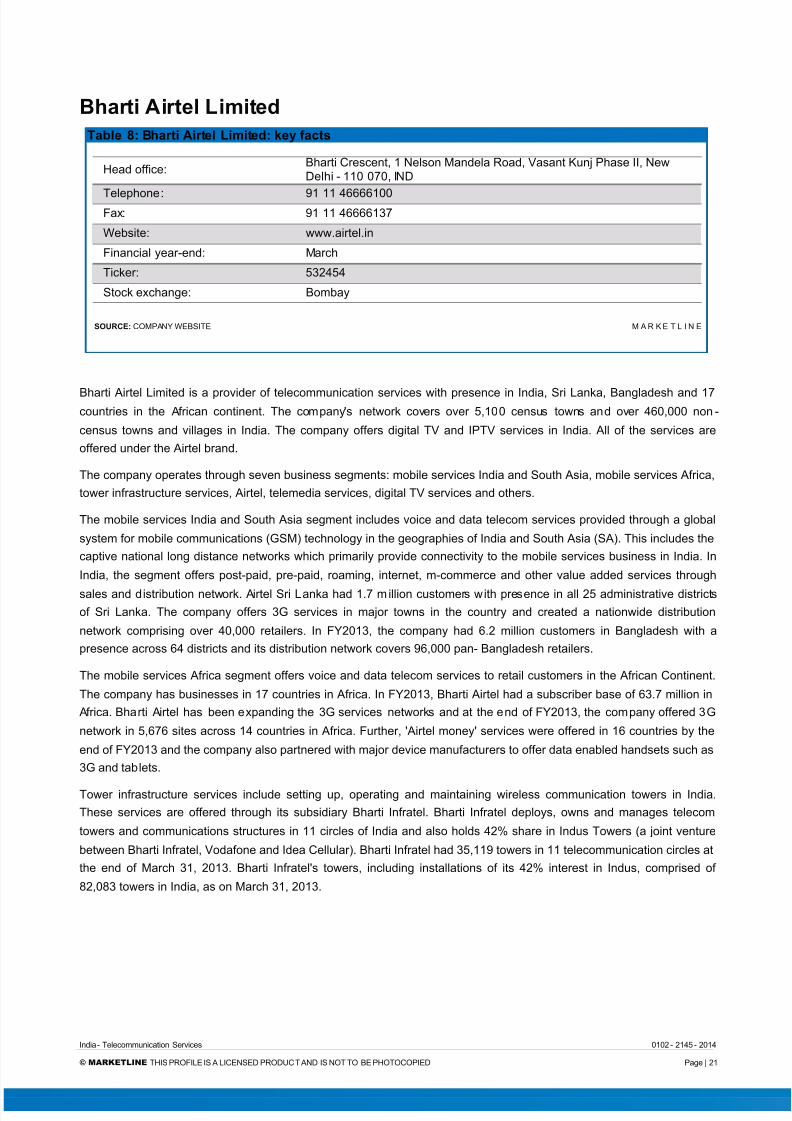
Bharti Airtel LimitedTable 8: Bharti Airtel Limited: key facts
Head office:Bharti Crescent, 1 Nelson Mandela Road, Vasant Kunj Phase II, NewDelhi - 110 070, IND
Telephone: 91 11 46666100Fax: 91 11 46666137
Website: www.airtel.in
Financial year-end: March
Ticker: 532454
Stock exchange: Bombay
SOURCE: COMPANY WEBSITE M A R K E T L I N E
Bharti Airtel Limited is a provider of telecommunication services with presence in India, Sri Lanka, Bangladesh and 17countries in the African continent. The company's network covers over 5,100 census towns and over 460,000 non -
census towns and villages in India. The company offers digital TV and IPTV services in India. All of the services are
offered under the Airtel brand.
The company operates through seven business segments: mobile services India and South Asia, mobile services Africa,
tower infrastructure services, Airtel, telemedia services, digital TV services and others.
The mobile services India and South Asia segment includes voice and data telecom services provided through a global
system for mobile communications (GSM) technology in the geographies of India and South Asia (SA). This includes the
captive national long distance networks which primarily provide connectivity to the mobile services business in India. In
India, the segment offers post-paid, pre-paid, roaming, internet, m-commerce and other value added services through
sales and distribution network. Airtel Sri Lanka had 1.7 m illion customers with presence in all 25 administrative districts
of Sri Lanka. The company offers 3G services in major towns in the country and created a nationwide distribution
network comprising over 40,000 retailers. In FY2013, the company had 6.2 million customers in Bangladesh with a
presence across 64 districts and its distribution network covers 96,000 pan- Bangladesh retailers.
The mobile services Africa segment offers voice and data telecom services to retail customers in the African Continent.
The company has businesses in 17 countries in Africa. In FY2013, Bharti Airtel had a subscriber base of 63.7 million in
Africa. Bharti Airtel has been expanding the 3G services networks and at the end of FY2013, the company offered 3G
network in 5,676 sites across 14 countries in Africa. Further, 'Airtel money' services were offered in 16 countries by the
end of FY2013 and the company also partnered with major device manufacturers to offer data enabled handsets such as
3G and tablets.
Tower infrastructure services include setting up, operating and maintaining wireless communication towers in India.
These services are offered through its subsidiary Bharti Infratel. Bharti Infratel deploys, owns and manages telecom
towers and communications structures in 11 circles of India and also holds 42% share in Indus Towers (a joint venture
between Bharti Infratel, Vodafone and Idea Cellular). Bharti Infratel had 35,119 towers in 11 telecommunication circles at
the end of March 31, 2013. Bharti Infratel's towers, including installations of its 42% interest in Indus, comprised of
82,083 towers in India, as on March 31, 2013.

7/17/2019 MLIP1572-0020
http://slidepdf.com/reader/full/mlip1572-0020 22/36
India - Telecommunication Services 0102 - 2145 - 2014
© MARKETLINE THIS PROFILE IS A LICENSED PRODUCT AND IS NOT TO BE PHOTOCOPIED Page | 22
Telemedia services include voice and data communications based on fixed network and broadband technology. The
company provides fixed-telephone, broadband digital subscriber line (DSL) services for homes as well as enterprises
across 87 pan-India cities. It had 3.3 million customers as of March 31, 2013 of which 1.4 million subscribed to
broadband/internet services. The product portfolio of the Telemedia home division includes high-speed broadband rising
upto 100 mbps for home division as well as local, national and international long-distance voice connectivity. For the
enterprises the segment offers fixed-line voice (PRIs), mobile, data and other connectivity solutions; collaborativesolutions including audio, video and web conferencing; and cloud solutions.
The Airtel business segment offers information and communications technology (ICT) solutions in India. These solutions
include voice, data, video, network integration, data center services, managed services, enterprise mobility applications
and digital media. The segment also offers both voice and data global services.
Digi tal TV services encompass the company's digital broadcasting services provided under the direct to home (DTH)
platform. The company served a customer base of 8.1 million on its DTH platform. Bharti Airtel also offers high definition
(HD) set top boxes and digital TV recorders with three dimensional (3D) capabilities. The company currently offers a total
of 373 channels including 15 HD channels and six interactive services.
Key MetricsThe company recorded revenues of $8,535 million in the fiscal year ending March 2014, an increase of 6.6% compared
to fiscal 2013. Its net income was $1,129 million in fiscal 2014, compared to a net income of $871 million in the
preceding year.
Table 9: Bharti Airtel Limited: key financials ($)
$ million 2010 2011 2012 2013 2014
Revenues 7,155.1 6,500.0 7,220.3 8,004.3 8,535.1
Net income (loss) 1,566.8 1,319.4 728.3 871.4 1,128.5
Total assets 12,155.8 25,049.9 13,733.9 15,026.4 16,791.1
Total liabilities 4,509.0 16,223.3 5,282.3 5,768.4 10,511.3
SOURCE: COMPANY FILINGS M A R K E T L I N E
Table 10: Bharti Airtel Limited: key financials (Rs.)
Rs. million 2010 2011 2012 2013 2014
Revenues 418,472.0 380,158.0 422,285.0 468,140.0 499,185.0
Net income (loss) 91,638.0 77,169.0 42,594.0 50,963.0 66,002.0
Total assets 710,940.0 1,465,064.0 803,237.0 878,832.0 982,041.0
Total liabilities 263,714.7 948,833.0 308,941.0 337,370.0 614,761.0
SOURCE: COMPANY FILINGS M A R K E T L I N E

7/17/2019 MLIP1572-0020
http://slidepdf.com/reader/full/mlip1572-0020 23/36
India - Telecommunication Services 0102 - 2145 - 2014
© MARKETLINE THIS PROFILE IS A LICENSED PRODUCT AND IS NOT TO BE PHOTOCOPIED Page | 23
Table 11: Bharti Airtel Limited: key financial ratios
Ratio 2010 2011 2012 2013 2014
Profit margin 21.9% 20.3% 10.1% 10.9% 13.2%
Revenue growth 13.2% (9.2%) 11.1% 10.9% 6.6%
Asset growth 12.2% 106.1% (45.2%) 9.4% 11.7%Liabilities growth (14.9%) 259.8% (67.4%) 9.2% 82.2%
Debt/asset ratio 37.1% 64.8% 38.5% 38.4% 62.6%
Return on assets 13.6% 7.1% 3.8% 6.1% 7.1%
SOURCE: COMPANY FILINGS M A R K E T L I N E
Figure 13: Bharti Airtel Limited: revenues & profitability
SOURCE: COMPANY FILINGS M A R K E T L I N E

7/17/2019 MLIP1572-0020
http://slidepdf.com/reader/full/mlip1572-0020 24/36
India - Telecommunication Services 0102 - 2145 - 2014
© MARKETLINE THIS PROFILE IS A LICENSED PRODUCT AND IS NOT TO BE PHOTOCOPIED Page | 24
Figure 14: Bharti Airtel Limited: assets & liabilities
SOURCE: COMPANY FILINGS M A R K E T L I N E

7/17/2019 MLIP1572-0020
http://slidepdf.com/reader/full/mlip1572-0020 25/36
India - Telecommunication Services 0102 - 2145 - 2014
© MARKETLINE THIS PROFILE IS A LICENSED PRODUCT AND IS NOT TO BE PHOTOCOPIED Page | 25
Mahanagar Telephone Nigam LimitedTable 12: Mahanagar Telephone Nigam Limited: key facts
Head office:Mahanagar Door Sanchar Sadan, 5th Floor, 9 CGO Complex, LodhiRoad, New Delhi 110003, IND
Telephone: 91 11 2431 9020
Fax: 91 11 2432 4243
Website: www.mtnl.net.in
Financial year-end: March
Ticker: 500108
Stock exchange: Bombay
SOURCE: COMPANY WEBSITE M A R K E T L I N E
Mahanagar Telephone Nigam Limited (MTNL) is a telecom company that is majority-owned by the Government of India.
The company has operations in India, Nepal and Mauritius.
The company provides basic telecommunications services in Delhi and Mumbai, which include basic fixed-line access
and global system for mobile communications (GSM) cellular services under the brand name of Dolphin and prepaid
cellular services under the brand name of Trump. The company also offers various GSM related value -added services
and third-generation (3G) cellular services to its customers.
MTNL offers two types of code division multiple access (CDMA) fixed wireless and mobile services, of which one type
employs a handset that is fixed to a subscriber's premises for fixed wireless service, while the other employs a mobile
telephone for mobile or limited mobility services; broadband and Internet services; leased line services; integrated
services digital network (ISDN) services that allow subscribers to send data, make telephone calls and hold desktopvideo conferences over a single line; public call offices, which consist of both manned offices where people can make
local, long distance and international calls, and coin operated telephone booths.
The company offers telex and network services that include calling card services, toll free calling services and tele-voting
services; data services such as dedicated server hosting, collocation services, storage services and virtual machines
(VM Ware); and domestic and international long distance calling services through connectivity with Bharat Sanchar
Nigam Limited's (BSNL) domestic long distance network and Tata Communications Limited's international gateways.
MTNL conducts its operations through its joint venture entities, United Telecom Limited (UTL) and MTNL -STPI IT
Services; and subsidiaries, Mahanagar Telephone Mauritius Limited (MTML) and Millennium Telecom Limited (MTL).
UTL is a joint venture company in Nepal with Telecom Consultants India Limited (TCIL), Videsh Sanchar Nigam Limited
(VSNL) and NVPL (Nepal Ventures Pvt Ltd, a Nepalese Company). MTNL-STPI IT Services is a 50:50 joint venture
between Software Technology Parks of India (STPI) and MTNL. The joint venture provides data center services,
messaging services, business application services to various sectors in India.
MTML provides basic, mobile and international long distance services in Mauritius. MTL provides a range of Internet and
value added services.
Key Metrics
The company recorded revenues of INR38,721.5m (approximately $662.1m) in the financial year ended March 20 14
(FY2014), an increase of 2.4% over the previous year. The company's net profit was INR78,207.2m (approximately
$1.3m) in FY2014, compared with a net loss of INR53.223m (approximately $910m) in the previous 12 month period.
The net income figure in FY2014 is higher than that of revenues due to the impact of exceptional items.

7/17/2019 MLIP1572-0020
http://slidepdf.com/reader/full/mlip1572-0020 26/36
India - Telecommunication Services 0102 - 2145 - 2014
© MARKETLINE THIS PROFILE IS A LICENSED PRODUCT AND IS NOT TO BE PHOTOCOPIED Page | 26

7/17/2019 MLIP1572-0020
http://slidepdf.com/reader/full/mlip1572-0020 27/36
India - Telecommunication Services 0102 - 2145 - 2014
© MARKETLINE THIS PROFILE IS A LICENSED PRODUCT AND IS NOT TO BE PHOTOCOPIED Page | 27
Vodafone Group PlcTable 13: Vodafone Group Plc: key facts
Head office: Vodafone House, The Connection, Newbury, Berkshire RG14 2FN, GBR
Telephone: 44 1635 33251
Fax: 44 1635 580 857
Local office:Vodafone India Limited, Peninsula Corporate Park, Ganpatrao KadamMarg, Lower Parel, Mumbai – 400013, IND
Telephone: 91 22 71715000
Fax: 91 22 24963645
Website: www.vodafone.com
Financial year-end: March
Ticker: VOD
Stock exchange: London
SOURCE: COMPANY WEBSITE M A R K E T L I N E
Vodafone Group plc is one of the largest communications service providers in the world. The group caters to 434 million
mobile customers and nine million fixed broadband customers around the globe. It operates in Germany, South Africa,
Italy, the UK, Spain, India as well as in other Europe, Africa, Middle East and Asia Pacific markets.
The services offered by the group include voice, messaging, data and fixed broadband.
Vodafone's operations are organized into two broader geographic segments: Europe and Africa, Middle East and Asia
Pacific (AMAP).
The group's European operations are spread across Albania, Czech Republic, Germany, Greece, Hungary, Ireland, Italy,Malta, the Netherlands, Portugal, Romania, Spain, and the UK. Its AMAP operations are spread across Australia, Egypt,
Fiji, Ghana, India, Kenya, New Zealand, Qatar, Turkey, Congo, Lesotho, Mozambique, South Africa, and Tanzania.
Vodafone is one of the largest carriers of mobile voice traffic in the world providing domestic, international and roaming
voice services. Its messaging services include short message service (SMS), multimedia message service (MMS), and
related services. In FY2014, the group's network carried over 337 billion text, picture, music and video messages. The
group's data services allow access to the internet, email and applications on phones, tablets, laptops and netbooks. It
also carried 544 petabytes of data and 1.2 trillion minutes of voice calls. Vodafone also offers fixed broadband services
and had 9.3 million fixed broadband customers mainly in Germany, Spain and Italy. Its other services segment includes
revenues from mobile virtual network operators (MNVOs) that use the group's network and its products and services as
part of a partner market network spanning over 48 countries.
Vodafone's products and services also include business solutions, roaming services, mobile solutions and marketing
solutions.
Business solutions encompass a range of integrated office and mobile voice and data services. Within the service line,
Vodafone offers converged services which bring together the fixed, mobile and desktop communications. Converged
services include Vodafone OneNet which integrates landlines as well as cloud-based collaboration services. Mobility
solutions for businesses include mobile email and mobile broadband, mobile security solutions and secure device
manager. In addition, the group offers machine-to-machine (M2M) solutions supporting a range of applications from
location monitoring of vehicles and remote patient monitoring through to supporting real-time secure payments and
providing real-time inventory reports for retailers. It also offers mobile health solutions. It also offers mobile health
(mHealth) solutions. Vodafone offers vouchercloud, a mobile voucher application that provides voucher codes for onlineshopping, and mobile vouchers on smartphones.

7/17/2019 MLIP1572-0020
http://slidepdf.com/reader/full/mlip1572-0020 28/36
India - Telecommunication Services 0102 - 2145 - 2014
© MARKETLINE THIS PROFILE IS A LICENSED PRODUCT AND IS NOT TO BE PHOTOCOPIED Page | 28
Vodafone offers enterprise solutions through the Vodafone Global Enterprise (VGE) business unit. Its solutions include
business process improvement; cloud and hosting; managed messaging; conferencing and collaboration; contact center
services; fixed data network and infrastructure; industry solutions; international voice and data; M2M; security;
smartphones and tablets; telecoms management; and unified communications. In addition, VGE offers professional
services, including managed mobility services and unified communications services.
Vodafone roaming services provide voice and data connectivity across multiple mobile network standards, including
fourth generation (4G) services. The group offers managed roaming services to more than 750 million mobile customers.
Its roaming services include Vodafone sponsored roaming and Vodafone gateway.
Additionally, the group offers Vodafone Marketing Solutions which reach over 600 million customers in 70 markets.
Vodafone also offers Vodafone branded handsets.
The group also offers carrier services. Vodafone is one of the largest international voice carriers, carryi ng 50 bi llion
international voice minutes annually. The group's carrier services division manages the commercial relationships with
other operators who support Vodafone's international voice and data services.
The company's jump in net income between FY2013 and FY2014 is due to the divestment of its US operations to
Verizon, which gave it a net gain of almost £45bn (approximately $70bn).
Key Metrics
The company recorded revenues of $59,944 million in the fiscal year ending March 2014, an increase of .8% compared
to fiscal 2013. Its net income was $92,628 million in fiscal 2014, compared to a net income of $646 million in the
preceding year.
Table 14: Vodafone Group Plc: key financials ($)
$ million 2010 2011 2012 2013 2014
Revenues 69,520.1 71,727.4 60,686.3 59,466.9 59,943.7
Net income (loss) 13,514.1 12,455.8 10,861.3 645.6 92,627.8
Total assets 245,404.1 236,392.1 211,739.9 216,232.6 190,464.3
Total liabilities 103,446.9 99,513.8 89,491.9 102,917.0 78,253.9
Employees 84,990 83,862 86,373 91,000 97,721
SOURCE: COMPANY FILINGS M A R K E T L I N E
Table 15: Vodafone Group Plc: key financials (£)
£ million 2010 2011 2012 2013 2014
Revenues 44,472.0 45,884.0 38,821.0 38,041.0 38,346.0
Net income (loss) 8,645.0 7,968.0 6,948.0 413.0 59,254.0
Total assets 156,985.0 151,220.0 135,450.0 138,324.0 121,840.0
Total liabilities 66,175.0 63,659.0 57,248.0 65,836.0 50,059.0
SOURCE: COMPANY FILINGS M A R K E T L I N E

7/17/2019 MLIP1572-0020
http://slidepdf.com/reader/full/mlip1572-0020 29/36
India - Telecommunication Services 0102 - 2145 - 2014
© MARKETLINE THIS PROFILE IS A LICENSED PRODUCT AND IS NOT TO BE PHOTOCOPIED Page | 29
Table 16: Vodafone Group Plc: key financial ratios
Ratio 2010 2011 2012 2013 2014
Profit margin 19.4% 17.4% 17.9% 1.1% 154.5%
Revenue growth 8.4% 3.2% (15.4%) (2.0%) 0.8%
Asset growth 2.8% (3.7%) (10.4%) 2.1% (11.9%)
Liabilities growth (2.6%) (3.8%) (10.1%) 15.0% (24.0%)
Debt/asset ratio 42.2% 42.1% 42.3% 47.6% 41.1%
Return on assets 5.6% 5.2% 4.8% 0.3% 45.6%
Revenue per employee $817,980 $855,302 $702,607 $653,483 $613,417
Profit per employee $159,009 $148,528 $125,749 $7,095 $947,880
SOURCE: COMPANY FILINGS M A R K E T L I N E
Figure 15: Vodafone Group Plc: revenues & profitability
SOURCE: COMPANY FILINGS M A R K E T L I N E

7/17/2019 MLIP1572-0020
http://slidepdf.com/reader/full/mlip1572-0020 30/36
India - Telecommunication Services 0102 - 2145 - 2014
© MARKETLINE THIS PROFILE IS A LICENSED PRODUCT AND IS NOT TO BE PHOTOCOPIED Page | 30
Figure 16: Vodafone Group Plc: assets & liabilities
SOURCE: COMPANY FILINGS M A R K E T L I N E

7/17/2019 MLIP1572-0020
http://slidepdf.com/reader/full/mlip1572-0020 31/36
India - Telecommunication Services 0102 - 2145 - 2014
© MARKETLINE THIS PROFILE IS A LICENSED PRODUCT AND IS NOT TO BE PHOTOCOPIED Page | 31
MACROECONOMIC INDICATORS
Country Data
Table 17: India size of population (million), 2010 –14
Year Population (million) % Growth
2010 1,190.7 1.6%
2011 1,210.2 1.6%
2012 1,226.4 1.3%
2013 1,241.7 1.2%
2014(e) 1,256.8 1.2%
SOURCE: MARKETLINE M A R K E T L I N E
Table 18: India gdp (constant 2005 prices, $ billion), 2010 –14
Year Constant 2005 Prices, $ billion % Growth
2010 1,243.7 10.3%
2011 1,326.2 6.6%
2012 1,389.0 4.7%
2013 1,458.7 5.0%
2014(e) 1,539.2 5.5%
SOURCE: MARKETLINE M A R K E T L I N E
Table 19: India gdp (current price s, $ billion), 2010 –14
Year Current Prices, $ billion % Growth
2010 1,708.5 25.1%
2011 1,880.1 10.0%
2012 1,858.7 (1.1%)
2013 1,876.8 1.0%
2014(e) 2,125.4 13.2%
SOURCE: MARKETLINE M A R K E T L I N E

7/17/2019 MLIP1572-0020
http://slidepdf.com/reader/full/mlip1572-0020 32/36
India - Telecommunication Services 0102 - 2145 - 2014
© MARKETLINE THIS PROFILE IS A LICENSED PRODUCT AND IS NOT TO BE PHOTOCOPIED Page | 32
Table 20: India inflation, 2010 –14
Year Inflation Rate (%)
2010 12.0%
2011 9.1%
2012 10.2%
2013 9.5%
2014(e) 7.7%
SOURCE: MARKETLINE M A R K E T L I N E
Table 21: India consumer price index (absolute), 2010 –14
Year Consumer Price Index (2005 = 100)
2010 152.0
2011 165.8
2012 182.8
2013 200.1
2014(e) 215.6
SOURCE: MARKETLINE M A R K E T L I N E
Table 22: India exchange rate, 2010 –14
Year Exchange rate ($/Rs.) Exchange rate (€/Rs.)
2010 45.9361 60.9708
2011 46.8466 65.1733
2012 53.6119 68.6802
2013 58.4859 77.7676
2014 58.4859 77.7676
SOURCE: MARKETLINE M A R K E T L I N E

7/17/2019 MLIP1572-0020
http://slidepdf.com/reader/full/mlip1572-0020 33/36
India - Telecommunication Services 0102 - 2145 - 2014
© MARKETLINE THIS PROFILE IS A LICENSED PRODUCT AND IS NOT TO BE PHOTOCOPIED Page | 33
METHODOLOGY
MarketLine Industry Profiles draw on extensive primary and secondary research, all aggregated, analyzed, cross -
checked and presented in a consistent and accessible style.
Review of in-house databases – Created using 250,000+ industry interviews and consumer surveys and supported byanalysis from industry experts using highly complex modeling & forecasting tools, MarketLine’s in -house databases
provide the foundation for all related industry profiles
Preparatory research – We also maintain extensive in-house databases of news, analyst commentary, company
profiles and macroeconomic & demographic information, which enable our researchers to build an accurate market
overview
Definitions – Market definitions are standardized to allow comparison from country to country. The parameters of each
definition are carefully reviewed at the start of the research process to ensure they match the requirements of both the
market and our clients
Extensive secondary research activities ensure we are always fully up-to-date with the latest industry events and
trends
MarketLine aggregates and analyzes a number of secondary information sources, including:
- National/Governmental statistics
- International data (official international sources)
- National and International trade associations
- Broker and analyst reports
- Company Annual Reports
- Business information libraries and databases
Modeling & forecasting tools – MarketLine has developed powerful tools that allow quantitative and qualitative data to
be combined with related macroeconomic and demographic drivers to create market models and forecasts, which can
then be refined according to specific competitive, regulatory and demand-related factors
Continuous quality control ensures that our processes and profiles remain focused, accurate and up-to-date

7/17/2019 MLIP1572-0020
http://slidepdf.com/reader/full/mlip1572-0020 34/36
India - Telecommunication Services 0102 - 2145 - 2014
© MARKETLINE THIS PROFILE IS A LICENSED PRODUCT AND IS NOT TO BE PHOTOCOPIED Page | 34
Industry associations
International Telecommunication Union (ITU)
Place des Nations, 1211 Geneva 20, CHE
Tel.: 41 22 730 5111
Fax: 41 22 733 7256www.itu.int
International Telecommunications Society329 Wallston Road, Tenants Harbor, ME 04860, USA
Tel.: 1 207 372 6241
www.itsworld.org
Related MarketLine research
Industry Profile
Global Telecommunication Services
Global Fixed Line Telecommunication Services
Global Wireless Telecommunication Services

7/17/2019 MLIP1572-0020
http://slidepdf.com/reader/full/mlip1572-0020 35/36
India - Telecommunication Services 0102 - 2145 - 2014
© MARKETLINE THIS PROFILE IS A LICENSED PRODUCT AND IS NOT TO BE PHOTOCOPIED Page | 35
APPENDIX
About MarketLineIn an information-rich world, finding facts you can re ly upon isn’t always easy. MarketLine is the solution.
We make it our job to sort through the data and deliver accurate, up-to-date information on companies, industries and
countries across the world. No other business information company comes close to matching our sheer breadth of
coverage.
And unlike many of our competitors, we cut the ‘data padding’ and present information in easy-to-digest formats, so you
can absorb key facts in minutes, not hours.
What we do
Profiling all major companies, industries and geographies, MarketLine is one of the most prolific publishers of business
information today.
Our dedicated research professionals aggregate, analyze, and cross -check facts in line with our strict research
methodology, ensuring a constant s tream of new and accurate information is added to MarketLine every da y.
With stringent checks and controls to capture and validate the accuracy of our data, you can be confident in MarketLi ne
to deliver quality data in an instant.
For further information about our products and services see m ore at: http://www.marketline.com/overview/
Disclaimer
All Rights Reserved.
No part of this publication may be reproduced, stored in a retrieval system or transmitted in any form by any means,
electronic, mechanical, photocopying, recording or otherwise, without the prior permission of the publisher, MarketLine.
The facts of this report are believed to be correct at the time of publication but cannot be guaranteed. Please note that
the findings, conclusions and recommendations that MarketLine delivers will be based on information gathered in good
faith from both primary and secondary sources, whose accuracy we are not always in a position to guarantee. As such
MarketLine can accept no liability whatever for actions taken based on any information that may subsequently prove to
be incorrect.

7/17/2019 MLIP1572-0020
http://slidepdf.com/reader/full/mlip1572-0020 36/36
MARKETLINE | CHRISTCHURCH COURT 10 15 NEWGATE