mixing losses investigation downstream of turbine blade ...jestec.taylors.edu.my/vol 6 issue 2 april...
TRANSCRIPT

Journal of Engineering Science and Technology Vol. 6, No. 2 (2011) 161 - 178 © School of Engineering, Taylor’s University
161
MIXING LOSSES INVESTIGATION DOWNSTREAM OF TURBINE BLADE CASCADE WITH COOLANT FLOW BLOWING
ASSIM HAMEED YOUSIF1,*, ABASS S. SHRIFFE
2
1Mechanical Engineering Department, University of Technology,
P.O. Box 35010, Baghdad, Iraq 2Mechanical Engineering Department, University of Wassit, Kutt, Iraq
*Corresponding Author: [email protected]
Abstract
A major cause of noise and vibration characteristics of turbomachinery has
caused by wakes. The characteristics of the wake, the wake decay, the path that
it follows, and the mechanisms of mixing losses generated due to the mixing of
blade trailing edge cold jet issued into the hot cross flow are important to find
adequate solution to the problem. At the present work the wake characteristic
was observed by introducing experimental work inside a cascade test rig to
investigate the wake domain downstream of blade cascade with the aid of five-
hole probe. The case studies were done with cold jets blowing ratios 1.58, 1.667
and 1.935 with jet stream wise angle and jet lateral injection angle 37.5° and 35°
respectively. The measurement showed that there is a certain harmonization in
the region of high reverse pressure loss coefficient which reflects the
concentration of wake region. Also it was observed three distinct wake regions
located in the centre of the passage vortex region. The wake characteristics
measurements of the movement path, the growth of wake width, and the
physical awareness of the wake propagating may help to explain the
mechanisms of mixing losses.
Keywords: Mixing losses, Jet injection, Wake, Cascade, Blowing coolant,
Five-hole probe.
1. Introduction
Blowing cooling works in the form of rows of jet holes in the spanwise
directions of the blade, from where a cold jet is issued into the hot cross flow.
Experimental investigations provide a clearer physical insight into the flow field
downstream of the cascade. For two-dimensional flows, mixing usually only
occurs in the wake or when boundary layers separate from the blade surface [1].
162 A. H. Yousif and A. S. Shriffe
Journal of Engineering Science and Technology April 2011, Vol. 6(2)
Nomenclatures
B Bias (mean)
BR Blowing ratio, Uup/Vj
Cp Pressure coefficient
c Blade chord, m
N Number of samples
P Pressure, Pa
P1 Five-hole probe central tap pressure, Pa
P2,P3 Five-hole probe lateral tap pressure, Pa
P4,P5 Five-hole probe vertical tap pressure, Pa
Pr Precision
s Blade pitch, m
U Mean velocity component in axial direction, m/s
Un Uncertainty
u, v, w Component of velocity vectors in x, y, and z directions
respectively, m/s
x Axial downstream, m
xavg Mean of measured value
xi Downstream measured value of five-hole probe
Greek Symbols
β Inlet flow angle, degree
δ Standard deviation
σ Cascade solidity
Subscripts
pitch Five- hole probe pitch
t Total pressure
s Static pressure
up Upstream
yaw Five- hole probe yaw
Although it is only a relatively short-lived phenomenon as the flow eventually
mixes out completely, it is a major contributor to the total loss, since it is normally
associated with turbulent flows where the effect of viscosity is very large.
In particular, at high velocity the intense viscous dissipation immediately
behind the trailing edge generates considerable. For a two-dimensional
incompressible flow, the loss is reduced in an accelerating flow and increased in a
decelerating flow; this effect is difficult to quantify, however, as mixing is a
continuous process. The majority of the mixing loss occurs within 10 trailing
edge thicknesses downstream [2], but the loss continues to rise for approximately
one chord downstream of the blade row. The mixing loss will also be affected if
the flow interacts with the downstream blade row before it has completely mixed
out. Recent studies given by [3-5] analyzed the performance of such blowing
cooling systems.
Mixing Losses Investigation Downstream of Turbine Blade Cascade 163
Journal of Engineering Science and Technology April 2011, Vol. 6(2)
Turbine wakes represent a source of loss in efficiency, since the mixing of the
wakes with the free stream dissipates energy. An understanding of the wake
development and its decay is also essential because of the role it plays in the
rotor-stator interaction.
2. Experimental Investigation
Experimental investigation designed to provide the possible understanding about
the aerodynamic effect of the trailing edge blowing coolant flow on loss
mechanisms. The description of the design procedure starts from the point where
the blade section of the Low Pressure Turbine [LPT] is to be modelled. The same
shape of thickness distribution of Langston blade geometry [6] in which linear
cascade type is used. The cascade defined by the following parameters, the shape
of the blade, cascade stagger angle, cascade solidity (σ) and inlet flow angle (β1).
To model the blade at low speed, more compromises are required such as low
speed cascades, by virtue of their larger scale and lower speeds, offer several
advantages over high speed cascades. In low speed cascades, the maximum size
of the blades is determined by the need to keep the lowest Reynolds number the
same as in the real machine and by the need to have measurable pressure
differences when running at or close to atmospheric pressure at the low velocity
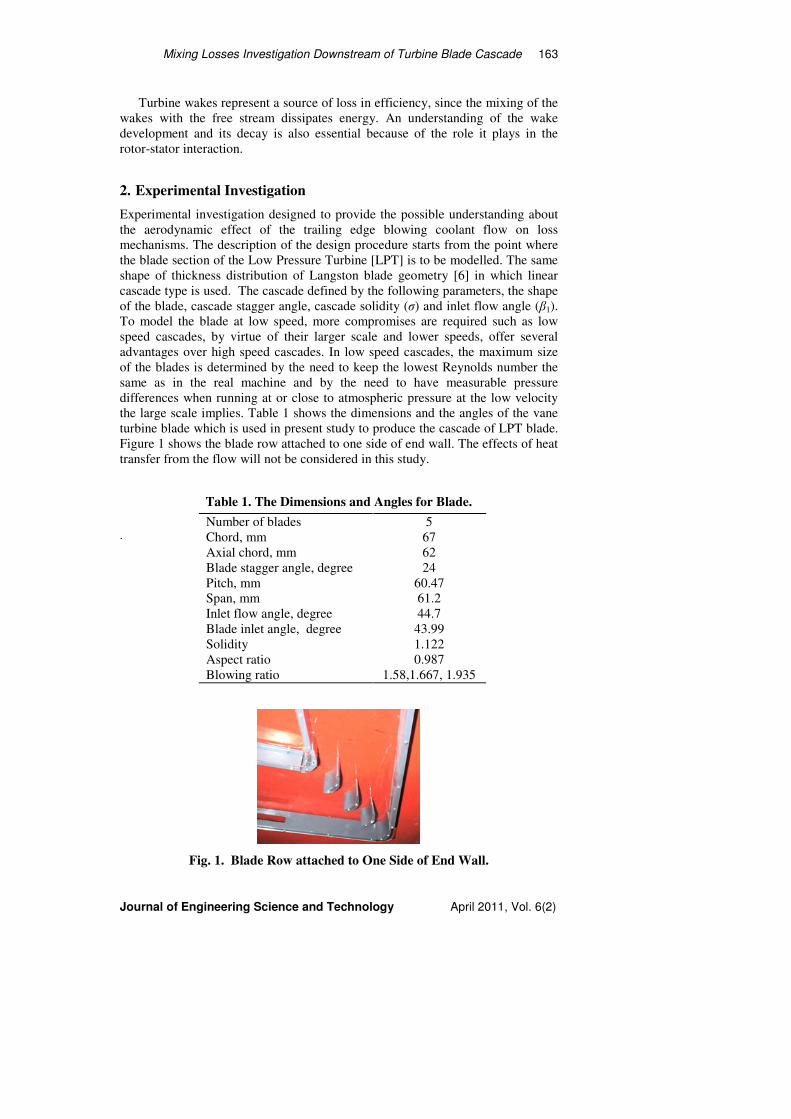
the large scale implies. Table 1 shows the dimensions and the angles of the vane
turbine blade which is used in present study to produce the cascade of LPT blade.
Figure 1 shows the blade row attached to one side of end wall. The effects of heat
transfer from the flow will not be considered in this study.
Table 1. The Dimensions and Angles for Blade.
.
Fig. 1. Blade Row attached to One Side of End Wall.
5 Number of blades
67 Chord, mm
62 Axial chord, mm
24 Blade stagger angle, degree
60.47 Pitch, mm
61.2 Span, mm
44.7 Inlet flow angle, degree
43.99 Blade inlet angle, degree
1.122 Solidity
0.987 Aspect ratio
1.58,1.667, 1.935 Blowing ratio

164 A. H. Yousif and A. S. Shriffe
Journal of Engineering Science and Technology April 2011, Vol. 6(2)
2.1. Wall jets
All wall jets have the same type and configuration. The holes were drilled ahead to the
blade trailing edge at the pressure side, to hold fitting for 1 mm diameter jets. External
injection is created by the air bled from the compressor stage, ducted through the internal
chambers of the turbine blades, and then discharged through small holes (25 holes kinds’
forward –lateral expanded hole). Each pitch distances between two neighboring holes are
equals to three times of hole diameter. Figure 2 shows row of forward–lateral expanded
holes located at the pressure side of the blade.
Fig. 2. Row of Forward–Lateral Expanded Holes located
at the Pressure Side of the Blade Close to the Trailing Edge.
Jets velocity was controlled by a pressure regulator valve and flow meters are fixed
near the air supply to insure that all jets have the same velocity. In typical gas turbine the
optimized blowing ratios is within 0.8 to 2.0 [7]. The blowing ratios in present study are
(1.58, 1.667and 1.935), the forward exit jet angle is 37.5o as advised by [8] and the jet
lateral angle was taken to as 35o. Only at blowing ratio greater than 1 the jet was able to
push main stream back and jet formed a solid protective layer in the shape of a rod. The
common standard calibrations possible have been made to confirm the flow parameters in
the test rig section.
2.2. Boundary correction
The conditions under which a model is tested in a test rig are not the same as those
in free air. The effect of the walls and the model thickness and the wake are
subjected to solid and wake blocking. Solid and wake blocking are usually
negligible with an open test section, since the air stream is then free to expand in a
normal manner [9]. The total solid and wake-blocking correction is calculated as
the ratio of model frontal area to test section frontal area. As suggests by Maskel
[10] the maximum ratio of model frontal area to test cross-sectional area of 7.5%
should probably been used, unless errors of several percent can be accepted. In
the present investigation, the cascade frontal area to the test cross-section area is
equal to 4.1%. Thus, the blocking errors are very small and can be neglected.
2.3. Five-hole probe
A variety of pressure probes have been devised for decomposing the flow velocity
vector. The devise is a stream lined ax-symmetric body that points into the flow.
The pressure distribution on the surface of the probe depends on the incidence angle
of the main flow vector relative to the axis of the probe. To determine the
Mixing Losses Investigation Downstream of Turbine Blade Cascade 165
Journal of Engineering Science and Technology April 2011, Vol. 6(2)
magnitude and the orientation of the flow vector, the surface pressure is sampled at
five locations; on the axis of the probe and at four equipage points on a line
encircling this central point [11]. The pressure differentials between selected pairs
of these points may be related to the inflow velocity vector by using an appropriate
calibration to deduce pitch and yaw directions. Hypothetically, theoretical
relationships for the potential flow around the body may also be used as given by
Schuiz [12]. The conical tip head has been used in the present experimental
program. Central pressure tap gives the conventional stagnation pressure when the
flow vector is perpendicular to the point on the surface. Yaw and pitch angles
inclinations of the flow vector with axis of the probe result in arm balance of
pressure on pairs of hole. The theory yields a format for interpreting the differential
pressures between pairs of holes is a function of the angles of pitch and yaw.
The accuracy of measurements is achieved by using the five-hole probe; the probe
should be able to read velocities with 10% accuracy and angles within 5o accuracy to
be useful for data collection in a blade cascade. The measurement procedure of the
uncertainly was done according to the procedure given by Kline and McClintock [13].
This approach estimates experimental value uncertainly by summing the squares of
the contribution of error from measured quantities and taking the square root of the
summation to provide the final uncertainly of the experimental values. The
uncertainly calculations for the five-hole probe are identical to those of Drost [14].
Thus, the uncertainty was expressed in the following manner;
Standard deviation
( )∑=
−=N
i
avgixx
Nδ
1
21 (1)
where the precision (Pr) is given by (Pr = 2δ), and the uncertainty (Un) is given
by Un = B + Pr.
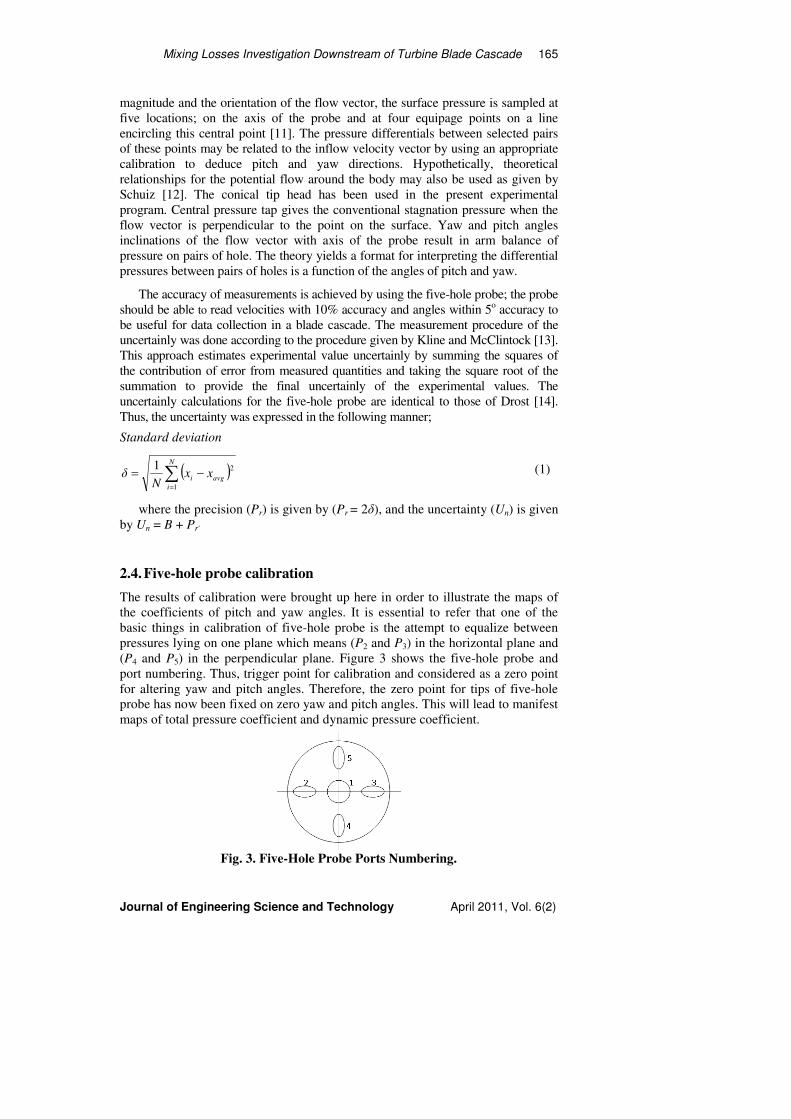
2.4. Five-hole probe calibration
The results of calibration were brought up here in order to illustrate the maps of
the coefficients of pitch and yaw angles. It is essential to refer that one of the
basic things in calibration of five-hole probe is the attempt to equalize between
pressures lying on one plane which means (P2 and P3) in the horizontal plane and
(P4 and P5) in the perpendicular plane. Figure 3 shows the five-hole probe and
port numbering. Thus, trigger point for calibration and considered as a zero point
for altering yaw and pitch angles. Therefore, the zero point for tips of five-hole
probe has now been fixed on zero yaw and pitch angles. This will lead to manifest
maps of total pressure coefficient and dynamic pressure coefficient.
Fig. 3. Five-Hole Probe Ports Numbering.

166 A. H. Yousif and A. S. Shriffe
Journal of Engineering Science and Technology April 2011, Vol. 6(2)
These maps will be used to calculate the flow velocities downstream of blade
cascade since the orientation of the probe, yaw and pitch angles have been
calculated. In this experimental investigation the procedure of Charley [15] was
used with small changes in the calculation of the average pressure sum of the four
pressures reading P2 to P5, instead of taking the sum of smallest two pressures,
since all the pressure taping varied during the calibration process, as indicated in
the following equation;
Pavg = (P2+P3+P4+P5) /4 (2)
The dimensionless pressure coefficients were used to process the five-hole
probe data. These pressure coefficients were used to set out the required calibration
curve of the five-hole probe, and they are plotted against the pitch and yaw angles
as variable. Total pressure P1 is measured at central probe hole, while P2 and P3
were measured in the yaw plane and P4 and P5 are measured in the pitch plane.
2.5. Two-dimensional measurement
A two-dimensional measurement grid was devoted for the region downstream of
blade cascade starting from throat plane represented by the pitch distance. The mesh
of planes parallel to the pitch plane were divided into ten mesh points with distance
of 0.5 cm while the planes perpendicular to the axial one were divided into eleven
points with distance of 1 cm. Finally the grid points will have a mesh of (10×11).
Figure 4 shows the measurement location of the velocity components.
Fig. 4. Spanwise and Pitchwise Velocity Components Directions.
Experimental results are shown in two main articles, first one deals with
calibration of five-hole probe data which outcomes by resolving of pressures
reading obtained at a the free stream region upstream of blade cascade in which
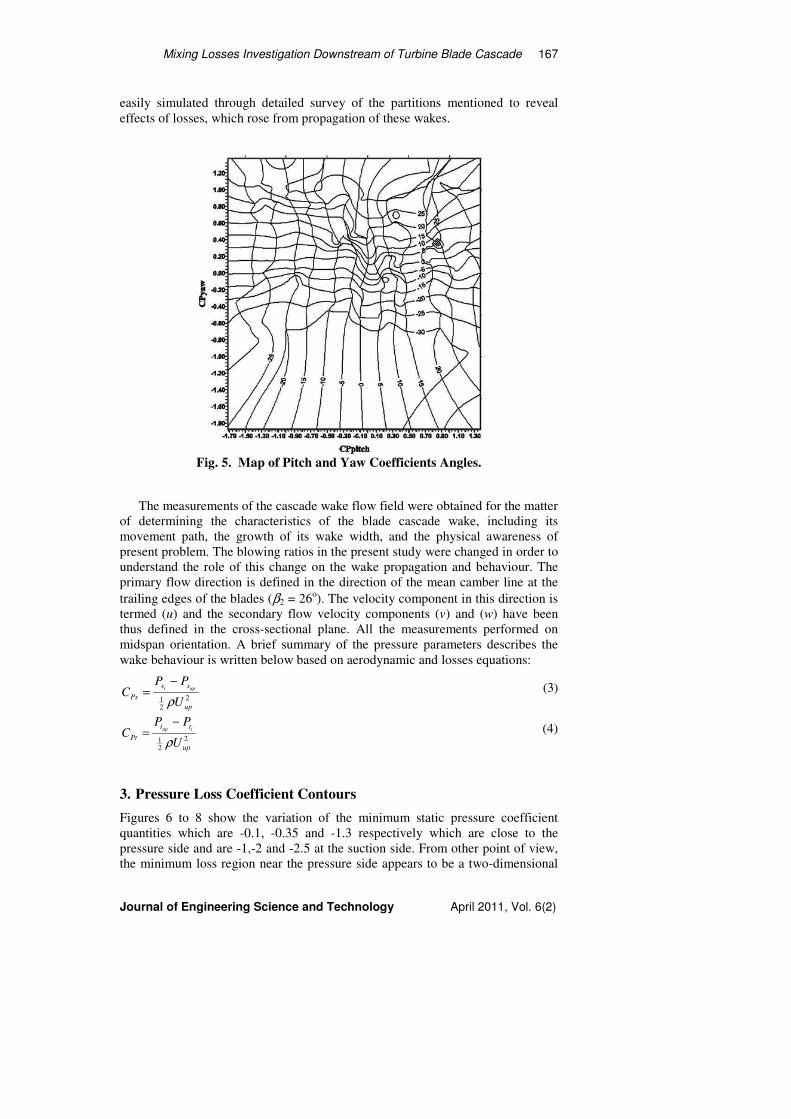
these data will be used again in the second article. Figure 5 illustrates the maps of
pitch and yaw angles coefficients. The second articles will use the former
mentioned data that scanned the downstream cascade region, which lies
downstream of trailing edge. This process comprises partition of the downstream
region into eleven planes parallel to each other and perpendicular to exit flow
direction that leaving the throat area and passing through uncovered suction
surface. As a consequence of this process, wake flow mixing region can now be
Mixing Losses Investigation Downstream of Turbine Blade Cascade 167
Journal of Engineering Science and Technology April 2011, Vol. 6(2)
easily simulated through detailed survey of the partitions mentioned to reveal
effects of losses, which rose from propagation of these wakes.
Fig. 5. Map of Pitch and Yaw Coefficients Angles.
The measurements of the cascade wake flow field were obtained for the matter
of determining the characteristics of the blade cascade wake, including its
movement path, the growth of its wake width, and the physical awareness of
present problem. The blowing ratios in the present study were changed in order to
understand the role of this change on the wake propagation and behaviour. The
primary flow direction is defined in the direction of the mean camber line at the
trailing edges of the blades (β2 = 26o). The velocity component in this direction is
termed (u) and the secondary flow velocity components (v) and (w) have been
thus defined in the cross-sectional plane. All the measurements performed on
midspan orientation. A brief summary of the pressure parameters describes the
wake behaviour is written below based on aerodynamic and losses equations:
2
21
up
ss
PsU
PPC
upi
ρ
−= (3)
2
21
up
tt
PtU
PPC
iup
ρ
−= (4)
3. Pressure Loss Coefficient Contours
Figures 6 to 8 show the variation of the minimum static pressure coefficient
quantities which are -0.1, -0.35 and -1.3 respectively which are close to the
pressure side and are -1,-2 and -2.5 at the suction side. From other point of view,
the minimum loss region near the pressure side appears to be a two-dimensional
168 A. H. Yousif and A. S. Shriffe
Journal of Engineering Science and Technology April 2011, Vol. 6(2)
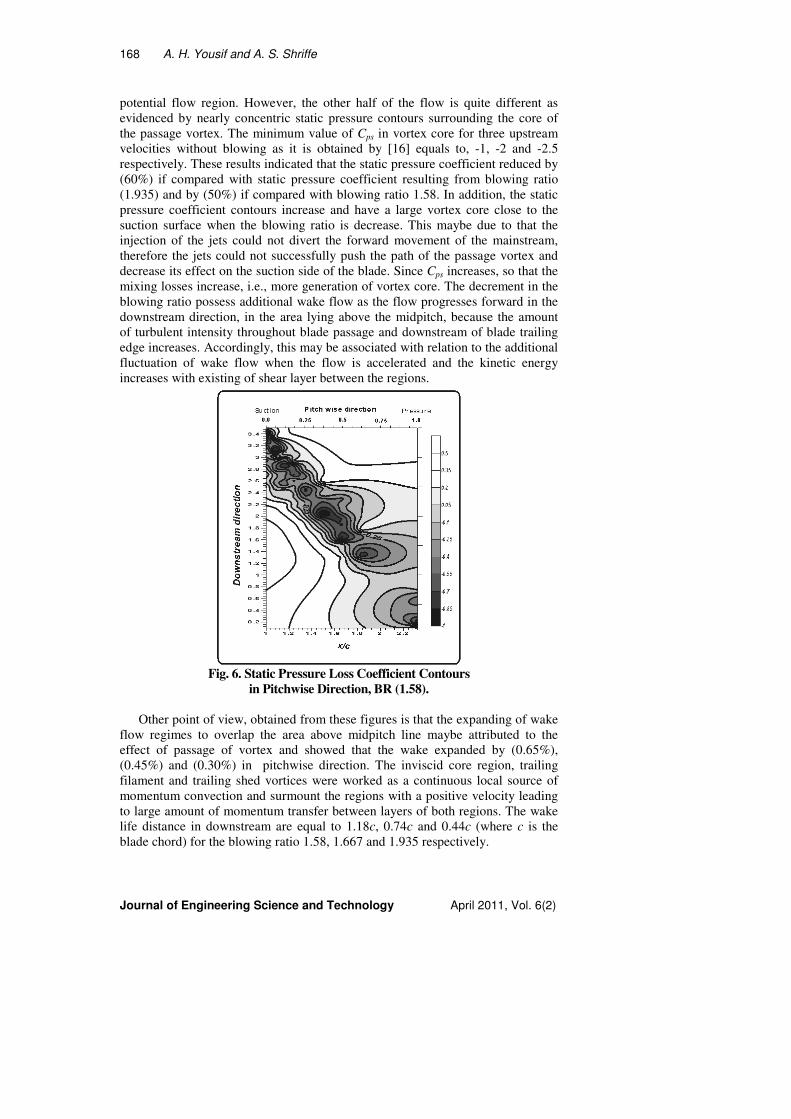
potential flow region. However, the other half of the flow is quite different as
evidenced by nearly concentric static pressure contours surrounding the core of
the passage vortex. The minimum value of Cps in vortex core for three upstream
velocities without blowing as it is obtained by [16] equals to, -1, -2 and -2.5
respectively. These results indicated that the static pressure coefficient reduced by
(60%) if compared with static pressure coefficient resulting from blowing ratio
(1.935) and by (50%) if compared with blowing ratio 1.58. In addition, the static
pressure coefficient contours increase and have a large vortex core close to the
suction surface when the blowing ratio is decrease. This maybe due to that the
injection of the jets could not divert the forward movement of the mainstream,
therefore the jets could not successfully push the path of the passage vortex and
decrease its effect on the suction side of the blade. Since Cps increases, so that the
mixing losses increase, i.e., more generation of vortex core. The decrement in the
blowing ratio possess additional wake flow as the flow progresses forward in the
downstream direction, in the area lying above the midpitch, because the amount
of turbulent intensity throughout blade passage and downstream of blade trailing
edge increases. Accordingly, this may be associated with relation to the additional
fluctuation of wake flow when the flow is accelerated and the kinetic energy
increases with existing of shear layer between the regions.
Fig. 6. Static Pressure Loss Coefficient Contours
in Pitchwise Direction, BR (1.58).
Other point of view, obtained from these figures is that the expanding of wake
flow regimes to overlap the area above midpitch line maybe attributed to the
effect of passage of vortex and showed that the wake expanded by (0.65%),
(0.45%) and (0.30%) in pitchwise direction. The inviscid core region, trailing
filament and trailing shed vortices were worked as a continuous local source of
momentum convection and surmount the regions with a positive velocity leading
to large amount of momentum transfer between layers of both regions. The wake
life distance in downstream are equal to 1.18c, 0.74c and 0.44c (where c is the
blade chord) for the blowing ratio 1.58, 1.667 and 1.935 respectively.

Mixing Losses Investigation Downstream of Turbine Blade Cascade 169
Journal of Engineering Science and Technology April 2011, Vol. 6(2)
The mixing losses of the flow field behind the blade trailing edge are normally
associated with turbulent flows where the effective viscosity is very large. In
particular, at high blowing ratio the intense viscous dissipation does not occurred
immediately behind the trailing edge. Thus, due to these reasons explained why
the wake live distance increasing with the increase of the blowing ratio.
Fig. 7. Static Pressure Loss Coefficient Contours
in Pitchwise Direction, BR (1.667).
Fig. 8. Static Pressure Loss Coefficient Contours
in Pitchwise Direction, BR (1.93).
The standard means of defining loss is the result of any flow feature that
reduces the efficiency. Moreover, the majority of loss production thus occurs over
170 A. H. Yousif and A. S. Shriffe
Journal of Engineering Science and Technology April 2011, Vol. 6(2)
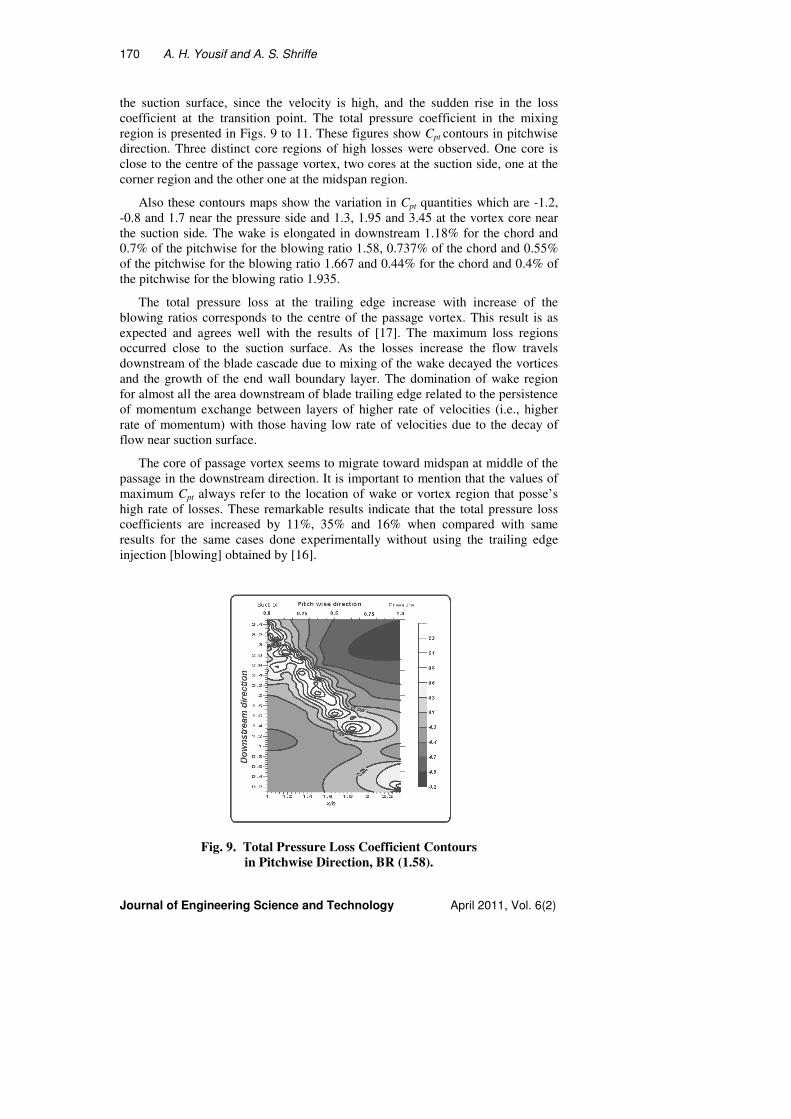
the suction surface, since the velocity is high, and the sudden rise in the loss
coefficient at the transition point. The total pressure coefficient in the mixing
region is presented in Figs. 9 to 11. These figures show Cpt contours in pitchwise
direction. Three distinct core regions of high losses were observed. One core is
close to the centre of the passage vortex, two cores at the suction side, one at the
corner region and the other one at the midspan region.
Also these contours maps show the variation in Cpt quantities which are -1.2,
-0.8 and 1.7 near the pressure side and 1.3, 1.95 and 3.45 at the vortex core near
the suction side. The wake is elongated in downstream 1.18% for the chord and
0.7% of the pitchwise for the blowing ratio 1.58, 0.737% of the chord and 0.55%
of the pitchwise for the blowing ratio 1.667 and 0.44% for the chord and 0.4% of
the pitchwise for the blowing ratio 1.935.
The total pressure loss at the trailing edge increase with increase of the
blowing ratios corresponds to the centre of the passage vortex. This result is as
expected and agrees well with the results of [17]. The maximum loss regions
occurred close to the suction surface. As the losses increase the flow travels
downstream of the blade cascade due to mixing of the wake decayed the vortices
and the growth of the end wall boundary layer. The domination of wake region
for almost all the area downstream of blade trailing edge related to the persistence
of momentum exchange between layers of higher rate of velocities (i.e., higher
rate of momentum) with those having low rate of velocities due to the decay of
flow near suction surface.
The core of passage vortex seems to migrate toward midspan at middle of the
passage in the downstream direction. It is important to mention that the values of
maximum Cpt always refer to the location of wake or vortex region that posse’s
high rate of losses. These remarkable results indicate that the total pressure loss
coefficients are increased by 11%, 35% and 16% when compared with same
results for the same cases done experimentally without using the trailing edge
injection [blowing] obtained by [16].
Fig. 9. Total Pressure Loss Coefficient Contours
in Pitchwise Direction, BR (1.58).
Mixing Losses Investigation Downstream of Turbine Blade Cascade 171
Journal of Engineering Science and Technology April 2011, Vol. 6(2)
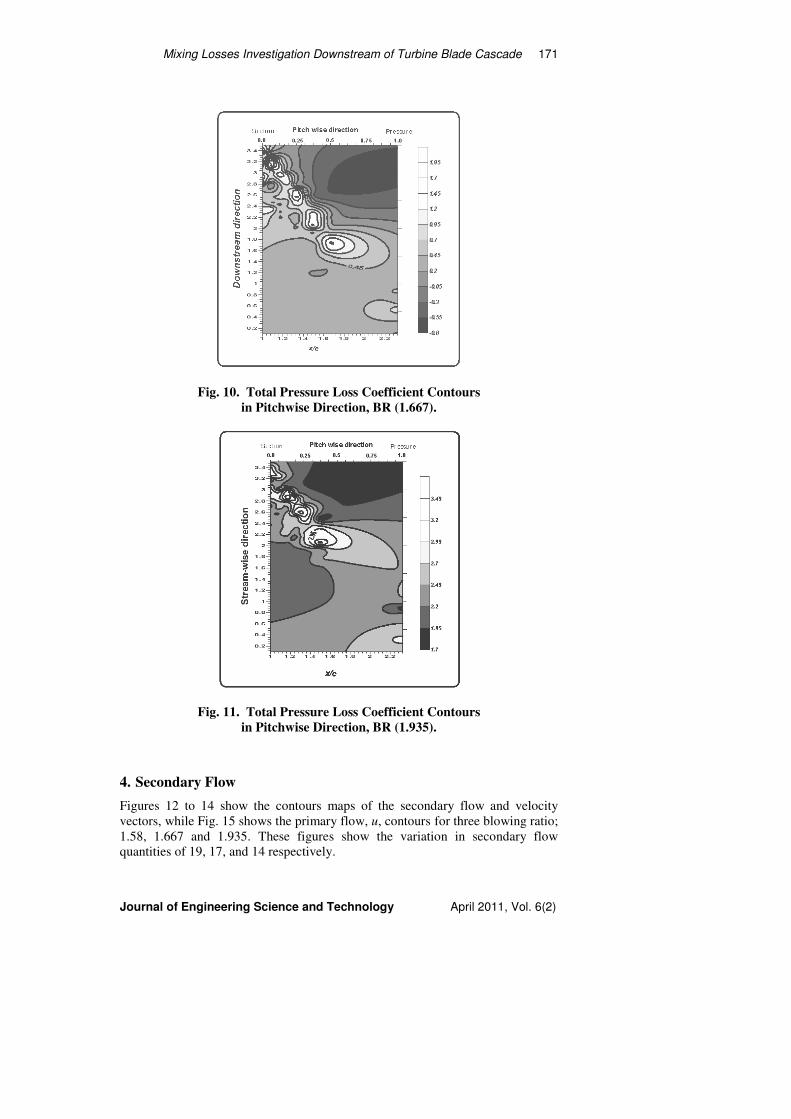
Fig. 10. Total Pressure Loss Coefficient Contours
in Pitchwise Direction, BR (1.667).
Fig. 11. Total Pressure Loss Coefficient Contours
in Pitchwise Direction, BR (1.935).
4. Secondary Flow
Figures 12 to 14 show the contours maps of the secondary flow and velocity
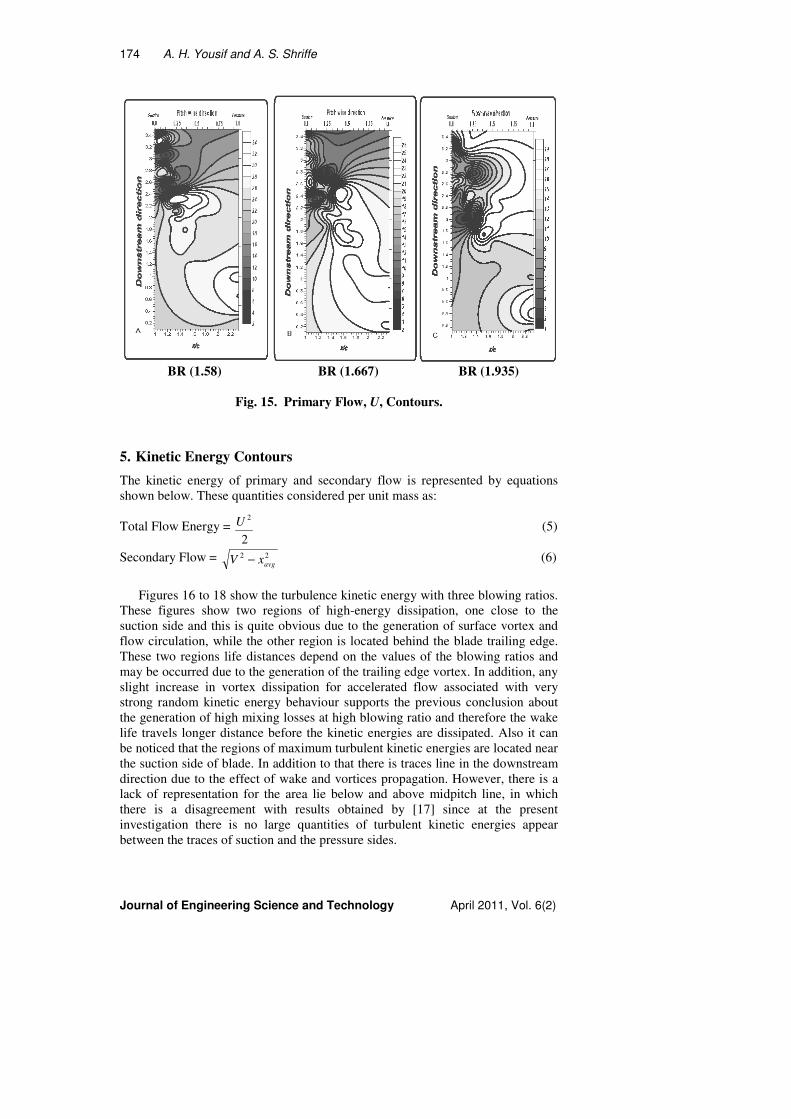
vectors, while Fig. 15 shows the primary flow, u, contours for three blowing ratio;
1.58, 1.667 and 1.935. These figures show the variation in secondary flow
quantities of 19, 17, and 14 respectively.

172 A. H. Yousif and A. S. Shriffe
Journal of Engineering Science and Technology April 2011, Vol. 6(2)
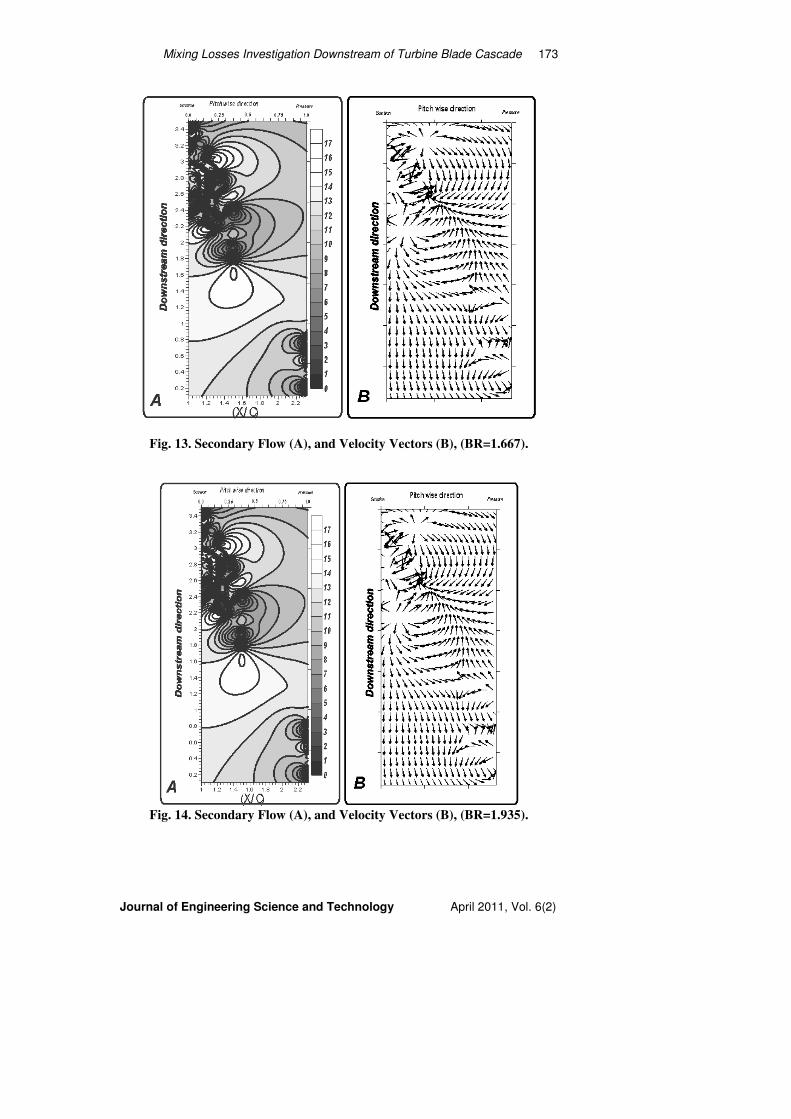
It can be seen that the secondary flow decreases with increasing blowing ratio.
Since the mass flow rate of the jets is high, the jets successfully push the vortex
out of the passage without of impinging on the suction surface and this leads to
successfully reducing secondary flow. It is important to notice that the appearance
of any flow region having velocity, w other than zero will lead to the occurrence
of secondary flow field. The same conclusion has drawn for the velocity
component, v. The secondary flow components range near the suction side are
between -12 and -16 m/s for blowing ratio 1.58 and -10 and -13 m/s and -8 and
-11 m/s for blowing ratio 1.667 and 1.935 respectively. Recalling the subject of
momentum transfer between layers having highest potential energy and zero
kinetic energy, the exchange of momentum rate among former mentioned regions
will continue to reveal the same trend of wake flow formation due to this rate of
exchange. The results of the secondary flow contours of the present investigation
agreed well with the results obtained by Charley [15].
Moving forward to the downstream the life distance exceeded the chord
length. In this region there was a harmonization of secondary flow field in
comparison to their values in the primary flow field (Fig. 15). This harmonization
occurred at the stagnation flow (i.e., u ~ 0 m/s) showed a high limit of secondary
flow component and this consolidates the vision of wake propagation downstream
of blade cascade which possess more than one dimensional flow field component.
These results agree well with results obtained by [17].
Fig. 12. Secondary Flow (A), and Velocity Vectors (B), (BR=1.58).
Mixing Losses Investigation Downstream of Turbine Blade Cascade 173
Journal of Engineering Science and Technology April 2011, Vol. 6(2)
Fig. 13. Secondary Flow (A), and Velocity Vectors (B), (BR=1.667).
Fig. 14. Secondary Flow (A), and Velocity Vectors (B), (BR=1.935).
174 A. H. Yousif and A. S. Shriffe
Journal of Engineering Science and Technology April 2011, Vol. 6(2)
BR (1.58) BR (1.667) BR (1.935)
Fig. 15. Primary Flow, U, Contours.
5. Kinetic Energy Contours
The kinetic energy of primary and secondary flow is represented by equations
shown below. These quantities considered per unit mass as:
Total Flow Energy = 2
2U (5)
Secondary Flow = 22
avgxV − (6)
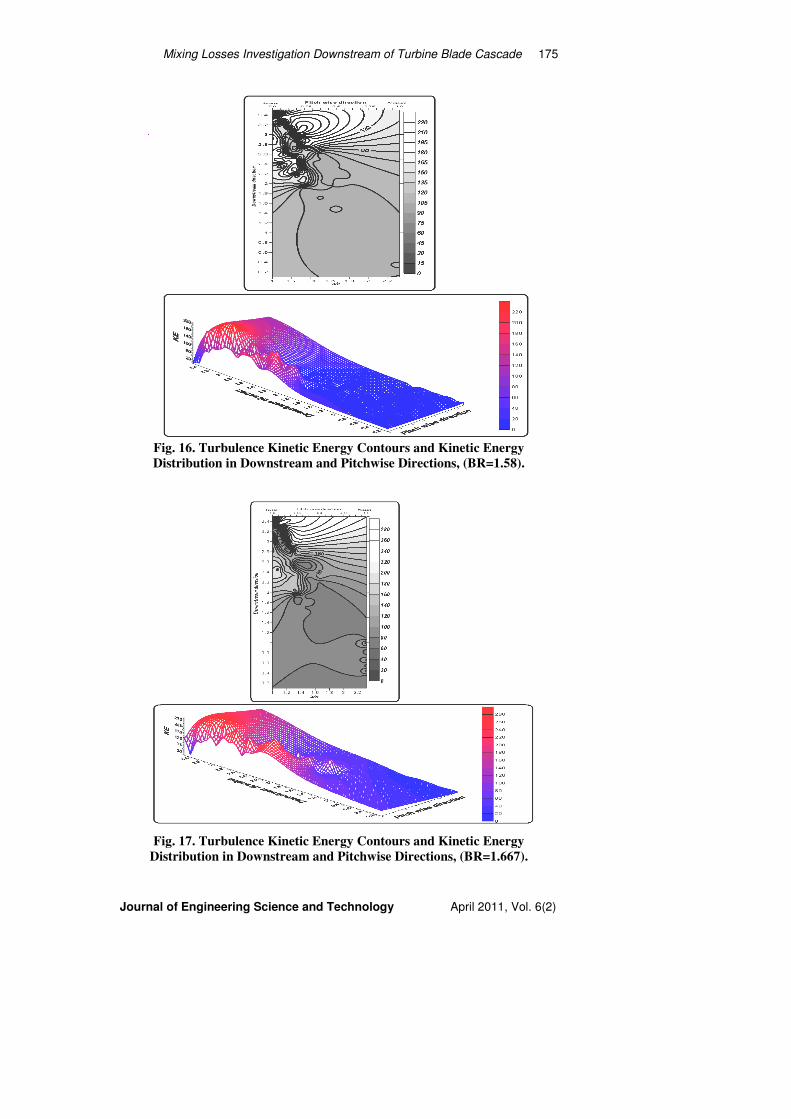
Figures 16 to 18 show the turbulence kinetic energy with three blowing ratios.
These figures show two regions of high-energy dissipation, one close to the
suction side and this is quite obvious due to the generation of surface vortex and
flow circulation, while the other region is located behind the blade trailing edge.
These two regions life distances depend on the values of the blowing ratios and
may be occurred due to the generation of the trailing edge vortex. In addition, any
slight increase in vortex dissipation for accelerated flow associated with very
strong random kinetic energy behaviour supports the previous conclusion about
the generation of high mixing losses at high blowing ratio and therefore the wake
life travels longer distance before the kinetic energies are dissipated. Also it can
be noticed that the regions of maximum turbulent kinetic energies are located near
the suction side of blade. In addition to that there is traces line in the downstream
direction due to the effect of wake and vortices propagation. However, there is a
lack of representation for the area lie below and above midpitch line, in which
there is a disagreement with results obtained by [17] since at the present
investigation there is no large quantities of turbulent kinetic energies appear
between the traces of suction and the pressure sides.
Mixing Losses Investigation Downstream of Turbine Blade Cascade 175
Journal of Engineering Science and Technology April 2011, Vol. 6(2)
Fig. 16. Turbulence Kinetic Energy Contours and Kinetic Energy
Distribution in Downstream and Pitchwise Directions, (BR=1.58).
Fig. 17. Turbulence Kinetic Energy Contours and Kinetic Energy
Distribution in Downstream and Pitchwise Directions, (BR=1.667).

176 A. H. Yousif and A. S. Shriffe
Journal of Engineering Science and Technology April 2011, Vol. 6(2)
In general, the existence of two adjacent regimes one with high and other with
low turbulent kinetic energies will lead to the conclusion that these regimes
exchange momentum because of wake convection as the flow progresses in
downstream direction.
Fig. 18. Turbulence Kinetic Energy Contours and Kinetic Energy
Distribution in Downstream and Pitchwise Directions, (BR=1.935).
6. Conclusions
An adequate solution to noise and vibration characteristics of turbomachinery
cannot be found unless the mechanisms of the mixing losses process are to be
cleared. From the work presented the wake mixing losses mechanisms of trailing
edge cold jets issued into the hot cross flow may be understood according to the
obtained experimental results.
� It is found that there is a certain harmonization between the secondary flow
fields in comparison to their values in the primary flow field. This
harmonization can be observed in the region of small primary flow or
stagnation flow (i.e., u ~ 0 m/s).
� Flow structure in the wake is dominated by very strong random vortices close
to the suction side and the trailing edge. The wake regions decrease in life
distance with decreasing in blowing ratio.

Mixing Losses Investigation Downstream of Turbine Blade Cascade 177
Journal of Engineering Science and Technology April 2011, Vol. 6(2)
� The core of the passage vortex may be dominated by any of the following
three criteria, location of the maximum total pressure losses coefficient,
location of the minimum static pressure losses coefficient and location of
nominal centre of rotation of the secondary velocity vectors.
� The maximum total pressure loss coefficient reflects the concentration of
wake region on three distinct regions of high losses.
� The pitchwise variation of static pressure coefficient contours was found to
be much revealed in areas below midpitch. Therefore the rapid decay of the
wake is conducted in the region lying below midpitch line due to the effect of
inviscid core and trailing edge vortices. In addition, the static pressure
coefficient contours are increased and have larger vortex core close to the
suction surface, wherein the blowing ratio decreases.
Acknowledgement
We would like to express our deep appreciation to the head and staff of the
Mechanical Engineering Department, University of Technology, Baghdad, Iraq
and to all who contributed to the completion of this work, and also to our families
for their patience and understanding.
References
1. Denton, J.D. (1993). Loss mechanisms in turbomachines. ASME Journal of
Turbomachinery, 115(4), 621-656.
2. Wei, N. (2000). Significance of loss models in aerothermodynamics simulation
for axial turbines. Ph.D. Thesis, Department of Energy Technology, Division
of Heat and Power Technology, Royal Institute of Technology.
3. Arcangeli, L.; Surace, M.; Tarhi, L.; Coutandin, D.; and Zecchi, S. (2006).
Correlative analysis of effusion cooling systems. ASME Paper, GT2006-90532.
4. Cerri, G .; Giovannelli, A.; Battisti, L.; and Fedrizzi, R. (2007). Advances in
effusive cooling techniques of gas turbines. Applied Thermal Engineering,
27, 692- 698.
5. Hung, M.S.; Ding, P.P.; and Chen, P.H. (2009). Effects of injection angle
orientation on concave and convex surfaces film cooling. Experimental
Thermal and Fluid Science, 33(2), 292-305.
6. Langston, L.S.; Nice, M.L.; and Hooper, R.M. (1977). Three-dimensional
flow within a turbine blade passage. ASME Transactions, Journal for
Engineering for Power, 99(1), 21-28.
7. He, L. (1996). Unsteady flow in oscillating turbine cascade, part 1- linear
cascade experiment. ASME Paper, 96-GT-374.
8. Friedrichs, S. (1997). Endwall film-cooling in axial flow turbines. Ph.D.
Thesis, Engineering Department, Cambridge University.
9. Pope, A; and John, J.H. (1983). Low speed wind tunnel, John Wiley & Sons,
New York, London.
10. Maskel, E.C. (1963). A theory of blockage effects on bluff bodies and stalled
wings in a closed wind tunnel. RAE Aero Report 2685.
178 A. H. Yousif and A. S. Shriffe
Journal of Engineering Science and Technology April 2011, Vol. 6(2)
11. Sephered, I.C. (1981). A four-hole pressure probe for fluid flow measurement
in three dimensions. ASME Transactions, Journal of Fluids Eng., 103(4),
590-594.
12. Schuiz, J.K. (2002). Measurement of magnitude and direction of hot gas
flow in a fire compartment with a five-hole probe. Fire Engineering,
University of Canterbury.
13. Kline, S.J.; and McClintock, F.A. (1953). Describing uncertainties in single
sample experimental. Mechanical Engineering Journal, 75, 3-8.
14. Drost, U. (1994). An experimental investigation of the corner stall behaviour
of a linear compressor cascade at high angle of attack. Diploma project,
Swiss Federal, Institute of Technology, Lausanne.
15. Charley, F. (2002). Measurement of hot gas flow in a fire compartment.
M.Sc. Thesis, University of Canterbury.
16. Ali, S.A.S. (2007). Investigation of flow through axial turbine blade passage.
Ph.D. Thesis, Al-Nahrain University, Baghdad, Iraq.
17. Moore J.; and Adhye, R.Y. (1985). Secondary flows and losses downstream
of a turbine cascade. ASME Journal of Engineering for Gas Turbine and
Power, 107, 961-968.