mixed economies & market failure. all economies must answer 3 questions. what goods &...
TRANSCRIPT

Mixed Economies & Market Failure

All economies must answer 3 questions.
What goods & services should be produced?
How should the goods & services be produced?
Who gets the goods & services that are produced?
Two extreme types of economies
communism or socialism
capitalism

Who owns & controls the physical capital?
In communism & socialism: the government
In capitalism: private parties

How are resources allocated?
In communism & socialism: through central planning & government administration.
In capitalism: through contractual agreements between private parties.

In the real world, there are no purely communist or socialist economies and no purely capitalist economies.
All economies are mixtures.

Some sectors of all economies are privately owned and controlled and some sectors are owned and controlled by the government.
The extent of the mix differs from economy to economy.

capitalistic or market economies
communistic/socialistic
or centrally-planned
economies
U.S., Canada, Australia, Japan, most of western Europe
Russia, China, N. Korea, most of eastern Europe
Sweden, India, Israel
Mixed Economies

Regardless of the type of economy, it is important to remember that people respond to economic incentives.

Example
In the former Soviet Union, managers producing window glass were rewarded by the number of pounds of glass they produced. What was the result?
Very thick glass.
They changed the reward system to be based on the quantity of glass as measured by the area. The result?
Ultra-thin glass.
Conclusion: People respond to incentives, so be careful what you reward.

Lack of competition
Externalities
Public goods
Reasons Markets May Fail to Attain an Ideal Allocation of Resources

Firms may collude to limit output and keep prices high.
Lack of Competition

Externalities are spillover effects.Good externalities are external benefits.Bad externalities are external costs.
Externalities

benefits generated by the action of an individual or group that favorably influences the welfare of non-paying parties
example: gardens
External Benefits

costs that result from an action of an individual or group that harms the welfare of non-consenting parties.
examples: litterbugs, drunk drivers, polluters
External Costs

social benefits = private benefits received by the decision-maker + any external benefits.
When there are no external benefits, private and social benefits are equal.
Social Benefits

social costs = private costs incurred by the decision-maker + any external costs.
When there are no external costs, private and social costs are equal.
Social Costs
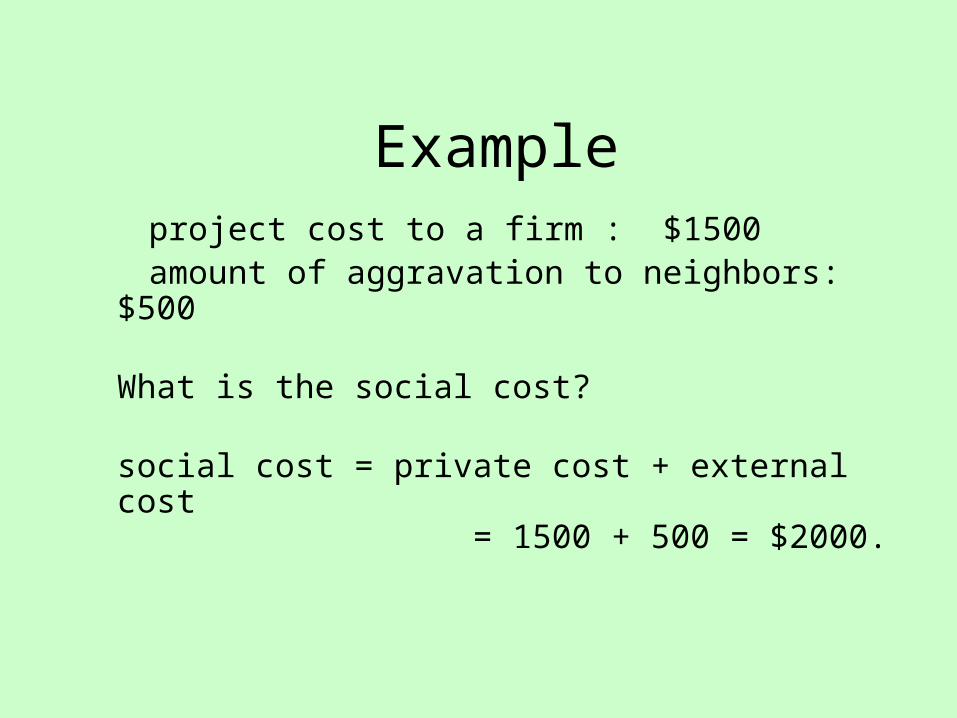
project cost to a firm : $1500 amount of aggravation to neighbors: $500
What is the social cost?
social cost = private cost + external cost = 1500 + 500 = $2000.
Example

project cost to a firm : $1500
project revenues to firm: $1800
If the firm ignores the effects on the neighbors, will the firm undertake the project?
Yes, the firm will undertake the project, because
private benefits ($1800) exceed private costs (1500).
Example continued

recall: social cost = $2000 project revenues to firm = $1800
social benefits = private benefits + external benefits = $1800 + $0 = $1800
Since social costs > social benefits,the project should not be undertaken.
From the viewpoint of society, however,
the project should not be undertaken.

An acceptable solution to an externality will be found if
• ownership of property is clearly defined,
• the number of people involved is small,
• the costs of bargaining are negligible.
Coase Theorem

These types of problems are unlikely to be resolved appropriately without government intervention.
In many situations, many people are affected
and the costs of bargaining are substantial.

priceprice
quantityquantity
Demand
External Costs
Supply - ignoring externality
Supply - taking externality into consideration
P2
Q2
P1
Q1

When an external cost is ignored,
the price is too low, and
the quantity is too high.
Effects of External Costs

price
quantity
Demand - ignoring externality
External Benefits
Supply
Demand-taking externality
into consideration
Q2Q1
P2
P1

When an external benefit is ignored,
the price is too low, and
the quantity is too low.
Effects of External Benefits
Examples:
• national defense
• dams
Public Goods
What are the characteristics of these goods that make them public goods?

Public goods are jointly consumed goods. If one person gets the good, everybody gets it. One person’s consumption of the good does not diminish the amount available for others to consume.
Also, the good can not divided up into separate portions for different individuals. Once a public good has been provided to one person, there is no easy way to prevent others from consuming it as well.
Characteristics of Public Goods

national defense - everyone is protected by the same defense system
dams - everyone in the community is protected from flooding by the dam
There is an incentive to not reveal your true valuation, since if the good is provided, you are going to get the use of it anyway.
But if everyone refuses to reveal their true value of the good and so refused to voluntarily pay what it is worth, the good will not be provided.
This is where the government is useful. The government tells everybody what to pay and everybody has to do it. Then the government has the money to pay to have the good produced.
Why Public Goods Cause Problems in a Market Economy

So far, we have discussed two major sectors of the economy.
The first consists of for-profit businesses, and is the largest sector in the U.S. economy.
The second sector is the government.
We will examine now a third sector, which consists of nonprofit organizations.

The Nonprofit Sector
The term “nonprofit sector” describes institutions and organizations that are neither government nor for-profit businesses.
It is also sometimes called the third sector, the independent sector, the philanthropic sector, or the voluntary sector.
Outside the United States, nonprofits are often called nongovernmental organizations (NGOs).
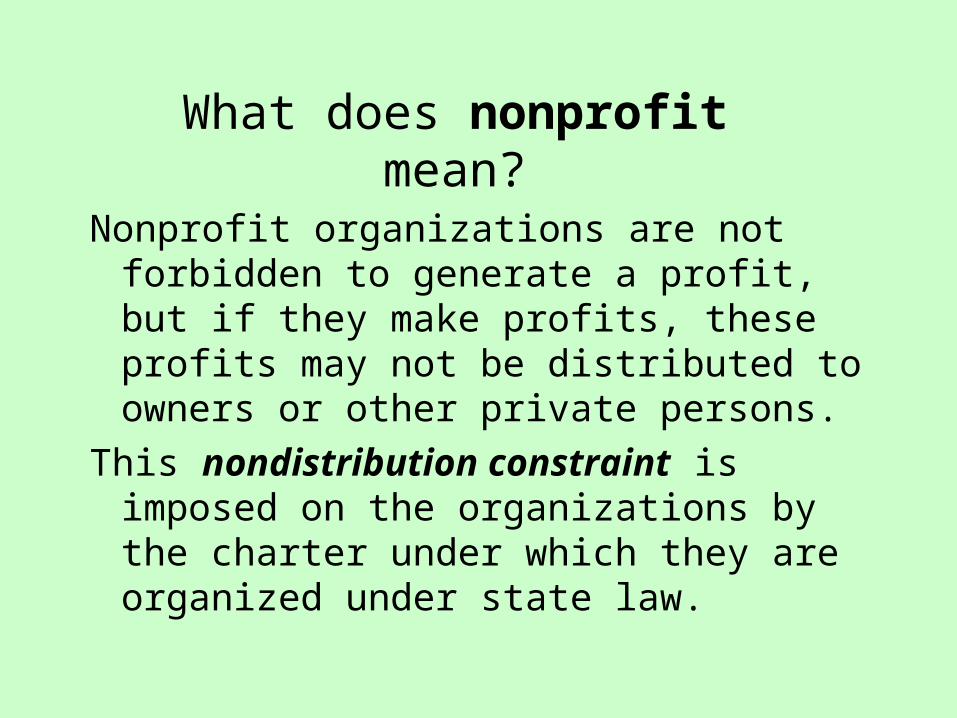
Nonprofit organizations are not forbidden to generate a profit, but if they make profits, these profits may not be distributed to owners or other private persons.
This nondistribution constraint is imposed on the organizations by the charter under which they are organized under state law.
What does nonprofit mean?

Four Main Types of Nonprofit Organizations
1. Public Benefit Service and Action
2. Member-Serving
3. Religious
4. Funding Intermediaries

Public Benefit Service & Action
The missions of these organizations include providing health care, providing education, promoting the arts, and ensuring civil rights.
While organizations such as animal shelters are in this group, the largest of these organizations are usually hospitals and educational institutions.

Member-Serving
These nonprofits provide benefits to their own members.
Examples: professional organizations (such as the American Medical Association), labor unions, political parties, and social clubs.

Religious
Churches, Synagogues, Mosques, and related organizations.

Funding Intermediaries
These include charitable foundations (such as the Ford Foundation) and funding federations (such as the United Way).

How large is the nonprofit sector?
This sector includes about 1.6 million organizations, or more than 6% of all organizations of all types (nonprofit, for-profit business, & government) in the U.S.

We have established that while the market system works well, it is far from perfect. The nonprofit sector represents one of the ways that the U.S. economy attempts to adjust for the imperfections. Winston Churchill once made a statement about democracy. A similar statement can be said about the market system. Churchill said:“Democracy is the worst form of government except all the others that have been tried.”

In a perfect world, no one would be hungry, cold, or homeless.
In addition, all incentives would operate in a fair and equitable manner.
In the real world, that is not the case.
That brings us to the subject of Poverty & Income Inequality

One way of examining income inequality is by looking at the shares of different quintiles of the population.
For example, what percent of all the income in the U.S. is in the hands of the poorest 20% of the population, and what percent is in the hands of the wealthiest 20%?

Perfect Equality Income Distribution
Percent of Population Percent of Income
“Poorest” 20% 20
Second 20% 20
Third 20% 20
Fourth 20% 20
“Richest” 20% 20

Perfect Equality Cumulative Income Distribution
Percent of Population Percent of Income
Bottom 20% 20
Bottom 40% 40
Bottom 60% 60
Bottom 80% 80
All 100% 100

A graph of the cumulative income distribution is called the
Lorenz Curve.

Graphing Income Distributions
Proportion of Population
Pro
port
i on
of I
n com
e
1.00
0.80
0.60
0.40
0.20
0
0 0.20 0.40 0. 60 0.80 1.00

Perfect Equality Line
Perfect Equality Line
Proportion of Population
Pro
port
i on
of I
n com
e
1.00
0.80
0.60
0.40
0.20
0
0 0.20 0.40 0. 60 0.80 1.00
In the hypothetical situation of perfect inequality,
one person has all the income, and everyone else has nothing.

Perfect Inequality
Perfect Inequality
Proportion of Population
Pro
port
i on
of I
n com
e
1.00
0.80
0.60
0.40
0.20
0
0 0.20 0.40 0. 60 0.80 1.00

U.S. Household Income Distribution in 2011
Percent of Population Percent of Income
Poorest 20% 3.2
Second 20% 8.4
Third 20% 14.3
Fourth 20% 23.0
Richest 20% 51.1
Source: http://www.census.gov/prod/2012pubs/p60-243.pdf

U.S. Cumulative Household Income Distribution in 2011
Percent of Population Percent of Income
Bottom 20% 3.2
Bottom 40% 11.6
Bottom 60% 25.9
Bottom 80% 48.9
All 100% 100
Source: http://www.census.gov/prod/2012pubs/p60-243.pdf

Lorenz Curve
Lorenz Curve for the U.S. in 2011
Proportion of Population
Pro
port
i on
of I
n com
e
1.00
0.80
0.60
0.40
0.20
0
0 0.20 0.40 0. 60 0.80 1.00

Proportion of Population
Pro
port
i on
of I
n com
e
1.00
0.80
0.60
0.40
0.20
0
0 0.20 0.40 0. 60 0.80 1.00
Lorenz Curve
The greater the extent of income inequality, the further the Lorenz Curve sags from the perfect equality line and the larger is area A.
A

We can capture the extent of inequality using a single number called the Gini Coefficient or Gini Index.

The Gini coefficient is the ratio of two areas.
Numerator: area between perfect equality line & Lorenz curve.
Denominator: area of the triangle below the perfect equality line.

Proportion of Population
Pro
port
i on
of I
n com
e
1.00
0.80
0.60
0.40
0.20
0
0 0.20 0.40 0. 60 0.80 1.00
A
Gini Coefficient = A / (A+B)
B

The greater the extent of income inequality (and the further the Lorenz Curve sags from the perfect equality line), the larger is the Gini Coefficient A/(A+B).

0 means perfect equality
1 means perfect inequality
The Gini Coefficient is a number between 0 & 1.
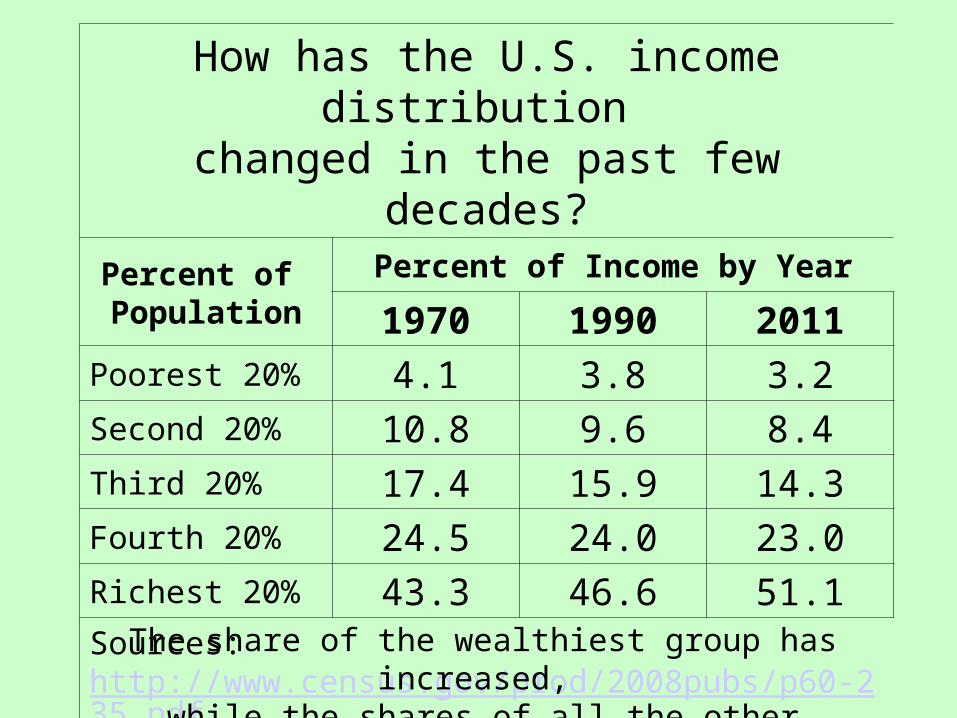
How has the U.S. income distribution changed in the past few decades?
Percent of Population
Percent of Income by Year
1970 1990 2011
Poorest 20% 4.1 3.8 3.2
Second 20% 10.8 9.6 8.4
Third 20% 17.4 15.9 14.3
Fourth 20% 24.5 24.0 23.0
Richest 20% 43.3 46.6 51.1Sources: http://www.census.gov/prod/2008pubs/p60-235.pdf ; http://www.census.gov/prod/2012pubs/p60-243.pdf
The share of the wealthiest group has increased, while the shares of all the other groups have decreased.

Gini Coefficient in the U.S
1970 0.394
1990 0.428
2011 0.477
These figures reflect an increase in income inequality.

Gini Coefficients for Distribution of Family Income
Rank Country Gini Coefficient Date
1 Lesotho 63.2 19952 South Africa 63.1 2005
14 Chile 52.1 200924 Mexico 48.3 200826 China 47.3 201341 United States 45.0 200750 Russia 42.0 201274 Israel 37.6 201275 Japan 37.6 200895 Poland 34.1 200996 Spain 34.0 201198 Ireland 33.9 2010
106 United Kingdom 32.3 2012108 Canada 32.1 2005114 France 30.9 2011119 Australia 30.3 2008129 Germany 27.0 2006130 Finland 26.8 2008135 Norway 25.0 2008141 Sweden 23.0 2005
From: https://www.cia.gov/library/publications/the-world-factbook/rankorder/2172rank.html .
Notice that countries with the most inequitable income distributions have Gini coefficients in the 60’s while those with the most equitable distributions are in the 20’s. The countries that we tend to consider our peers are generally in the 30’s, which indicates greater equality than the US at 45.0.

Closely related to the concept of income distribution is the notion of poverty.

What is Poverty?
“Poverty is a lack of those necessities that the custom of the country renders it indecent for … people …to be without.”
--Adam Smith

History of the Official Poverty Measure
In 1963, the Council of Economic Advisors developed a poverty measure that took into account “minimally adequate food intake.”
That measure was called the poverty threshold.

Poverty thresholds are the dollar amounts used to determine poverty status.
If total family income is less than the threshold appropriate for that family, the family is in poverty.
Each person or family is assigned one out of 48 possible poverty thresholds, which vary according to
Size of the familyAges of the members
The same thresholds are used throughout the U.S.
The thresholds are updated annually for inflation using the Consumer Price Index.
Source: http://www.census.gov/hhes/poverty/povdef.html#1
Poverty Thresholds

1963 $3,100
2013 $23,550
Poverty threshold for a family of four

Poverty Patterns
• Poverty rates among Blacks, American Indians, and Hispanics are much higher than among Whites and Asians.
• Poverty among the under-18 population is higher than for other age groups.
• Poverty rates are lower for married-couple households and higher for female householder families.

U.S. 14.3
Pennsylvania 12.6
Delaware County 9.5
Chester 32.3
Area Poverty Rates 2007-2011 (%)
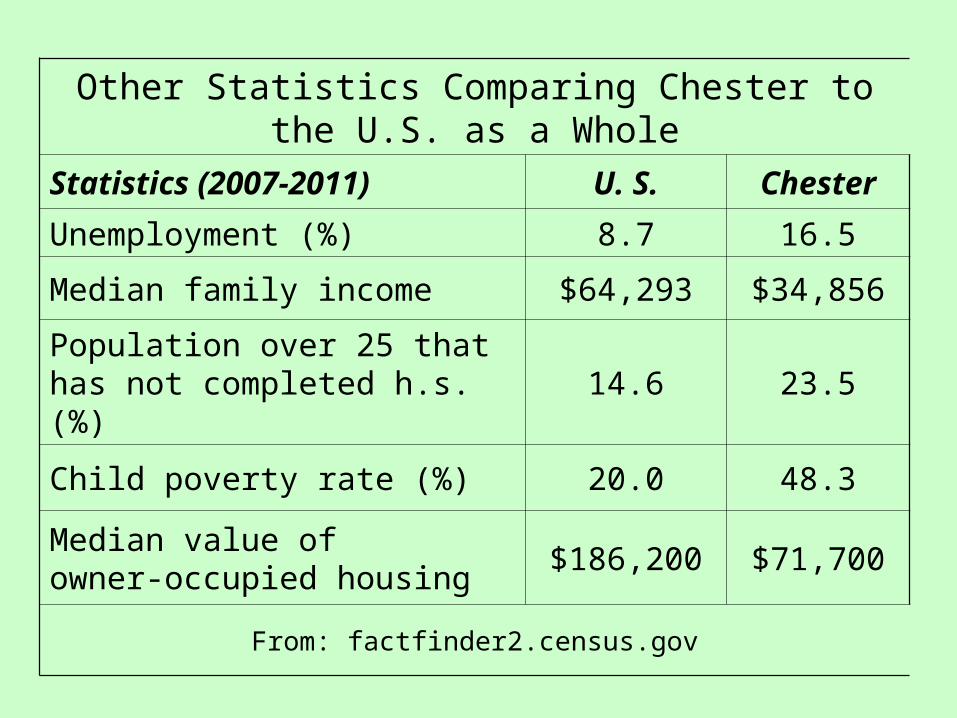
Other Statistics Comparing Chester to the U.S. as a Whole
Statistics (2007-2011) U. S. Chester
Unemployment (%) 8.7 16.5
Median family income $64,293 $34,856
Population over 25 that has not completed h.s. (%) 14.6 23.5
Child poverty rate (%) 20.0 48.3
Median value of owner-occupied housing
$186,200 $71,700
From: factfinder2.census.gov

Income vs. Wealth
We have talked about income inequality.
Income refers to the flow of money.
When you look at the stock of money that you have accumulated, that is wealth.

People who have very little income are unable to save anything. So they have no accumulated money, no wealth.
People who have more income are more able to save and invest their money.
So while income in the U.S. is distributed very unequally, wealth is distributed even more unequally.
Video:Wealth Inequality in America
(about 6 mins)
http://www.washingtonpost.com/blogs/wonkblog/wp/2013/03/06/this-viral-video-is-right-we-need-to-worry-about-wealth-inequality/
Based on: Norton, M.I. & Ariely, D. (2011). Building a Better America - One Wealth Quintile at a Time. Perspectives on Psychological Science, 6, 9–12.