mitra adi perkasa indonesia add (no change) consensus ... filemitra adi perkasa unlocking value ......
TRANSCRIPT
Retail│Indonesia│June 19, 2017
Company Note
IMPORTANT DISCLOSURES, INCLUDING ANY REQUIRED RESEARCH CERTIFICATIONS, ARE PROVIDED AT THE END OF THIS REPORT. IF THIS REPORT IS DISTRIBUTED IN THE UNITED STATES IT IS DISTRIBUTED BY CIMB SECURITIES (USA), INC. AND IS CONSIDERED THIRD-PARTY AFFILIATED RESEARCH.
Powered by the EFA Platform
Mitra Adi Perkasa Unlocking value
MAPI’s strategic partnership with private equity firms CVC and GA could improve its ■balance sheet and operating efficiency but we think the market has not priced this in.
This, combined with growth impetus from Starbucks’ aggressive expansion and entry ■into Vietnam, leads us to forecast 14-16% revenue growth in FY17-19F.
IPO of Mitra Boga Adiperkasa (MBA) and possibly Mitra Aktif Adiperkasa (MAA) next ■year may ease MAPI’s financial burden, raising net profit by 77%/46% in FY17F/18F.
MAPI’s share price has increased YTD but its low 7x forward EV/EBITDA (36% ■discount to sector) indicates that the turnaround is underappreciated, in our view.
Reiterate Add with higher TP of Rp7,900. Risk: weak consumer purchasing power. ■
Strategic partnership with CVC Capital Partners & General Atlantic The deal with CVC (in MAA, Mar 2015) and GA (in MBA, Nov 2016) not only improves MAPI’s balance sheet (zero coupon convertible bonds (CB), of Rp2.6tr could reduce interest-bearing debt by Rp1.5tr in FY17F), but also, allows MAPI to capitalise on operational expertise of its partners. Given the strong brands in its portfolio, we think this would help MAPI to rectify past mistakes and improve operating efficiency. We believe results improvement, particularly since start of 2H16, should continue into FY17F.
Unlocking value through IPOs MAPI has announced the IPO of its F&B subsidiary, MBA, scheduled for 23 Jun, earlier than we expected. This is a strategic move that allows GA to convert the CB. MAPI would suffer dilution from MBA contribution becoming minority earnings, but it would deleverage formally and amortisation expenses would fall. MAPI’s sportswear subsidiary, MAA, is earmarked for IPO by late-2018F, but we think it could be earlier to avoid election fever in 2019F. We believe the IPOs would unlock value but are underappreciated by investors.
Growth potential underappreciated Revenue growth, margin expansion and lower debt burden make for strong potential earnings catalysts. Improving cash flow allows for MAPI to embark on more aggressive growth. We project net gearing to improve to 43.4% in FY17F from 92.8% in FY16. Furthermore, we forecast net cash of Rp415bn (US$31m) at end-FY19F vs. net debt of Rp3.0tr at end-FY16. We estimate revenue growth of 14-16% p.a. and resilient operating margin to propel strong net profit of Rp768bn in FY19F (+46.8% CAGR in 2016-19F).
Undemanding valuation; introducing SOP target price of R7,900 We transfer analyst coverage and now value MAPI using SOP (previously: DCF), deriving a higher TP of Rp7,900, as we believe MAPI’s individual segments should be valued higher than what is currently reflected in the share price. Our TP implies 7.3x/6.1x 2017F/2018F EV/EBITDA vs. its 3-year mean of 8.1x forward EV/EBITDA. MAPI now trades at 7.0x FY18F EV/EBITDA (c.36% discount to sector), which we deem attractive given its strong 46.8% EPS CAGR in 2016-19F, high ROE and positive FCF, based on our estimates.
SOURCE: COMPANY DATA, CIMB FORECASTS
Indonesia
ADD (no change) Consensus ratings*: Buy 20 Hold 2 Sell 1
Current price: Rp6,400
Target price: Rp7,900
Previous target: Rp5,750
Up/downside: 23.4%
CIMB / Consensus: 6.3%
Reuters: MAPI.JK
Bloomberg: MAPI IJ
Market cap: US$798.9m
Rp10,624,000m
Average daily turnover: US$0.68m
Rp9,054m
Current shares o/s: 1,660m
Free float: 44.0% *Source: Bloomberg
Key changes in this note
FY17F Revenue increased by 2%.
FY17F EPS increased by 29%.
FY18F EPS increased by 41%.
Source: Bloomberg
Price performance 1M 3M 12M Absolute (%) 0 5.3 53.8
Relative (%) 0.9 1.7 35
Major shareholders % held PT Satya Mulia Gemilang 56.0
Analyst(s)
Kevie ADITYA
T (62) 21 3006 1738 E [email protected]
Financial Summary Dec-15A Dec-16A Dec-17F Dec-18F Dec-19F
Revenue (Rpb) 12,833 14,150 16,206 18,769 21,832
Operating EBITDA (Rpb) 1,101 1,511 1,809 2,162 2,592
Net Profit (Rpb) 30.1 230.4 429.8 629.3 766.5
Core EPS (Rp) 11.7 146.1 258.8 379.0 461.7
Core EPS Growth (67%) 1150% 77% 46% 22%
FD Core P/E (x) 547.7 43.8 24.7 16.9 13.9
DPS (Rp) 0.00 0.00 24.90 51.78 75.82
Dividend Yield 0.00% 0.00% 0.39% 0.81% 1.18%
EV/EBITDA (x) 12.33 8.73 7.19 5.92 4.87
P/FCFE (x) NA 10.8 NA 63.0 229.8
Net Gearing 106% 86% 40% 30% (6%)
P/BV (x) 3.57 3.32 2.96 2.57 2.22
ROE 0.7% 7.9% 12.6% 16.3% 17.2%
% Change In Core EPS Estimates 29.0% 40.4%
CIMB/consensus EPS (x) 1.16 1.26 1.21
85.0
105.0
125.0
145.0
3,700
4,700
5,700
6,700
Price Close Relative to JCI (RHS)
5
10
Jun-16 Sep-16 Dec-16 Mar-17
Vol m
Retail│Indonesia│Mitra Adi Perkasa│June 19, 2017
2
Unlocking value
PARTS ARE WORTH MORE THAN WHAT IS CURRENTLY REFLECTED IN SHARE PRICE
A brief business overview
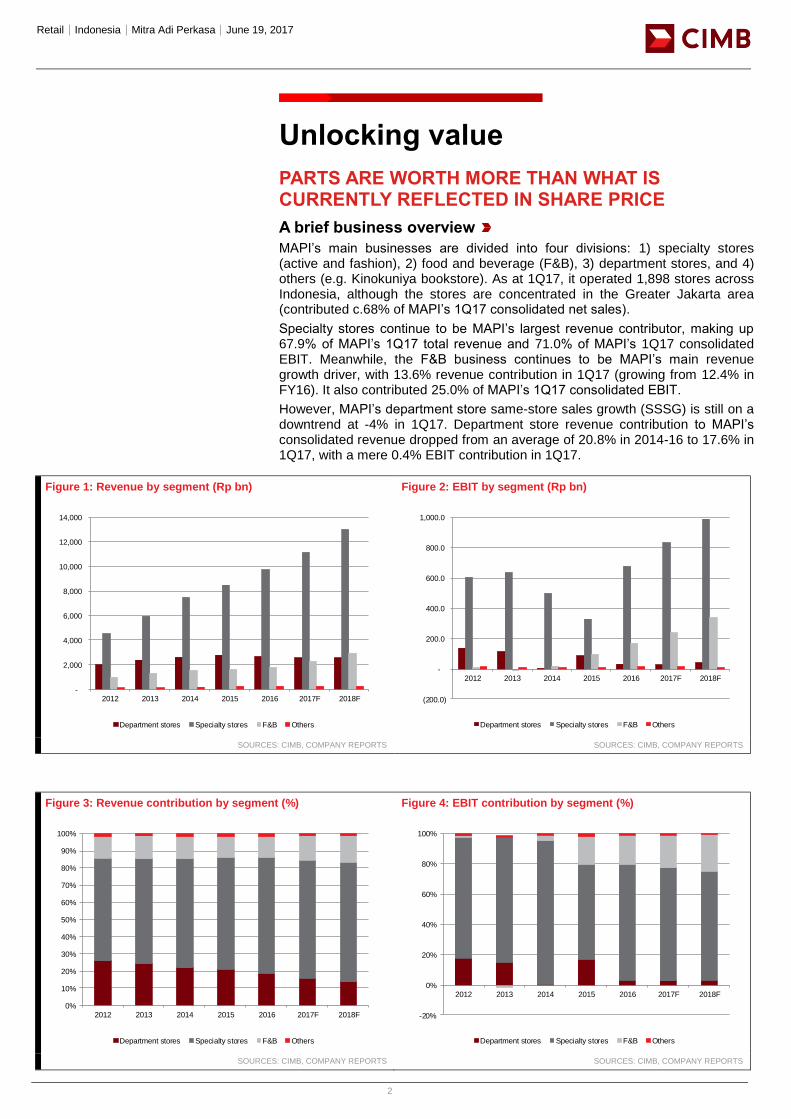
MAPI’s main businesses are divided into four divisions: 1) specialty stores (active and fashion), 2) food and beverage (F&B), 3) department stores, and 4) others (e.g. Kinokuniya bookstore). As at 1Q17, it operated 1,898 stores across Indonesia, although the stores are concentrated in the Greater Jakarta area (contributed c.68% of MAPI’s 1Q17 consolidated net sales).
Specialty stores continue to be MAPI’s largest revenue contributor, making up 67.9% of MAPI’s 1Q17 total revenue and 71.0% of MAPI’s 1Q17 consolidated EBIT. Meanwhile, the F&B business continues to be MAPI’s main revenue growth driver, with 13.6% revenue contribution in 1Q17 (growing from 12.4% in FY16). It also contributed 25.0% of MAPI’s 1Q17 consolidated EBIT.
However, MAPI’s department store same-store sales growth (SSSG) is still on a downtrend at -4% in 1Q17. Department store revenue contribution to MAPI’s consolidated revenue dropped from an average of 20.8% in 2014-16 to 17.6% in 1Q17, with a mere 0.4% EBIT contribution in 1Q17.
Figure 1: Revenue by segment (Rp bn) Figure 2: EBIT by segment (Rp bn)
SOURCES: CIMB, COMPANY REPORTS SOURCES: CIMB, COMPANY REPORTS
Figure 3: Revenue contribution by segment (%) Figure 4: EBIT contribution by segment (%)
SOURCES: CIMB, COMPANY REPORTS SOURCES: CIMB, COMPANY REPORTS
Title:
Source:
Please fill in the values above to have them entered in your report
-
2,000
4,000
6,000
8,000
10,000
12,000
14,000
2012 2013 2014 2015 2016 2017F 2018F
Department stores Specialty stores F&B Others
Title:
Source:
Please fill in the values above to have them entered in your report
(200.0)
-
200.0
400.0
600.0
800.0
1,000.0
2012 2013 2014 2015 2016 2017F 2018F
Department stores Specialty stores F&B Others
Title:
Source:
Please fill in the values above to have them entered in your report
0%
10%
20%
30%
40%
50%
60%
70%
80%
90%
100%
2012 2013 2014 2015 2016 2017F 2018F
Department stores Specialty stores F&B Others
Title:
Source:
Please fill in the values above to have them entered in your report
-20%
0%
20%
40%
60%
80%
100%
2012 2013 2014 2015 2016 2017F 2018F
Department stores Specialty stores F&B Others
Retail│Indonesia│Mitra Adi Perkasa│June 19, 2017
3
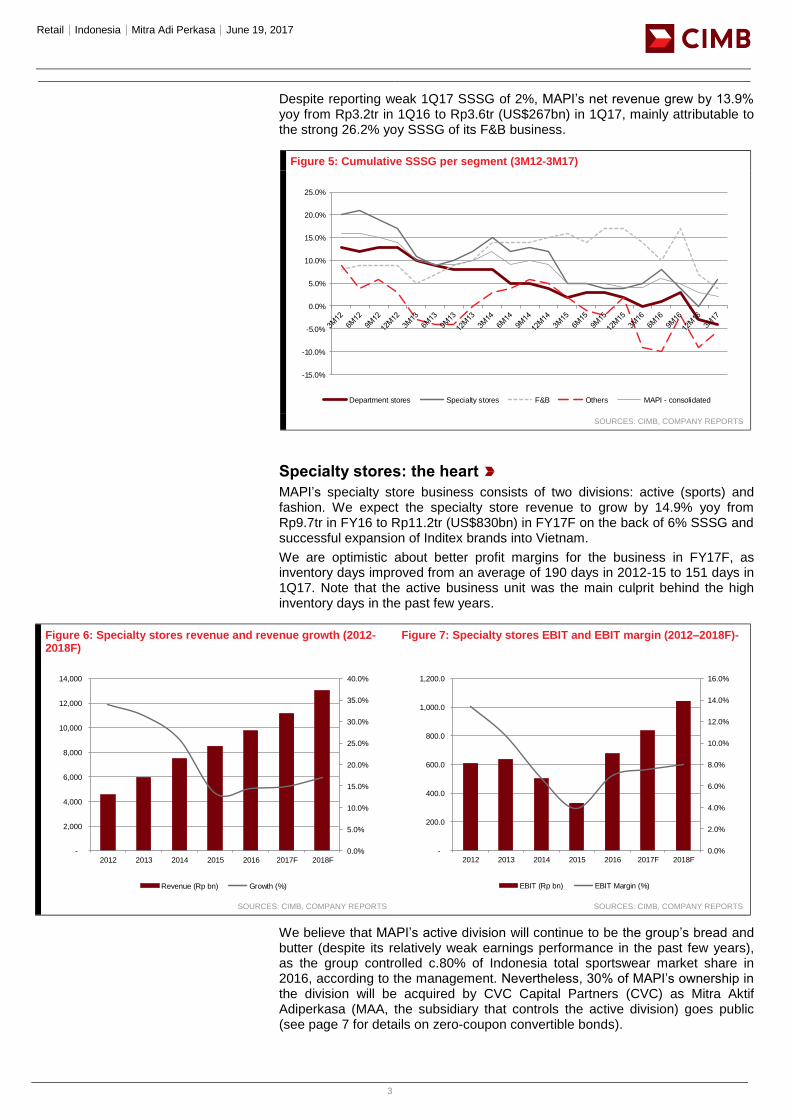
Despite reporting weak 1Q17 SSSG of 2%, MAPI’s net revenue grew by 13.9% yoy from Rp3.2tr in 1Q16 to Rp3.6tr (US$267bn) in 1Q17, mainly attributable to the strong 26.2% yoy SSSG of its F&B business.
Figure 5: Cumulative SSSG per segment (3M12-3M17)
SOURCES: CIMB, COMPANY REPORTS
Specialty stores: the heart
MAPI’s specialty store business consists of two divisions: active (sports) and fashion. We expect the specialty store revenue to grow by 14.9% yoy from Rp9.7tr in FY16 to Rp11.2tr (US$830bn) in FY17F on the back of 6% SSSG and successful expansion of Inditex brands into Vietnam.
We are optimistic about better profit margins for the business in FY17F, as inventory days improved from an average of 190 days in 2012-15 to 151 days in 1Q17. Note that the active business unit was the main culprit behind the high inventory days in the past few years.
Figure 6: Specialty stores revenue and revenue growth (2012-2018F)
Figure 7: Specialty stores EBIT and EBIT margin (2012–2018F)-
SOURCES: CIMB, COMPANY REPORTS SOURCES: CIMB, COMPANY REPORTS
We believe that MAPI’s active division will continue to be the group’s bread and butter (despite its relatively weak earnings performance in the past few years), as the group controlled c.80% of Indonesia total sportswear market share in 2016, according to the management. Nevertheless, 30% of MAPI’s ownership in the division will be acquired by CVC Capital Partners (CVC) as Mitra Aktif Adiperkasa (MAA, the subsidiary that controls the active division) goes public (see page 7 for details on zero-coupon convertible bonds).
Title:
Source:
Please fill in the values above to have them entered in your report
-15.0%
-10.0%
-5.0%
0.0%
5.0%
10.0%
15.0%
20.0%
25.0%
Department stores Specialty stores F&B Others MAPI - consolidated
Title:
Source:
Please fill in the values above to have them entered in your report
0.0%
5.0%
10.0%
15.0%
20.0%
25.0%
30.0%
35.0%
40.0%
-
2,000
4,000
6,000
8,000
10,000
12,000
14,000
2012 2013 2014 2015 2016 2017F 2018F
Revenue (Rp bn) Growth (%)
Title:
Source:
Please fill in the values above to have them entered in your report
0.0%
2.0%
4.0%
6.0%
8.0%
10.0%
12.0%
14.0%
16.0%
-
200.0
400.0
600.0
800.0
1,000.0
1,200.0
2012 2013 2014 2015 2016 2017F 2018F
EBIT (Rp bn) EBIT Margin (%)
Retail│Indonesia│Mitra Adi Perkasa│June 19, 2017
4
In terms of its fashion business, we continue to believe that the fast fashion brands under Inditex (e.g. Zara, Pull & Bear, Stradivarius, Bershka) and several other brands (e.g. Cotton On) will continue to perform well.
We believe MAPI’s successful expansion into Vietnam is another potential key sales driver. MAPI reported 1Q17 sales of Rp119bn in Vietnam, which seems low but implies Rp1.3bn sales/day from just one Zara store in Ho Chi Minh City. In comparison, we estimate that one Zara store in Jakarta contributes Rp400bn-500bn per day, or around one-third of Zara Vietnam’s daily revenue.
Given the success of its first Zara store in Ho Chi Minh City, MAPI’s management plans to open another two Inditex stores this year (most likely Pull & Bear and Stradivarius) in Ho Chi Minh City and another Zara store in Hanoi. Our channel checks indicate that Zara started the recruitment process for several positions in Hanoi (with the application deadline on 15 Apr 2017), suggesting that the store may open in early 2H17F.
Food & beverage: sales growth engine
We project MAPI’s F&B revenue to grow by 28.7% yoy from Rp1.8tr in FY16 to Rp2.3tr (US$170bn) revenue in FY17F, or 15.8% of MAPI’s total consolidated revenue. We expect this to be driven by the significant expansion of its F&B units (mainly Starbucks).
Figure 8: F&B revenue and revenue growth (2012-2018F) Figure 9: F&B EBIT and EBIT margin (2012–2018F)-
SOURCES: CIMB, COMPANY REPORTS SOURCES: CIMB, COMPANY REPORTS
Despite growing at a rate of 20-30 stores per year over the past several years, MAPI plans to be even more aggressive and open 60-70 Starbucks stores this year. We believe this is achievable, given that Starbucks recently penetrated Indonesia’s secondary cities and hence, has ample room to grow. Nevertheless, we think that a slowdown in Starbucks’s SSSG to 7-9% in FY17F-19F is inevitable, as it registered elevated 20-30% SSSG in the past few years. Cannibalisation from the newly-opened stores, as well as the emergence of local artisan coffee shops (e.g. Common Grounds, Tanamera) are other factors that could cause possible slowdown in SSSG, in our view.
Nevertheless, we still expect F&B EBIT margin to expand by 100bp from 9.6% in FY16 to 10.6% in FY17F. We project EBIT margin to continue expanding over the next few years, given its low base in FY16. Starbucks has also initiated several measures to improve cost efficiency, such as negotiating with suppliers (mainly milk) and introducing pricing tiers to improve its profitability.
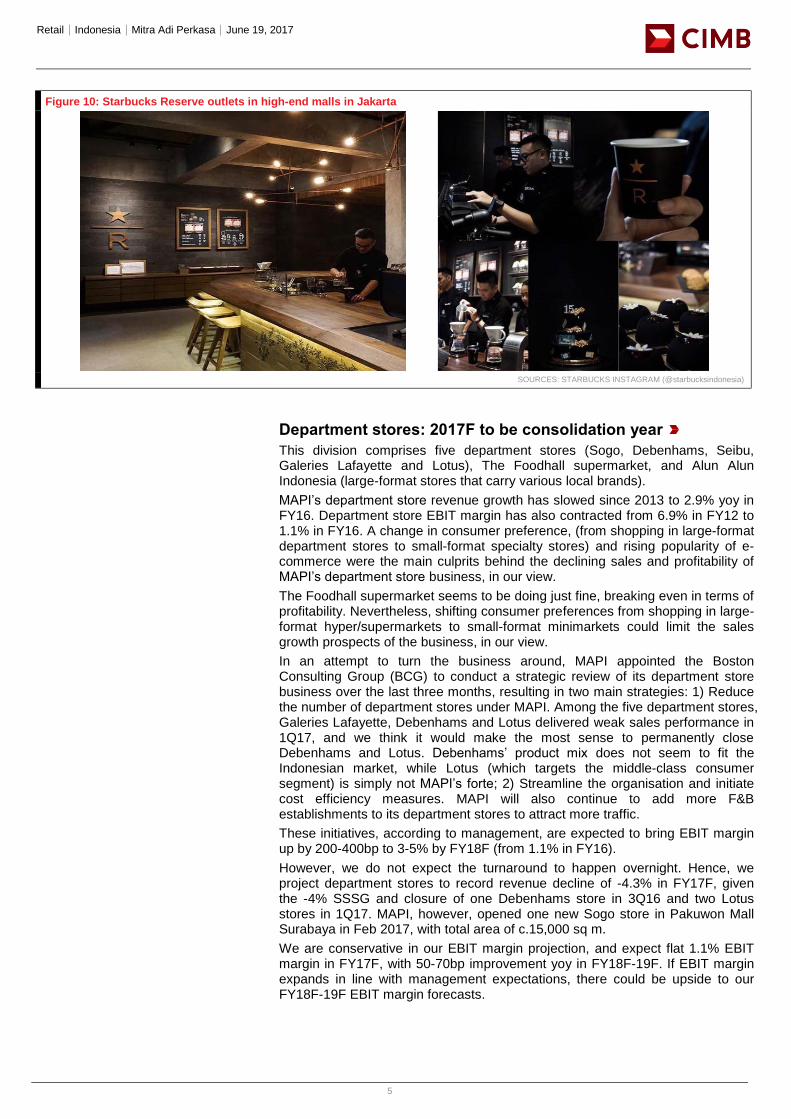
Starbucks recently launched three new Starbucks Reserve stores in high-end areas in Jakarta, Bandung, and Surabaya. These stores are designed to serve exotic, rare and exquisite coffees and aim to compete against local artisan coffee shops which that seem to be rapidly gaining popularity among Indonesians lately. We believe that this sort of innovation is necessary to ensure that Starbucks retains market share amid intense competition.
Title:
Source:
Please fill in the values above to have them entered in your report
0.0%
5.0%
10.0%
15.0%
20.0%
25.0%
30.0%
35.0%
-
500
1,000
1,500
2,000
2,500
3,000
3,500
4,000
4,500
2012 2013 2014 2015 2016 2017F 2018F
Revenue (Rp bn) Growth (%)
Title:
Source:
Please fill in the values above to have them entered in your report
-2.0%
0.0%
2.0%
4.0%
6.0%
8.0%
10.0%
12.0%
14.0%
(50.0)
-
50.0
100.0
150.0
200.0
250.0
300.0
350.0
400.0
2012 2013 2014 2015 2016 2017F 2018F
EBIT (Rp bn) EBIT margin (%)
Retail│Indonesia│Mitra Adi Perkasa│June 19, 2017
5
Figure 10: Starbucks Reserve outlets in high-end malls in Jakarta
SOURCES: STARBUCKS INSTAGRAM (@starbucksindonesia)
Department stores: 2017F to be consolidation year
This division comprises five department stores (Sogo, Debenhams, Seibu, Galeries Lafayette and Lotus), The Foodhall supermarket, and Alun Alun Indonesia (large-format stores that carry various local brands).
MAPI’s department store revenue growth has slowed since 2013 to 2.9% yoy in FY16. Department store EBIT margin has also contracted from 6.9% in FY12 to 1.1% in FY16. A change in consumer preference, (from shopping in large-format department stores to small-format specialty stores) and rising popularity of e-commerce were the main culprits behind the declining sales and profitability of MAPI’s department store business, in our view.
The Foodhall supermarket seems to be doing just fine, breaking even in terms of profitability. Nevertheless, shifting consumer preferences from shopping in large-format hyper/supermarkets to small-format minimarkets could limit the sales growth prospects of the business, in our view.
In an attempt to turn the business around, MAPI appointed the Boston Consulting Group (BCG) to conduct a strategic review of its department store business over the last three months, resulting in two main strategies: 1) Reduce the number of department stores under MAPI. Among the five department stores, Galeries Lafayette, Debenhams and Lotus delivered weak sales performance in 1Q17, and we think it would make the most sense to permanently close Debenhams and Lotus. Debenhams’ product mix does not seem to fit the Indonesian market, while Lotus (which targets the middle-class consumer segment) is simply not MAPI’s forte; 2) Streamline the organisation and initiate cost efficiency measures. MAPI will also continue to add more F&B establishments to its department stores to attract more traffic.
These initiatives, according to management, are expected to bring EBIT margin up by 200-400bp to 3-5% by FY18F (from 1.1% in FY16).
However, we do not expect the turnaround to happen overnight. Hence, we project department stores to record revenue decline of -4.3% in FY17F, given the -4% SSSG and closure of one Debenhams store in 3Q16 and two Lotus stores in 1Q17. MAPI, however, opened one new Sogo store in Pakuwon Mall Surabaya in Feb 2017, with total area of c.15,000 sq m.
We are conservative in our EBIT margin projection, and expect flat 1.1% EBIT margin in FY17F, with 50-70bp improvement yoy in FY18F-19F. If EBIT margin expands in line with management expectations, there could be upside to our FY18F-19F EBIT margin forecasts.
Retail│Indonesia│Mitra Adi Perkasa│June 19, 2017
6
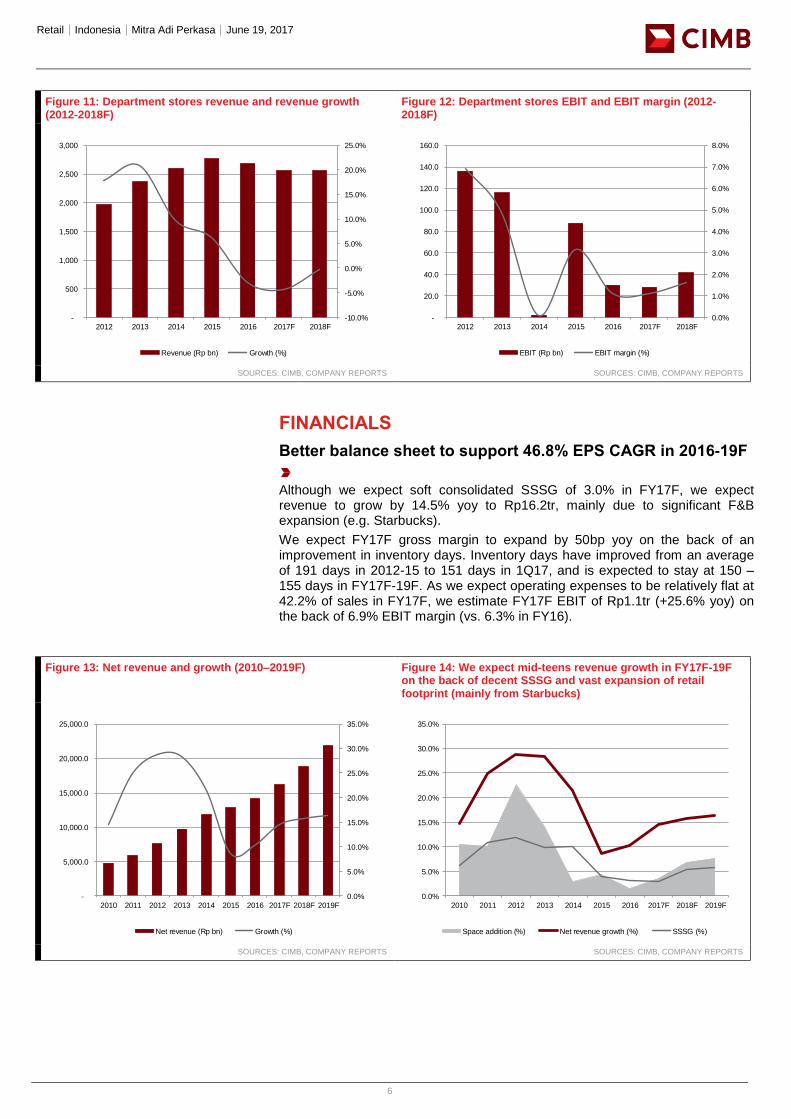
Figure 11: Department stores revenue and revenue growth (2012-2018F)
Figure 12: Department stores EBIT and EBIT margin (2012-2018F)
SOURCES: CIMB, COMPANY REPORTS SOURCES: CIMB, COMPANY REPORTS
FINANCIALS
Better balance sheet to support 46.8% EPS CAGR in 2016-19F
Although we expect soft consolidated SSSG of 3.0% in FY17F, we expect revenue to grow by 14.5% yoy to Rp16.2tr, mainly due to significant F&B expansion (e.g. Starbucks).
We expect FY17F gross margin to expand by 50bp yoy on the back of an improvement in inventory days. Inventory days have improved from an average of 191 days in 2012-15 to 151 days in 1Q17, and is expected to stay at 150 – 155 days in FY17F-19F. As we expect operating expenses to be relatively flat at 42.2% of sales in FY17F, we estimate FY17F EBIT of Rp1.1tr (+25.6% yoy) on the back of 6.9% EBIT margin (vs. 6.3% in FY16).
Figure 13: Net revenue and growth (2010–2019F) Figure 14: We expect mid-teens revenue growth in FY17F-19F on the back of decent SSSG and vast expansion of retail footprint (mainly from Starbucks)
SOURCES: CIMB, COMPANY REPORTS SOURCES: CIMB, COMPANY REPORTS
Title:
Source:
Please fill in the values above to have them entered in your report
-10.0%
-5.0%
0.0%
5.0%
10.0%
15.0%
20.0%
25.0%
-
500
1,000
1,500
2,000
2,500
3,000
2012 2013 2014 2015 2016 2017F 2018F
Revenue (Rp bn) Growth (%)
Title:
Source:
Please fill in the values above to have them entered in your report
0.0%
1.0%
2.0%
3.0%
4.0%
5.0%
6.0%
7.0%
8.0%
-
20.0
40.0
60.0
80.0
100.0
120.0
140.0
160.0
2012 2013 2014 2015 2016 2017F 2018F
EBIT (Rp bn) EBIT margin (%)
Title:
Source:
Please fill in the values above to have them entered in your report
0.0%
5.0%
10.0%
15.0%
20.0%
25.0%
30.0%
35.0%
-
5,000.0
10,000.0
15,000.0
20,000.0
25,000.0
2010 2011 2012 2013 2014 2015 2016 2017F 2018F 2019F
Net revenue (Rp bn) Growth (%)
Title:
Source:
Please fill in the values above to have them entered in your report
0.0%
5.0%
10.0%
15.0%
20.0%
25.0%
30.0%
35.0%
2010 2011 2012 2013 2014 2015 2016 2017F 2018F 2019F
Space addition (%) Net revenue growth (%) SSSG (%)
Retail│Indonesia│Mitra Adi Perkasa│June 19, 2017
7
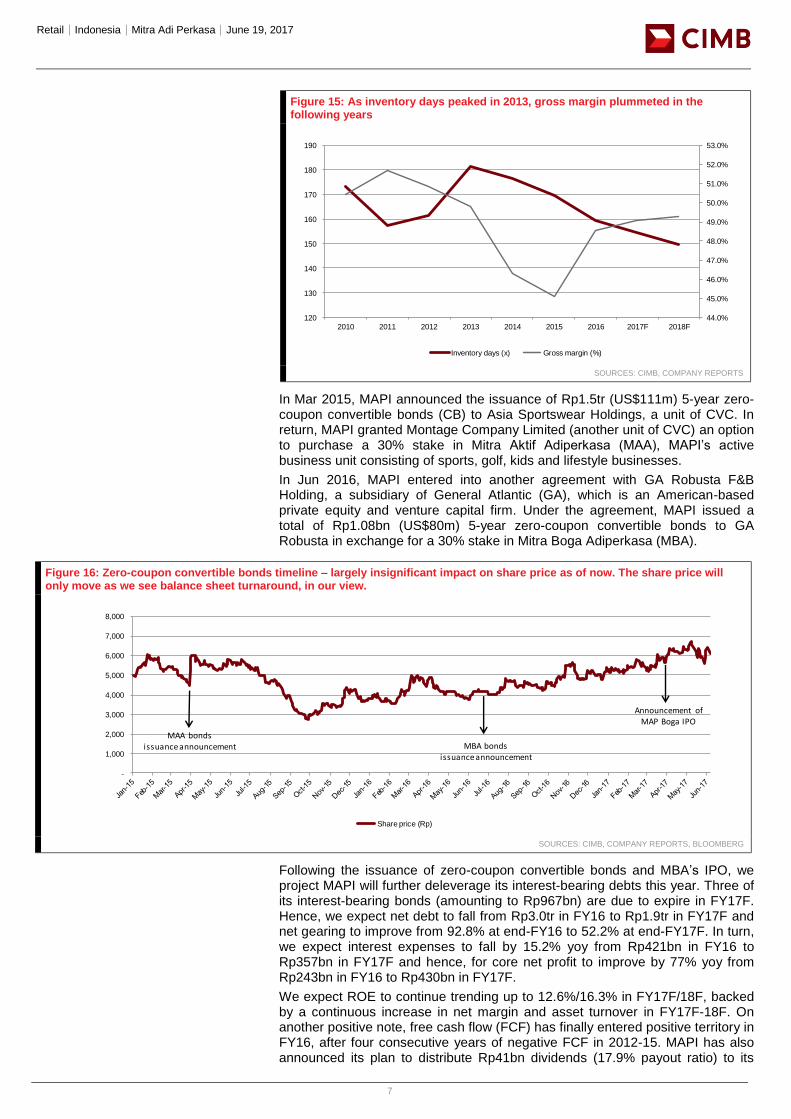
Figure 15: As inventory days peaked in 2013, gross margin plummeted in the following years
SOURCES: CIMB, COMPANY REPORTS
In Mar 2015, MAPI announced the issuance of Rp1.5tr (US$111m) 5-year zero-coupon convertible bonds (CB) to Asia Sportswear Holdings, a unit of CVC. In return, MAPI granted Montage Company Limited (another unit of CVC) an option to purchase a 30% stake in Mitra Aktif Adiperkasa (MAA), MAPI’s active business unit consisting of sports, golf, kids and lifestyle businesses.
In Jun 2016, MAPI entered into another agreement with GA Robusta F&B Holding, a subsidiary of General Atlantic (GA), which is an American-based private equity and venture capital firm. Under the agreement, MAPI issued a total of Rp1.08bn (US$80m) 5-year zero-coupon convertible bonds to GA Robusta in exchange for a 30% stake in Mitra Boga Adiperkasa (MBA).
Figure 16: Zero-coupon convertible bonds timeline – largely insignificant impact on share price as of now. The share price will only move as we see balance sheet turnaround, in our view.
SOURCES: CIMB, COMPANY REPORTS, BLOOMBERG
Following the issuance of zero-coupon convertible bonds and MBA’s IPO, we project MAPI will further deleverage its interest-bearing debts this year. Three of its interest-bearing bonds (amounting to Rp967bn) are due to expire in FY17F. Hence, we expect net debt to fall from Rp3.0tr in FY16 to Rp1.9tr in FY17F and net gearing to improve from 92.8% at end-FY16 to 52.2% at end-FY17F. In turn, we expect interest expenses to fall by 15.2% yoy from Rp421bn in FY16 to Rp357bn in FY17F and hence, for core net profit to improve by 77% yoy from Rp243bn in FY16 to Rp430bn in FY17F.
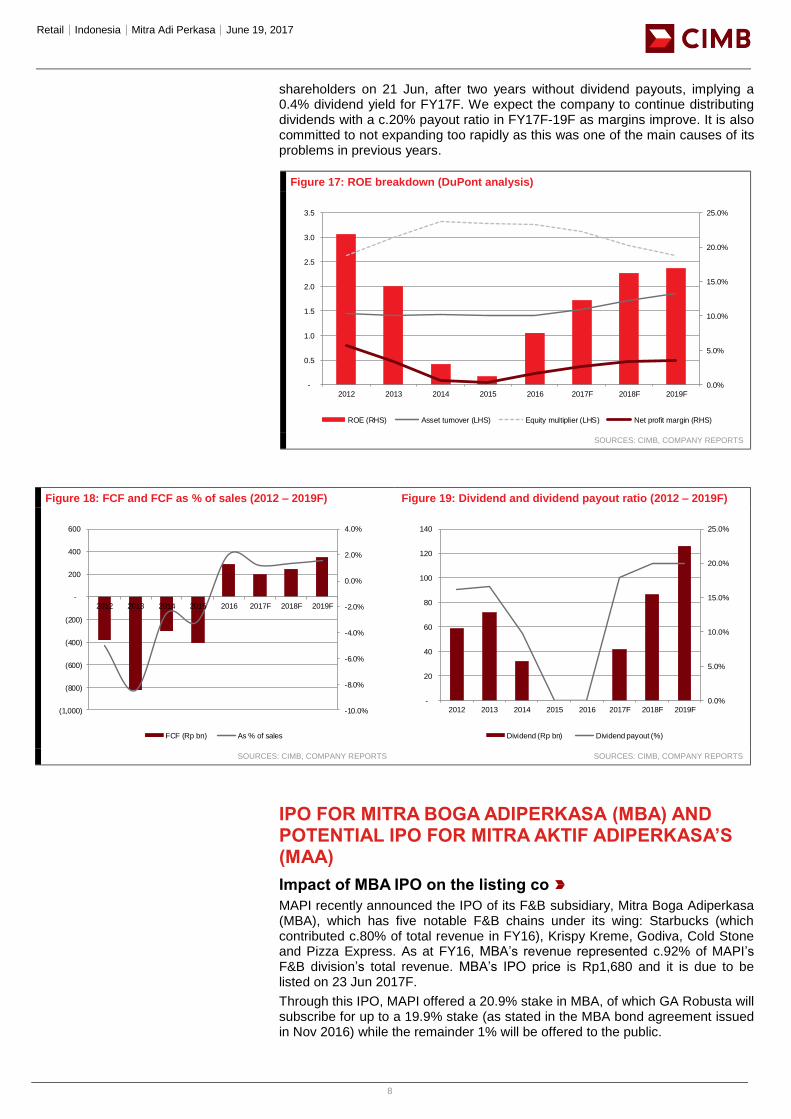
We expect ROE to continue trending up to 12.6%/16.3% in FY17F/18F, backed by a continuous increase in net margin and asset turnover in FY17F-18F. On another positive note, free cash flow (FCF) has finally entered positive territory in FY16, after four consecutive years of negative FCF in 2012-15. MAPI has also announced its plan to distribute Rp41bn dividends (17.9% payout ratio) to its
Title:
Source:
Please fill in the values above to have them entered in your report
44.0%
45.0%
46.0%
47.0%
48.0%
49.0%
50.0%
51.0%
52.0%
53.0%
120
130
140
150
160
170
180
190
2010 2011 2012 2013 2014 2015 2016 2017F 2018F
Inventory days (x) Gross margin (%)
Title:
Source:
Please fill in the values above to have them entered in your report
-
1,000
2,000
3,000
4,000
5,000
6,000
7,000
8,000
Share price (Rp)
MAA bondsissuance announcement
Announcement ofMAP Boga IPO
MBA bondsissuance announcement
Retail│Indonesia│Mitra Adi Perkasa│June 19, 2017
8
shareholders on 21 Jun, after two years without dividend payouts, implying a 0.4% dividend yield for FY17F. We expect the company to continue distributing dividends with a c.20% payout ratio in FY17F-19F as margins improve. It is also committed to not expanding too rapidly as this was one of the main causes of its problems in previous years.
Figure 17: ROE breakdown (DuPont analysis)
SOURCES: CIMB, COMPANY REPORTS
Figure 18: FCF and FCF as % of sales (2012 – 2019F) Figure 19: Dividend and dividend payout ratio (2012 – 2019F)
SOURCES: CIMB, COMPANY REPORTS SOURCES: CIMB, COMPANY REPORTS
IPO FOR MITRA BOGA ADIPERKASA (MBA) AND POTENTIAL IPO FOR MITRA AKTIF ADIPERKASA’S (MAA)
Impact of MBA IPO on the listing co
MAPI recently announced the IPO of its F&B subsidiary, Mitra Boga Adiperkasa (MBA), which has five notable F&B chains under its wing: Starbucks (which contributed c.80% of total revenue in FY16), Krispy Kreme, Godiva, Cold Stone and Pizza Express. As at FY16, MBA’s revenue represented c.92% of MAPI’s F&B division’s total revenue. MBA’s IPO price is Rp1,680 and it is due to be listed on 23 Jun 2017F.
Through this IPO, MAPI offered a 20.9% stake in MBA, of which GA Robusta will subscribe for up to a 19.9% stake (as stated in the MBA bond agreement issued in Nov 2016) while the remainder 1% will be offered to the public.
Title:
Source:
Please fill in the values above to have them entered in your report
0.0%
5.0%
10.0%
15.0%
20.0%
25.0%
-
0.5
1.0
1.5
2.0
2.5
3.0
3.5
2012 2013 2014 2015 2016 2017F 2018F 2019F
ROE (RHS) Asset turnover (LHS) Equity multiplier (LHS) Net profit margin (RHS)
Title:
Source:
Please fill in the values above to have them entered in your report
-10.0%
-8.0%
-6.0%
-4.0%
-2.0%
0.0%
2.0%
4.0%
(1,000)
(800)
(600)
(400)
(200)
-
200
400
600
2012 2013 2014 2015 2016 2017F 2018F 2019F
FCF (Rp bn) As % of sales
Title:
Source:
Please fill in the values above to have them entered in your report
0.0%
5.0%
10.0%
15.0%
20.0%
25.0%
-
20
40
60
80
100
120
140
2012 2013 2014 2015 2016 2017F 2018F 2019F
Dividend (Rp bn) Dividend payout (%)
Retail│Indonesia│Mitra Adi Perkasa│June 19, 2017
9
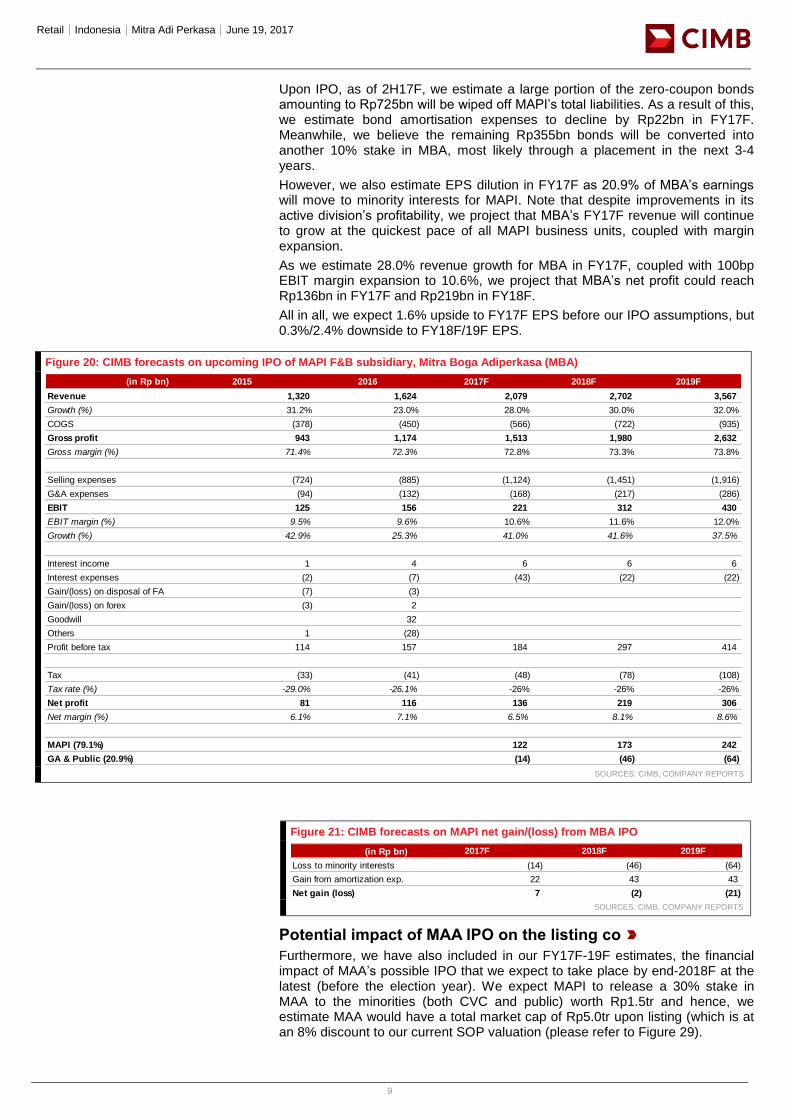
Upon IPO, as of 2H17F, we estimate a large portion of the zero-coupon bonds amounting to Rp725bn will be wiped off MAPI’s total liabilities. As a result of this, we estimate bond amortisation expenses to decline by Rp22bn in FY17F. Meanwhile, we believe the remaining Rp355bn bonds will be converted into another 10% stake in MBA, most likely through a placement in the next 3-4 years.
However, we also estimate EPS dilution in FY17F as 20.9% of MBA’s earnings will move to minority interests for MAPI. Note that despite improvements in its active division’s profitability, we project that MBA’s FY17F revenue will continue to grow at the quickest pace of all MAPI business units, coupled with margin expansion.
As we estimate 28.0% revenue growth for MBA in FY17F, coupled with 100bp EBIT margin expansion to 10.6%, we project that MBA’s net profit could reach Rp136bn in FY17F and Rp219bn in FY18F.
All in all, we expect 1.6% upside to FY17F EPS before our IPO assumptions, but 0.3%/2.4% downside to FY18F/19F EPS.
Figure 20: CIMB forecasts on upcoming IPO of MAPI F&B subsidiary, Mitra Boga Adiperkasa (MBA)
SOURCES: CIMB, COMPANY REPORTS
Figure 21: CIMB forecasts on MAPI net gain/(loss) from MBA IPO
SOURCES: CIMB, COMPANY REPORTS
Potential impact of MAA IPO on the listing co
Furthermore, we have also included in our FY17F-19F estimates, the financial impact of MAA’s possible IPO that we expect to take place by end-2018F at the latest (before the election year). We expect MAPI to release a 30% stake in MAA to the minorities (both CVC and public) worth Rp1.5tr and hence, we estimate MAA would have a total market cap of Rp5.0tr upon listing (which is at an 8% discount to our current SOP valuation (please refer to Figure 29).
(in Rp bn) 2015 2016 2017F 2018F 2019F
Revenue 1,320 1,624 2,079 2,702 3,567
Growth (%) 31.2% 23.0% 28.0% 30.0% 32.0%
COGS (378) (450) (566) (722) (935)
Gross profit 943 1,174 1,513 1,980 2,632
Gross margin (%) 71.4% 72.3% 72.8% 73.3% 73.8%
Selling expenses (724) (885) (1,124) (1,451) (1,916)
G&A expenses (94) (132) (168) (217) (286)
EBIT 125 156 221 312 430
EBIT margin (%) 9.5% 9.6% 10.6% 11.6% 12.0%
Growth (%) 42.9% 25.3% 41.0% 41.6% 37.5%
Interest income 1 4 6 6 6
Interest expenses (2) (7) (43) (22) (22)
Gain/(loss) on disposal of FA (7) (3)
Gain/(loss) on forex (3) 2
Goodwill 32
Others 1 (28)
Profit before tax 114 157 184 297 414
Tax (33) (41) (48) (78) (108)
Tax rate (%) -29.0% -26.1% -26% -26% -26%
Net profit 81 116 136 219 306
Net margin (%) 6.1% 7.1% 6.5% 8.1% 8.6%
MAPI (79.1%) 122 173 242
GA & Public (20.9%) (14) (46) (64)
(in Rp bn) 2017F 2018F 2019F
Loss to minority interests (14) (46) (64)
Gain from amortization exp. 22 43 43
Net gain (loss) 7 (2) (21)
Retail│Indonesia│Mitra Adi Perkasa│June 19, 2017
10
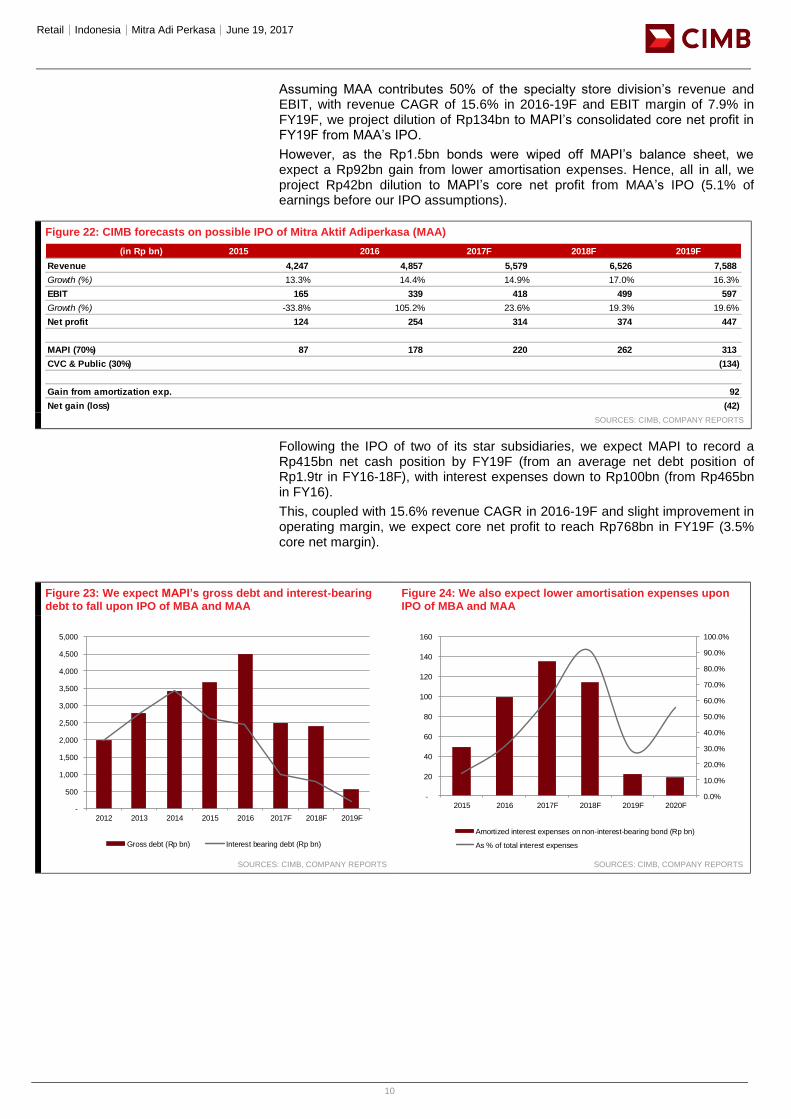
Assuming MAA contributes 50% of the specialty store division’s revenue and EBIT, with revenue CAGR of 15.6% in 2016-19F and EBIT margin of 7.9% in FY19F, we project dilution of Rp134bn to MAPI’s consolidated core net profit in FY19F from MAA’s IPO.
However, as the Rp1.5bn bonds were wiped off MAPI’s balance sheet, we expect a Rp92bn gain from lower amortisation expenses. Hence, all in all, we project Rp42bn dilution to MAPI’s core net profit from MAA’s IPO (5.1% of earnings before our IPO assumptions).
Figure 22: CIMB forecasts on possible IPO of Mitra Aktif Adiperkasa (MAA)
SOURCES: CIMB, COMPANY REPORTS
Following the IPO of two of its star subsidiaries, we expect MAPI to record a Rp415bn net cash position by FY19F (from an average net debt position of Rp1.9tr in FY16-18F), with interest expenses down to Rp100bn (from Rp465bn in FY16).
This, coupled with 15.6% revenue CAGR in 2016-19F and slight improvement in operating margin, we expect core net profit to reach Rp768bn in FY19F (3.5% core net margin).
Figure 23: We expect MAPI’s gross debt and interest-bearing debt to fall upon IPO of MBA and MAA
Figure 24: We also expect lower amortisation expenses upon IPO of MBA and MAA
SOURCES: CIMB, COMPANY REPORTS SOURCES: CIMB, COMPANY REPORTS
(in Rp bn) 2015 2016 2017F 2018F 2019F
Revenue 4,247 4,857 5,579 6,526 7,588
Growth (%) 13.3% 14.4% 14.9% 17.0% 16.3%
EBIT 165 339 418 499 597
Growth (%) -33.8% 105.2% 23.6% 19.3% 19.6%
Net profit 124 254 314 374 447
MAPI (70%) 87 178 220 262 313
CVC & Public (30%) (134)
Gain from amortization exp. 92
Net gain (loss) (42)
Title:
Source:
Please fill in the values above to have them entered in your report
-
500
1,000
1,500
2,000
2,500
3,000
3,500
4,000
4,500
5,000
2012 2013 2014 2015 2016 2017F 2018F 2019F
Gross debt (Rp bn) Interest bearing debt (Rp bn)
Title:
Source:
Please fill in the values above to have them entered in your report
0.0%
10.0%
20.0%
30.0%
40.0%
50.0%
60.0%
70.0%
80.0%
90.0%
100.0%
-
20
40
60
80
100
120
140
160
2015 2016 2017F 2018F 2019F 2020F
Amortized interest expenses on non-interest-bearing bond (Rp bn)
As % of total interest expenses
Retail│Indonesia│Mitra Adi Perkasa│June 19, 2017
11
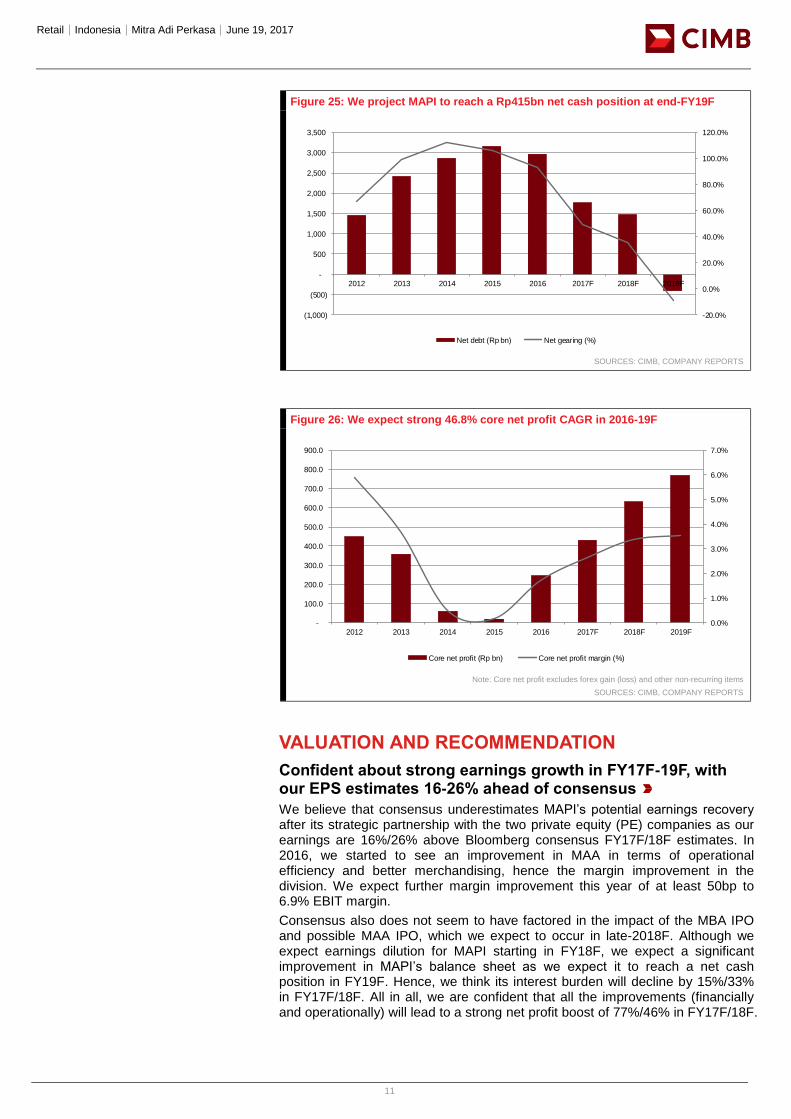
Figure 25: We project MAPI to reach a Rp415bn net cash position at end-FY19F
SOURCES: CIMB, COMPANY REPORTS
Figure 26: We expect strong 46.8% core net profit CAGR in 2016-19F
Note: Core net profit excludes forex gain (loss) and other non-recurring items
SOURCES: CIMB, COMPANY REPORTS
VALUATION AND RECOMMENDATION
Confident about strong earnings growth in FY17F-19F, with our EPS estimates 16-26% ahead of consensus
We believe that consensus underestimates MAPI’s potential earnings recovery after its strategic partnership with the two private equity (PE) companies as our earnings are 16%/26% above Bloomberg consensus FY17F/18F estimates. In 2016, we started to see an improvement in MAA in terms of operational efficiency and better merchandising, hence the margin improvement in the division. We expect further margin improvement this year of at least 50bp to 6.9% EBIT margin.
Consensus also does not seem to have factored in the impact of the MBA IPO and possible MAA IPO, which we expect to occur in late-2018F. Although we expect earnings dilution for MAPI starting in FY18F, we expect a significant improvement in MAPI’s balance sheet as we expect it to reach a net cash position in FY19F. Hence, we think its interest burden will decline by 15%/33% in FY17F/18F. All in all, we are confident that all the improvements (financially and operationally) will lead to a strong net profit boost of 77%/46% in FY17F/18F.
Title:
Source:
Please fill in the values above to have them entered in your report
-20.0%
0.0%
20.0%
40.0%
60.0%
80.0%
100.0%
120.0%
(1,000)
(500)
-
500
1,000
1,500
2,000
2,500
3,000
3,500
2012 2013 2014 2015 2016 2017F 2018F 2019F
Net debt (Rp bn) Net gearing (%)
Title:
Source:
Please fill in the values above to have them entered in your report
0.0%
1.0%
2.0%
3.0%
4.0%
5.0%
6.0%
7.0%
-
100.0
200.0
300.0
400.0
500.0
600.0
700.0
800.0
900.0
2012 2013 2014 2015 2016 2017F 2018F 2019F
Core net profit (Rp bn) Core net profit margin (%)
Retail│Indonesia│Mitra Adi Perkasa│June 19, 2017
12
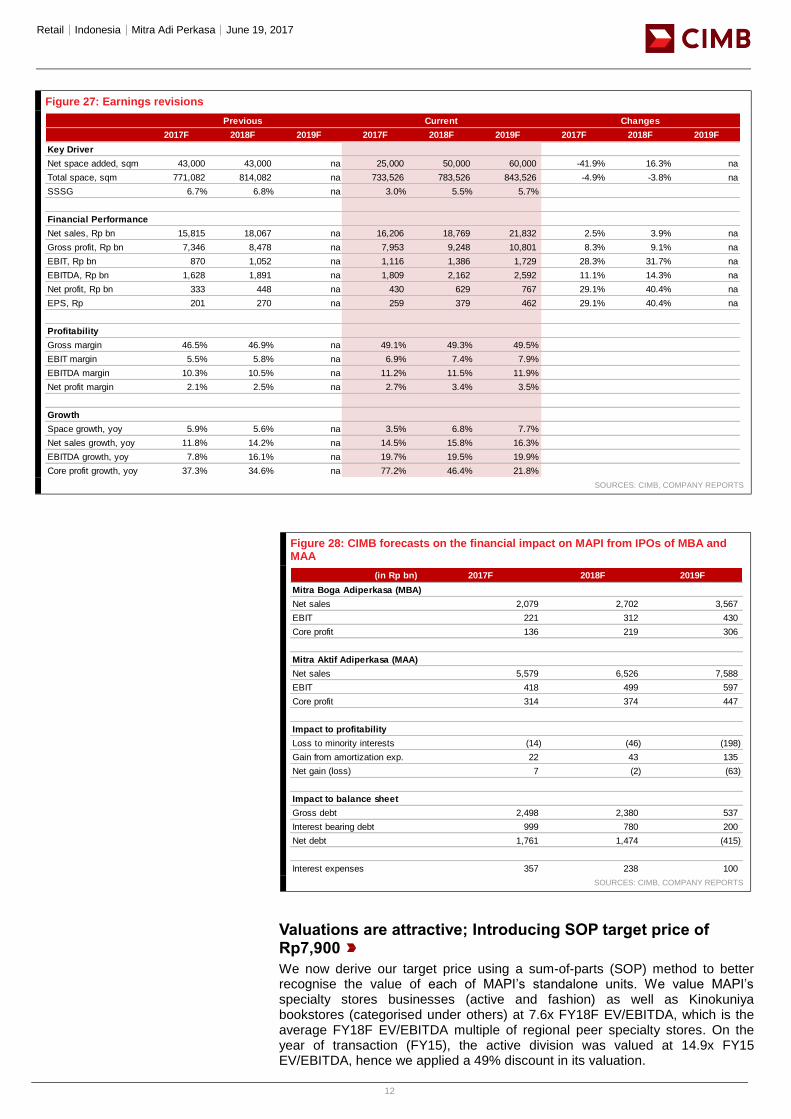
Figure 27: Earnings revisions
SOURCES: CIMB, COMPANY REPORTS
Figure 28: CIMB forecasts on the financial impact on MAPI from IPOs of MBA and MAA
SOURCES: CIMB, COMPANY REPORTS
Valuations are attractive; Introducing SOP target price of Rp7,900
We now derive our target price using a sum-of-parts (SOP) method to better recognise the value of each of MAPI’s standalone units. We value MAPI’s specialty stores businesses (active and fashion) as well as Kinokuniya bookstores (categorised under others) at 7.6x FY18F EV/EBITDA, which is the average FY18F EV/EBITDA multiple of regional peer specialty stores. On the year of transaction (FY15), the active division was valued at 14.9x FY15 EV/EBITDA, hence we applied a 49% discount in its valuation.
2017F 2018F 2019F 2017F 2018F 2019F 2017F 2018F 2019F
Key Driver
Net space added, sqm 43,000 43,000 na 25,000 50,000 60,000 -41.9% 16.3% na
Total space, sqm 771,082 814,082 na 733,526 783,526 843,526 -4.9% -3.8% na
SSSG 6.7% 6.8% na 3.0% 5.5% 5.7%
Financial Performance
Net sales, Rp bn 15,815 18,067 na 16,206 18,769 21,832 2.5% 3.9% na
Gross profit, Rp bn 7,346 8,478 na 7,953 9,248 10,801 8.3% 9.1% na
EBIT, Rp bn 870 1,052 na 1,116 1,386 1,729 28.3% 31.7% na
EBITDA, Rp bn 1,628 1,891 na 1,809 2,162 2,592 11.1% 14.3% na
Net profit, Rp bn 333 448 na 430 629 767 29.1% 40.4% na
EPS, Rp 201 270 na 259 379 462 29.1% 40.4% na
Profitability
Gross margin 46.5% 46.9% na 49.1% 49.3% 49.5%
EBIT margin 5.5% 5.8% na 6.9% 7.4% 7.9%
EBITDA margin 10.3% 10.5% na 11.2% 11.5% 11.9%
Net profit margin 2.1% 2.5% na 2.7% 3.4% 3.5%
Growth
Space growth, yoy 5.9% 5.6% na 3.5% 6.8% 7.7%
Net sales growth, yoy 11.8% 14.2% na 14.5% 15.8% 16.3%
EBITDA growth, yoy 7.8% 16.1% na 19.7% 19.5% 19.9%
Core profit growth, yoy 37.3% 34.6% na 77.2% 46.4% 21.8%
Previous Current Changes
(in Rp bn) 2017F 2018F 2019F
Mitra Boga Adiperkasa (MBA)
Net sales 2,079 2,702 3,567
EBIT 221 312 430
Core profit 136 219 306
Mitra Aktif Adiperkasa (MAA)
Net sales 5,579 6,526 7,588
EBIT 418 499 597
Core profit 314 374 447
Impact to profitability
Loss to minority interests (14) (46) (198)
Gain from amortization exp. 22 43 135
Net gain (loss) 7 (2) (63)
Impact to balance sheet
Gross debt 2,498 2,380 537
Interest bearing debt 999 780 200
Net debt 1,761 1,474 (415)
Interest expenses 357 238 100
Retail│Indonesia│Mitra Adi Perkasa│June 19, 2017
13
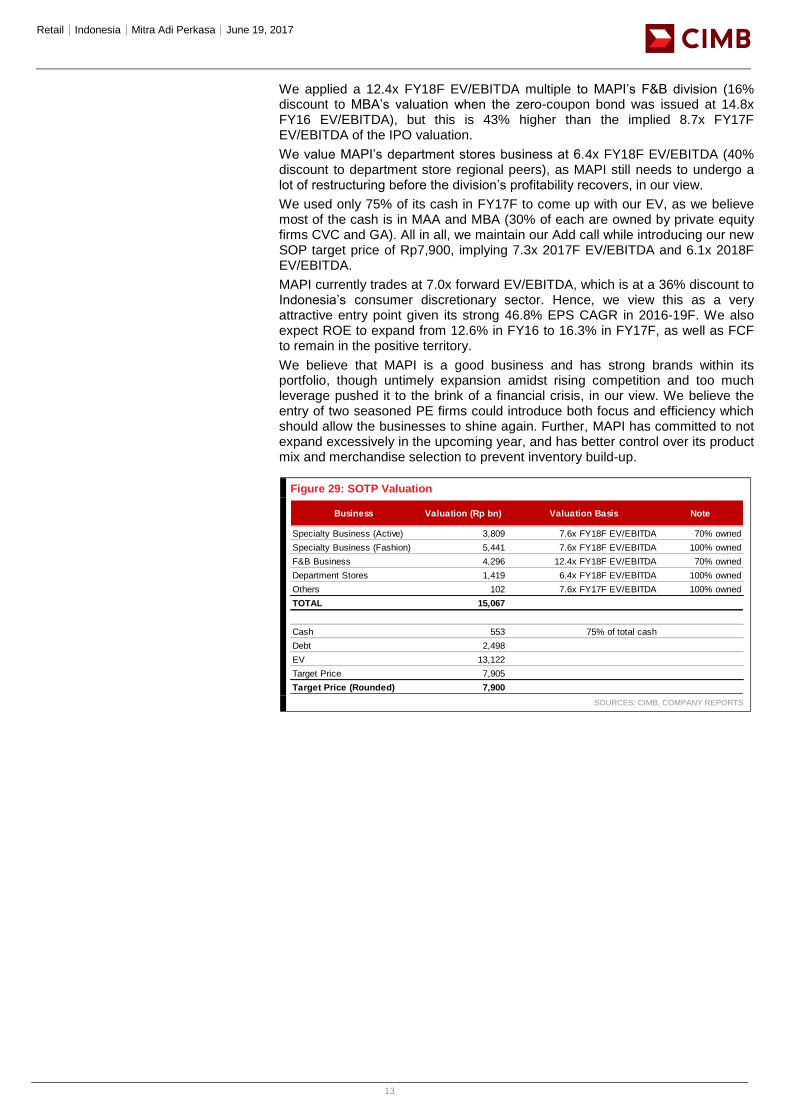
We applied a 12.4x FY18F EV/EBITDA multiple to MAPI’s F&B division (16% discount to MBA’s valuation when the zero-coupon bond was issued at 14.8x FY16 EV/EBITDA), but this is 43% higher than the implied 8.7x FY17F EV/EBITDA of the IPO valuation.
We value MAPI’s department stores business at 6.4x FY18F EV/EBITDA (40% discount to department store regional peers), as MAPI still needs to undergo a lot of restructuring before the division’s profitability recovers, in our view.
We used only 75% of its cash in FY17F to come up with our EV, as we believe most of the cash is in MAA and MBA (30% of each are owned by private equity firms CVC and GA). All in all, we maintain our Add call while introducing our new SOP target price of Rp7,900, implying 7.3x 2017F EV/EBITDA and 6.1x 2018F EV/EBITDA.
MAPI currently trades at 7.0x forward EV/EBITDA, which is at a 36% discount to Indonesia’s consumer discretionary sector. Hence, we view this as a very attractive entry point given its strong 46.8% EPS CAGR in 2016-19F. We also expect ROE to expand from 12.6% in FY16 to 16.3% in FY17F, as well as FCF to remain in the positive territory.
We believe that MAPI is a good business and has strong brands within its portfolio, though untimely expansion amidst rising competition and too much leverage pushed it to the brink of a financial crisis, in our view. We believe the entry of two seasoned PE firms could introduce both focus and efficiency which should allow the businesses to shine again. Further, MAPI has committed to not expand excessively in the upcoming year, and has better control over its product mix and merchandise selection to prevent inventory build-up.
Figure 29: SOTP Valuation
SOURCES: CIMB, COMPANY REPORTS
Business Valuation (Rp bn) Valuation Basis Note
Specialty Business (Active) 3,809 7.6x FY18F EV/EBITDA 70% owned
Specialty Business (Fashion) 5,441 7.6x FY18F EV/EBITDA 100% owned
F&B Business 4,296 12.4x FY18F EV/EBITDA 70% owned
Department Stores 1,419 6.4x FY18F EV/EBITDA 100% owned
Others 102 7.6x FY17F EV/EBITDA 100% owned
TOTAL 15,067
Cash 553 75% of total cash
Debt 2,498
EV 13,122
Target Price 7,905
Target Price (Rounded) 7,900
Retail│Indonesia│Mitra Adi Perkasa│June 19, 2017
14
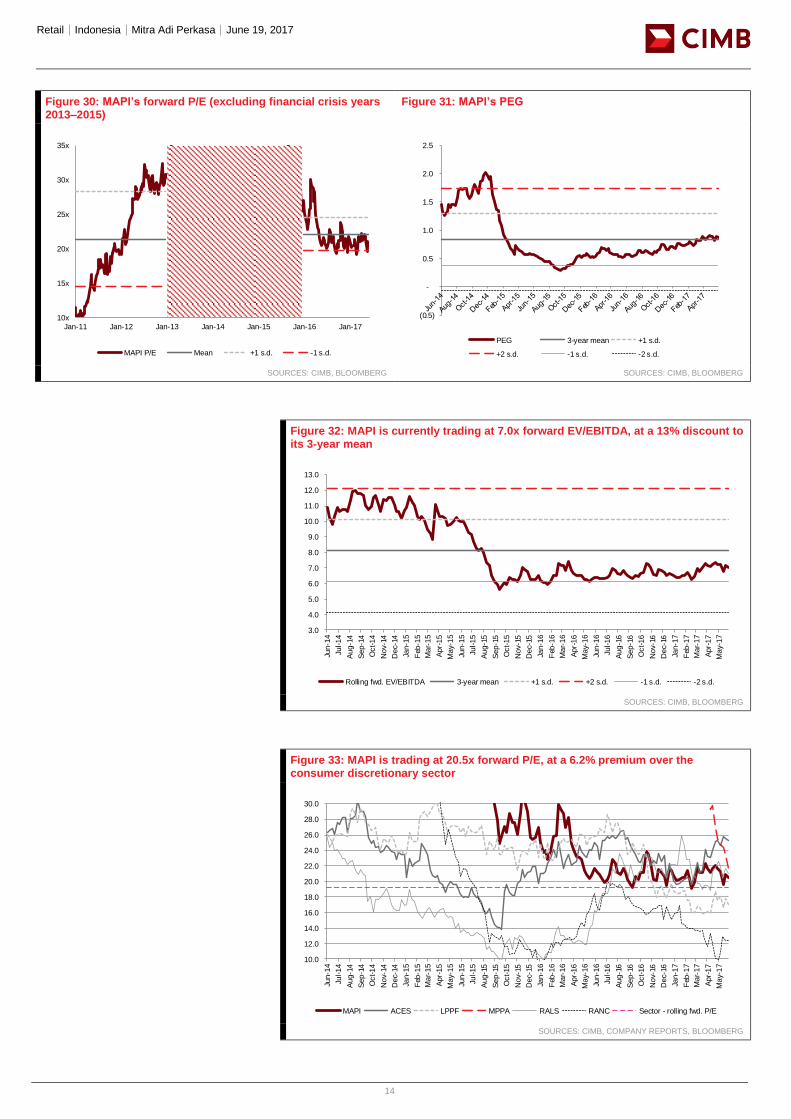
Figure 30: MAPI’s forward P/E (excluding financial crisis years 2013–2015)
Figure 31: MAPI’s PEG
SOURCES: CIMB, BLOOMBERG SOURCES: CIMB, BLOOMBERG
Figure 32: MAPI is currently trading at 7.0x forward EV/EBITDA, at a 13% discount to its 3-year mean
SOURCES: CIMB, BLOOMBERG
Figure 33: MAPI is trading at 20.5x forward P/E, at a 6.2% premium over the consumer discretionary sector
SOURCES: CIMB, COMPANY REPORTS, BLOOMBERG
Title:
Source:
Please fill in the values above to have them entered in your report
10x
15x
20x
25x
30x
35x
Jan-11 Jan-12 Jan-13 Jan-14 Jan-15 Jan-16 Jan-17
MAPI P/E Mean +1 s.d. -1 s.d.
Title:
Source:
Please fill in the values above to have them entered in your report
(0.5)
-
0.5
1.0
1.5
2.0
2.5
PEG 3-year mean +1 s.d.
+2 s.d. -1 s.d. -2 s.d.
Title:
Source:
Please fill in the values above to have them entered in your report
3.0
4.0
5.0
6.0
7.0
8.0
9.0
10.0
11.0
12.0
13.0
Jun-1
4
Jul-14
Aug-1
4
Sep-1
4
Oct-14
Nov-
14
Dec-
14
Jan-1
5
Feb
-15
Mar-
15
Apr-
15
May-
15
Jun-1
5
Jul-15
Aug-1
5
Sep-1
5
Oct-15
Nov-
15
Dec-
15
Jan-1
6
Feb
-16
Mar-
16
Apr-
16
May-
16
Jun-1
6
Jul-16
Aug-1
6
Sep-1
6
Oct-16
Nov-
16
Dec-
16
Jan-1
7
Feb
-17
Mar-
17
Apr-
17
May-
17
Rolling fwd. EV/EBITDA 3-year mean +1 s.d. +2 s.d. -1 s.d. -2 s.d.
Title:
Source:
Please fill in the values above to have them entered in your report
10.0
12.0
14.0
16.0
18.0
20.0
22.0
24.0
26.0
28.0
30.0
Jun-1
4
Jul-14
Aug-1
4
Sep-1
4
Oct-14
Nov-
14
Dec-
14
Jan-1
5
Feb
-15
Mar-
15
Apr-
15
May-
15
Jun-1
5
Jul-15
Aug-1
5
Sep-1
5
Oct-15
Nov-
15
Dec-
15
Jan-1
6
Feb
-16
Mar-
16
Apr-
16
May-
16
Jun-1
6
Jul-16
Aug-1
6
Sep-1
6
Oct-16
Nov-
16
Dec-
16
Jan-1
7
Feb
-17
Mar-
17
Apr-
17
May-
17
MAPI ACES LPPF MPPA RALS RANC Sector - rolling fwd. P/E
Retail│Indonesia│Mitra Adi Perkasa│June 19, 2017
15
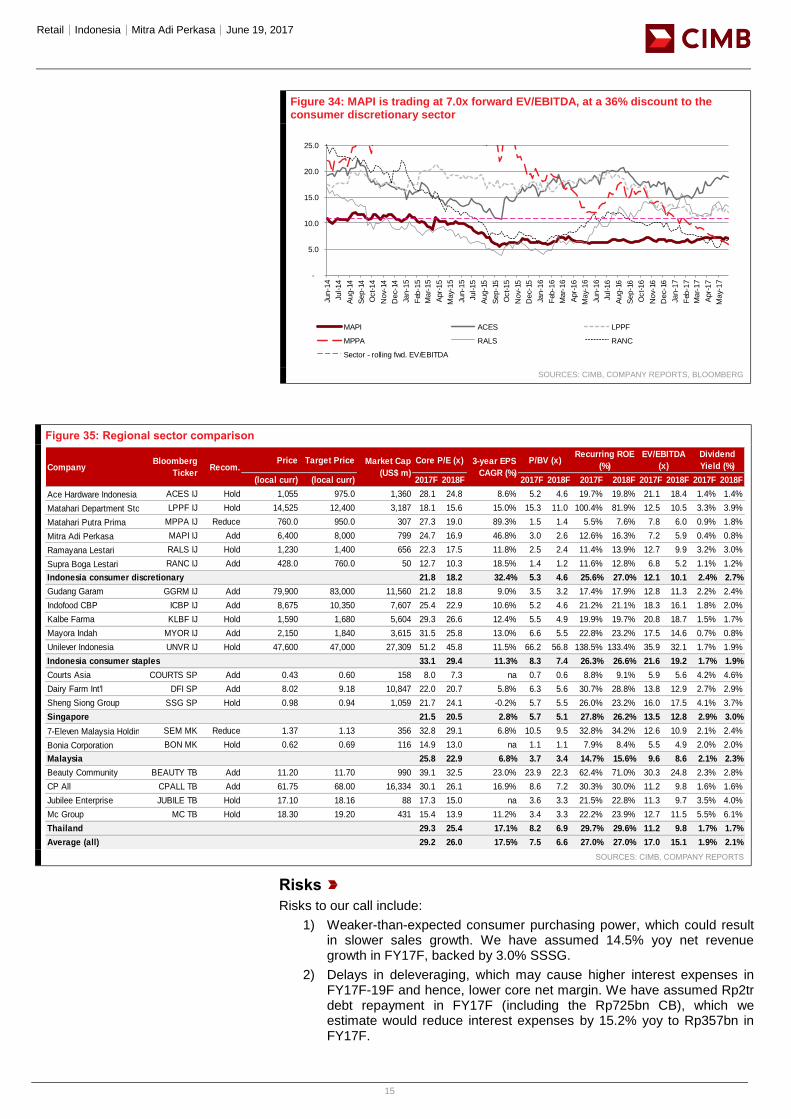
Figure 34: MAPI is trading at 7.0x forward EV/EBITDA, at a 36% discount to the consumer discretionary sector
SOURCES: CIMB, COMPANY REPORTS, BLOOMBERG
Figure 35: Regional sector comparison
SOURCES: CIMB, COMPANY REPORTS
Risks
Risks to our call include:
1) Weaker-than-expected consumer purchasing power, which could result in slower sales growth. We have assumed 14.5% yoy net revenue growth in FY17F, backed by 3.0% SSSG.
2) Delays in deleveraging, which may cause higher interest expenses in FY17F-19F and hence, lower core net margin. We have assumed Rp2tr debt repayment in FY17F (including the Rp725bn CB), which we estimate would reduce interest expenses by 15.2% yoy to Rp357bn in FY17F.
Title:
Source:
Please fill in the values above to have them entered in your report
-
5.0
10.0
15.0
20.0
25.0
Jun-1
4
Jul-14
Aug-1
4
Sep-1
4
Oct-14
Nov-
14
Dec-
14
Jan-1
5
Feb
-15
Mar-
15
Apr-
15
May-
15
Jun-1
5
Jul-15
Aug-1
5
Sep-1
5
Oct-15
Nov-
15
Dec-
15
Jan-1
6
Feb
-16
Mar-
16
Apr-
16
May-
16
Jun-1
6
Jul-16
Aug-1
6
Sep-1
6
Oct-16
Nov-
16
Dec-
16
Jan-1
7
Feb
-17
Mar-
17
Apr-
17
May-
17
MAPI ACES LPPF
MPPA RALS RANC
Sector - rolling fwd. EV/EBITDA
Price Target Price
(local curr) (local curr) 2017F 2018F 2017F 2018F 2017F 2018F 2017F 2018F 2017F 2018F
Ace Hardware Indonesia ACES IJ Hold 1,055 975.0 1,360 28.1 24.8 8.6% 5.2 4.6 19.7% 19.8% 21.1 18.4 1.4% 1.4%
Matahari Department Store LPPF IJ Hold 14,525 12,400 3,187 18.1 15.6 15.0% 15.3 11.0 100.4% 81.9% 12.5 10.5 3.3% 3.9%
Matahari Putra Prima MPPA IJ Reduce 760.0 950.0 307 27.3 19.0 89.3% 1.5 1.4 5.5% 7.6% 7.8 6.0 0.9% 1.8%
Mitra Adi Perkasa MAPI IJ Add 6,400 8,000 799 24.7 16.9 46.8% 3.0 2.6 12.6% 16.3% 7.2 5.9 0.4% 0.8%
Ramayana Lestari RALS IJ Hold 1,230 1,400 656 22.3 17.5 11.8% 2.5 2.4 11.4% 13.9% 12.7 9.9 3.2% 3.0%
Supra Boga Lestari RANC IJ Add 428.0 760.0 50 12.7 10.3 18.5% 1.4 1.2 11.6% 12.8% 6.8 5.2 1.1% 1.2%
Indonesia consumer discretionary 21.8 18.2 32.4% 5.3 4.6 25.6% 27.0% 12.1 10.1 2.4% 2.7%
Gudang Garam GGRM IJ Add 79,900 83,000 11,560 21.2 18.8 9.0% 3.5 3.2 17.4% 17.9% 12.8 11.3 2.2% 2.4%
Indofood CBP ICBP IJ Add 8,675 10,350 7,607 25.4 22.9 10.6% 5.2 4.6 21.2% 21.1% 18.3 16.1 1.8% 2.0%
Kalbe Farma KLBF IJ Hold 1,590 1,680 5,604 29.3 26.6 12.4% 5.5 4.9 19.9% 19.7% 20.8 18.7 1.5% 1.7%
Mayora Indah MYOR IJ Add 2,150 1,840 3,615 31.5 25.8 13.0% 6.6 5.5 22.8% 23.2% 17.5 14.6 0.7% 0.8%
Unilever Indonesia UNVR IJ Hold 47,600 47,000 27,309 51.2 45.8 11.5% 66.2 56.8 138.5% 133.4% 35.9 32.1 1.7% 1.9%
Indonesia consumer staples 33.1 29.4 11.3% 8.3 7.4 26.3% 26.6% 21.6 19.2 1.7% 1.9%
Courts Asia COURTS SP Add 0.43 0.60 158 8.0 7.3 na 0.7 0.6 8.8% 9.1% 5.9 5.6 4.2% 4.6%
Dairy Farm Int'l DFI SP Add 8.02 9.18 10,847 22.0 20.7 5.8% 6.3 5.6 30.7% 28.8% 13.8 12.9 2.7% 2.9%
Sheng Siong Group SSG SP Hold 0.98 0.94 1,059 21.7 24.1 -0.2% 5.7 5.5 26.0% 23.2% 16.0 17.5 4.1% 3.7%
Singapore 21.5 20.5 2.8% 5.7 5.1 27.8% 26.2% 13.5 12.8 2.9% 3.0%
7-Eleven Malaysia Holdings BerhadSEM MK Reduce 1.37 1.13 356 32.8 29.1 6.8% 10.5 9.5 32.8% 34.2% 12.6 10.9 2.1% 2.4%
Bonia Corporation BON MK Hold 0.62 0.69 116 14.9 13.0 na 1.1 1.1 7.9% 8.4% 5.5 4.9 2.0% 2.0%
Malaysia 25.8 22.9 6.8% 3.7 3.4 14.7% 15.6% 9.6 8.6 2.1% 2.3%
Beauty Community BEAUTY TB Add 11.20 11.70 990 39.1 32.5 23.0% 23.9 22.3 62.4% 71.0% 30.3 24.8 2.3% 2.8%
CP All CPALL TB Add 61.75 68.00 16,334 30.1 26.1 16.9% 8.6 7.2 30.3% 30.0% 11.2 9.8 1.6% 1.6%
Jubilee Enterprise JUBILE TB Hold 17.10 18.16 88 17.3 15.0 na 3.6 3.3 21.5% 22.8% 11.3 9.7 3.5% 4.0%
Mc Group MC TB Hold 18.30 19.20 431 15.4 13.9 11.2% 3.4 3.3 22.2% 23.9% 12.7 11.5 5.5% 6.1%
Thailand 29.3 25.4 17.1% 8.2 6.9 29.7% 29.6% 11.2 9.8 1.7% 1.7%
Average (all) 29.2 26.0 17.5% 7.5 6.6 27.0% 27.0% 17.0 15.1 1.9% 2.1%
3-year EPS
CAGR (%)
P/BV (x)Recurring ROE
(%)
EV/EBITDA
(x)
Dividend
Yield (%)CompanyBloomberg
TickerRecom.
Market Cap
(US$ m)
Core P/E (x)
Retail│Indonesia│Mitra Adi Perkasa│June 19, 2017
16
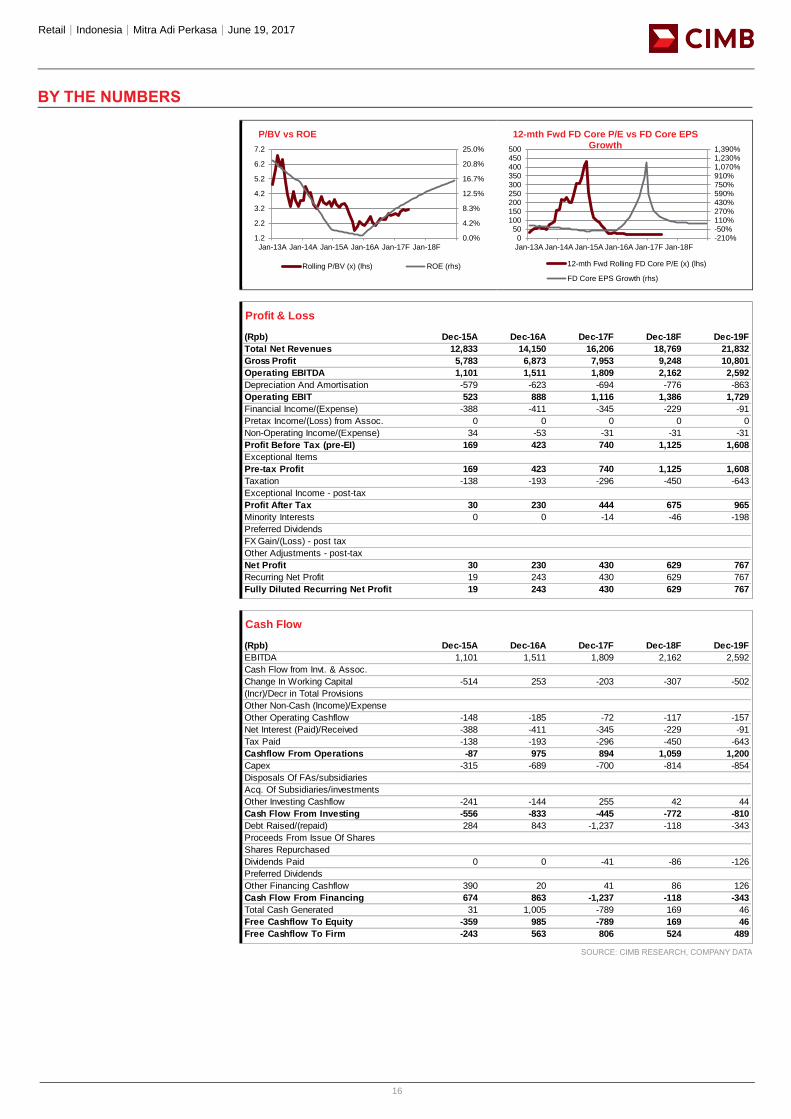
BY THE NUMBERS
SOURCE: CIMB RESEARCH, COMPANY DATA
0.0%
4.2%
8.3%
12.5%
16.7%
20.8%
25.0%
1.2
2.2
3.2
4.2
5.2
6.2
7.2
Jan-13A Jan-14A Jan-15A Jan-16A Jan-17F Jan-18F
P/BV vs ROE
Rolling P/BV (x) (lhs) ROE (rhs)
-210%-50%110%270%430%590%750%910%1,070%1,230%1,390%
050
100150200250300350400450500
Jan-13A Jan-14A Jan-15A Jan-16A Jan-17F Jan-18F
12-mth Fwd FD Core P/E vs FD Core EPS Growth
12-mth Fwd Rolling FD Core P/E (x) (lhs)
FD Core EPS Growth (rhs)
Profit & Loss
(Rpb) Dec-15A Dec-16A Dec-17F Dec-18F Dec-19F
Total Net Revenues 12,833 14,150 16,206 18,769 21,832
Gross Profit 5,783 6,873 7,953 9,248 10,801
Operating EBITDA 1,101 1,511 1,809 2,162 2,592
Depreciation And Amortisation -579 -623 -694 -776 -863
Operating EBIT 523 888 1,116 1,386 1,729
Financial Income/(Expense) -388 -411 -345 -229 -91
Pretax Income/(Loss) from Assoc. 0 0 0 0 0
Non-Operating Income/(Expense) 34 -53 -31 -31 -31
Profit Before Tax (pre-EI) 169 423 740 1,125 1,608
Exceptional Items
Pre-tax Profit 169 423 740 1,125 1,608
Taxation -138 -193 -296 -450 -643
Exceptional Income - post-tax
Profit After Tax 30 230 444 675 965
Minority Interests 0 0 -14 -46 -198
Preferred Dividends
FX Gain/(Loss) - post tax
Other Adjustments - post-tax
Net Profit 30 230 430 629 767
Recurring Net Profit 19 243 430 629 767
Fully Diluted Recurring Net Profit 19 243 430 629 767
Cash Flow
(Rpb) Dec-15A Dec-16A Dec-17F Dec-18F Dec-19F
EBITDA 1,101 1,511 1,809 2,162 2,592
Cash Flow from Invt. & Assoc.
Change In Working Capital -514 253 -203 -307 -502
(Incr)/Decr in Total Provisions
Other Non-Cash (Income)/Expense
Other Operating Cashflow -148 -185 -72 -117 -157
Net Interest (Paid)/Received -388 -411 -345 -229 -91
Tax Paid -138 -193 -296 -450 -643
Cashflow From Operations -87 975 894 1,059 1,200
Capex -315 -689 -700 -814 -854
Disposals Of FAs/subsidiaries
Acq. Of Subsidiaries/investments
Other Investing Cashflow -241 -144 255 42 44
Cash Flow From Investing -556 -833 -445 -772 -810
Debt Raised/(repaid) 284 843 -1,237 -118 -343
Proceeds From Issue Of Shares
Shares Repurchased
Dividends Paid 0 0 -41 -86 -126
Preferred Dividends
Other Financing Cashflow 390 20 41 86 126
Cash Flow From Financing 674 863 -1,237 -118 -343
Total Cash Generated 31 1,005 -789 169 46
Free Cashflow To Equity -359 985 -789 169 46
Free Cashflow To Firm -243 563 806 524 489
Retail│Indonesia│Mitra Adi Perkasa│June 19, 2017
17
BY THE NUMBERS… cont’d
SOURCE: CIMB RESEARCH, COMPANY DATA
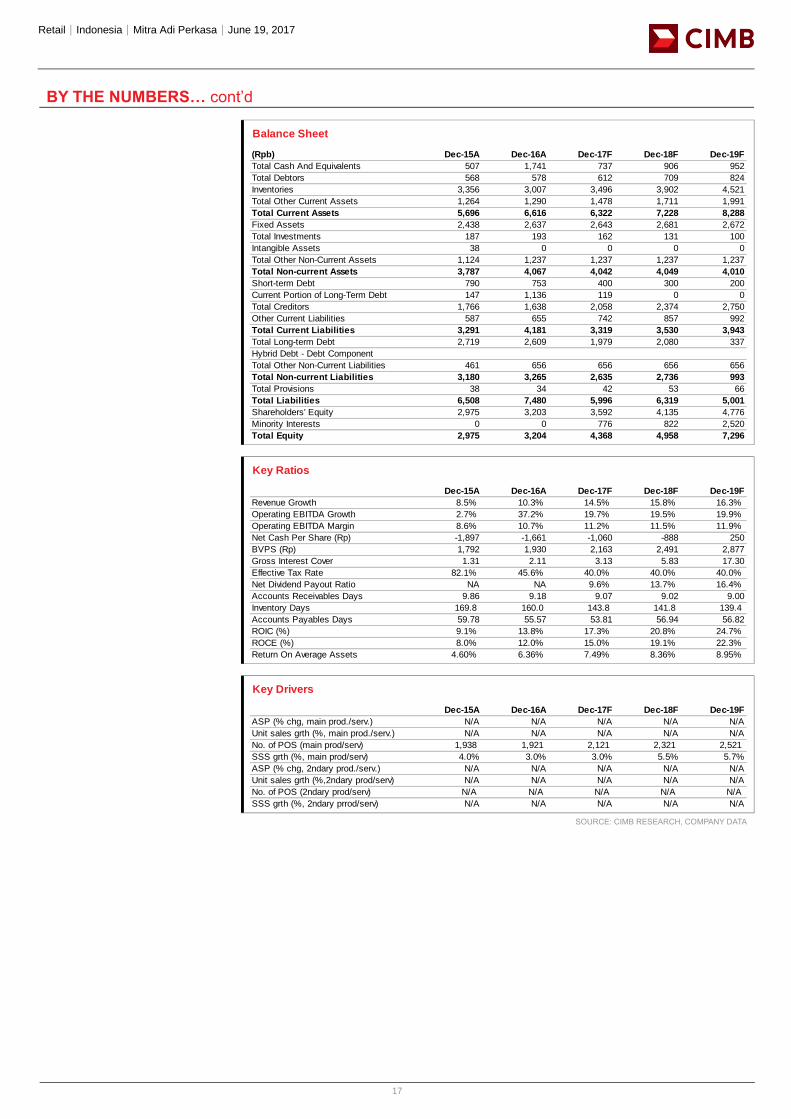
Balance Sheet
(Rpb) Dec-15A Dec-16A Dec-17F Dec-18F Dec-19F
Total Cash And Equivalents 507 1,741 737 906 952
Total Debtors 568 578 612 709 824
Inventories 3,356 3,007 3,496 3,902 4,521
Total Other Current Assets 1,264 1,290 1,478 1,711 1,991
Total Current Assets 5,696 6,616 6,322 7,228 8,288
Fixed Assets 2,438 2,637 2,643 2,681 2,672
Total Investments 187 193 162 131 100
Intangible Assets 38 0 0 0 0
Total Other Non-Current Assets 1,124 1,237 1,237 1,237 1,237
Total Non-current Assets 3,787 4,067 4,042 4,049 4,010
Short-term Debt 790 753 400 300 200
Current Portion of Long-Term Debt 147 1,136 119 0 0
Total Creditors 1,766 1,638 2,058 2,374 2,750
Other Current Liabilities 587 655 742 857 992
Total Current Liabilities 3,291 4,181 3,319 3,530 3,943
Total Long-term Debt 2,719 2,609 1,979 2,080 337
Hybrid Debt - Debt Component
Total Other Non-Current Liabilities 461 656 656 656 656
Total Non-current Liabilities 3,180 3,265 2,635 2,736 993
Total Provisions 38 34 42 53 66
Total Liabilities 6,508 7,480 5,996 6,319 5,001
Shareholders' Equity 2,975 3,203 3,592 4,135 4,776
Minority Interests 0 0 776 822 2,520
Total Equity 2,975 3,204 4,368 4,958 7,296
Key Ratios
Dec-15A Dec-16A Dec-17F Dec-18F Dec-19F
Revenue Growth 8.5% 10.3% 14.5% 15.8% 16.3%
Operating EBITDA Growth 2.7% 37.2% 19.7% 19.5% 19.9%
Operating EBITDA Margin 8.6% 10.7% 11.2% 11.5% 11.9%
Net Cash Per Share (Rp) -1,897 -1,661 -1,060 -888 250
BVPS (Rp) 1,792 1,930 2,163 2,491 2,877
Gross Interest Cover 1.31 2.11 3.13 5.83 17.30
Effective Tax Rate 82.1% 45.6% 40.0% 40.0% 40.0%
Net Dividend Payout Ratio NA NA 9.6% 13.7% 16.4%
Accounts Receivables Days 9.86 9.18 9.07 9.02 9.00
Inventory Days 169.8 160.0 143.8 141.8 139.4
Accounts Payables Days 59.78 55.57 53.81 56.94 56.82
ROIC (%) 9.1% 13.8% 17.3% 20.8% 24.7%
ROCE (%) 8.0% 12.0% 15.0% 19.1% 22.3%
Return On Average Assets 4.60% 6.36% 7.49% 8.36% 8.95%
Key Drivers
Dec-15A Dec-16A Dec-17F Dec-18F Dec-19F
ASP (% chg, main prod./serv.) N/A N/A N/A N/A N/A
Unit sales grth (%, main prod./serv.) N/A N/A N/A N/A N/A
No. of POS (main prod/serv) 1,938 1,921 2,121 2,321 2,521
SSS grth (%, main prod/serv) 4.0% 3.0% 3.0% 5.5% 5.7%
ASP (% chg, 2ndary prod./serv.) N/A N/A N/A N/A N/A
Unit sales grth (%,2ndary prod/serv) N/A N/A N/A N/A N/A
No. of POS (2ndary prod/serv) N/A N/A N/A N/A N/A
SSS grth (%, 2ndary prrod/serv) N/A N/A N/A N/A N/A
Retail│Indonesia│Mitra Adi Perkasa│June 19, 2017
18
DISCLAIMER #01
The content of this report (including the views and opinions expressed therein, and the information comprised therein) has been prepared by and belongs to CIMB and is distributed by CIMB.
This report is not directed to, or intended for distribution to or use by, any person or entity who is a citizen or resident of or located in any locality, state, country or other jurisdiction where such distribution, publication, availability or use would be contrary to law or regulation.
By accepting this report, the recipient hereof represents and warrants that he is entitled to receive such report in accordance with the restrictions set forth below and agrees to be bound by the limitations contained herein (including the “Restrictions on Distributions” set out below). Any failure to comply with these limitations may constitute a violation of law. This publication is being supplied to you strictly on the basis that it will remain confidential. No part of this report may be (i) copied, photocopied, duplicated, stored or reproduced in any form by any means or (ii) redistributed or passed on, directly or indirectly, to any other person in whole or in part, for any purpose without the prior written consent of CIMB.
The information contained in this research report is prepared from data believed to be correct and reliable at the time of issue of this report. CIMB may or may not issue regular reports on the subject matter of this report at any frequency and may cease to do so or change the periodicity of reports at any time. CIMB is under no obligation to update this report in the event of a material change to the information contained in this report. CIMB has no, and will not accept any, obligation to (i) check or ensure that the contents of this report remain current, reliable or relevant, (ii) ensure that the content of this report constitutes all the information a prospective investor may require, (iii) ensure the adequacy, accuracy, completeness, reliability or fairness of any views, opinions and information, and accordingly, CIMB, or any of their respective affiliates, or its related persons (and their respective directors, associates, connected persons and/or employees) shall not be liable in any manner whatsoever for any consequences (including but not limited to any direct, indirect or consequential losses, loss of profits and damages) of any reliance thereon or usage thereof. In particular, CIMB disclaims all responsibility and liability for the views and opinions set out in this report.
Unless otherwise specified, this report is based upon sources which CIMB considers to be reasonable. Such sources will, unless otherwise specified, for market data, be market data and prices available from the main stock exchange or market where the relevant security is listed, or, where appropriate, any other market. Information on the accounts and business of company(ies) will generally be based on published statements of the company(ies), information disseminated by regulatory information services, other publicly available information and information resulting from our research.
Whilst every effort is made to ensure that statements of facts made in this report are accurate, all estimates, projections, forecasts, expressions of opinion and other subjective judgments contained in this report are based on assumptions considered to be reasonable as of the date of the document in which they are contained and must not be construed as a representation that the matters referred to therein will occur. Past performance is not a reliable indicator of future performance. The value of investments may go down as well as up and those investing may, depending on the investments in question, lose more than the initial investment. No report shall constitute an offer or an invitation by or on behalf of CIMB or its affiliates to any person to buy or sell any investments.
CIMB, its affiliates and related companies, their directors, associates, connected parties and/or employees may own or have positions in securities of the company(ies) covered in this research report or any securities related thereto and may from time to time add to or dispose of, or may be materially interested in, any such securities. Further, CIMB, its affiliates and its related companies do and seek to do business with the company(ies) covered in this research report and may from time to time act as market maker or have assumed an underwriting commitment in securities of such company(ies), may sell them to or buy them from customers on a principal basis and may also perform or seek to perform significant investment banking, advisory, underwriting or placement services for or relating to such company(ies) as well as solicit such investment, advisory or other services from any entity mentioned in this report.
CIMB or its affiliates may enter into an agreement with the company(ies) covered in this report relating to the production of research reports. CIMB may disclose the contents of this report to the company(ies) covered by it and may have amended the contents of this report following such disclosure.
The analyst responsible for the production of this report hereby certifies that the views expressed herein accurately and exclusively reflect his or her personal views and opinions about any and all of the issuers or securities analysed in this report and were prepared independently and autonomously. No part of the compensation of the analyst(s) was, is, or will be directly or indirectly related to the inclusion of specific recommendations(s) or view(s) in this report. CIMB prohibits the analyst(s) who prepared this research report from receiving any compensation, incentive or bonus based on specific investment banking transactions or for providing a specific recommendation for, or view of, a particular company. Information barriers and other arrangements may be established where necessary to prevent conflicts of interests arising. However, the analyst(s) may receive compensation that is based on his/their coverage of company(ies) in the performance of his/their duties or the performance of his/their recommendations and the research personnel involved in the preparation of this report may also participate in the solicitation of the businesses as described above. In reviewing this research report, an investor should be aware that any or all of the foregoing, among other things, may give rise to real or potential conflicts of interest. Additional information is, subject to the duties of confidentiality, available on request.
Reports relating to a specific geographical area are produced by the corresponding CIMB entity as listed in the table below. The term “CIMB” shall denote, where appropriate, the relevant entity distributing or disseminating the report in the particular jurisdiction referenced below, or, in every other case, CIMB Group Holdings Berhad ("CIMBGH") and its affiliates, subsidiaries and related companies.
Country CIMB Entity Regulated by
Hong Kong CIMB Securities Limited Securities and Futures Commission Hong Kong
India CIMB Securities (India) Private Limited Securities and Exchange Board of India (SEBI)
Indonesia PT CIMB Securities Indonesia Financial Services Authority of Indonesia
Malaysia CIMB Investment Bank Berhad Securities Commission Malaysia
Singapore CIMB Research Pte. Ltd. Monetary Authority of Singapore
South Korea CIMB Securities Limited, Korea Branch Financial Services Commission and Financial Supervisory Service
Taiwan CIMB Securities Limited, Taiwan Branch Financial Supervisory Commission
Thailand CIMB Securities (Thailand) Co. Ltd. Securities and Exchange Commission Thailand
Retail│Indonesia│Mitra Adi Perkasa│June 19, 2017
19
(i) As of June 19, 2017 CIMB has a proprietary position in the securities (which may include but not limited to shares, warrants, call warrants and/or any other derivatives) in the following company or companies covered or recommended in this report:
(a) -
(ii) As of June 19, 2017, the analyst(s) who prepared this report, and the associate(s), has / have an interest in the securities (which may include but not limited to shares, warrants, call warrants and/or any other derivatives) in the following company or companies covered or recommended in this report:
(a) -
This report does not purport to contain all the information that a prospective investor may require. CIMB or any of its affil iates does not make any guarantee, representation or warranty, express or implied, as to the adequacy, accuracy, completeness, reliability or fairness of any such information and opinion contained in this report. Neither CIMB nor any of its affiliates nor its related persons shall be liable in any manner whatsoever for any consequences (including but not limited to any direct, indirect or consequential losses, loss of profits and damages) of any reliance thereon or usage thereof.
This report is general in nature and has been prepared for information purposes only. It is intended for circulation amongst CIMB and its affiliates’ clients generally and does not have regard to the specific investment objectives, financial situation and the particular needs of any specific person who may receive this report. The information and opinions in this report are not and should not be construed or considered as an offer, recommendation or solicitation to buy or sell the subject securities, related investments or other financial instruments or any derivative instrument, or any rights pertaining thereto.
Investors are advised to make their own independent evaluation of the information contained in this research report, consider their own individual investment objectives, financial situation and particular needs and consult their own professional and financial advisers as to the legal, business, financial, tax and other aspects before participating in any transaction in respect of the securities of company(ies) covered in this research report.
The securities of such company(ies) may not be eligible for sale in all jurisdictions or to all categories of investors.
Australia: Despite anything in this report to the contrary, this research is provided in Australia by CIMB Securities (Singapore) Pte. Ltd. and CIMB Securities Limited. This research is only available in Australia to persons who are “wholesale clients” (within the meaning of the Corporations Act 2001 (Cth) and is supplied solely for the use of such wholesale clients and shall not be distributed or passed on to any other person. You represent and warrant that if you are in Australia, you are a “wholesale client”. This research is of a general nature only and has been prepared without taking into account the objectives, financial situation or needs of the individual recipient. CIMB Securities (Singapore) Pte. Ltd. and CIMB Securities Limited do not hold, and are not required to hold an Australian financial services licence. CIMB Securities (Singapore) Pte. Ltd. and CIMB Securities Limited rely on “passporting” exemptions for entities appropriately licensed by the Monetary Authority of Singapore (under ASIC Class Order 03/1102) and the Securities and Futures Commission in Hong Kong (under ASIC Class Order 03/1103).
Canada: This research report has not been prepared in accordance with the disclosure requirements of Dealer Member Rule 3400 – Research Restrictions and Disclosure Requirements of the Investment Industry Regulatory Organization of Canada. For any research report distributed by CIBC, further disclosures related to CIBC conflicts of interest can be found at https://researchcentral.cibcwm.com .
China: For the purpose of this report, the People’s Republic of China (“PRC”) does not include the Hong Kong Special Administrative Region, the Macau Special Administrative Region or Taiwan. The distributor of this report has not been approved or licensed by the China Securities Regulatory Commission or any other relevant regulatory authority or governmental agency in the PRC. This report contains only marketing information. The distribution of this report is not an offer to buy or sell to any person within or outside PRC or a solicitation to any person within or outside of PRC to buy or sell any instruments described herein. This report is being issued outside the PRC to a limited number of institutional investors and may not be provided to any person other than the original recipient and may not be reproduced or used for any other purpose.
France: Only qualified investors within the meaning of French law shall have access to this report. This report shall not be considered as an offer to subscribe to, or used in connection with, any offer for subscription or sale or marketing or direct or indirect distribution of financial instruments and it is not intended as a solicitation for the purchase of any financial instrument.
Germany: This report is only directed at persons who are professional investors as defined in sec 31a(2) of the German Securities Trading Act (WpHG). This publication constitutes research of a non-binding nature on the market situation and the investment instruments cited here at the time of the publication of the information.
The current prices/yields in this issue are based upon closing prices from Bloomberg as of the day preceding publication. Please note that neither the German Federal Financial Supervisory Agency (BaFin), nor any other supervisory authority exercises any control over the content of this report.
Hong Kong: This report is issued and distributed in Hong Kong by CIMB Securities Limited (“CHK”) which is licensed in Hong Kong by the Securities and Futures Commission for Type 1 (dealing in securities), Type 4 (advising on securities) and Type 6 (advising on corporate finance) activities. Any investors wishing to purchase or otherwise deal in the securities covered in this report should contact the Head of Sales at CIMB Securities Limited. The views and opinions in this research report are our own as of the date hereof and are subject to change. If the Financial Services and Markets Act of the United Kingdom or the rules of the Financial Conduct Authority apply to a recipient, our obligations owed to such recipient therein are unaffected. CHK has no obligation to update its opinion or the information in this research report.
This publication is strictly confidential and is for private circulation only to clients of CHK.
CIMB Securities Limited does not make a market on other securities mentioned in the report.
India: This report is issued and distributed in India by CIMB Securities (India) Private Limited (“CIMB India”) which is registered with the National Stock Exchange of India Limited and BSE Limited as a trading and clearing member under the Securities and Exchange Board of India (Stock Brokers and Sub-Brokers) Regulations, 1992. In accordance with the provisions of Regulation 4(g) of the Securities and Exchange Board of India (Investment Advisers) Regulations, 2013, CIMB India is not required to seek registration with the Securities and Exchange Board of India (“SEBI”) as an Investment Adviser. CIMB India is registered with SEBI as a Research Analyst pursuant to the SEBI (Research Analysts) Regulations, 2014 ("Regulations").
This report does not take into account the particular investment objectives, financial situations, or needs of the recipients. It is not intended for
Retail│Indonesia│Mitra Adi Perkasa│June 19, 2017
20
and does not deal with prohibitions on investment due to law/jurisdiction issues etc. which may exist for certain persons/entities. Recipients should rely on their own investigations and take their own professional advice before investment.
The report is not a “prospectus” as defined under Indian Law, including the Companies Act, 2013, and is not, and shall not be, approved by, or filed or registered with, any Indian regulator, including any Registrar of Companies in India, SEBI, any Indian stock exchange, or the Reserve Bank of India. No offer, or invitation to offer, or solicitation of subscription with respect to any such securities listed or proposed to be listed in India is being made, or intended to be made, to the public, or to any member or section of the public in India, through or pursuant to this report.
The research analysts, strategists or economists principally responsible for the preparation of this research report are segregated from the other activities of CIMB India and they have received compensation based upon various factors, including quality, accuracy and value of research, firm profitability or revenues, client feedback and competitive factors. Research analysts', strategists' or economists' compensation is not linked to investment banking or capital markets transactions performed or proposed to be performed by CIMB India or its affiliates.
CIMB Securities (India) Pte Ltd has not received any investment banking related compensation from the companies mentioned in the report in the past 12 months.
CIMB Securities (India) Pte Ltd has not received any compensation from the companies mentioned in the report in the past 12 months.
Indonesia: This report is issued and distributed by PT CIMB Securities Indonesia (“CIMBI”). The views and opinions in this research report are our own as of the date hereof and are subject to change. If the Financial Services and Markets Act of the United Kingdom or the rules of the Financial Conduct Authority apply to a recipient, our obligations owed to such recipient therein are unaffected. CIMBI has no obligation to update its opinion or the information in this research report. Neither this report nor any copy hereof may be distributed in Indonesia or to any Indonesian citizens wherever they are domiciled or to Indonesian residents except in compliance with applicable Indonesian capital market laws and regulations.
This research report is not an offer of securities in Indonesia. The securities referred to in this research report have not been registered with the Financial Services Authority (Otoritas Jasa Keuangan) pursuant to relevant capital market laws and regulations, and may not be offered or sold within the territory of the Republic of Indonesia or to Indonesian citizens through a public offering or in circumstances which constitute an offer within the meaning of the Indonesian capital market law and regulations.
Ireland: CIMB is not an investment firm authorised in the Republic of Ireland and no part of this document should be construed as CIMB acting as, or otherwise claiming or representing to be, an investment firm authorised in the Republic of Ireland.
Malaysia: This report is issued and distributed by CIMB Investment Bank Berhad (“CIMB”) solely for the benefit of and for the exclusive use of our clients. If the Financial Services and Markets Act of the United Kingdom or the rules of the Financial Conduct Authority apply to a recipient, our obligations owed to such recipient therein are unaffected. CIMB has no obligation to update, revise or reaffirm its opinion or the information in this research reports after the date of this report.
New Zealand: In New Zealand, this report is for distribution only to persons who are wholesale clients pursuant to section 5C of the Financial Advisers Act 2008.
Singapore: This report is issued and distributed by CIMB Research Pte Ltd (“CIMBR”). CIMBR is a financial adviser licensed under the Financial Advisers Act, Cap 110 (“FAA”) for advising on investment products, by issuing or promulgating research analyses or research reports, whether in electronic, print or other form. Accordingly CIMBR is a subject to the applicable rules under the FAA unless it is able to avail itself to any prescribed exemptions.
Recipients of this report are to contact CIMB Research Pte Ltd, 50 Raffles Place, #19-00 Singapore Land Tower, Singapore in respect of any matters arising from, or in connection with this report. CIMBR has no obligation to update its opinion or the information in this research report. This publication is strictly confidential and is for private circulation only. If you have not been sent this report by CIMBR directly, you may not rely, use or disclose to anyone else this report or its contents.
If the recipient of this research report is not an accredited investor, expert investor or institutional investor, CIMBR accepts legal responsibility for the contents of the report without any disclaimer limiting or otherwise curtailing such legal responsibility. If the recipient is an accredited investor, expert investor or institutional investor, the recipient is deemed to acknowledge that CIMBR is exempt from certain requirements under the FAA and its attendant regulations, and as such, is exempt from complying with the following : (a) Section 25 of the FAA (obligation to disclose product information); (b) Section 27 (duty not to make recommendation with respect to any investment product without having a reasonable basis where you may be reasonably expected to rely on the recommendation) of the FAA; (c) MAS Notice on Information to Clients and Product Information Disclosure [Notice No. FAA-N03]; (d) MAS Notice on Recommendation on Investment Products [Notice No. FAA-N16]; (e) Section 36 (obligation on disclosure of interest in securities), and (f) any other laws, regulations, notices, directive, guidelines, circulars and practice notes which are relates to the above, to the extent permitted by applicable laws, as may be amended from time to time, and any other laws, regulations, notices, directive, guidelines, circulars, and practice notes as we may notify you from time to time. In addition, the recipient who is an accredited investor, expert investor or institutional investor acknowledges that a CIMBR is exempt from Section 27 of the FAA, the recipient will also not be able to file a civil claim against CIMBR for any loss or damage arising from the recipient’s reliance on any recommendation made by CIMBR which would otherwise be a right that is available to the recipient under Section 27 of the FAA, the recipient will also not be able to file a civil claim against CIMBR for any loss or damage arising from the recipient’s reliance on any recommendation made by CIMBR which would otherwise be a right that is available to the recipient under Section 27 of the FAA.
CIMB Research Pte Ltd ("CIMBR"), its affiliates and related companies, their directors, associates, connected parties and/or employees may own or have positions in securities of the company(ies) covered in this research report or any securities related thereto and may from time to time add to or dispose of, or may be materially interested in, any such securities. Further, CIMBR, its affiliates and its related companies do and seek to do business with the company(ies) covered in this research report and may from time to time act as market maker or have assumed an underwriting commitment in securities of such company(ies), may sell them to or buy them from customers on a principal basis and may also perform or seek to perform significant investment banking, advisory, underwriting or placement services for or relating to such company(ies) as well as solicit such
Retail│Indonesia│Mitra Adi Perkasa│June 19, 2017
21
investment, advisory or other services from any entity mentioned in this report.
As of June 19, 2017, CIMBR does not have a proprietary position in the recommended securities in this report.
CIMB Research Pte Ltd does not make a market on the securities mentioned in the report.
CIMB Securities Singapore Pte Ltd does not make a market on the securities mentioned in the report.
CIMB Bank Berhad, Singapore branch does not make a market on the securities mentioned in the report.
South Korea: This report is issued and distributed in South Korea by CIMB Securities Limited, Korea Branch (“CIMB Korea”) which is licensed as a cash equity broker, and regulated by the Financial Services Commission and Financial Supervisory Service of Korea. In South Korea, this report is for distribution only to professional investors under Article 9(5) of the Financial Investment Services and Capital Market Act of Korea (“FSCMA”).
Spain: This document is a research report and it is addressed to institutional investors only. The research report is of a general nature and not personalised and does not constitute investment advice so, as the case may be, the recipient must seek proper advice before adopting any investment decision. This document does not constitute a public offering of securities.
CIMB is not registered with the Spanish Comision Nacional del Mercado de Valores to provide investment services.
Sweden: This report contains only marketing information and has not been approved by the Swedish Financial Supervisory Authority. The distribution of this report is not an offer to sell to any person in Sweden or a solicitation to any person in Sweden to buy any instruments described herein and may not be forwarded to the public in Sweden.
Switzerland: This report has not been prepared in accordance with the recognized self-regulatory minimal standards for research reports of banks issued by the Swiss Bankers’ Association (Directives on the Independence of Financial Research).
Taiwan: This research report is not an offer or marketing of foreign securities in Taiwan. The securities as referred to in this research report have not been and will not be registered with the Financial Supervisory Commission of the Republic of China pursuant to relevant securities laws and regulations and may not be offered or sold within the Republic of China through a public offering or in circumstances which constitutes an offer or a placement within the meaning of the Securities and Exchange Law of the Republic of China that requires a registration or approval of the Financial Supervisory Commission of the Republic of China.
Thailand: This report is issued and distributed by CIMB Securities (Thailand) Company Limited (“CIMBS”) based upon sources believed to be reliable (but their accuracy, completeness or correctness is not guaranteed). The statements or expressions of opinion herein were arrived at after due and careful consideration for use as information for investment. Such opinions are subject to change without notice and CIMBS has no obligation to update its opinion or the information in this research report.
If the Financial Services and Markets Act of the United Kingdom or the rules of the Financial Conduct Authority apply to a recipient, our obligations owed to such recipient are unaffected.
CIMB Securities (Thailand) Co., Ltd. may act or acts as Market Maker, and issuer and offerer of Derivative Warrants and Structured Note which may have the following securities as its underlying securities. Investors should carefully read and study the details of the derivative warrants in the prospectus before making investment decisions.
AAV, ADVANC, AMATA, AOT, AP, BA, BANPU, BBL, BCH, BCP, BDMS, BEAUTY, BEC, BEM, BH, BIG, BLA, BLAND, BTS, CBG, CENTEL, CHG, CK, CKP, COM7, CPALL, CPF, CPN, DELTA, DTAC, EGCO, EPG, GLOBAL, GLOW, GPSC, GUNKUL, HANA, HMPRO, ICHI, IFEC, INTUCH, IRPC, ITD, IVL, KAMART, KBANK, KCE, KKP, KTB, KTC, LH, LHBANK, LPN, MAJOR, MINT, MTLS, PLANB, PSH, PTG, PTT, PTTEP, PTTGC, QH, ROBINS, RS, S, SAMART, SAWAD, SCB, SCC, SCN, SGP, SIRI, SPALI, SPCG, SPRC, STEC, STPI, SUPER, TASCO, TCAP, THAI, THANI, THCOM, TISCO, TKN, TMB, TOP, TPIPL, TRUE, TTA, TTCL, TTW, TU, TVO, UNIQ, VGI, VIBHA, VNG, WHA.
Corporate Governance Report:
The disclosure of the survey result of the Thai Institute of Directors Association (“IOD”) regarding corporate governance is made pursuant to the policy of the Office of the Securities and Exchange Commission. The survey of the IOD is based on the information of a company listed on the Stock Exchange of Thailand and the Market for Alternative Investment disclosed to the public and able to be accessed by a general public investor. The result, therefore, is from the perspective of a third party. It is not an evaluation of operation and is not based on inside information.
The survey result is as of the date appearing in the Corporate Governance Report of Thai Listed Companies. As a result, the survey result may be changed after that date. CIMBS does not confirm nor certify the accuracy of such survey result.
Score Range: 90 - 100 80 - 89 70 - 79 Below 70 or No Survey Result
Description: Excellent Very Good Good N/A
United Arab Emirates: The distributor of this report has not been approved or licensed by the UAE Central Bank or any other relevant licensing authorities or governmental agencies in the United Arab Emirates. This report is strictly private and confidential and has not been reviewed by, deposited or registered with UAE Central Bank or any other licensing authority or governmental agencies in the United Arab Emirates. This report is being issued outside the United Arab Emirates to a limited number of institutional investors and must not be provided to any person other than the original recipient and may not be reproduced or used for any other purpose. Further, the information contained in this report is not intended to lead to the sale of investments under any subscription agreement or the conclusion of any other contract of whatsoever nature within the territory of the United Arab Emirates.
United Kingdom: In the United Kingdom and European Economic Area, this report is being disseminated by CIMB Securities (UK) Limited (“CIMB UK”). CIMB UK is authorized and regulated by the Financial Conduct Authority and its registered office is at 27 Knightsbridge, London, SW1X7YB. Unless specified to the contrary, this report has been issued and approved for distribution in the U.K. and the EEA by CIMB UK. Investment research issued by CIMB UK has been prepared in accordance with CIMB Group’s policies for managing conflicts of interest arising as a result of publication and distribution of investment research. This report is for distribution only to, and is solely directed at, selected persons on the basis that those persons: (a) are eligible counterparties and professional clients of CIMB UK; (b) have professional experience in matters relating to investments falling within Article 19(5) of the Financial Services and Markets Act 2000 (Financial Promotion) Order 2005 (as amended, the “Order”), (c) fall within Article 49(2)(a) to (d) (“high net worth companies, unincorporated associations etc”) of the Order; (d) are outside the United Kingdom subject to relevant regulation in each jurisdiction, or (e) are persons to whom an invitation or inducement to engage in
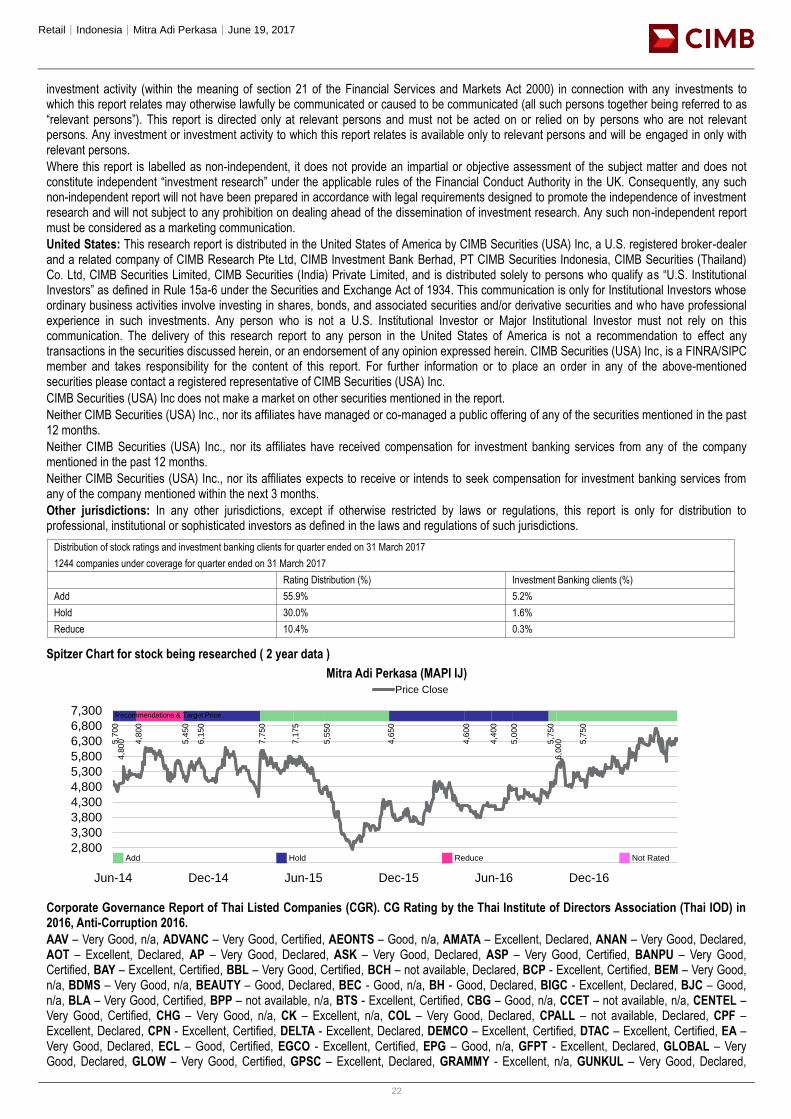
Retail│Indonesia│Mitra Adi Perkasa│June 19, 2017
22
investment activity (within the meaning of section 21 of the Financial Services and Markets Act 2000) in connection with any investments to which this report relates may otherwise lawfully be communicated or caused to be communicated (all such persons together being referred to as “relevant persons”). This report is directed only at relevant persons and must not be acted on or relied on by persons who are not relevant persons. Any investment or investment activity to which this report relates is available only to relevant persons and will be engaged in only with relevant persons.
Where this report is labelled as non-independent, it does not provide an impartial or objective assessment of the subject matter and does not constitute independent “investment research” under the applicable rules of the Financial Conduct Authority in the UK. Consequently, any such non-independent report will not have been prepared in accordance with legal requirements designed to promote the independence of investment research and will not subject to any prohibition on dealing ahead of the dissemination of investment research. Any such non-independent report must be considered as a marketing communication.
United States: This research report is distributed in the United States of America by CIMB Securities (USA) Inc, a U.S. registered broker-dealer and a related company of CIMB Research Pte Ltd, CIMB Investment Bank Berhad, PT CIMB Securities Indonesia, CIMB Securities (Thailand) Co. Ltd, CIMB Securities Limited, CIMB Securities (India) Private Limited, and is distributed solely to persons who qualify as “U.S. Institutional Investors” as defined in Rule 15a-6 under the Securities and Exchange Act of 1934. This communication is only for Institutional Investors whose ordinary business activities involve investing in shares, bonds, and associated securities and/or derivative securities and who have professional experience in such investments. Any person who is not a U.S. Institutional Investor or Major Institutional Investor must not rely on this communication. The delivery of this research report to any person in the United States of America is not a recommendation to effect any transactions in the securities discussed herein, or an endorsement of any opinion expressed herein. CIMB Securities (USA) Inc, is a FINRA/SIPC member and takes responsibility for the content of this report. For further information or to place an order in any of the above-mentioned securities please contact a registered representative of CIMB Securities (USA) Inc.
CIMB Securities (USA) Inc does not make a market on other securities mentioned in the report.
Neither CIMB Securities (USA) Inc., nor its affiliates have managed or co-managed a public offering of any of the securities mentioned in the past 12 months.
Neither CIMB Securities (USA) Inc., nor its affiliates have received compensation for investment banking services from any of the company mentioned in the past 12 months.
Neither CIMB Securities (USA) Inc., nor its affiliates expects to receive or intends to seek compensation for investment banking services from any of the company mentioned within the next 3 months.
Other jurisdictions: In any other jurisdictions, except if otherwise restricted by laws or regulations, this report is only for distribution to professional, institutional or sophisticated investors as defined in the laws and regulations of such jurisdictions.
Spitzer Chart for stock being researched ( 2 year data )
Mitra Adi Perkasa (MAPI IJ)
Corporate Governance Report of Thai Listed Companies (CGR). CG Rating by the Thai Institute of Directors Association (Thai IOD) in 2016, Anti-Corruption 2016.
AAV – Very Good, n/a, ADVANC – Very Good, Certified, AEONTS – Good, n/a, AMATA – Excellent, Declared, ANAN – Very Good, Declared, AOT – Excellent, Declared, AP – Very Good, Declared, ASK – Very Good, Declared, ASP – Very Good, Certified, BANPU – Very Good, Certified, BAY – Excellent, Certified, BBL – Very Good, Certified, BCH – not available, Declared, BCP - Excellent, Certified, BEM – Very Good, n/a, BDMS – Very Good, n/a, BEAUTY – Good, Declared, BEC - Good, n/a, BH - Good, Declared, BIGC - Excellent, Declared, BJC – Good, n/a, BLA – Very Good, Certified, BPP – not available, n/a, BTS - Excellent, Certified, CBG – Good, n/a, CCET – not available, n/a, CENTEL – Very Good, Certified, CHG – Very Good, n/a, CK – Excellent, n/a, COL – Very Good, Declared, CPALL – not available, Declared, CPF – Excellent, Declared, CPN - Excellent, Certified, DELTA - Excellent, Declared, DEMCO – Excellent, Certified, DTAC – Excellent, Certified, EA – Very Good, Declared, ECL – Good, Certified, EGCO - Excellent, Certified, EPG – Good, n/a, GFPT - Excellent, Declared, GLOBAL – Very Good, Declared, GLOW – Very Good, Certified, GPSC – Excellent, Declared, GRAMMY - Excellent, n/a, GUNKUL – Very Good, Declared,
Rating Distribution (%) Investment Banking clients (%)
Add 55.9% 5.2%
Hold 30.0% 1.6%
Reduce 10.4% 0.3%
Distribution of stock ratings and investment banking clients for quarter ended on 31 March 2017
1244 companies under coverage for quarter ended on 31 March 2017
2,300
2,800
3,300
3,800
4,300
4,800
5,300
5,800
6,300
6,800
7,300
Jun-14 Dec-14 Jun-15 Dec-15 Jun-16 Dec-16
Price Close
5,7
00
4,8
00 4,8
00
5,4
50
6,1
50
7,7
50
7,1
75
5,5
50
4,6
50
4,6
00
4,4
00
5,0
00
5,7
50
6,0
00 5,7
50
Recommendations & Target Price
Add Hold Reduce Not Rated
Retail│Indonesia│Mitra Adi Perkasa│June 19, 2017
23
HANA - Excellent, Certified, HMPRO - Excellent, Declared, ICHI – Very Good, Declared, INTUCH - Excellent, Certified, ITD – Good, n/a, IVL - Excellent, Certified, JAS – not available, Declared, JASIF – not available, n/a, JUBILE – Good, Declared, KAMART – not available, n/a, KBANK - Excellent, Certified, KCE - Excellent, Certified, KGI – Good, Certified, KKP – Excellent, Certified, KSL – Very Good, Declared, KTB - Excellent, Certified, KTC – Excellent, Certified, LH - Very Good, n/a, LPN – Excellent, Declared, M – Very Good, Declared, MAJOR - Good, n/a, MAKRO – Good, Declared, MALEE – Very Good, Declared, MBKET – Very Good, Certified, MC – Very Good, Declared, MCOT – Excellent, Declared, MEGA – Very Good, Declared, MINT - Excellent, Certified, MTLS – Very Good, Declared, NYT – Excellent, n/a, OISHI – Very Good, n/a, PLANB – Very Good, Declared, PSH – not available, n/a, PSL - Excellent, Certified, PTT - Excellent, Certified, PTTEP - Excellent, Certified, PTTGC - Excellent, Certified, QH – Excellent, Declared, RATCH – Excellent, Certified, ROBINS – Very Good, Declared, RS – Very Good, n/a, SAMART - Excellent, n/a, SAPPE - Good, n/a, SAT – Excellent, Certified, SAWAD – Good, n/a, SC – Excellent, Declared, SCB - Excellent, Certified, SCBLIF – not available, n/a, SCC – Excellent, Certified, SCN – Good, Declared, SCCC - Excellent, Declared, SIM - Excellent, n/a, SIRI - Good, n/a, SPALI - Excellent, Declared, SPRC – Very Good, Declared, STA – Very Good, Declared, STEC – Excellent, n/a, SVI – Excellent, Certified, TASCO – Very Good, Declared, TCAP – Excellent, Certified, THAI – Very Good, Declared, THANI – Very Good, Certified, THCOM – Excellent, Certified, THRE – Very Good, Certified, THREL – Very Good, Certified, TICON – Very Good, Declared, TISCO - Excellent, Certified, TK – Very Good, n/a, TKN – Good, n/a, TMB - Excellent, Certified, TOP - Excellent, Certified, TPCH – Good, n/a, TPIPP – not available, n/a, TRUE – Very Good, Declared, TTW – Very Good, Declared, TU – Excellent, Declared, UNIQ – not available, Declared, VGI – Excellent, Declared, WHA – not available, Declared, WHART – not available, n/a, WORK – not available, n/a.
Companies participating in Thailand’s Private Sector Collective Action Coalition Against Corruption programme (Thai CAC) under Thai Institute of Directors (as of October 28, 2016) are categorized into: - Companies that have declared their intention to join CAC, and - Companies certified by CAC
CIMB Recommendation Framework
Stock Ratings Definition:
Add The stock’s total return is expected to exceed 10% over the next 12 months.
Hold The stock’s total return is expected to be between 0% and positive 10% over the next 12 months.
Reduce The stock’s total return is expected to fall below 0% or more over the next 12 months.
The total expected return of a stock is defined as the sum of the: (i) percentage difference between the target price and the current price and (ii) the forward net dividend yields of the stock. Stock price targets have an investment horizon of 12 months.
Sector Ratings Definition:
Overweight An Overweight rating means stocks in the sector have, on a market cap-weighted basis, a positive absolute recommendation.
Neutral A Neutral rating means stocks in the sector have, on a market cap-weighted basis, a neutral absolute recommendation.
Underweight An Underweight rating means stocks in the sector have, on a market cap-weighted basis, a negative absolute recommendation.
Country Ratings Definition:
Overweight An Overweight rating means investors should be positioned with an above-market weight in this country relative to benchmark.
Neutral A Neutral rating means investors should be positioned with a neutral weight in this country relative to benchmark.
Underweight An Underweight rating means investors should be positioned with a below-market weight in this country relative to benchmark.