mitochondrial dna as a molecular clock -...
TRANSCRIPT
MtDNA PCR/Sequencing BABEC 9/26/11 Student Guide 1
Mitochondrial DNA as a Molecular Clock
Student Guide
Maria Abilock Frank H. Stephenson, Ph.D. BABEC Applied Biosystems We gratefully acknowledge David Micklos and the staff of the Dolan DNA Learning Center at Cold Spring Harbor Laboratory for their generous help. Some materials for this exercise were adapted, by permission, from the Genomic Biology: Advanced Instructional Technology for High School and College Biology Faculty laboratory manual, Cold Spring Harbor Laboratory, copyright 1999 and the Genetic Origins website at http://vector.cshl.org/geneticorigins. Introduction The DNA of every species on Earth is susceptible to change. Base pairs are lost. Base pairs are gained. One base pair can be substituted for another. We call these changes in DNA mutations or single nucleotide polymorphisms (SNPs) and they can arise by different mechanisms. By allowing organisms to adapt to environmental changes, mutation drives the steady and inevitable march of evolution. Because a mutation within a gene can change the amino acid sequence of the encoded protein, many mutations spell disaster for that gene’s function and potentially for the organism that bears it. Almost all genomes, however, from those of viruses to humans, carry segments of DNA that neither directly code for a protein nor are involved in the control of gene expression. A mutation occurring within such regions can usually be tolerated by the organism since it will most likely not impart any disadvantage to its survival nor impair its ability to reproduce. Recently, forensic scientists, anthropologists, and evolutionary biologists have looked at mutations within the DNA of the mitochondrion to explore differences between peoples and populations. Mitochondria are found in all eukaryotic cells and are believed to have once been free living bacteria that were assimilated early in evolution. They provide the cell in which they reside with the genes needed for the synthesis of the energy-carrying molecule ATP. Each mitochondrion contains several copies of its own circular genome and each cell may contain hundreds of mitochondria. Because of its abundance, mitochondrial DNA has become a target for those scientists who do not have a ready supply of blood, bodily fluids, or tissue to work with but who still need to examine differences between people at the molecular level. Whether it is the skeletal remains of a Neandertal or a trace amount of hair left at the scene of a crime, where intact genomic DNA might be hard to come by, mitochondrial DNA can often be readily recovered. The mitochondrial genome is 16,569 bp in length and contains 37 genes. Within its structure, however, there is a 1200 base pair non-coding segment, called the control region, carrying the genetic signals needed for replication and transcription. Since much of this DNA segment is not vital to the survival of the mitochondrion or the host cell, it is free to accumulate mutations. By studying the number and variety of base changes within this area, geneticists can determine the relatedness between individuals. Using the mutation rate within the mitochodrial control region as a “molecular clock,” evolutionists can plot the course that hominid evolution has taken. Mitochondrial DNA Replication When thinking about the human genome and all the traits that make us what we are tucked away within those six billion base pairs, it is easy to forget that all other cells in our body contain another genome, that of the mitochondrion. In some ways, mitochondrial DNA resembles the small circular pieces of DNA called plasmids found in bacterial cells. Like a plasmid, mitochondrial DNA is circular with a genome a fraction of the size of that of its host cell. Also, like a plasmid, there are multiple copies within each cell. Some cells in the human body carry thousands of mitochodria, and therefore contain thousands of copies of the mitochondrial genome. Because our bodies are composed of trillions of cells, with hundreds or thousands of mitochondria present in each cell, our bodies may contain more than 5 quadrillion (5,000,000,000,000,000) copies of the mitochondrial genome. A great deal of DNA replication has taken place to reach the adult body’s full complement of mitochondrial genomes!

MtDNA PCR/Sequencing BABEC 9/26/11 Student Guide 2
Replication of mitochondrial DNA proceeds in the following manner:
A B Replication of mitochondrial DNA begins on only one strand within the non-coding “control” region. As this strand is replicated, the opposite strand of the original DNA duplex is displaced and forms a single-stranded loop (hence the name “D-loop” for Displacement loop in Figure A). If the mitochondrion is not committed to the replication of its genome, copying of the non-displaced strand stops close to the protein-encoding boundary (Figure B). The displaced strand is then broken down and the replication process begins again displacing a single strand in the process. These events are repeated again and again until a signal is received that commits the entire molecule to replication. The segment you will amplify by PCR is within the D-loop sequence.
C D Once the signal is received to replicate the entire genome, replication continues around the circular molecule, increasing the size of the displaced strand (Figure C). When replication has proceded approximately two-thirds of the way around the molecule, replication begins on the displaced strand (Figure D) until two new circular genomes are created.

MtDNA PCR/Sequencing BABEC 9/26/11 Student Guide 3
Setting the Molecular Clock A species is defined as a group of organisms that are capable of interbreeding to produce viable, reproductive offspring. New species can arise when members of a population separate to form their own breeding group within a new environment that demands of its inhabitants a unique set of survival skills. As the separated group struggles to fill a new and different ecological niche, the genes that provide individuals an advantage in the competition to flourish and mate are selected for and passed on to the next generation. Those individuals carrying genes that do not provide a selective advantage may neither survive into adulthood nor mate. Their genes are lost to the population. A population’s ability to adapt to a new environment is driven by the process of natural selection. Mutation makes natural selection possible. Mutation alters genes, destroying or changing their function. Mutation molds the ability of members of a species to survive under a defined set of conditions. Eventually, during the process of adaptation and over many generations, enough mutations accumulate within the separated population group that its individuals are no longer capable of interbreeding with members of the original population. This marks the birth of a new species. The longer two species diverge from each other, the greater the number of mutational differences there will be between them. A clock measures the passage of time. Assuming that mutations occur at a constant rate, the accumulation of mutations in a DNA segment can be used as a “molecular clock” to measure the passage of time. In this case, the greater the number of mutations, the greater the amount of time passed. For example, if a new mutation appears in a defined region of DNA at a rate of one every 100,000 years, then after 500,000 years, 5 mutations will likely accumulate. In this laboratory exercise, you will isolate mitochondrial DNA from cheek cells and amplify a 440 base pair segment of the control region by PCR. You will analyze the DNA sequence of the PCR product to reveal differences between you and the other students in your class. You can compare your sequence with those of the “Ice Man,” “Lake Mungo Man,” and other long-dead humans. How does your sequence compare to those of chimpanzee and Neandertal? Could you and other modern humans have arisen from Neandertals or did we evolve separately? If we evolved separately, at what point in time did modern humans and Neandertals diverge on the evolutionary tree? Could Neandertals have contributed to our gene pool? These are all questions you will investigate.

MtDNA PCR/Sequencing BABEC 9/26/11 Student Guide 4
Laboratory Exercise The protocol outlined below describes a procedure for isolating DNA from cheek cells. In the first step, you will rinse your mouth with a salt solution. This step typically dislodges hundreds of cells from the cheek epithelium. An aliquot of the mouthwash solution is centrifuged to collect the dislodged cells, which are then resuspended in a small volume of saline. The resuspended cells are then added to a solution of Chelex® to remove any metal ions (such as magnesium) which might promote degradation of your genomic DNA. Magnesium (and other metal ions) can act as cofactor for DNA-degrading nucleases present in saliva and the environment. The Chelex®/cell sample is boiled to break open the cells. Since the sample is heated at a high temperature, the DNA, following this step, will be in a single-stranded form. The sample is then centrifuged briefly to collect the Chelex® and an aliquot of the supernatant is used for PCR. Objectives:
1. You should be able to successfully isolate your DNA from cheek cells. 2. You should be able to prepare a reaction for PCR amplification of the mitochondrial D-loop.
IMPORTANT LABORATORY PRACTICES a. Add reagents to the bottom of the reaction
tube, not to its side. b. Add each additional reagent directly into
previously-added reagent. c. Do non pipette up and down, as this
introduces error. This should only be done only when resuspeding the cell pellet and not to mix reagents.
d. Make sure contents are all settled into the bottom of the tube and not on the side or cap of tube. A quick spin may be needed to bring contents down.
a. Pipet slowly to prevent contaminating the pipette barrel.
b. Change pipette tips between each delivery. c. Change the tip even if it is the same reagent
being delivered between tubes. Change tip every time the pipette is used!
Keep reagents on ice.
Check the box next to each step as you complete it.

MtDNA PCR/Sequencing BABEC 9/26/11 Student Guide 5
* Place a check mark in the box of each step as it is completed.
DNA Preparation Using a Saline Mouthwash 1. Vigorously swirl 10 ml of saline solution in your
mouth for 30 seconds. Note: The saline solution is a 0.9% NaCl solution, the salt concentration of your blood plasma.
2. Expel saline into a cup and swirl to mix the cells.
3. Label a 1.5 ml microfuge tube with your PIN. Note: A PIN (personal identification number) can be any combination of 2-3 numbers or letters that can uniquely identify you.
4. Transfer 1000 µl to 1500 µl (1 ml to 1.5 ml)
of the saline/cell suspension into the labeled microfuge tube
5. In a microcentrifuge, spin your saline cell
suspension for 1 minute to pellet the cells. Be sure to use another student’s sample as a balance.
Note: Centrifuge speed should be set to 10,000 x g (≈10,000 rpm).
1 - 1.5 ml saline

MtDNA PCR/Sequencing BABEC 9/26/11 Student Guide 6
6. Observe your cell pellet at the bottom of the tube. If you do not have one, you may need to start over with another 1-1.5ml saline rinse. Pour off the supernatant into your cup, being careful NOT to lose your cell pellet. Note: There will be about 100µl of saline remaining in the tube after you pour.
7. Check to make sure you can see your cell pellet
and that there is about 100µl of saline covering it. you may need to add more saline to get up to about 100µl.
Rack or flick tube to mix, which will “resuspend”
the cells and make an evenly mixed solution. Note: You can also “rack” your sample. Be sure the top of the tube is closed, hold tube firmly at the top, and pull it across a microfuge rack 2-3 times.
8. Obtain a tube of Chelex from your instructor.
Label with your PIN.
9. Withdraw 50 µl of your cell suspension from step 7 and add it to the tube containing Chelex.
Note: Do not pipet up and down at this step or else you will clog the tip with Chelex beads.
10. Heat block version: If your Chelex (with the cell
suspension) is in a normal 1.5 ml microfuge tube, take your tube to a heat block station. Slide a cap-lock onto the tube lid and place it in the heat block for 10 minutes. Keep track of your tube in the heat block
Resuspend cells in ≈100µl saline
50 µl
50 µl cells
MtDNA PCR/Sequencing BABEC 9/26/11 Student Guide 7
PCR tube version: If your Chelex (with your cell suspension) is in a tiny PCR tube, follow your teacher’s instruction on placing it in a thermal cycler at 99ºC, for 10 minutes. Record the location of your tube in the thermal cycler
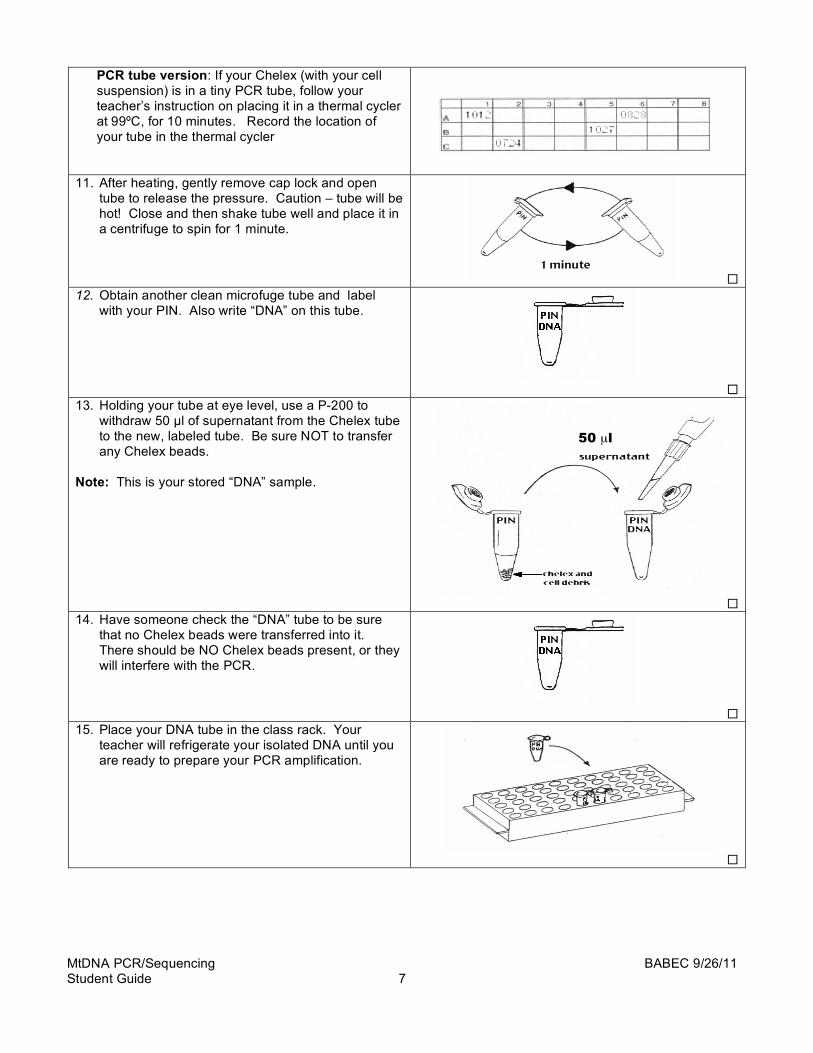
11. After heating, gently remove cap lock and open
tube to release the pressure. Caution – tube will be hot! Close and then shake tube well and place it in a centrifuge to spin for 1 minute.
12. Obtain another clean microfuge tube and label
with your PIN. Also write “DNA” on this tube.
13. Holding your tube at eye level, use a P-200 to withdraw 50 µl of supernatant from the Chelex tube to the new, labeled tube. Be sure NOT to transfer any Chelex beads.
Note: This is your stored “DNA” sample.
14. Have someone check the “DNA” tube to be sure
that no Chelex beads were transferred into it. There should be NO Chelex beads present, or they will interfere with the PCR.
15. Place your DNA tube in the class rack. Your teacher will refrigerate your isolated DNA until you are ready to prepare your PCR amplification.
50 µl

MtDNA PCR/Sequencing BABEC 9/26/11 Student Guide 8
Polymerase Chain Reaction 1. Obtain a tiny PCR tube. Label it with your voucher number, just
under the lip. Note: Keep your PCR tube on ice when setting up the reaction.
2. Pipet 20 µl of Master Mix into your PCR tube. Note: It is critical that the Master Mix stays on ice before and during use.
3. Change your pipet tip and add 20 µl of Primer Mix into your PCR tube.
Note: It is critical that the Primerr Mix stays on ice before and during use.
4. With a new pipet tip, add 10 µl of your extracted DNA into your PCR tube. What is the total volume in your tube? ___ µl.
Note: Make sure that all the liquids are settled into the bottom of the tube and not on the side of the tube or in the cap. If not, you can give the tube a quick spin in the centrifuge. Do not pipette up and down, it introduces error.
10 µl of DNA
5. Setting up the controls: a) Two students will be asked to set up the positive control reactions for the class. They will use the positive control DNA provided in the kit. There should be enough PCR sample for one lane on each gel. b) Another two students will set up negative control reactions for the whole class. They will use sterile water. There should be enough PCR sample for one lane on each gel.
Control Master
Mix Primer
mix DNA
+ 20 µl 20 µl 10 µl +C DNA
- 20 µl 20 µl 10 µl sterile H20
6. Check the volume of your PCR tube by comparing it to a reference
PCR tube with 50 µl in it. It should be near the thermal cycler, set by your teacher.
Note: If the volume of your tube does not match, see your instructor to troubleshoot. You may need to set up the reaction again.
7. Place your reaction into the thermal cycler and record the location
of your tube on the grid provided by your teacher.
1 2 3 4 5 6 7 A 1123 0828
B 1027
C 6777 9305
20 µl of Master Mix
20 µl of Primer Mix
50
PCR Tube Reference Tube

MtDNA PCR/Sequencing BABEC 9/26/11 Student Guide 9
8. The cycling protocol for amplification of the mitochondrial control region is: 95°C—10 minutes
94°C—30 seconds 52.5°C—30 seconds 30 cycles 65°C—1 minute
72°C—10 minutes 4°C—hold, ∞ infinity

MtDNA PCR/Sequencing BABEC 9/26/11 Student Guide 10
Agarose Gel Electrophoresis To determine if you generated a PCR product that can be used for subsequent DNA sequencing, you will need to visualize the products of your amplification. This will be done using a process called electrophoresis in which electric current forces the migration of DNA fragments through a special gel material. Since DNA is negatively charged, it will migrate in an electric field towards the positive electrode (Figure 1). When electrophoresed through a gel, shorter fragments of DNA move at a faster rate than longer ones.
Figure 1. Side view of an agarose gel showing DNA loaded into a well and the direction of DNA fragment migration during electrophoresis.
The gel material to be used for this experiment is called agarose. When agarose granules are placed in a buffer solution and heated to boiling temperatures, they dissolve and the solution becomes clear. A casting tray is set up with a comb to provide a mold for the gel. The agarose is allowed to cool slightly and is then poured into the casting tray. Within about 15 minutes, the agarose solidifies into an opaque gel having the look and feel of coconut Jell-O. The gel, in its casting tray, is placed in a buffer chamber connected to a power supply and buffer is poured into the chamber until the gel is completely submerged. The comb can then be pulled out to form the wells into which your PCR sample will be loaded. Loading dye is a colored, viscous liquid containing dyes (making it easy to see) and sucrose, ficoll, or glycerol (making it dense). You will add loading dye to your amplification reaction and then pipet an aliquot of the mixture into one of the wells of your agarose gel. When all wells have been loaded with sample, your instructor will switch on the power supply. The samples should be allowed to electrophorese until the blue loading dye is 1 to 2 cm from the bottom. The gel can then be stained with ethidium bromide and photographed. You will need a 2% agarose gel for electrophoresis of your PCR products. If your agarose gel casting tray holds 50 mL, then you can calculate the amount of agarose you will need as follows:
(Ci) (Mi) = (Cf) (Mf) C = concentration (100%) (Mi) = (2%) (50 g) M = Mass 100 (Mi) = 100 g i = initial Mi = 1 g agarose powder f = final 50 g – 1 g = 49 g = 49 mL buffer

MtDNA PCR/Sequencing BABEC 9/26/11 Student Guide 11
Electrophoresis of Amplified DNA 1. Retrieve your PCR tube and place it in a balanced
configuration in a microcentrifuge. Spin it briefly (~ 10 seconds) to bring the liquid to the bottom of the reaction tube.
Note: Make sure the centrifuge adapters are in place before putting the tiny PCR tube into the centrifuge rotor.
2. Add 5 µ l of loading dye to your PCR tube.
3. Carefully load 15 to 20 µl of the DNA/loading dye mixture into a well in your gel. Make sure you keep track of what sample is being loaded into each well.
Note: Avoid poking the pipette tip through the bottom of the gel or spilling sample over the sides of the well. Use a new tip for each sample.
4. One student (or the instructor) should load 15-20 µl of 100 bp ladder (molecular weight marker) into one of the wells of each gel.
5. When all samples are loaded, attach the electrodes from the gel box to the power supply. Have your teacher check your connections and then electrophorese your samples at 150 Volts for 25 - 40 minutes.
6. After electrophoresis, the gels will be ready to stain and photograph.

MtDNA PCR/Sequencing BABEC 9/26/11 Student Guide 12
Staining and Photographing Agarose Gels Your teacher will stain your agarose gel and take a photograph for you so that you may analyze your Wolbachia results. Gel staining is done as follows: Place the agarose gel in a staining tray. Pour enough ethidium bromide (0.5µg/ ml) to cover the gel. Wait 20 minutes. CAUTION: Ethidium bromide is considered a carcinogen and neurotoxin. Never let students handle EtBr. Always wear gloves and safety glasses when handling it yourself. Pour the ethidium bromide solution back into its storage bottle. Pour enough water into the staining tray to cover the gel. Wait 5 minutes. Pour the water out of the staining tray into a hazardous waste container and place the stained gel on a UV light box. Check with your district on how to dispose of waste liquid and solids. CAUTION: Ultraviolet light can damage your eyes and skin. Always wear protective clothing and UV safety glasses when using a UV light box. 1. Place the camera over the gel and take a photograph.
Figure 2. Ethidium bromide molecules stacked between DNA base pairs.
The PCR products run on your agarose gel are invisible to the naked eye. If you look at your gel in normal room light, you will not be able to see the amplified products of your reaction. In order to “see” them, we must stain the gel with a fluorescent dye called ethidium bromide. Molecules of ethidium bromide are flat and can nestle between adjacent base pairs of double stranded DNA (Figure 2). When this interaction occurs, they take on a more ordered and regular configuration causing them to fluoresce under ultraviolet light (UV). Exposing the gel to UV light after staining, allows you to see bright, pinkish-orange bands where there is DNA (Figure 3).
Figure 3. After staining an agarose gel with ethidium bromide, DNA bands are visible upon exposure to UV light.

MtDNA PCR/Sequencing BABEC 9/26/11 Student Guide 13
Mitochondrial D-loop PCR Amplification Results PCR amplification of the mitochondrial D-loop region using the primers for this protocol should produce a 440 bp product as shown in the figure below.
Figure 4. Representation of an agarose gel containing a 100 bp ladder (leftmost lane) and lanes showing 440 bp products from D-loop PCR amplification.
Tape your gel photo in the space below.

MtDNA PCR/Sequencing BABEC 9/26/11 Student Guide 14
1 2 3
IMPORTANT: If you are submitting your PCR samples for sequencing through the Dolan DNA Learning Center (DNALC) or CSU East Bay, please continue on this page. If you have received BigDye reagents AND have made prior arrangements to have your class’s DNA sequenced, please skip to page 16, “Cycle Sequencing Reactions”.
Submitting PCR samples for sequencing through DNALC or CSU East Bay 1. Obtain a clear photo of your class gel results. This
photo is required for the processing of your samples at both DNALC and CSUEB. Label the lanes in sequential order, using only numbers, beginning with 1.
2. With a fresh tip, remove 15µl of the PCR product
and place in a new 0.5 ml tube.
3. Label the new tube with the corresponding number
from the gel photo.

MtDNA PCR/Sequencing BABEC 9/26/11 Student Guide 15
Submitting PCR samples for sequencing through DNALC or CSU East Bay, cont. 4. To submit samples to DNALC, complete the online
form here:
http://www.geneticorigins.org/geneticorigins/mito/mitoframeset.htm (click on “Sequencing Service” (top menu), and go down to the bottom of the page and click “Go to Sequencing Form”). To submit samples to CSU East Bay: email Dr. Chris Baysdorfer ([email protected]) with your class information including: your name, school, # of samples, and class name (AP Bio, etc.).
5. Package your samples, completed submission form, and labeled gel photo in a zip-top plastic bag. Place in a Styrofoam box with cooler pack.
6. Ship OVERNIGHT delivery to: DNA Sequencing Service DNA Learning Center Cold Spring Harbor Laboratory 1 Bungtown Road Cold Spring Harbor, NY 11724 Phone: (516) 367-5170 OR Professor Chris Baysdorfer Department of Biological Sciences California State University, East Bay Hayward, CA 94542 Phone: (510) 885-3459 IMPORTANT: Do not ship samples on Fridays.
7. You will be notified by email when the sequences are posted. This may take 3-4 weeks. Once you have received notification, continue on page 18, “Using the Sequence Server at CSHL DNA Learning Center”.
If you have ANY questions about submitting your samples for sequencing, please do not hesitate to email ([email protected]) or call (650) 504-1124. You can also consult the DNALC website: http://www.geneticorigins.org/geneticorigins/mito/mitoframeset.htm (click on “Sequencing Service” in the menu bar.)

MtDNA PCR/Sequencing BABEC 9/26/11 Student Guide 16
Cycle Sequencing Reaction 1. Label a 0.2 mL tube with your 4 digit PIN.
2. Set your p20 micropipet to 8 µL and add 8 µL of sterile water to your 0.2 mL tube.
3. Change your tip and dispense 8 µL of Big Dye Terminator RR Mix* into your 0.2 mL tube.
*“RR”stands for Ready Reaction. A Ready Reaction Mix contains the dNTPs, ddNTPs, buffer, enzyme, and magnesium chloride.
4. With a new tip, add 2 µL of mitochondrial sequencing primer into your 0.2 mL tube.
5. Using a clean tip, add 2 µL of your mtDNA PCR sample into your 0.2 mL tube. Slowly pipet up and down several times to mix.
Note: You may need to centrifuge the tubes for 5-10 seconds if the reaction components are along the walls of the tube.
6. One student will be asked to set up the positive control reaction for the class.
Control Ready
Reaction mix
-21 M13 control primer
pGEM 3Zf(+) control DNA
Sterile water
+ 8 µL 4 µL 2 µL 6 µL
7. Place your reaction into the thermal cycler and record the location of your tube on the grid provided by your teacher.

MtDNA PCR/Sequencing BABEC 9/26/11 Student Guide 17
8. Follow the cycling parameters below for cycle sequencing of this mitochondrial control region.
25 cycles of: 96˚C, 10 seconds 50˚C, 5 seconds 60˚C, 4 minutes 4˚C hold
Spin Column Purification and Loading the Automatic Sequencer 1. Rehydrate the Centri-Sep column in 750 µl sterile water. Remove any air bubbles from the column by
tapping on the column until the bubbles float up. Allow it to sit for at least 30 minutes. 2. If any bubbles appeared during rehydration, tap them out. Remove upper cap and then lower cap and place
the column in the wash tube. Make sure that the column is dripping. If it is not, seal the top of the tube with Parafilm and press your finger on the Parafilm to start the flow.
3. Place the wash tube with spin column in the centrifuge and spin for 2 minutes at 4,000 rpm. 4. Dump the wash tube and place the column into a 1.5 mL microfuge tube, labeled with your initials. 5. Apply your cycle sequencing reaction to the top center of the column matrix. Do not allow the micropipet tip
to touch the matrix. 6. Spin the column and microfuge tube as a unit for 2 minutes at 4,000 rpm with the column in the same
orientation as in the first spin. 7. After centrifugation, throw away the column and vacuum-dry the sample. 8. Add 5 µL of loading buffer to resuspend the cycle sequencing sample. Pipet up and down repeatedly along
the bottom sides of the tube to ensure complete resuspension of the reaction products. 9. After a quick 5-second spin, transfer the sample into a 200 µL PCR tube. 10. Heat samples for 2 minutes at 90˚C in the thermal cycler and then immediately place your sample in ice. 11. Load 1.5 µL into the appropriate well on the sequencing gel, following the indications on the Sample Sheet
(on the computer screen).

MtDNA PCR/Sequencing BABEC 9/26/11 Student Guide 18
Using the Sequence Server at the CSHL DNA Learning Center Objectives:
1. You should be able to view your class data in the Cold Spring Harbor Laboratory Sequence Server database.
2. You should be able to perform pair-wise sequence alignments between diverse modern humans. 3. You should be able to perform pair-wise sequence alignments between diverse modern humans and
Neandertals. 4. You should be able to set the “molecular clock” based on the number of sequence differences between
modern humans. 5. You should be able to use a “molecular clock” to estimate when Neanderthals and modern humans
diverged. The DNA Learning Center at Cold Spring Harbor Laboratory has developed a number of bioinformatics tools for student use. Bioinformatics tools are computer programs used to help scientists make sense of biological data and solve biological problems. You will be using the Sequence Server for three different activities to help you learn more about the origins of our species. In the following exercise, you will compare DNA sequence between individuals from several different population groups. You will first compare sequences between modern humans. This information will be used to set a “molecular clock” . You will then compare modern humans to Neandertals to see if Neandertals might have contributed to our gene pool. The molecular clock you derive will be used to determine when modern humans and Neandertals diverged. In your final comparison, you will align modern human sequences to that of a chimpanzee to derive a new molecular clock. The molecular clocks will be used to estimate when modern humans first appeared. Using the Sequence Server to Align Mitochondrial DNA Sequences Your class data has been entered into the Sequence Server database at the Dolan DNA Learning Center at the Cold Spring Harbor Laboratory. Use the following steps to access and utilize that data.
Mitochondrial DNA Sequence Comparisons 1. Open up an Internet browser window. (This might
be Internet Explorer, Safari, Firefox, or Netscape Navigator, etc.)
2. In the address box, type in the following URL: http://www.bioservers.org/bioserver and press the Enter (or Return) key on the keyboard. The DNA Learning Center’s Bioserver main page will be brought up.
3. Click on the “REGISTER” button if you have not
previously registered with Bioservers. Fill out the required information and then hit “SUBMIT.” If you are already registered, enter your username and password, then press “LOGIN.”

MtDNA PCR/Sequencing BABEC 9/26/11 Student Guide 19
4. The “Using Sequence Server” instruction window will appear on top of the Sequence Server Workspace. The instructions contained in this box can be used if you need more information about using this site. Click on the Sequence Server Workspace to bring it forward on the desktop.
5. Click on the “MANAGE GROUPS” box. This is where you can identify groups of data to add to your workspace.
6. In the upper right hand corner of the Manage Groups window is a scroll menu. If it isn’t already showing, select “Classes.” This will bring up a list of classes from across the country that have sequence data stored in the Sequence Server database. Use the scroll bars on the right side of the window to locate your class. When you have located your class, click the box to its left to select it.
Note: The entire window must load before attempting to change the selection.
7. Select “Prehistoric Human DNA” from the Manage Groups window. Click the box to the left of one or more of the following: “Lake Mungo Man,” “Otzi, the Iceman,” “Egyptian Mummy,” “Yixi mtDNA,” or “Cahokian mtDNA.” Press “OK” when finished.
8. Your class data and several prehistoric humans’
data should now be added to your workspace. Select your sequence by using the scroll menu below your class name. Deselect all the check boxes on the left except for your sample and one prehistoric human of your choice.

MtDNA PCR/Sequencing BABEC 9/26/11 Student Guide 20
9. Next to the “COMPARE” button below the Sequence Server icon, use the arrows to scroll to “Align:CLUSTAL W” then click the “COMPARE” button.
10. Your sequence and the prehistoric human sequence you chose should align where bases are complementary. You may notice some yellow highlight regions, dashes and gray highlight regions with “N’s.” What do you think these indicate?
11. When you have examined the alignment to your satisfaction, press the “CLEAR” button to clear your workspace. Next, you will work with various diverse modern humans, Neandertals, chimpanzee, and your classmates’ data to investigate your genetic origins. You will be adding members of these groups to your workspace in the next few steps.
12. In the Manage Groups window, use the scroll menu to locate your class. Select it by checking its box.
13. Using the scroll menu again in the upper right corner of the Manage Groups window, locate and select “Modern Human DNA.” Check all boxes in this Modern Human DNA window.

MtDNA PCR/Sequencing BABEC 9/26/11 Student Guide 21
14. Locate and select the “Prehistoric Human DNA” category from the Manage Groups window. Place check marks in the boxes to the left of the Neanderthal mtDNA sequences.
15. Select the “Non-Human DNA” category from the Manage Groups window. Click the box to the left of “Primate mtDNA (4 species).” Click on the “OK” button at the bottom of the window. This will place all selected DNA sequences onto the Sequence Server Workspace.

MtDNA PCR/Sequencing BABEC 9/26/11 Student Guide 22
Sequence Comparisons You will perform a series of sequence alignments that will allow you to estimate a mutation rate and to calculate the timing of crucial events in human evolution. Use the following guidelines for each comparison.
• Identify a region spanning 200 bases where there is good alignment between the two sequences you are comparing. This region should contain few, if any, “N’s.”
• Excluding N’s (in gray) and dashes that may occur at the beginning or end of the alignment, count how many yellow-highlighted base positions are found in the alignment. If you find a run of three or more dashes in a row, count such a run as a single nucleotide difference.
Note to teachers: This is based on the assumption that it is more likely that a single event, rather than multiple, independent events, will lead to the insertion/deletion of 3 or more bases at a particular site. • If you find a sequence that does not align for 200 bases, use a different sequence.
Follow the steps below to fill in the spaces in the chart that follows.
1. Modern Human vs. Modern Human a. Select any two modern humans from the groups on your workspace. Fill in the identifying information in
the table. b. Compare these two individuals by ClustalW alignment. Count the number of mismatches, or SNPs, and
record this number in the table. c. Repeat steps “a” and “b” using different modern humans. d. Now compare two students in the class and fill in all the appropriate information in the table. e. Calculate the average number of SNPs for this group and record in the table.
2. Modern Human vs. Neandertal a. Select any African modern human and any Neandertal to compare by ClustalW alignment. Fill in the
identifying information in the table. b. Compare these two individuals and record the number of SNPs in the table. c. Repeat steps “a” and “b” with any Asian modern human and any Neandertal. d. Repeat steps “a” and “b” again using any European modern human and any Neandertal. e. Now compare your (or another student’s) sequence with any Neandertal and record all appropriate
information in the table. f. Calculate the average number of SNPs for this group and record in the table.
3. Neandertal vs. Neandertal a. Select Neandertal #1 and Neandertal #2 to compare by ClustalW alignment. Record the number of
SNPs in the table. b. Do the same with the other two combinations of Neandertals. c. Calculate the average number of SNPs for this group and record in the table.
4. Modern Human vs. Chimpanzee a. Select any modern human to compare with Chimp #2. Fill in the identifying information in the table. b. Compare these two sequences by ClustalW alignment. Count the number of SNPs and record this
number in the table. c. Repeat steps “a” and “b” using different modern humans. d. Now compare your (or another student’s) sequence with Chimp #2 and record the number of SNPs
along with the appropriate identifying information. e. Calculate the average number of SNPs for this group.

MtDNA PCR/Sequencing BABEC 9/26/11 Student Guide 23
Student Data Sequence Server Clustal W Alignments: SNPs
Modern Human vs. Modern Human Number of SNPs Your Average Class Average ________________ vs. _________________ ________________ vs. _________________ ________________ vs. _________________ Student _________ vs. Student __________
Modern Human vs. Neandertal African ____________ vs. Neandertal # _____ Asian _____________vs. Neandertal # _____ European __________ vs. Neandertal # _____ Student ___________ vs. Neandertal #____
Neandertal vs. Neandertal Neandertal #1 vs. Neandertal #2 Neandertal #1 vs. Neandertal #3 Neandertal #2 vs. Neandertal #3
Modern Human vs. Chimpanzee
_____________vs. Chimp #2 _____________vs. Chimp #2 _____________vs. Chimp #2 Student ______ vs. Chimp #2

MtDNA PCR/Sequencing BABEC 9/26/11 Student Guide 24
1. Calculating a molecular clock Archaeologists use a number of different techniques to estimate the age of fossils. These include radiocarbon dating, measuring changes in carbonates and tooth enamel brought about by exposure to radiation over time, and determining the age of the geological strata in which the fossil was found. By dating human fossils discovered in Africa, scientists estimate that modern humans first appeared approximately 150,000 years ago. Using this value and the class average number of differences for “Modern Humans vs. Modern Humans,” derive a molecular clock, or mutation rate, in years/mutation. Use the formula below:
150,000 years = _______ years/ mutation ____ mutations 2. Did modern humans evolve from Neandertals? Neandertal fossils have been discovered in Europe and the Middle East. Dating the fossils by radiocarbon decay suggests that Neandertals inhabited the European continent as recently as 28,000 years ago. Estimates of when Neandertal first appeared in Europe are far less precise but many scientists believe it may have been as long as 300,000 years ago. Although they are frequently depicted as stocky and brutish individuals, Neandertals cared for their sick and injured, fashioned stone tools, used fire, lived and hunted in social units, and ritually buried their dead. As far as we know, Neandertals did not inhabit regions far outside the European continent. If modern Europeans descended from Neandertals, you would expect that Neandertals would be more closely related to modern European populations than to any other modern human population in the world. Based on your “Modern Human vs. Neandertal” data, does it appear as though Europeans or any other modern world population descended from the Neandertals? Explain. 3. Human - Neandertal divergence How many years ago did the common ancestor of modern humans and Neandertals live? In the equation below, use the average number of differences (mutations) you found between modern humans and Neandertals and your calculated mutation rate to estimate this number. ______ years ____ mutations x = _______ years mutation 4. Did Neandertals contribute to the modern human mtDNA gene pool? A gene pool is the collection of all genes in a population. Members of a single gene pool would be expected to have fewer differences between them than would be expected between members of different gene pools. Did Neandertals have a separate gene pool from that of modern humans? Could Neandertals have contributed their mitochondrial DNA to the gene pool of modern humans? Use the comparisons below (4a through 4e) to answer this question.
a. Average difference between Neandertals = _______
b. Average difference between modern humans and Neandertal = _______
c. Average difference between modern humans = _______

MtDNA PCR/Sequencing BABEC 9/26/11 Student Guide 25
d. The closest modern human/Neandertal alignment discovered by your class showed ________
differences.
e. The two most divergent modern humans discovered by your class showed __________ differences.
f. Do you think the Neandertals used in this study are members of a single gene pool (assume that modern humans are of a single gene pool)? Explain.
g. Do you think Neandertals contributed their mitochondrial DNA to the modern human mtDNA gene pool? What other data would you want to answer this question?
5. A molecular clock based on chimpanzee/hominid divergence Based on the fossil record, scientists believe that chimpanzees and modern humans may have diverged 5,000,000 years ago.
a. Would the molecular clock be different if you used the time since chimpanzees and modern humans evolved to determine the mutation rate? Calculate a new mutation rate using the formula below and the 5 million year divergence estimate.
5,000,000 years = ________ years/mutation _____ mutations
b. Is this value different than the one you calculated based on “Modern Human vs. Modern Human” differences? Explain.

MtDNA PCR/Sequencing BABEC 9/26/11 Student Guide 26
c. Using the mutation rate you calculated in 5a, when did “Mitochondrial Eve,” the mitochondrial ancestor of all modern humans, live? Use the formula below for this calculation.
_______ years
___ mutations x = _________ years mutation
How does this estimate compare with the value you used to calculate a molecular clock in Problem 1?
d. Using the same molecular clock (calculated in 5a), when did Neandertals and modern humans diverge and how does this estimate compare with the value you calculated in Problem 3?
________ years
___ mutations x = __________ years mutation
e. How many mutations would you need between chimpanzee and modern humans to give the mutation
rate you calculated in Problem 1? Use the equation below for your calculation.
5,000,000 years = _______ years/mutation x mutations x = ________ mutations
How does this number compare with the average number of SNPs your class found for the “Modern Human vs. Chimpanzee” comparisons and how can you account for any discrepancy?
f. Which mutation rate might be more accurate, that derived from the modern human/modern human
comparisons or that derived from the chimpanzee/modern human comparisons? Explain.

MtDNA PCR/Sequencing BABEC 9/26/11 Student Guide 27
Life Technologies & Applied Biosystems / BABEC Educational PCR Kits For research use only. Not for use in diagnostic procedures. Notice to Purchaser: Limited Label License. A license under U.S. Patents 4,683,202, 4,683,195, and 4,965,188 or their foreign counterparts, owned by Roche Molecular Systems, Inc. and F. Hoffmann-La Roche Ltd (Roche), for use in research and development, has an up-front fee component and a running-royalty component. The purchase price of the Lambda PCR, Alu PV92 PCR, PCR Optimization, D1S80 PCR, and Mitochondrial PCR Kits includes limited, non-transferable rights under the running-royalty component to use only this amount of the product to practice the Polymerase Chain Reaction (PCR) and related processes described in said patents solely for the research and development activities of the purchaser when this product is used in conjunction with a thermal cycler whose use is covered by the up-front fee component. Rights to the up-front fee component must be obtained by the end user in order to have a complete license. These rights under the up-front fee component may be purchased from Applied Biosystems or obtained by purchasing an authorized thermal cycler. No right to perform or offer commercial services of any kind using PCR, including without limitation reporting the results of purchaser’s activities for a fee or other commercial consideration, is hereby granted by implication or estoppel. Further information on purchasing licenses to practice the PCR process may be obtained by contacting the Director of Licensing at Applied Biosystems, 850 Lincoln Centre Drive, Foster City, California 94404 or at Roche Molecular Systems, Inc., 1145 Atlantic Avenue, Alameda, California 94501. MicroAmp is a registered trademark of Applera Corporation or its subsidiaries in the U.S. and certain other countries. Applied Biosystems is a trademark of Applera Corporation or its subsidiaries in the U.S. and certain other countries. GeneAmp and AmpliTaq Gold are registered trademarks of Roche Molecular Systems, Inc. All other trademarks are the sole property of their respective owners. Applied Biosystems’ vast distribution and service network, composed of highly trained support and applications personnel, reaches into 150 countries on six continents. For international office locations, please call the division headquarters or refer to our web site at www. Appliedbiosystems.com. © Copyright 2001, Applied Biosystems. All rights reserved.