mitigating climate change and waste recycling household ... · no. 50 june 2015 mitigating climate...
TRANSCRIPT

No. 50 June 2015
MITIGATING CLIMATE CHANGE AND WASTE RECYCLING: HOUSEHOLD
PACKAGING CASE STUDY
Vivian Dépoues1, Cécile Bordier2
The waste sector has consistently poor visibility when it comes to GHG inventories. Its true impact can
only be understood through a comprehensive life-cycle assessment methodology. It is only then that the
actual effectiveness of waste prevention and recycling in mitigating GHG emissions becomes clear.
This Climate Report examines the principle of Extended Producer Responsibility (EPR) through the
example of household packaging in France. 3.2 Mt of packaging is recycled every year, resulting in a 2.1
Mt reduction in GHG emissions. This outcome is achieved through the involvement of all stakeholders.
Reductions in waste treatment and the reuse of recycled materials are the principle sources of this
reduction. Reusing recycled materials has even become a competitive option in a market based on the
original EPR economic model, primarily financed by producers. The positive climate impact is a co-benefit
of the recycling target, which relies both on sorting by consumers and the household waste management
organisation of local authorities.
The report details the connections between the model's financial incentives and measures to reduce
emissions at each stage. It stresses that the potential for mitigation associated with processing household
packaging could be intensified as part of a transition to a circular economy. Success depends on
improved policy coordination—especially at local level—and heightened visibility of co-benefits with
regard to climate issues.
1 Vivian Dépoues is a “Sub-national Climate Policy" Research Analyst at CDC Climat Research -
[email protected]. 2 Cécile Bordier is a “Sub-national Climate Policy” Research Project Manager at CDC Climat Research -
[email protected], +33 (0) 1 58 50 74 89.
2
ACKNOWLEDGEMENTS
The authors would like to thank Sophie Bonnier and Jan Le Moux at Eco-Emballages, who proposed
this research topic to CDC Climat and provided their expertise during its preparation.
They would also like to thank the following for their detailed review of this document: Philippe Bajeat
(ADEME [French Environment and Energy Agency]), Jacques Bordat (French Glass Industry
Association), Eric Buffo (Department of Haute Gironde SMICVAL [Joint Inter-District Waste
Collection and Recovery Union]), Philippe Diercxsens (Danone), Michel Fontaine (French National
Packaging Council), Alain Geldron (ADEME), Yves Gouriten (Nantes Metropolitan Area), Sophie
Jacquet (Eco-Emballages), Tatiana Lecossais (Nantes Metropolitan Area), Alban Mallet (Nantes
Metropolitan Area), Noël Mangin (Revipac), Lydie Vincent (Lagny Regional Joint-Inter-District Waste
Collection and Treatment Union [SMIETREM]).
They would also like to thank Guillaume Boucherie (Vilaine Regions Joint Inter-District Household
Waste Collection and Treatment Union [SMICTOM]), Valérie Edouard (Toulouse Metropolitan Area),
Matthieu Glachant (French Centre for Industrial Economics [CERNA]), Maïté Ketterer (Eco-
Emballages) and Arnaud Rolland (Coca-Cola Entreprise) for their availability and their insights during
meetings.
Managing Editor: Benoît Leguet - ISSN 2101-4663
Press contact: Maria Scolan - 01 58 50 32 48 - [email protected]
This research report was jointly financed by Eco-Emballages and Caisse des Dépôts, a government institution. Caisse des
Dépôts shall not be liable for the publication’s contents under any circumstances.
This publication is the result of independent research performed by the CDC Climat Research Department (hereinafter “CDC
Climat Research”), which assumes full responsibility, including editorial responsibility, for the publication, subject to the
information and materials provided by Eco-Emballages and replicated in whole or in part in the text, for which Eco-Emballages
remains responsible.
This publication exclusively reflects CDC Climat Research’s opinions, based on sources that are considered to be reliable.
However, we would underline that other information obtained through external sources was also used, in addition to the
information provided by Eco-Emballages. Accordingly, CDC Climat cannot be held responsible for any omission, inaccuracy
or error that this external information may contain, or for any consequences that may result from its use.
This report does not amount to the offer of a service or product, or canvassing, or advice of any kind whatsoever. The
information contained in this report is solely for information purposes, and has no contractual value.
CDC Climat cannot be held liable for the disclosure or use of the information contained in this report.

3
CONTENTS
CONTENTS 3
ABSTRACT 4
INTRODUCTION 7
I. WASTE MANAGEMENT: IMPACT ON MITIGATING CLIMATE CHANGE 8
A. Greenhouse gas emissions and waste management 8
B. Limited consideration of waste in climate policies 11
C. Rising environmental awareness and the introduction of waste management policies 13
II. CONTRIBUTION OF HOUSEHOLD PACKAGING WASTE RECYCLING TO MITIGATING
CLIMATE CHANGE 16
A. Background to the introduction of the EPR system for household packaging in France 16
B. EPR for household packaging: carbon footprint and financial incentives 20
III. EPR FOR HOUSEHOLD PACKAGING PROVES TO BE AN EFFECTIVE MEASURE IN
COMBATING CLIMATE CHANGE, BUT MORE PROGRESS NEEDED AS WELL AS
ADDITIONAL POLICY TOOLS 30
A. A recycling success story—with no pressure on the public purse 30
B. Increasing recycling to boost climate change mitigation efforts 31
C. Continuing the transition to a circular economy 35
CONCLUSION 37
BIBLIOGRAPHY 38
LATEST PUBLICATIONS IN CDC CLIMAT’S “CLIMATE REPORTS” SERIES 41

4
ABSTRACT
Waste management: impact on mitigating climate change
Waste processing accounts for 2.6% of total French greenhouse gas (GHG) emissions; however, a
more complex footprint lies behind this figure. If we consider that all products go through a life cycle and
that waste is but the last stage in that cycle, then the overall impact can only be assessed using a life-
cycle model. Reducing the quantity of virgin materials that will ultimately become waste reduces GHG
emissions related to their extraction, processing, transport and end-of-life treatment. In national
inventories, these different emission types are not measured under "waste", but are attributed to other
categories, notably "manufacturing industries", "energy industry" and "transport".
The Intergovernmental Panel on Climate Change (IPCC) puts the potential GHG reductions for the
global household waste sector at 670 Mt, or almost 2% of global emissions in 2012. Waste prevention
and recycling have the greatest potential for mitigating climate change in the sector. Yet, the reduction of
emissions which are a result of these measures are not directly visible in the data for waste in national
emissions inventories, since their main effect is to reduce consumption of non-renewable resources and
energy, which appear in other sectors of the inventory. Kyoto Protocol mechanisms take only partial
account of this GHG reduction potential, primarily due to the difficulties involved in measuring and
allocating emission reduction and the risks of double-counting. In addition, although the sector is not
directly included in the European Union Emissions Trading System (EU ETS), recycling is an effective
means for energy-intensive industries that use recycled material inputs and are covered by the allowance
directive (the steel, glass, paper and cardboard sectors) to shrink their carbon footprint.
A number of fiscal instruments targeting waste, such as the general pollution tax in France, can mitigate
the impact of waste management on climate change, although they are not strictly speaking GHG
reduction policies. Landfill taxes only come into play at the end of the chain and transfer the cost of
pollution on to the final holder. But prevention delivers the most efficient results when the target of the
mechanisms is the stakeholder with the technical potential and sufficient leeway to reduce pollution.
Based on this finding, Extended Producer Responsibility (EPR), which shifts part of the responsibility for
end-of-life management to the producer, is a potentially more inclusive model for encouraging prevention
and recycling.
This Climate Report assesses the contribution of the EPR model to mitigating climate change, drawing on
the case study of household packaging waste in France. It takes a life-cycle approach to the packaging
covered by these mechanisms, which in turn are regulated by the government body that sets national
targets, monitors progress towards achieving them, contributes to organising the sector and participates in
consultations with stakeholders.
EPR for household packaging: carbon footprint and financial incentives
At 67% in 2013, the rate of household packaging recycling has remained practically unchanged since
2011 for the majority of materials. According to an annual environmental performance assessment by
Eco-Emballages, a state-accredited private enterprise established to organise and finance recycling of
household packaging in France, the 3.2 Mt of recycled packaging that this figure represents reduces
GHG emissions by 2.1 Mt. This is calculated through comparison with a reference scenario where
household packaging waste is neither recycled, stored nor incinerated, the results take into account the
impacts generated by collection and materials recovery of the packaging, the material and energy savings
delivered by recycling, as well as the impact that would have been generated by an alternative treatment
process.
A comparative analysis that looks at the effects of both economic incentives and GHG reduction
measures highlights the role of each stakeholder in the material life cycle:
- Household packaging manufacturers incur a considerable share of the cost of selective collection and
recovery through their financial contribution. They are also in the best position to introduce waste
prevention measures, motivated by changes in their financial contribution, the potential to optimise
resources or by consumer expectations for more sustainable consumption. Although the positive

5
impact of prevention on climate, in addition to other environmental benefits of EPR, are not counted in
the environmental performance assessment, they could be visible on an individual packaging level.
Reducing packaging at the design stage is part of manufacturers' direct responsibility, but their
recycling obligation is performed by Eco-Emballages.
- Local authorities are responsible for managing household waste. Almost 80% of their net costs for the
selective collection of household packaging waste is borne by EPR. Their potential to reduce GHG
emissions lies in the use of instruments like waste management policies and regional climate change
mitigation strategies (like the Regional Climate and Energy Plan - PCET). To achieve their targets,
these stakeholders need the tools to ensure that material flows in the region are attributed back to
them.
- Consumers are also affected by the contribution to the cost of recycling, but to a lesser degree. That
cost is at least partially included in the price of the product, which means consumers pay some of the
environmental cost of what they consume. Households are a vital link in the recycling chain through
their consumption choices and their role in sorting and separating waste. These actions are motivated
by non-economic considerations, such as good citizenship, and are further encouraged by
environmental awareness campaigns. Their contribution may be non-financial in nature but is
nonetheless essential insofar as efficient sorting ensures that recyclable packaging is collected and
enters the recycling stream, instead of being incinerated or ending up in landfill.
- Downstream industries (recycling operators and recycled material users) have access to secondary
raw materials at competitive prices compared to virgin materials, thanks to the EPR system for
household packaging. By avoiding production of primary materials, the use of secondary raw
materials accounts for 93% of the emission cuts attributed to recycling. A value can be assigned on
these reductions in the form of carbon credits. Secondary raw material markets developed as the
EPR model was rolled out, providing industry with the advantage of competitive secondary raw
materials in an environment of escalating virgin material and energy costs.
Effectiveness of EPR for household packaging in mitigating climate change: a success story with
little pressure on the public purse
In 2013 in France GHG emissions were reduced by 2.1 Mt tons as a result of EPR for household
packaging. Emissions reduction was spread across the entire packaging life cycle, from production and
use to collection and recycling. The model was effective in rapidly increasing the recycling rate from 20%
in 1994 to 67% in 2011. Since 1992, more than 40 Mt of secondary materials have been put back in
circulation, reducing greenhouse gas emissions by several million tonnes. As governments and local
authorities tighten their control of expenditure, this model represents an effort to mitigate climate change
with minimum pressure on public finances.
The reference gross cost of selective collection and materials recovery of household packaging is
estimated at roughly €990 million per year, with €189 million generated by the sale of recycled materials.
Through their contribution to Eco-Emballages, household packaging manufacturers cover a large
proportion of these costs (€600 million), and the remainder is funded by local authorities. These operators
assume the majority of the cost of procurement of recycled material and are therefore responsible for the
resulting reductions in GHG emissions.
The EPR model accounts for an emissions reduction of 2.1 Mt CO2 eq. annually. We can therefore put the
average cost of GHG abatement at €490 per tonne; the proceeds from the sale of recycled materials
reduces this cost to €390 per tonne. When compared with policies to promote renewable energy and
clean transport, these costs fall into the lower end of the scale. Nonetheless, such comparisons are of
very limited value as the realities are quite different: transport and renewable energy promotion costs
relate primarily to investments in infrastructure for transport and to renewable energy subsidies for
electricity. Similarly, comparisons with the price per tonne of CO2 in the EU ETS call for caution, as the
trading system price is a function of supply and demand for emissions allowances that concern very
specific sectors covered by the system. There is a very little interaction between the recycling sector and
this type of market.

6
More progress needed, as well as additional policy tools
There is further potential to reduce the emissions associated with treatment of household packaging
waste:
- The first avenue available is to continue prevention campaigns. The potential for reducing the weight
of household packaging in the early stages of the process is limited by the technical requirements of
preserving its protective function. One objective of the Eco-Emballages accreditation was to reduce
packaging weight by 106,900 t, a target that was achieved in 2012 by reference to 2007. Turning to
the downstream sector, prevention initiatives are led by local authorities and may also include trialling
weight-based charges, or a local prevention plan that encourages sustainable consumption by
residents.
- The second avenue to explore to reduce emissions under the EPR model is to increase collection of
household packaging—and therefore the recycling rate—for example through voluntary drop-off
schemes. Encouraging sorting and separation of waste and optimising selective collection are core
components of the Materials Recovery and Recycling Stimulus plan, announced by the French
government and launched by Eco-Emballages in 2014.
- The third possibility is to increase the stock of recyclable packaging, particularly by developing plastic
packaging recycling schemes. A trial started in 2011 by Eco-Emballages demonstrates the genuine
potential and viability of this option, provided existing materials recovery facilities are overhauled.
Increasing recycling of plastic household packaging would also require a major public information
drive as well as new outlets for the recovered materials.
Such developments should be seen as part of the transition towards a circular economy. This circular
model being promoted by European and French policies seeks to increase resource efficiency and
product sustainability. While many operators may legitimately claim to contribute towards developing the
circular economy, genuine change is greater than the sum of sector-based and partial approaches.
Prevention and recycling is part of the solution but not the whole answer. From this viewpoint, the circular
economy paradigm extends beyond the EPR model, insofar as it seeks to introduce new value models,
including reuse, functional service and sharing platforms. Nonetheless, the EPR system remains a useful
framework for collaboration in the sector. As is evidenced by the series of changes in the household
packaging segment, the Extended Producer Responsibility framework is flexible enough to adapt to new
requirements or priorities.
The recycling rate for household packaging has tended to stagnate in the past few years, but selective
collection could inject new vitality into the figures, through a closer connection with general energy and
climate policies. As this Climate Report makes clear, the most proactive local authorities are those that
have incorporated waste management and recycling in a broader policy framework, together with their
Regional Climate and Energy Plan (PCET) and sustainable development policy, along the lines of an
Agenda 21.

7
INTRODUCTION
2014 saw important developments in waste management policies in France, with more set to come in
2015. Following on from the 2013 Environment Conference, France has embraced the concept of the
circular economy with a succession of initiatives (including the Second National Waste Prevention
Programme and Title IV of the draft energy transition law, amongst others). These measures are intended
to harmonise sector policies by steering the French economy towards a circular model to meet the
demands of the transition to sustainability. The European Commission had also embarked on a review of
a several directives relating to waste and packaging waste in a series of measures dubbed the "Circular
Economy Package". However, the new Commission withdrew these projects and announced its intention
to replace the package with more ambitious legislation in 2015.
The main waste policies currently in force date back to the 1990s and were rooted in a growing
awareness of the economic and environmental challenges associated with the steep increase in waste
quantities. The impact of waste management on climate change is a relatively new concern in this policy
area, as direct greenhouse gas (GHG) emissions from waste processing account for only 2.8% of global
emissions (2.6% in France). However, indirect GHG emissions from the waste life cycle included in the
emissions for other sectors—such as industry, energy and transport—are far more significant.
Accordingly, improving management of waste, and therefore of resources, would substantially reduce
greenhouse gas emissions. Given priority in the legislation, waste prevention and recycling have the
highest potential to mitigate climate change.
Climate will be at the forefront in France in 2015 as it hosts the 2015 Paris Climate Conference (COP 21).
Waste sector operators and CDC Climat will focus on the role the sector could play in transitioning to a
low-carbon economy during this decisive year.
France adopted the pioneering Extended Producer Responsibility (EPR) policy to boost recycling of
household packaging. Within this framework, the producer's responsibility for a product is extended to the
post-consumer stage, and consumers are offered material recovery and recycling solutions for their
packaging waste. As well as selective waste collection and the development of industrial recycling
streams, the household packaging EPR scheme has the additional benefit of pushing producers towards
green packaging design by encouraging them to reduce packaging at source and enhance recyclability.
The objective of this Climate Report is to examine the links between selective collection, recycling and
GHG emissions in the EPR model to assess its contribution to mitigating climate change, illustrated by a
case study of household packaging in France. The report aims to throw light on the factors that promote
reductions in GHG emissions, at all stages from production to reuse of recycled materials. It assesses the
EPR system by highlighting the complementary policies that could encourage prevention and increase the
recycling rate of household packaging, and, as a result, the model's contribution to countering climate
change. Lastly, the report shows that the EPR model was one of the forerunners of the circular economy
concept and demonstrates how it fits with regional, national and European resource management and
environment policies.
8
I. WASTE MANAGEMENT: IMPACT ON MITIGATING CLIMATE CHANGE
A. Greenhouse gas emissions and waste management
Increase in waste volumes and recovery options
Around 1.5 billion tonnes of household waste are disposed of every year throughout the world, and this
trend is increasing: The Inter-Governmental Panel on Climate Change (IPPC) is forecasting 2.2 billion
tonnes by 2025 (2014 IPCC) in its 5th assessment report.
Once collected, there are several options for treating waste. If the waste cannot be avoided, re-used or
reconditionned, it can be recycled, converted into fuel, incinerated (with or without waste-to-energy
recovery) or sent to landfill. Alternative options such as methanisation and composting are also being
developed for biological waste treatment. These various options are used to a greater or lesser extent,
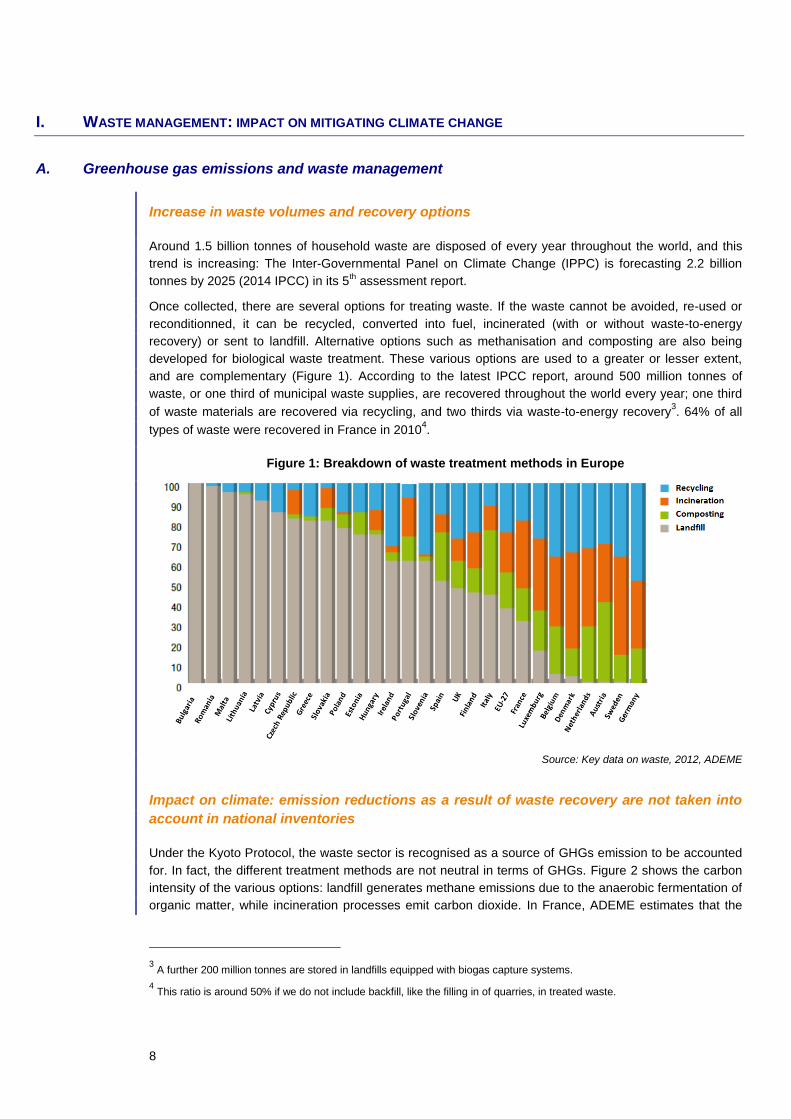
and are complementary (Figure 1). According to the latest IPCC report, around 500 million tonnes of
waste, or one third of municipal waste supplies, are recovered throughout the world every year; one third
of waste materials are recovered via recycling, and two thirds via waste-to-energy recovery3. 64% of all
types of waste were recovered in France in 20104.
Figure 1: Breakdown of waste treatment methods in Europe
Source: Key data on waste, 2012, ADEME
Impact on climate: emission reductions as a result of waste recovery are not taken into
account in national inventories
Under the Kyoto Protocol, the waste sector is recognised as a source of GHGs emission to be accounted
for. In fact, the different treatment methods are not neutral in terms of GHGs. Figure 2 shows the carbon
intensity of the various options: landfill generates methane emissions due to the anaerobic fermentation of
organic matter, while incineration processes emit carbon dioxide. In France, ADEME estimates that the
3 A further 200 million tonnes are stored in landfills equipped with biogas capture systems.
4 This ratio is around 50% if we do not include backfill, like the filling in of quarries, in treated waste.

9
annual emissions from landfill sites amount to over 11 mtCO2e5; meanwhile, emissions from incineration
plants have been calculated at 6 mtCO2e per year, i.e. 1.6% of French emissions. The trend for emissions
from landfill is downwards (-2% per year), while the trend for emissions from incineration is stable
(ADEME, 2014).
Figure 2: Average carbon intensity of different waste treatment routes for each material (in kgCO2e
per tonne treated)
This figure has been produced using the Base Carbone®, a public database provided by ADEME for the purpose of drawing up regulatory or voluntary GHG assessments. The emission factors shown include the transportation of the waste to the place of treatment, and incorporate the emissions avoided thanks to recovering waste as materials or energy. In the case of landfill and incineration, these are average suggested factors between options involving greater or lesser energy recovery.
Accordingly, the negative emission factors for the incineration of paper and cardboard reflect the widespread use of relatively effective waste-to-energy recovery options; recycling nonetheless remains an attractive option, since, by extending the materials’ life cycle, it enables many other environmental effects to be avoided, while its impact in terms of GHG emissions may be slightly positive or negative, depending on the type of paper and cardboard and of the treatment processes (de-inking, etc.) required.
Source: CDC Climat Research, based on data from the ADEME Base Carbone ®
In France, emissions from the “waste treatment6” sector calculated in the national inventory have
remained relatively stable since the 1990s. In 2012, they accounted for 2.6% of national emissions (i.e.
19.9 mtCO2e; Figure 3). This proportion is of the same order of magnitude as the world average, which
amounted to 2.8% (French Ministry for the Environment, Sustainable Development, and Energy & CDC
Climat, 2014).
5 450,000 tonnes of CH4 per year, i.e. 19% of national methane emissions.
6 See specifically the OMINEA method, which was used by the French Technical Inter-Professional Centre for Atmospheric
Pollution Research (CITEPA) to draw up national inventories in France as part of the UNFCCC, and which relies on the 2006
IPCC Guidelines for National Greenhouse Gas Inventories.

10
Figure 3: Change in GHG emissions per sector in France between 1990 and 2012 (CITEPA)
Source: CITEPA, “climate plan” format - 2014
From this perspective, the importance of the “waste treatment” sector may appear marginal compared
with other sources of emissions like transportation or agriculture, which accounted for 27.9% and 20.5%
of French GHG emissions respectively in 2012. However, by accounting solely for direct emissions from
waste treatment, this figure hides a more complex carbon footprint, and does not allow the correct
identification of emissions reduction drivers. In fact, waste is only the ultimate stage of the life-cycle of a
product, for which the overall greenhouse gas impact can only be understood by adopting a life-cycle
perspective. Reducing the amount of virgin materials that will ultimately be turned into waste will avoid
GHGs emissions from the extraction, processing, transportation, and end-of-life treatment of materials.
These various kinds of emissions are not accounted for under the “waste” sector in national inventories,
but in other sectors, such as “manufacturing industry”, “energy industry”, and “transportation” (Figure 3).
The summary performed by the IPCC puts potential GHG emission reductions for the household waste
sector at 670 million tonnes on a global basis, i.e. around 2% of total emissions in 20127. Accordingly, this
sector does indeed have an important role to play in efforts to mitigate climate change.
Prevention and recycling: the primary options for cutting waste-related GHG emissions
Reducing the amount of waste at source is the first driver for mitigation initiatives. It may involve the eco-
design of products at the manufacturing stage, or else consumption choices promoting the products that
generate the least waste. This is the most direct way to avoid the extraction and entry into circulation of
new quantities of materials and the generation of waste, and hence to avoid the GHG emissions linked to
each stage of the materials’ life-cycle. However, these avoided emissions do not appear directly in
national inventories, as they only take in account direct emissions from facilities. The overall savings from
waste prevention actions are hence hard to see, as they are diluted across other sectors, such as the in
the transportation or industrial sectors.
Using a life-cycle approach, recycling is the second main driver for reducing emissions in the waste
sector, with an abatement cost that varies significantly depending on the categories of waste, but that can
be low, or even negative. Recycling avoids the use of virgin materials, and hence the use of the natural
resources required to produce them. Furthermore, it also diverts a flow of waste away from landfill and
incineration, and therefore avoids GHG emissions generated by these types of treatment. According to
ADEME, recycling would actually avoid the emission of 19 million tonnes of GHG emissions every year in
France (ADEME, 2014). As for reduction at source, these avoided GHG emissions are not accounted for
7 As an order of magnitude, scientific estimates (like those of the Potsdam Institute) put the carbon “budget” remaining before
the 2 °C warming threshold is exceeded at 565 GtCO2e.

11
under the waste management sector. For instance, producing one ton of glass out of recycled material
prevents the emission of 0.5 t of GHG in the atmosphere thanks to energy saving during melting (cf. box
1). This reduction is accounted for under the industrial sector.
This observation is reflected in policies with the introduction of the waste hierarchy. This principle, which is
included in Article 1 of the 2008 Framework European Waste Directive8, alongside the polluter pays
principle, determines an order of priority for waste treatment options, by promoting prevention first of all,
then preparation for re-use, recycling, waste-to-energy recovery, and lastly disposing of waste9 as the
ultimate option, as shown in Figure 4.
Figure 4: Waste hierarchy
Source: CDC Climat, based on IPCC 2014
Climate change mitigation strategies only partially account for the GHG emissions reduction potential of
the waste sector. However, these strategies and tools on which they are based are relatively recent,
although waste management policies have been in place for several years.
B. Limited consideration of waste in climate policies
Kyoto Protocol project mechanisms on waste: additionality poses difficulties for
developed countries
Under the Kyoto Protocol, for which the application period has been extended until 2020, developed
countries that have committed to reducing emissions10
may take measures concerning or affecting the
waste sector. To achieve their targets, these States may therefore use the Protocol’s flexibility
mechanisms, namely trading carbon credits, and project mechanisms. The purpose of the latter is to
finance projects aiming at reducing GHG emissions in developing countries (clean development
mechanism, or CDM) or in developed and/or transitional countries (joint implementation, or JI), and hence
to obtain allowances for the emissions reduced, in comparison with a reference scenario.
To date, around 1,000 projects of this kind have involved the waste sector on a world-wide basis,
including 944 CDM and 98 JI projects. These projects primarily involve the capture of landfill biogas,
waste-to-energy recovery as a result of incinerating waste, composting, and projects aiming at the
8 2008/98/CE Directive
9 Incinerating waste or sending it to landfill without recovering it as energy
10 Listed in Annex B of the Protocol.
Prevention
Reuse
Recycling
Energy recovery
Disposal

12
remediation of 11
industrial storage sites. All the JI projects of this kind are located in Eastern Europe,
primarily in Ukraine.
There is only one CDM12
methodology for recycling projects (Peterson, C. & Godin, J. 2011). Developed
by the World Bank based on an experiment in Argentina, this methodology considers the existence of an
informal waste economy. The aim is to support the emission reductions resulting from the use of
secondary raw materials (recycled plastic and paper & cardboard) in the manufacturing of new products.
CDM and JI projects must prove their additionality, i.e. they must show that they enable GHG reductions
that would not have occurred otherwise, for instance due to already existing regulatory requirements that
apply to the concerned sector (environmental additionality), and without the resale of carbon credits
(financial additionality). To achieve this aim, the World Bank methodology relies on reference scenarios
where there is no or minimal recycling infrastructure, and no waste recovery targets. In that respect, this
methodology is particularly well-suited to developing countries, where the waste sector is not formally
organised and is not subject to specific regulations. In Europe, waste treatment sub-sectors usually
include regulatory recycling targets, which are regularly revised. Even if recycling targets are not GHG
emission reduction targets per se, it is particularly hard to justify additional emission reductions. The
additionality criterion significantly restricts opportunities to use project mechanisms for financing emission
reductions resulting from the recycling of waste in countries such as France.
EU emissions trading system excludes the waste sector
The waste sector is not directly included in the European Union Emission Trading System (EU ETS). The
main reasons presented by the European Commission are the high level of uncertainty regarding waste
emission factors as well as the lack of accurate business data (European Commission, 2006). A report on
the potential widening the scope of the EU ETS issued by the Commission considered the option of taking
emissions relating to the incineration of waste into account. This idea was ultimately abandoned, as the
facilities concerned were mostly already subject to specific European and national regulations.
In contrast, some energy-intensive industries that use recycled materials such as the glass, cardboard, or
steel industries are subject to the Allowance Directive. As discussed in Box 1, recycling enables these
operators to save energy by promoting their access to secondary raw materials, and is therefore a way to
achieve the targets to which they are subject.
This quantification of recycling in the form of carbon allowances explains the fact that avoided emissions
cannot be taken into account under project mechanisms. Indeed, they cannot be valued and recognised
twice. Accordingly, industrial companies that are subject to carbon allowances and use recycled materials
are the ones that benefit from the avoided emissions from recycling under the EU-ETS.
11 Cleaning and decontamination.
12 The methodologies linked to the Kyoto Protocol flexibility mechanisms determine how emissions must be measured,
monitored and verified for each kind of project (definition of the benchmark levels, and calculation instruments and methods
used, etc.). Each methodology must be validated, approved and registered by a dedicated United Nations Framework
Convention on Climate Change organisation.

13
Insert 1: Promotion of recycling for industries covered by the EU emissions trading system (EU-
ETS): glass
Glass manufacturing is an energy-intensive industry included in the European Emissions Trading Scheme
(EU ETS). The cap-and-trade based system was introduced to cap CO2 emissions by industries covered
by the scheme through the introduction of quotas, each equivalent to one tonne of CO2. Each facility
receives an initial annual allowance and each year must surrender enough allowances to cover all its
emissions in the previous year. The financial benefit of the market lies in the ability to trade allowances,
which promotes cost-effective emission reductions by the industries in the system. Facilities that can cut
their emissions at the least cost can sell their spare allowances to industries with higher carbon-reduction
costs. The scarcity of supply on the market arises from the cap on allowances. By putting a price on
carbon, the EU ETS encourages companies to reduce their emissions.
Since every tonne of recycled glass (cullet) reduces emissions into the atmosphere by 500 kg of CO2 eq.,
increasing the ratio of cullet used as a material in glass production has yielded a continuous improvement
in the industry's carbon emission factors, i.e. the quantity of CO2 eq. per tonne of glass produced.
No carbon tax on waste in France, but Australia put it to the test
As there is no greenhouse gas emission tax (“carbon tax”) in France, the waste sector is not covered by
this kind of mechanism either, although such a mechanism did exist in Australia.
When introducing its carbon pricing mechanism, Australia decided to include the waste sector, which
accounted for 3% of its domestic emissions in 2010, i.e. 15 mtCO2e. By making this choice, the Australian
Government wanted to promote the recycling of waste, and waste-to-energy. The tax was effective from
1st July 2012 to 1
st July 2014. It was meant to develop into a carbon allowance trading system by 2015,
but was abolished following a change in the majority political party. All Australian facilities with direct
emissions exceeding 25,000 tCO2e per year were subject to this tax. The initial amount was AUD 23
(€15.70) per tCO2e, increasing at an annual rate of 2.5% in 2014 and 2015. This amounted to AUD 35.70
(€24.30) per tonne of waste sent to landfill according to an estimate issued by the Australian Landfill
Owners’ Corporation. The tax applied to landfills and to waste incineration centres. However, the
managers of the facilities concerned were often local authorities that could pass this tax onto their
customers, and therefore make households and business operators pay the cost of incinerating and
storing waste. Based on an average of 0.88 tonne of non-recovered waste per inhabitant per year, the tax
amounted to around AUD 31 (€21.10) per inhabitant per year, i.e. AUD 722 million (€491 million) in total.
This mechanism better accounted for the cost of storage, and created an incentive for preventing
emissions by developing not only biogas capture processes, but also alternatives to landfill, such as
recycling, or waste-to-energy. As the Australian system was only in place for two years, it is hard to
assess how effective it was.
To date, this was the only carbon pricing mechanism that included the waste sector. However, the New
Zealand CO2 allowance system includes a portion of the methane emissions from landfills, while the future
trading scheme in South Korea is also expected to take the sector into account. Furthermore, although
they are not GHG emission reduction policies, other tax schemes concerning waste, such as the general
levy on polluting business activities (TGAP) in France, may mitigate the impact of waste management on
climate change, as detailed below.
C. Rising environmental awareness and the introduction of waste management policies
National waste strategies informed by the European policy framework
A movement to take charge of and coordinate the issue of waste by government authorities at the French
and European level emerged in the wake of the rise of environmental awareness as from the 1970s (first
French law regarding the disposal of waste and the recovery of materials in 1975). Sending waste to

14
landfill on a quasi-systematic basis had begun to appear as a problem, and a need to manage waste
properly was gradually expressed.
A European political framework for waste was then established in the 1990s, based on several directives
that were updated on a regular basis, such as the 2008 Waste Framework Directive, the 1999 Directive
on the Landfill of Waste, or the 1994 Packaging and packaging waste Directive. In fact, since 2008 and
the publication of the Raw Materials Initiative, the European Union has been seeking to ensure
sustainable access to resources at a reasonable cost13
.
The European Union Member States are applying the European targets at the national level via their own
strategies (e.g. Waste Action Plans and National Waste Prevention Plans) and regulatory measures (the
Grenelle Round Table Laws in France, and the more recent Planning Act for the Transition to a Low-
Carbon Economy). As shown in an overview prepared by the OECD (OECD, 2004), countries often use
combinations of economic measures in order to achieve the targets. Two main categories of policies
supplement one another, i.e. tax mechanisms that usually focus on end-of-life products, and extended
producer responsibility schemes.
Mechanisms focused on end-of-life waste
Pursuant to the principle of waste treatment hierarchy, most existing waste management policies are
aimed first and foremost at limiting final storage to the maximum extent possible, and at encouraging the
reduction of waste at source, as well as the recovery of waste in the form of materials and energy. The
introduction of a tax on landfill is one of the most widespread initiatives in Europe (European Topic Centre
on Sustainable Consumption and Production 2011). The level of European taxes ranges between €3 per
tonne of waste in Bulgaria to €107 in the Netherlands. In France, the stated objective of the 2014 reform
on the general tax on polluting activities is to make recycling more competitive by increasing the storage
tax basis (which amounts to €30 per tonne in 2014), and to apply it to incineration as well (Ministry of the
Environment, Sustainable Development, Transport and Housing, 2011).
Assessments of existing policies show a significant correlation between high tax bases and the
percentage of recycled waste. According to research conducted for the European Commission, EU
Member States are much more likely to achieve a recycling ratio of 50% (the European target for 2020) if
the cost of landfill exceeds €100 per tonne of waste (BIO IS for the European Commission, 2012).
Accordingly, the widespread application of a €40 per tonne tax in Europe would enable to avoid the
emission of 48 mtCO2e on a stand-alone basis.
In some countries, the tax base is calculated by factoring in the GHG emission criterion, and makes the
relationship between managing waste and combating climate change more explicit.
- In the United Kingdom, a landfill tax was designed as an environmental tax in 1996; this tax applied to
the managers of storage facilities, and aimed to make this option, which was by far the preferred
option in the country at the time, less competitive (Davies, B. & Doble, M. 2004). As methane
emissions have been identified as the main source of damage, they were assessed and converted
into an equivalent cost per tonne of CO2. Two rates per tonne were determined: a low stable rate
(£2.50 or €3.05 per tCO2e) for non-organic waste, and another higher, and specifically rising rate for
organic waste, which reached £80 (€97.60 per tCO2e) in 2014. These amounts exceed the calculated
cost of the environmental impact, and were determined in order to change behaviours.
- A landfill tax has been in effect in Norway since 1999 (Martinsen, T. & Vassnes, E. 2004). Waste
treatment facility managers pass the amount of the tax applied to their activity on to households, who
see their levy increasing. Direct indexation of this tax on GHG emissions was considered difficult and
13 See specifically The Roadmap to a Resource-Efficient Europe adopted in 2011, and included in the 7
th Environmental
Action Programme.

15
expensive. The tax is therefore calculated on the basis of the weight of household waste. The rate
has been set at €39 per tonne of household waste for facilities that comply with the requirements of
European standards, and at €51 per tonne for other facilities (Martinsen, T. & Vassnes, E. 2004). A
significant increase in the recycling rate over this period is observed, together with a sharp fall in the
amount of waste landfilled (from 25% to 6% between 2001 and 2010), as well as with an increase in
incineration (from 30% to 50%). At least some of this change can be attributed to the tax regime,
although other policies, such as incentives for waste-to-energy, as well as a total ban on the storage
of bio-degradable14
waste were also contributing factors. Accordingly, net emissions generated by the
treatment of household waste in Norway fell from 1.114 mtCO2e in 1990 to 0.271 mtCO2e in 2010.
However, this kind of tax is only applied at the end of the chain, by making the final waste holder bear the
pollution cost. In contrast, the aim of the polluter pays principle, which was determined by the OECD in
1972, is to make each economic operator take the negative impact of their business activities into
account15
. Taking into account the end of life of products, gives to their designers an incentive to eco-
design. The effectiveness of prevention is increased when the targeted operator has actually the technical
leverage to reduce such pollution. Extended Producer Responsibility (EPR) introduces the sharing of
responsibility between the producer of the waste (the consumer who chooses to buy the product) and the
manufacturers of the products which shall become waste, who must offer their consumer-customers an
appropriate system for managing it. These EPR mechanisms, which are very widespread in Europe, are
hence a potentially more inclusive framework for encouraging the prevention and recycling of waste via
the mechanisms set out below, and for maximising GHG emissions reductions accordingly.
Sectors covered by the Extended Producer Responsibility model: a desire for more
integrated action from end to end of the waste chain
According to the OECD definition, extended producer responsibility (EPR) is a “policy approach under
which producers are given a significant responsibility – financial and/or physical – for the treatment or
disposal of post-consumer products. Assigning such responsibility could in principle provide incentives to
prevent wastes at the source, promote product design for the environment and support the achievement
of public recycling and materials management goals. (OECD, 2001).
EPR emerged in the 1980s as an answer to the sharp increase in the amount of waste that local
authorities were required to manage (ADEME, 2012a).
To fulfil their obligation to manage waste under the EPR Scheme, product manufacturers may take direct
charge of managing the waste that their products shall turn into (individual systems), or pool their efforts,
by contributing to the management of this waste by a company which they govern, that organises the
management, or relies on local authorities to organise it, depending on the product considered. The
selected framework primarily depends on the characteristics of the waste flow to be dealt with. Several
models for organising EPR for considered products co-exist, in accordance with voluntary or regulated
approaches. Many of the products that are currently covered by EPR in Europe today were established
via consultation between products producers and government authorities.
Most EU countries count more than one EPR scheme. Three of these EPR schemes are governed by a
European obligation, namely batteries, waste of electrical and electronic equipment, and the automotive
sector. France is the country that relies most heavily on this policy, with around 20 EPR schemes in total.
Four of them (EPR schemes for lubricants, household packaging, fluoride refrigerants, and drugs) were
set up in order to meet European requirements although the use of EPR scheme was not established in
the considered Directive, while seven others are the result of national policies. Lastly, some initiatives
14 The ban has been in effect since 2009; in fact, the largest reduction in sending waste to landfill occurred between 2009 and
2010, when the percentage sent fell from 14% to 6% in one year.
15 Including social and environmental costs.

16
result from entirely voluntary approaches from industrial companies which want to demonstrate their
commitment to the environment, and to avoid potentially more restrictive obligations.
The following section of this Climate Report seeks to assess the contribution of the EPR as a mean
contributing to reducing greenhouse gas emissions. This section looks at the life-cycle stages affected by
the EPR scheme, and seeks enhance the understanding of how climate-related issues can be
coordinated with existing policies, without questioning the existence of this policy. The assessment is
based on the case study of the Household Packaging EPR scheme introduced in 1992. This EPR scheme
is the oldest in France, as well as the largest, both in terms of tonnes of waste managed and of financial
flows.
II. CONTRIBUTION OF HOUSEHOLD PACKAGING WASTE RECYCLING TO MITIGATING CLIMATE CHANGE
A. Background to the introduction of the EPR system for household packaging in France
Stock of recyclable household packaging in French rubbish bins
On average, each French resident produced 314 kg of household waste in 2010, i.e. a total amount of 24
million tonnes for the country as a whole (ADEME 2014), including 4.7 million tonnes of household
packaging (ADEME, Eco-Emballages, and Adelphe 2012).
Household packaging materials can be classified into five categories: steel, aluminium, plastic, cardboard,
and glass. Figure 5 provides a breakdown of household packaging by material:
Figure 5: Breakdown of household packaging supplies by material
Source: Eco-Emballages, 2014
The weight of the household packaging brought to the market per inhabitant has been decreasing over
the past few years, falling from 80 kg per inhabitant in 1994 to 76 kg in 2009 (ADEME, Eco-Emballages,
and Adelphe 2012). The main explaining factors for this decrease are the changes in consumption
choices, the economic environment resulting from the financial downturn, as well as choices in packaging
design and technological improvements, including the implementation and use of new materials.
However, as shown in Box 2, reducing packaging at source, and therefore decreasing supplies, is limited
by the need to maintain the essential functions of packaging. Besides reducing waste at source and
making different consumption choices for a given product such as drinking tap water rather than bottled
water, recycling is the main option for reducing the overall impact of household packaging.
67% of packaging waste were recycled in 2013, i.e. about 3.2 million tonnes. As shown in Figure 6, this
recycling rate has not increased much for most materials since 2011, with the exception of glass. For
steel, it has already reached the maximum level. There are strong disparities between rural and urban
households: the former recycle 54 kg of packaging per inhabitant per year while the latter recycle 30 kg

17
(Eco-Emballages, 2012a). The third section of this Climate Report will focus on the identification of
incentive mechanisms that can help to increase this recycling rate.
Figure 6: Change in recycling rate for household packaging
Source: Benchmark data for Household Packaging, ADEME 2013
Insert 2: Potential for reducing packaging volume is limited by functional requirements
The functions of packaging include protection (against impact, temperature fluctuations, light, foreign
bodies and pathogens, amongst others), logistics (transport and storage), and product conservation. As
the separation between production and consumption grows, in terms of both time and space, ensuring
these functions are not compromised becomes all the more important. Cities are a good example: they
are centres of high consumption but produce very little.
As consumer awareness of environmental issues has grown, so too has the demand for leaner packaging.
However, its essential functions must be maintained, even as the stock of packaging shrinks and industry
steps up its efforts to optimise and trim quantities to reduce the overall economic and environmental
impact. Used throughout the chain, including in bulk distribution or deposit charge systems, for re-use or
filling at the point of sale, packaging is still with us for the transport and preservation of goods until they
reach the consumer.
Totally eliminating packaging could have negative as well as positive impacts, including on climate
change. While it is true that packaging production, transport, and end-of-life processing generate GHG
emissions (as detailed in this report), taking it out of the picture could have an adverse effect and increase
emissions, since packaging helps product preservation and reduces waste, especially food waste. Lost
products mean wasted production resources. According to a study conducted by the British Waste and
Resources Action Program16
every ton of food we throw away generates 4.5 t CO2 eq. (Figure 2).
Operating principles of EPR for household packaging
An EPR scheme for household packaging was introduced in France via the creation of Eco-Emballages
and Adelphe in 199217
. These companies bear the responsibility of companies introducing packaged
products into the market, in exchange contribution of a fee. This organization reflects the choice of those
16 The food we waste, A study of the amount, types and nature of the food we throw away in UK household
17 This was an early response to the 1994 Packaging Directive, which was introduced in order to restrict the production of
packaging waste and encourage its recovery, by making the final disposal of that waste a solution of last resort. France chose
to set up an EPR sub-sector as a means of organising recycling in the country.
Steel
AluminiuCardboard &
Plastics
Glass
Recycling, all materialsSteel
Aluminium
Cardboard & paper
Plastics
Recycling, all materials
Glass

18
companies to meet the legislation in a coordinated manner. Eco-Emballages and Adelphe operations are
authorised by the Government for six years periods, according to detailed specifications and modalities of
verification
The overall amount of contributions collected from the members companies is determined in order to meet
the targets set by the specifications (requirement to finance selective waste collection and sorting, and the
other remits of the authorised company, such as raising awareness or research). The presence of the
“green dot” (Figure 7) logo on a packaging item means that its producer is a member of the system, and
thereby complies with its legal obligation:
Figure 7: “green dot” symbol
Source: Eco-Emballages
In 200518
, Eco-Emballages has merged with Adelphe which became its subsidiary. It is now the main
authorised company for the household packaging sector in France. It counts 50,000 member companies
using household packaging, and supports 36,502 local authorities grouped under 1,139 contracts, which
represented 99.6% of the French population in 2013.
In the French organisation, local authorities collect packaging waste resulting from products consumed or
used at home. They are paid by Eco-Emballages in exchange for this service. Since 2010 and the
Grenelle Round Table Laws, the fee paid by Eco-Emballages is required to cover 80% of the net
reference costs of an optimised waste collection and sorting service (including availability of collection
bins, dissemination of sorting instructions, reorganisation of the waste collection process, including
potential additional waste truck rounds, availability of voluntary waste drop-off points, and the separation
of materials at sorting facilities, etc.). For each local authority, the amount paid is calculated based on the
tonnage of household waste collected and sorted, and is therefore based on performance. Thus, the
largest portion of the cost of managing household packaging waste is financed today by the actors
responsible for putting it on the market, through the Eco-Emballages system. Another portion of the cost is
covered by the sale of sorted materials. The remainder is financed by local taxation.
In 2013, the total fees paid by companies amounted to €665 million, of which €611 million was repaid to
the local authorities in exchange for the selective collection of waste19
. The gross cost for collecting and
sorting household packaging waste is estimated at €990 million. Figure 8 shows the actors bearing this
cost: 62% is covered by these payments from Eco-Emballages, 21% by the sale of materials, and 17% by
local taxation. An increase in recycling rates, and hence in amounts collected, enables local authorities to
receive more payment from Eco-Emballages, and to generate more income from the sale of materials.
Furthermore, a decrease in the amount of packaging in households’ dustbins theoretically reduces the
cost of waste management borne by residents, local authorities and businesses.
18 The next sections of the report only mention Eco-Emballages, which also includes the data from Adelphe, its subsidiary.
19 €560 million of the €611 million is direct payments for local authorities, while the rest is made up of other forms of
payments, by or of initiatives such as awareness-raising initiatives (€12 million).

19
Figure 8: Breakdown of gross reference costs for collection, sorting and treatment in 2013
Source: Eco-Emballages
Figure 9 illustrates the EPR scheme for household packaging by highlighting the operators and financial
flows involved.
Figure 9: Diagrams showing the operators and main financial flows covered by the Household
Packaging EPR scheme
- The red arrows represent the main financial flows, based on the 2013 data.
- The blue links represent institutional ties: this is the way in which the European Commission sets targets for the Government, which turns them into obligations for producers; the authorisation specifications for the approved company are drawn up on a joint basis, and steer Eco-Emballages' initiatives.
- The grey arrows represent materials flows:
- Household waste removal tax and levy
Source: CDC Climat Research
Since 1994, the system has evolved with the legislation setting increasingly ambitious targets for the
recovery of packaging waste. For instance, European Directive 2004/12/EC of 11 February 2004
established recovery targets (recycling and waste-to-energy recovery) covering 60% of the weight of all

20
household, industrial, and commercial packaging by 2008, and including a recycling ratio of 55%. In
France, the Grenelle Round Table Laws of 3 August 2009 and 12 July 2010 established a target involving
increasing the materials recycling rate for household packaging waste to 75% by 2012.
B. EPR for household packaging: carbon footprint and financial incentives
This section focuses on the contribution of EPR to reducing greenhouse gas (GHG) emissions. 2.1 million
tonnes of GHGs were avoided in 2013 thanks to selective household packaging waste collection. This
environmental assessment was carried out by Eco-Emballages using a life-cycle analysis (LCA) approach
and is recalculated every year to reflect the tonnage of household packaging waste recycled for each
material.
The GHG balance is calculated in comparison to a reference scenario where the household packaging
waste is not recycled, but stored or incinerated according to the share of these waste treatment option in
France (36% and 64% respectively). Hence, this calculation takes account for:
- The impact of collecting and sorting household packaging;
- The avoided impact of recycling household packaging (materials and energy savings);
- The avoided impact of incineration and landfill as household packaging is sent to recycling.
Decisions and incentives enabled by the EPR scheme at each stage – from the production of the
household packaging to the re-use of the materials after recycling – are summarised below:
Figure 10: Implementation of the EPR Scheme at key stages, from packaging to waste
Source: CDC Climat Research
Following the stages set out in Figure 10, this section will focus on assessing the cross-over between
financial incentives ("economic analysis" part), and efforts to reduce greenhouse gas emissions (“carbon
impact” part).
Stage 1 - Packaging production: contribution and prevention incentives
Economic analysis: a mechanism that has primarily been designed for transferring end-of-life
costs, and that also seeks to encourage prevention of household packaging at an early stage
The total amount of the contribution to be collected from Eco-Emballages member companies is split
between them according to two main criteria:
- the weight of the packaging introduced to the market. It has been the primary criterion since the
system was created, as an incentive for packaging weight reduction; this weight-based pricing also
depends on the material;
- the number of units of which the packaging is composed, which provides an incentive for reducing the
number of components constituting the packaging.
In 2011, the modulation of the contribution according to certain eco-design criteria was enhanced with the
introduction of a 20% surcharge for packaging that disrupts the recycling process. This system was
extended to a bonus/penalty system in 2012. Two penalties were introduced: a penalty of 50% for
recyclable packaging that disrupts recycling processes, and a penalty of 100% for packaging included in
the separated collection system but for which no recycling route or no recovery option exist. Bonuses
Stage 1 : Production of the
packaging
Environmental contribution and
prevention
Stage 2: Introduction of a selective sorting
process
Payment to local authorities
Stage 3: Sorting practices
Optimizing the amounts recycled
Stage 4: Recycling of
materials
Organising market outlets

21
apply to companies placing on-pack sorting instructions or undertaking packaging prevention actions (i.e.
reducing the weight or volume of the packaging, or switching to refillable packaging).
Based on the currently pricing structure, the fee paid to Eco-Emballages may represent up to 4% of the
sale price for some basic products like water, and a few tenths of a percent for everyday products, like
0.25% for a jam jar20
. This amount may be negligible for products where the cost of the packaging is low
compared with the sale price for the product (e.g. luxury goods).
During the first ten years of the Household Packaging EPR scheme, the main challenge was to get as
many operators as possible to join the system, and to expand the national coverage of the selective waste
collection system. Over the years, continuous improvement of knowledge about packaging waste stream
allowed for the pricing scheme to evolve in order to enhance the effectiveness of this mechanism in terms
of prevention. Thus several components were introduced in the definition of the pricing scheme: the
differentiation between materials, the inclusion of the number of packaging components, and then the
bonus/penalty system for packaging that disrupt recycling processes. Strengthening the modulation of the
pricing scheme based on ecodesign criteria was the 248th commitment of the Grenelle Environmental
Round Table, which recommended “initiating work to modulate the financial contributions under the
existing EPR Scheme in order to foster prevention – including the prevention of packaging”.
This system of contribution introduced via the EPR Scheme supports eco-design approaches relating to
end-of-life of household packaging: businesses are seeking to optimise the amount of their contribution,
as it can reach up to several million euros for some large food processing groups. In addition, Eco-
Emballages provides a set of tools and services, together with support for R&D programmes, in order to
help businesses to anticipate design choices (training, free LCA software, on-site diagnosis by experts, a
web based catalogue of best practices, etc.).
Businesses’ eco-design initiatives are also motivated by other benefits. Reducing the weight of household
packaging, and therefore the amount of materials purchased as well as the associated transportation
costs is an important source of savings that is often more significant than their fee to the EPR Scheme.
For instance, the production of a large mineral water bottling firm may be numbered in billions of units.
According to Eco-Emballages, an eco-design effort to reduce the packaging weight by 14% for a billion
PET bottles (i.e. roughly 2 g per bottle, which is a major effort), saves 4,700 tonnes of plastic, as well as
avoids the emission of around 10,000 tCO2e. In addition, packaging costs are reduced by14%, i.e. around
€7.7 million. Savings on raw materials costs account for around 70% of the 14% figure (i.e. €5.3 million),
while the reduction in the contribution accounts for 30% (i.e. €2.4 million, this reduction is proportional to
the weight, and includes a bonus of 8% for awareness-raising initiatives).
Furthermore, packaging design is a highly competitive business, since packaging is a sector where
innovation may provide a competitive advantage and a strategic differentiation factor for the product in
stores compared with competitors. Aside from technical innovation, the eco-design of products can also
be restricted or strengthened depending on the product positioning and brand image conveyed by the
packaging. The design of the packaging meets challenges relating to the visibility and identification of the
product where consumers are concerned. A reduction in packaging that would result in this packaging no
longer being visible on store shelves would cancel out the environmental benefit by switching
consumption choices to products that have not been eco-designed. It would therefore represent a
financial risk for the business. This means that awareness-raising initiatives are required in order to
encourage consumers to make more sustainable consumption choices.
Packaging is an information channel in itself. It is sometimes used to communicate about products'
environmental footprint, and the prevention efforts made. Some businesses also use their eco-design
initiatives as a direct communication point to raise consumers’ awareness on environmental issues.
20 These estimates were drawn up using the Eco-Emballages pricing system and indicative prices (€0.25 for a water bottle,
and €1.60 for a jam jar).

22
According to a survey carried out by the French Pôle Ecoconception and the Product Development
Institute in 2014, most companies believe that their customers are sensitive to this type of claims.
Carbon footprint: the overall benefits of prevention not taken into account
The GHG savings from prevention are not directly taken into account when calculating the environmental
balance of the EPR scheme calculated by Eco-Emballages. However, these savings can be made visible
for each packaging item when we consider the change in the environmental footprint of the packaging
supply, which is explained by:
- the weight of each packaging unit (same function and material);
- the material used;
- the content of the packaging.
A reduction of 309,000 tonnes in the tonnage of household packaging brought to the market between
1997 and 2009 was observed on 10 mass consumption markets studied by ADEME, the French National
Packaging Council, and Eco-Emballages in 2012. Changes in packaging materials was identified as the
factor contributing the most to this decrease in weight, and that enabled the carbon footprint of the
packaging to be reduced by 2%. Changes in the packaging volumes (increased concentration of products)
had a lesser impact in terms of weight, but contributed to reducing the carbon footprint of the packaging
by 5%.
Insert 3: 100,000 t prevention target met
In 2008, Eco-Emballages teamed up with the French Association of Food Industries (ANIA) and the
Liaison and Studies Institute for Consumer Industries (ILEC) to propose a voluntary initiative under
France's Grenelle Environment Round Table aimed at reducing packaging at source.
In 2010, the Eco-Emballages accreditation procedure included a target reduction of 100,000 tonnes of
household packaging, calculated according to equivalent material and equivalent functional units in the
period 2007 to 2012. The target is consistent with ongoing reductions in household packaging on the
market inventoried in 1997 and 2012. Some 200 companies participated demonstrating that green design
is not only possible but viable. The target specifically aimed to identify actual examples of household
packaging measures by companies that could be used as the basis of best practices.
According to an approximate calculation, emissions were reduced by roughly 145,000 t CO221
eq. as a
result of cutting household packaging by 100,000 tonnes between 2010 and 2012, in addition to the more
than the 2 Mt.CO2 eq. reduction per year as a result of recycling household packaging. The drive
continues, bringing the total reduction to 110,000 t at year-end 2013. Nonetheless the potential for
reducing packaging weight is not endless. Manufacturing industries engaged in these initiatives feel that
they have reached the limits of what is possible, given the standards applicable to packaging, the need to
retain its protective function, as well as physical and financial constraints.
Stage 2 - Selective collection: payment to local authorities
Economic assessment: part of the costs absorbed for local authorities that retain control of waste
services
In 2013, direct payments to local authorities amounted to €560 million, amount that increased by 40%
since 2009. This increase was primarily due to the extension of the application of the fee scheme since
2011 (application of the so-called “E” scheme) but also to the increase in the effectiveness of the
collection process to a lesser extent. In fact, these fees are paid to the local authorities that have entered
21 Estimates based on the weight reduction per material, and average emission factors per material available in BEE – the
packaging LCA tool developed by Eco-Emballages. See http://bee.ecoemballages.fr/pdfdoc/guide_donnees_bee.pdf for more
information

23
into an agreement with Eco-Emballages, according to a specific pricing schedule where the main aim is to
encourage the expansion of selective waste collection and recycling. These payments are therefore
primarily based on a single rate per tonne of material collected and sorted. Additional payments support
other forms of recovery besides recycling, as well as awareness-raising initiatives.
The E pricing scheme (Table 1) is determined on the basis of a so-called "optimised22
” collection process,
which means that they are not calculated according to the actual cost borne by local authorities – which is
not always well known - , but according to a single reference cost across France. This means that local
authorities still have a strong incentive, which is both financial, as well as political where the citizens are
concerned, to optimise the sorting and selective collection of waste, in order to minimise its cost.
Eco-Emballages introduced a Sustainable Development Fee (SDF) in 2011, in order to provide incentive
for local authorities to improve the collection and sorting of waste. The payment of this fee is based on
nine sustainability indicators (three financial, three social, and three environmental indicators) enabling the
local authority to monitor the trend in its results and to compare its performance with that of other local
authorities. Reference levels to reach are determined for each indicator. 62% of the local authorities that
have an agreement with Eco-Emballages claimed this fee in 2012. Although the Sustainable Development
fee only represents a small portion of the fees paid to local authorities (1.3%, as detailed in Table 1), it
has been designed first and foremost as a management tool, in order to gain a better understanding of,
and exchange information relating to the cost of selective waste collection, the resulting jobs, and
accidents, as well as the carbon footprint. The Fee enables the local authority to identify the actual impact
of its selective waste collection system, and to compare its results with the data for similar local
authorities. Local authorities use the SDF as a set of indicators rather than of targets, since the lack of
historical benchmarks does not yet enable them to position themselves or to set specific targets in
advance.
Table1: Amount of the Fees paid to regional authorities in 2011 and 2012
Source: French Court of Auditors (data from Adelphe & Eco-Emballages)
Carbon footprint: emissions totalling 0.31 Mt CO2eq. and considerable room for manoeuvre
According to Eco-Emballages’ environmental balance calculation, the collection of household packaging
and activities relating to sorting that packaging amounted to 0.31 mtCO2e, based on the recycling of 3.2
million tonnes of household packaging. This amount takes into account the manufacturing of the bins
provided for sorting the waste (18%), the selective collection (61%), the transportation of the waste (15%)
and the sorting facilities operations (6%).
22 The net benchmark costs for an optimised waste collection and sorting service are determined by the Government
Authorities based on work performed by a working group made up of stakeholders in 2010. They are based on an observation
of the costs known at that time and on theoretical optimised cost calculation conventions, as well as on average prices for
returning and/or reselling the sorted materials.

24
The carbon footprint of the selective waste collection and sorting process is included in the SDF
indicators. Based on the second SDS reporting round in 2012, the average carbon footprint recorded was
0.112 tCO2e per tonne of recycled household packaging23
. This figure varies significantly depending on
the type of community. In rural areas, for instance, the distances covered by the waste collection trucks
are longer than in dense urban areas, which results in a more significant carbon footprint. 50% of local
authorities have a carbon footprint ranging between 0.088 and 0.150 tCO2e.
This carbon impact is also accounted for in GHG assessments or in regional inventories, which form the
basis for drawing up district or inter-district Regional Climate and Energy Plans. In fact, ADEME mentions
that the management of waste alongside the management of energy, urban planning, housing and
transport are a significant component of Regional Climate and Energy Plans (ADEME, 2009). GHG
assessments are often performed by accounting only for the local authority's direct emissions (Scope 1) or
by including the indirect emissions relating to the generation of the power and heat consumed (Scope
2)24
. The order of magnitude of the "waste" item usually ranges between 3% and 6%, which is much less
significant than the emissions from other sectors like construction or transport. However, the overall
impact of recycling is not factored in, which means that GHG assessments do not value initiatives relating
to sorting and recycling household packaging waste, even though increasing the number of tonnes that
are recycled is the primary driver for improving waste management.
Initiatives on waste recycling are often featured in local authorities’ Regional Climate and Energy Plans,
although their carbon impact is rarely quantified. The reorganisation and optimisation of waste collection
by reducing the frequency of waste truck rounds, changes in the equipment (bins that comply with higher
environmental standards, or dual-compartment bins, and trucks that run on bio-fuels, etc.) as well as the
increase in voluntary waste drop-off points are among the most frequently implemented initiatives.
A targeted approach to waste that includes Scope 3 emissions (i.e. the sum of all the indirect emissions)
would make it easier to highlight the savings relating to certain initiatives relating to waste in Regional
Climate and Energy Plans.
For instance, the performance of the first regulatory GHG emission assessment covering the scope of the
Nantes Metropolitan Area's assets and expertise showed that waste accounted for 56% of the Urban
Community's emissions. This surprisingly high figure was obtained by including activities under delegated
management, all the waste flows and treatment facilities operating in the area (including plants that treat
waste from other areas). Based on this targeted and inclusive assessment, the local authority was able to
highlight margins for manoeuvre for its waste service that were as significant as those relating to its public
buildings or transport policy.
Meanwhile, by preparing its Regional Climate and Energy Plan in a spirit similar to that of Agenda 21, the
Toulouse Metropolitan Area chose to supplement the carbon criteria with other environmental, financial
and social criteria (job creation, and social inclusion, etc.). This choice led the local authority to undertake
initiatives that also enabled to avoid GHG emissions. Accordingly, measures like the availability of sorting
containers suitable in areas where waste was not collected were decided on the basis of broader political
goals. The joint climate related benefits of such an initiative were assessed by factoring in the avoided
emissions (71 tCO2e per year). In addition to the measures aiming at optimising the sorting of waste, the
Toulouse Metropolitan Area’s local waste prevention programme, which is incorporated in its Regional
Climate and Energy Plan, is expected to generated gains valued at 4,800 tCO2e per year.
Local authorities also have an important role to play with regard to the medium-term choices that they
make as part of their waste responsibilities. Accordingly, the renewal of a waste collection contract can
23 This average was calculated for the 678 local authorities that reported a Sustainable Development Fee for 2012.
24 The “Assets and Expertise” GHG assessment, which is the only mandatory assessment for local authorities with over
50,000 inhabitants, covers emissions “generated by the performance of the local authority's activities and services, and the
application of its expertise” (Scope 1). However, some local authorities choose to draw up more extensive assessments with a
broader scope.

25
provide an opportunity to introduce environmental and climate criteria in public procurement
specifications. For instance, this is what the Lagny Region Joint Collection and Treatment Union did when
it decided to dedicate 15% of the final rating in its call for bids to the environmental performance of the
bids. Infrastructure construction or renewal projects like waste sorting centres are also particularly
important. The technologies selected will influence the performance of the recycling process for many
years.
Focusing on this stage of the waste sorting and collection process thus enables the highlighting of
potential GHG emission reductions relating to the selective waste collection and sorting process that are
genuinely significant in view of other items in local authorities’ assessments. Moreover, better use is made
of these potential reductions when waste management policies and climate change mitigation strategies
such as Regional Climate and Energy Plans are properly coordinated.
Stage 3 – Sorting of packaging waste by households: a crucial link in the chain
Economic assessment: few financial incentives but anchored by a sense of civic responsibility
Consumers have an important role to play in preventing packaging via their consumption choices and the
influence that they may have on producers by expressing a preference for eco-designed products. If one
part of the contribution paid by producers finally ends up embedded in the price of the products bought by
the consumers, it has little direct influence on consumers’ behaviour, as its amount relative to the price of
a product is not visible.
The second major action lever for consumers, as the packaging waste holder, is the waste sorting
practice. The recycling rate has stagnated at 67% since 2011, despite increasing contribution rates and
communication campaigns. Over one million tonnes of recyclable household packaging remain unsorted
every year and are landfilled or incinerated. This represents an annual cost to local authorities of €200
million, as well as an income shortfall resulting from the failure to resell the materials, and a missed
opportunity to reduce GHG emissions. Furthermore, 44% of people who sort their waste do not sort it
properly, which results in a cost of €50 million25
for 200,000 tonnes of wrongly sorted household
packaging.
The waste collection service accounts for 15% of local authorities’ tax receipts (Germain, J. & Jarlier, P.
2014), i.e. an average of €400 per family per year (€7.4 billion in total in 2010). However, traditional
financing mechanisms for waste collection services (removal levy or tax) do not create any genuine
financial incentive for sorting and preventing waste for consumers, as they do not usually take the weight
of their waste into account26
. To remedy this lack of incentive, the Grenelle Laws have enabled the
experimental introduction of a variable incentive tax or duty for the removal of residual household waste
(Article 195 of the Grenelle Round Table II Law27
) depending on the quantity of waste. The usefulness
and effectiveness of such a measure are discussed in the third section of this report.
Within the context of the EPR Scheme, instruments targeting households are usually communication and
awareness-raising initiatives. Accordingly, a large number of local and national campaigns encourage
25 This cost, which relates to some of the sorted packaging that is rejected at sorting centres is due to the negative effect of
sorting mistakes on the efficiency of sorting centres and to the additional expenditure incurred when returning this refuse to
storage or incineration centres.
26 The level of the household waste removal tax is not dependent on the service provided, as the levy for removing household
waste may be linked to the service provided (for instance, the number of people in the household or frequency with which the
bins are put out).
27 The Grenelle Round Table I law initially intended to generalise this mechanism, and replace the tax by an incentive-based
removal levy. The Grenelle II Round Table Law limited the initiative to a five-year experiment for districts and Public
Establishments for Cooperation between Local Authorities. The 2012 Finance Act introduced an incentive-based waste
removal tax, the application of which remains optional.

26
users to waste sorting and attempt to make the related sorting instructions clearer. The message
conveyed rarely focuses on the impact of the treatment of household packaging waste on global warming
or the climate. More often, it is the broader environmental aspects like pollution or the impact on living
standards that are highlighted. These aspects correspond to the values and images that the public
associates with the sorting reflex, as shown in Box 4:
Insert 4: Perception of waste sorting
According to a survey conducted by French pollster BVA, 91% of French people think that waste sorting is
useful, and 84% expressed confidence in recycling and think that sorted waste can be recycled efficiently.
66% of French people state that they always sort their waste. "Sort your waste" topped (86%) the list of
answers when households were asked what they were doing to reduce greenhouse gas emissions ((BVA
Opinion for 20 Minutes, 2012)), ahead of turning off devices instead of leaving them on standby, buying
fresh local products or optimising the temperature of heating systems.
Interestingly, waste processing came sixth on the list when French people were asked about the activities
they thought contributed most to reducing our carbon footprint. On the other hand, 20% were of the
opinion that this was the area in which households could make the biggest contribution (ADEME, 2014).
It is worth noting that households focus more on waste sorting: 90% of French people reported feeling
they had sorted more of their waste in recent years, while 58% felt they had cut down on household waste
(BVA Opinion for 20 Minutes, 2012)
Figure 11: Answers to the question: What are the measures for reducing greenhouse gas
emissions? What the French do, and what they could do or not do
Source: Survey on French residents and the greenhouse effect, ADEME-Gfk, 2012
Other surveys28
confirm that most French people consider recycling to be a civic responsibility and that
this is the primary motivation behind their waste sorting efforts
Following the Grenelle Environmental Round Table discussions, the revised Environmental Code states
that apart from glass packaging, any recyclable product covered by a EPR scheme supplied to the market
from 2015 January, 1st, uses a common marking to inform the consumer that this product is falling under a
sorting instruction.29
. A legislative decree published at the end of 2014 indicates that the “Triman” symbol
(Figure 12b) has to be used to identify recyclable packaging directly on the packaging or on another
support, including digital ones. This symbol supplements the “Green Dot sorting information” designed by
Eco-Emballages in 2011, and which applies to all packaging components, including non-recyclable
components on a voluntary basis (Figure 12.a).
28 Et notamment une enquête réalisée par Harris Interactive faisant apparaître le tri comme un engagement citoyen (Harris
Interactive pour l’Assemblée Nationale, la Fondapol et la Fondation Jean Jaurès, 2015) ou l’Observatoire du geste de tri des
français animé par Eco-Emballages avec Ipsos.
29 French Environmental Code – Article L541-10-5

27
Figure 12: The “Green Dot sorting information” (a) and the “Triman” symbol (b)
(a) (b)
Source: ADEME and Eco-Emballages
A bonus system has also been introduced by Eco-Emballages to assist the roll-out of this labelling, which
was already displayed on over 20 billion packaging units in 2014. This bonus shows the incentive-based
aspect that environmentally-friendly adjustments may adopt in addition to brands’ interest in informing
their consumers in accordance with a consistent format that is made available free of charge.
Carbon footprint: 0.50 Mt CO2eq. in emission reductions as a result of 3.2 Mt of household
packaging waste that is neither stored nor incinerated
Each packaging item that is actually sorted by households will be collected, and sent to the relevant
recycling stream rather than being incinerated or sent to landfill. The difference in GHG emissions
between this route and the other treatment options amounts to 0.50 mtCO2e, which are not emitted into
the atmosphere. The coordinated action of local authorities and households enables therefore the
tonnage sorted, collected, and therefore recycled to be maximised.
Stage 4 - Material recycling: market outlets
Economic assessment: outlets being developed, but limited by the scale of the stock
Material recycling and re-use outlets have developed in parallel with the implementation of the EPR
system. The existence of market outlets for sorted materials was not a given in 1992 except for glass
which had already been recycled for years. The setting up of Eco-Emballages was concomitant with the
development of take-back guarantees negotiated with the various materials industries. The aim was to
guarantee local authorities that the sorted materials would be removed at a cost that would never be
negative, regardless of economic conditions. Nowadays, this guarantee is still offered to local authorities
in the form of take-back agreements at a single and consistent price throughout France, pursuant to a so
called solidarity principle.
Local authorities also have other options to manage their take-back conditions, if they wish to. For
instance, they can go directly for offers made by various professional waste management organisations
members, or can enter into an agreement with an individual buyer30
. All of these purchase solutions must
comply with the principles set out in the specifications for the allowance of Eco-Emballages, and
especially the quality standards and traceability principles, in order to ensure the effective recycling of
materials. Lastly, the purchase of the materials also establishes principles of proximity between the
locations where the materials are produced and used, and of solidarity between the regions31
, to the
extent possible. The application of these principles may have financial, social and environmental
consequences. For instance, 99% of glass in France is recycled, and the average distance travelled
between the point of collection and the point of recycling is 230 km (Ernst & Young, 2013), thereby
contributing to a local French industry and to lowering the transport-related GHG emissions.
30 For structural reasons, this last option is mainly the most popular one for bottom ash (80% of agreements).
31 Accordingly, the Eco-Emballages specifications state that “The return and recycling of household packaging waste in
accordance with the standards for each material contribute to local recycling and to optimising transport distances taking the
appropriate technical, financial and environmental considerations into account, including for local authorities in the French
Overseas Departments and Overseas Communities, to the extent possible, and in compliance with the rules established by
the World Trade Organisation.

28
When the system was introduced, Eco-Emballages was therefore meant to be able to bear the cost for
local authorities of a negative market price (indexed on the price of materials). However, prices today are
largely positive, and these market outlets represent an annual income for local authorities which has
exceeded €200 million since 2011, due to a pricing and weight effect.
The use of secondary raw materials derived from recycling across all sources increased significantly in
France during the 1990s, rising from 10 to 17 million tonnes before stabilising. Since 2005, a new upward
trend has been seen for glass and aluminium (Figure 13). The usage rate for recycled materials, across
all materials, was 42% in 2010 (SOeS).
Figure 13: Usage rate of recycled raw materials by industry
Source: ADEME, Recycling Report, 2012
The revenues from the resale of these materials are not enough to cover the costs relating to the selective
collection, sorting and treatment of household packaging waste. As explained previously (Figure 8), they
only cover 21% of the total amount of these costs. EPR mechanisms enable these raw materials to be
competitive with virgin materials by making the upstream actors of the value chain bear some of the costs.
Hence, the packaging recycling system in France is based on an innovative business model that relies on
EPR and on the taxation of waste in order to support the sustainability of secondary materials markets.
For some materials, household packaging is a major source of supply of secondary raw materials: it is not
significant for aluminium or steel as they benefit from other more significant sources of supply including
the recycling of vehicles or supplies from the construction industry; on the contrary, 20% of recycled paper
and cardboard, and up to 90% of glass are derived from the selective collection of household packaging.
The packaging glass recycling industry existed before the implementation of the EPR Scheme.. A network
of collection points and a dedicated collection process had been organised by the industrial companies in
the sector in partnership with local authorities as early as 1974. In fact, following the oil shocks, the higher
price of energy had made recycling financially attractive (the production of virgin glass consumed more
energy than using recycled glass, which is known as “cullet”). The ratios of cullet used in glass production
ovens have increased significantly since then, reaching 65% on average in 2012, and up to 90% in some
cases (Ernst & Young for Verre et Avenir, 2013). The only current limit on this ratio is the availability of
recycled glass almost integrally coming from collected household packaging. The introduction of the EPR
Scheme enabled a considerable improvement in the recycling rate, which increased from 40% 15 years
ago to 74% in 2012 (ADEME) thanks to an increase in the resources devoted to information, and to the
increasing density of the voluntary collection points.
The plastic (PET and PEHD/PP) bottle and flask recycling industry did not exist previously, and was
created following the introduction of the Household Packaging EPR Scheme. Almost no recycled plastic
(rPET) was used in the design of household packaging in the early 2000s, as the law did not allow it for
food packaging purposes. Nowadays, companies like Danone Eau or Coca-Cola use between 10 to 50%

29
rPET for their bottles (Dan known 2013, Coca-Cola Entreprise, 2012) and would like to go further32
, if the
rPET supply enabled them to.
With a long term trend of increase in the prices of virgin raw materials and energy, together with in the
demand from emerging countries, the availability of this secondary material is becoming a real issue.
Sorted household packaging accounts for over 90% of the supply to recycling facilities that produce
recycled plastic suitable for use as packaging material. Accordingly, the limiting factor is the quantity of
the collection, since an increasing portion of the secondary materials has now to be imported. Structuring
procurement streams remains a challenge. For instance, Coca-Cola Entreprise has chosen to set up a
joint venture with APPE (Coca-Cola Entreprise and APPE, 2012), one of the main suppliers of rPET in
France, in order to gain easy access to recycled plastic supplies This particularly strong pressure on
plastics exists for all materials, and may have an influence on the prices of recycled materials. The youth
and relatively tenuous nature of recycled material supply chains make them particularly vulnerable to the
price volatility. A conjectural decline if energy price could endeavor their sustainability.
Carbon footprint: 1.89 Mt eq.CO2 in emission reductions as a result of industrial processes
substituting secondary raw materials for virgin materials
93% of the GHG emissions avoided by the recycling of household packaging (i.e. 1.89 mtCO2e) come
from the use of secondary raw materials as a replacement for virgin materials that were not produced.
This figure is calculated as the difference between the emissions from the processes that produce raw
materials from virgin resources and from the processes that produce the same amount of materials from
sorted household packaging, as shown in the following figure:
Figure 14: Comparison between the emission factors associated with the production of primary
and secondary raw materials for each kind of household packaging material in France (in kgCO2e
per tonne of materials produced)
This chart was produced using the ADEME Carbon Database®. The emission factors shown only concern production, and therefore do not take the other stages of the life-cycle of materials, including the end-of-life stage into account. Moreover, these are average factors that may vary depending on the properties sought for the materials, and therefore the use that will be made of them.
Source: CDC Climat Research based on the ADEME Base Carbone®, 2014.
32 It seems technically feasible to achieve a 100% recycled content.

30
The differences observed between the emission factors for the virgin and recycled materials production
processes are the results of the significant differences in the supply and processing of resources (Table
2).
Table 2: Gains relating to the use of secondary raw materials for each category of materials
Ultimately, the 2.1 million tonnes of GHGs avoided thanks to the packaging EPR Scheme in France are
the result of actions undertaken by all the major stakeholders to the packaging lifecycle. Although
industrial companies are financially responsible for their end-of-life products, and make recycling
financially a viable choice, this choice also relies on the actions of households and on the use of recycled
materials by recycling market outlets.
III. EPR FOR HOUSEHOLD PACKAGING PROVES TO BE AN EFFECTIVE MEASURE IN COMBATING CLIMATE
CHANGE, BUT MORE PROGRESS NEEDED AS WELL AS ADDITIONAL POLICY TOOLS
A. A recycling success story—with no pressure on the public purse
The introduction of the household packaging EPR Scheme has established a framework where recycling
markets have developed. The mechanism has turned out to be very effective in terms of increasing the
recycling rate at a rapid rate; accordingly this rate rose from less than 20% in 1994 (Eco-Emballages
199433
) to 67% in 2011. This increase in the recycling rate has had a number of positive effects, including:
33 A critical analysis of Eco-Emballages' business reports is available on the French National Recycling Council’s website.
Aluminium
Transformation of bauxite ore into alumina and electrolysis of alumina require lots of electricity
while recycled aluminum melting consumes 95% less energy. 47% of the aluminum used in France
comes from recycling, this represented 490,000 tonnes reused in 2011 (French Aluminium
Association).
Steel
There are two main industrial steel production processes: the production with oxygen which uses
iron ore and coke to produce cast iron then melted with iron scrapp to produce steel ; the electrical
way using only iron scrap. Sorted steel packaging are used in both case ; 20% of recycled-steel
packaging comes from the selective collection chain that captures 64% of the supply.
GlassFor every additional 10% recycled glass (cullet) used in glass furnaces, 5% CO2 additional emissions
are reduced (Glass Federation). Today, glass factories use up to 90% of cullet in their processes.
Paper and
cardboard
Virgin and recycled paper pulp production processes have similar emissions factors. The inking of
recycled paper and cardboard consumes electricity and offsets the consumption of energy, water and
reagents needed during the production of blank paper.
Plastic
Plastic recycling can be a mechanical process (sorting, cleaning, grinding of plastic packaging to make
granules), or a chemical process (thermal decomposition of the polymer). The first option consumes
less energy and emits less CO2 but often implies a loss of quality due to the presence of impurities or
non-extractable dyes. 5.4 bottles out of 10 were sorted in 2012 and 235,568 tonnes of bottles and jars
were collected

31
- environmental effects, by reducing the consumption of raw materials, and mitigating the impact of
waste management on climate change, as well as limiting more local pollution such as water and soil
pollution;
- social effects, by reducing pollution and its impact on health, as well as by creating jobs relating to
collection, sorting and recycling activities34
;
- economic effects via the development of an economic sorting activity, and the introduction of
industrial outlets for recovering the sorted packaging.
40 million tonnes of secondary materials have been returned to circulation since 1992, thereby avoiding
the emission of several million tonnes of GHGs (Eco-Emballages figure, 2012).
Through the principle of extended producer responsibility, a major part of the expenditure that enabled
these benefits is borne by the firms that bring packaging to market. Accordingly €4 billion in contributions
(French Court of Auditors, 2013) have been repaid to local authorities since 1992. These investments and
this financial support, combined with consumers’ sorting habits have hence enabled the current recycling
rates to be reached. Against a backdrop where Government and local authority expenditures are being
rationalised, this therefore amounts to climate change mitigation effort at a lower cost for public budget.
The gross reference costs for the selective collection of household packaging are estimated at around
€990 million (Eco-Emballages, 2014), while 2.1 mtCO2e have been avoided via the EPR Scheme. A quick
calculation enables to put the average GHG abatement cost at €490 million per tonne. The revenues from
the sale of recycled materials reduces this cost down to €390 per tonne. This cost is mostly borne by
companies that bring household packaging to market, via their fee paid to Eco-Emballages, and partly by
local authorities, via local taxation in particular.
As an order of magnitude, the assessment reports on the measures of the Grenelle Environmental Round
Table (Égert, B 2012) estimate that the abatement costs of initiatives to promote renewable energies in
France range between €260 and €6,150 per tCO2e, while those of policies involving transport range
between €530 and €2,500 per tCO2e. However, these comparisons are very limited as these costs do not
reflect the same realities: they are mainly investments in transport infrastructure and renewable energy
subsidy policies for electricity. In addition, as previously explained, these different measures are not just
aiming at reducing GHG emissions. Likewise, any comparison with the price of a tonne of CO2 on a
carbon allowance trading system like the EU ETS is very difficult, since this price depends on the supply
and demand for emission allowances relating to certain well-defined sectors to which allowances are
allotted. However, as previously seen, there is very little interaction between the waste management
sector and this kind of market.
B. Increasing recycling to boost climate change mitigation efforts
The Household Packaging EPR Scheme could avoid an even greater portion of greenhouse gas
emissions via three approaches, namely i) increasing waste prevention; ii) optimising and developing
waste collection and the sorting reflex, and iii) increasing the supply of recyclable materials.
Complementary policies to EPR in terms of upstream and downstream prevention
Despite recent changes that seek to enable the EPR scheme to contribute more to upstream prevention
(bonus/penalty system, and one-off target of packaging reduction at source by 100,000 tonnes, etc.), this
system displays technical limits imposed by the function of packaging. Furthermore, since the
specifications for Eco-Emballages only apply to Eco-Emballages, it does not enable direct prevention
targets to be drawn up for businesses. Despite everything, as previously explained, the EPR Scheme
34 According to SOeS, 130,100 environmental jobs were directly related to the waste sector in 2007, of which 23% were in the
waste recovery sector. The Eco-Emballages annual report mentions the creation of 21,000 jobs in the packaging sector.

32
seeks to develop the incentive drivers available, including via fee modulation. Businesses’ eco-design
initiatives are also driven by financial issues.
Furthermore, the mechanisms currently in place only rely on awareness raising and information provision
as drivers to encourage downstream prevention among consumers. The option to define quantified
prevention targets within the EPR framework that are as detailed and ambitious as the recycling targets is
therefore limited.
Nor the packaging producers nor Eco-Emballages are responsible for supporting the evolution of
consumption habits. The room for defining precise and ambitious prevention target within the EPR
Scheme is therefore very narrow. By cons, local authorities can implement measure especially designed
with this objective like local waste prevention plans.
Aside from the EPR scheme, new national targets for the household waste prevention are expected to be
set by the Draft Planning Act for the Transition to a Low-Carbon Economy. This Act, which is discussed in
Parliament since the beginning of the year, sets a target of 7% less household and similar waste in 2020
compared with 2010. The second French National Waste Prevention Programme (2014-2020) mentions
the same figure (Ministry for the Environment, Sustainable Development, and Energy 2014a). To achieve
this goal, several avenues like an incentive-based levy, subsidies for composting at home, taxes on
products, or more stringent regulations, for instance on flagship products like plastic bags, are being
explored (Eunomia 2011).
Insert 5: Lessons learned from the weight-based charge
220 local authorities in France were trialling incentive-based waste collection programmes at the end of
2013 in the form of a tax or a bin charge based on the weight of the residual household waste. The
objective is two-fold: to provide an incentive to reduce waste and to maximise the amount of recoverable
materials entering the recycling stream.
The initial feedback cited by ADEME shows a substantial reduction in the quantities of household waste
collected (ADEME 2014) after the introduction of the weight-based charge. The lower waste volume
seems to be in direct proportion to the use of separate collection, with more recycling, home composting
or voluntary drop-off at recycling centres. Additional research being conducted by the French sustainable
development commission (CGDD - Commissariat Général au Développement Durable) puts at 56 kg—or
one-third—the average reduction in household waste per person per year. These findings are in line with
those of other European countries.
In the Pays de Vilaine region, the introduction of a weight-based charge in January 2014 cut the volume of
residual household waste collected by half, without any concomitant increase in illegal dumping. At the
same time, the proportion of household packaging collected increased 57%, with no change in service
costs. The financial viability and sustainability of these reductions should be monitored over the longer
term.
Optimised collection and sorting by households
The recycling rate for household packaging is calculated as the ratio between recycled waste and the
weight of the total household packaging supply of operators who pay a fee to Eco-Emballages. The rate is
currently stabilising at 67%, although a target of 75% was set in the regulations. The issue that arises is
how to increase the recycling rate. Each additional recycling percentage translates into additional
emissions reduction (on average, one additional recycling percentage corresponds to an additional
reduction of 30,000 tCO2e35
).
35 Calculated on the basis of the 2 million tonnes that have already been avoided – this number is solely for information
purposes, as it specifically depends on the type of material recycled. The efforts currently underway to increase the recycling

33
Sorting errors are still widespread, and hinder the recycling process. To reduce these phenomena, Eco-
Emballages and local authorities are introducing targeted initiatives aiming to simplify access to sorting36
,
and improving sorting habits. In particular, these initiatives include national campaigns (like the “Monsieur
Papillon” campaign in 2013 or the “#suivez-moi” campaign in 2014), local awareness-raising campaigns,
or paid systems such as sorting ambassadors.
In March 2014, Philippe Martin, who was the French Environment Minister at the time, confirmed his
attachment to the National 75% target, which was meant to be achieved in 2012 according to the Grenelle
Round Table I Law (French Ministry for the Environment, Sustainable Development and Energy, 2014b).
To achieve this target, he announced an annual €23 million increase in the fee granted to local authorities,
based on updating certain technical costs, together with the launch of a recycling action plan amounting to
€90 million over the period between 2014 and 2016. This plan specifically includes the introduction of
targeted financial support for local authorities that achieve low recycling rates, modernisation
programmes for household packaging waste management facilities37
and on the development of plastic
recycling. This programme was launched at the end of 2014 through a call for proposals or call for
projects directed to local authorities and waste sorting operator.
Increasing the stock of recyclable materials
A second option is to increase the portion of recyclable household packaging in the total supply. In fact,
some household packaging cannot currently be recycled due to their material (including the type of
polymer and the shape of the packaging for plastics), as well as due to their size38
. This is first and
foremost an issue of equipment and profitability for waste sorting centres that identify and separate some
materials, as well as of existence of market outlets for some materials, and of packaging design. In fact,
eco-design is an action lever for improving the recyclability of household packaging, by choosing materials
that are compatible with the existing recycling market outlets.
Several initiatives involving the various materials sectors are also seeking to increase the portion of
recyclable household packaging through extending the type of packaging to be sorted:
Metal project: Even though aluminium is totally recyclable without altering its properties, it is one of the
materials where recycling is least successful, as only 35% of aluminium household packaging was
recycled in 2013. Currently, sorting centres are only capable of capturing large and rigid aluminium
packaging. Smaller household packaging items, like coffee capsules, aluminium paper, trays or crushed
drinks cans are directed towards the sorting reject pile. In 2010, the French Light Aluminium Packaging
Club (CELAA) together with pilot local authorities, and Eco-Emballages launched an experiment to
enhance the equipment of sorting centres so as to improve the recuperation rate for this material. The
results achieved at four centres confirm the possibility to significantly increase the amounts captured (from
50% to 100%) via an initial investment of between €100,000 and €300,00039
for each sorting centre. This
represents about 250 tonnes of metal household packaging per year that are not stored or incinerated,
ratio specifically target certain materials (like plastic and glass), and will therefore have a maturity different impact on
emissions.
36 Two million French residents are still finding it hard to sort their waste easily near their home (unsuitable or remote bin
areas, or districts where there is no waste collection service, etc.) 37
Eco-Emballages’ current authorisation had provided for a mid-period review clause, in order to perform potential technical
adjustments. These decisions are the result of a long-awaited ministerial decision on this issue.
38 Small aluminium packaging items, like compressed drinks cans, are not currently recyclable.
39 Including for the installation of eddy current machines.

34
and the same quantity of virgin aluminium that is not produced, i.e. around 1,700 tCO2e avoided,
according to the emission factors used by Eco-Emballages.
In addition to the small aluminum packaging, this experiment showed that it was possible to extract the
small pieces of steel, like capsules, which can re-enter the main flow of steel waste collected.
The initial investment is amortised when the additional amount of metal captured reaches 60 tonnes per
sorting centre and per year, meaning that this investment would be profitable for around 25 large sorting
centres in France. The experiment was therefore extended to additional local authorities in the spring of
2014 in order to extend the evaluation basis.
Extending sorting instructions for plastics: Compared with current situation, each additional tonne of
plastic recycled allows to reduce GHG emissions by 0.9 to 1.3 tonnes (Eco-Emballages & ADEME,
201440
).
Due to current sorting processes, recycling technologies and recycling market outlets, plastic packaging
sorting instructions only apply to PET and PEHD/PP bottles and flasks. Extending these instructions to all
plastic household packaging would enable up to 50% of the total supply of household packaging to be
sent for recycling by 2030. Since 2011, Eco-Emballages has been conducting an experiment to test the
technical and financial feasibility of such an extension with pilot local authorities (representing 3.7 million
inhabitants). A Life-Cycle Assessment was carried out to assess the environmental impact of generalising
this experiment. Today, this experiment is extended to a larger panel of local authorities and the Draft
Planning Act for the Transition to a Low-Carbon Economy plans to generalize this extension in 2022.
Several scenarios were analysed showing that by extending sorting to all plastic household packaging,
and promoting its recycling, 165,000 tonnes of additional materials would be returned to circulation every
year as from 2022 (80% more than the initial situation). Ultimately, the emission of 500,000 tonnes of
GHGs into the atmosphere would be avoided, or even 750,000 tonnes in the event of an additional
efficient waste-to-energy process for sorting rejects (Eco-Emballages data, 2014).
The first reports on the experiment indicate that the marginal average cost per tonne of plastic containers,
trays or films at sorting centre amounts to €1,320, and that 88% of this cost result from a increase in
household packaging sorting costs at sorting centres. The marginal cost of eliminating one tonne of CO2
by extending plastic sorting instructions is therefore estimated at between €1,100 and €1,460, i.e. a cost
that is much higher than the average recycling elimination cost. However, this amount needs to be
balanced with the fact that the cost calculated for the experiment is far from being optimized, and will be
lower when the extension of sorting instructions to all plastic packaging will also aim at optimising the
organisation of sorting facilities at the national level.
The assumption of extending the recycling of plastics is a good illustration of the process for improving
collection and recycling, as well as the related GHG reductions to which the Household Packaging EPR
Scheme contributes via:
- incentives for producers to choose recyclable packaging by complying more closely with new sorting
practices;
- further financial support for local authorities as part of an overhaul of the equipment and organisation
of sorting centres, which are now unsuitable: the experiment shows that, in most cases, sorting more
plastic household packaging turns out to be costly, and results in a reduction in the efficiency of
sorting centres, as well as in a deterioration in working conditions. As oldest sorting facilities were
built when the EPR was set up, the necessary renewal of sorting facilities will provide an opportunity
for an overall reorganisation and to improve the industrial performance. To that end, a higher level of
automation and a reduction in the number of facilities will be required (TERRA S.A. for ADEME,
2013). The impact of such a reorganisation on GHG emissions will need to be studied, depending on
40 There are other avenues which were not been developed to date, such as waste-to-energy recovery, which has not been
the subject of comparisons in this report.

35
the option selected, and on the additional emissions allotted by extending the transportation
distances, which could, for instance be offset via greater efficiency of the processes for maximising
the amounts recycled, and therefore the emissions avoided;
- raising the public’s awareness in order to teach them new sorting practices;
- developing market outlets that enable the existence of a market for the purchase of these new resins,
which currently do not exist.
- seeking optimal financial, environmental and societal conditions in a system that is intrinsically
complex and involves multiple actors, since it covers the entire packaging waste chain, from
production of the packaging to its end of life.
C. Continuing the transition to a circular economy
Waste management policies are an integral part of a broader circular economy and
energy transition model
Recent changes in European and national legislation regarding waste management are in line with a
global trend to progress towards a circular economy. A circular economy offers an integrated framework
for several approaches that already exist, and which have often been approached in a sector-based
manner so far. ADEME defines the circular economy as an “economic trading and production system that
aims to improve the efficient use of resources and to reduce the impact on the environment while
increasing individuals’ well-being at every stage of the product life-cycle”. The concept is not new,
however the terminology is increasingly widespread in discussions. The circular economy recreates the
link between the issue of waste and that of resources, in order to deal with the inevitable exhaustion of
those resources by eliminating the very concept of waste. To achieve this aim, it is based on three areas
for action and seven priorities throughout value chains, as set out in Figure 15:
Figure 15: the seven components of the circular economy
Source: ADEME
As part of the review of Waste Directives, the European Commission wants to group the various sector-
based policies relating to resources on waste within a larger whole, known as the “Circular Economy
Package” A first proposition for this package was released in 2014 (European Commission, 2014b) with
the following objectives:
- improve recycling and prevent the loss of resources in Europe;
- create jobs, and boost growth;
- demonstrate the effectiveness of new value models;

36
- reduce CO2 emissions and the impact on the environment.
The new Commission which came into office in November 2014 decided to withdraw this project in order
to revise it and make a new and « more ambitious » proposition in 2015.
Impact studies for these various measures estimate that improving the EU’s efficiency in terms of
resource management could reduce raw material requirements by between 17 and 24%. This would
represent €630 billion of savings every year for European industry, as it is a major importer of resources.
Meanwhile, the impact on GHG emissions of the full implementation of the Circular Economy Package (as
it was designed in 2014) is estimated at 62 mtCO2e per year in 2030, i.e. over 2% of the EU’s total
emissions (ibid).
At the national level, the issue of waste prevention is specifically highlighted. A second National Waste
Prevention Plan (Ministry for the Environment, Sustainable Development and Energy, 2013) was unveiled
in June 2014. It calls on involving EPR systems in waste prevention, by extending their specifications to
eco-design, incentives to increase the length of products’ life cycles, as well as raising awareness. The
development of eco-modulation in the household packaging EPR sector is mentioned as a model to be
further investigated.
The draft Planning Act on the Transition to a Low-Carbon Economy also includes a heading entitled
“combating waste and promoting the circular economy: from products design to recycling”. The inclusion
of this chapter in the legislation reflects the importance of this issue for energy-efficiency strategies, and
therefore low-carbon strategies, by combining waste prevention and recycling with energy and climate
issues.
From theory to practice: the circular economy in action in the regions
Although many operators may claim that they are contributing to the development of the circular economy,
a general change of model where the use of resources is concerned exceeds the sum of sector-based
and partial approaches. In fact, the circular economy is presented as an overall change in the way value is
created, by going beyond the conventional linear approach, i.e. extracting processing throwing
away.
Recycling represents part of the solution for a more efficient management of resources; however it cannot
be enough, especially in a context where consumption is growing and where demand for materials would
exceed previous demand every day, and would therefore exceed the supply of recyclable materials. This
is where eco-design and prevention, as well as other production and consumption models play their full
role. In this regard, the circular economy exceeds the current EPR framework by seeking to offer new
value models such as re-use, prioritising use rather than possession (product-service economy) or else
pooling requirements within industrial and regional environmental approaches, for instance.
The EPR sector model nonetheless remains an interesting framework for enabling the various operators
to work together. Recycling, as well as prevention and eco-design, is promoted within that framework,
together with incentives and awareness-raising, in order to change production and consumption habits.
Are shown by the successive changes in the household packaging sector, the outlines of the EPR
Scheme can adjust to new requirements or priorities.
Alternative options taking into account the other priorities of circular economy such as deposit systems,
are considered as experiments in the Draft Planning Act for the Transition to a Low-Carbon Economy.
Their viability from a technical, financial or even climate standpoint may be questioned, and must
therefore be considered on a case-by-case basis, at regional levels or for defined channels (ADEME,
2011).
Moreover, it is necessary for these players to succeed in gaining an overall view of their contributions and
of the impact of their initiatives, and to be able to cooperate. Indeed, as proved by our study of GHG flows
in the household packaging EPR case study, contributions are spread throughout the value chains where
each stage is essential, while the gains are not always visible or assignable to each of the participants
involved on an individual basis.

37
CONCLUSION
By examining the links between selective collection, recycling and the reduction in GHG emissions
achieved through the buy-in of all stakeholders in the EPR model, this Climate Report demonstrates that
Extender Producer Responsibility makes a significant contribution to mitigating climate change.
The case study in the report looks at household packaging, which is the oldest and most significant
example of EPR in terms of financial flows in France. It shows that each stage in the process, from the
production of household packaging to end of life and potential recycling, contributes to greenhouse gas
flows, with total emission reductions in excess of 2 Mt CO2. Three key points emerge from the case study:
- The challenge of coordinating waste policies with climate policies. The majority of other climate
policies do not cover this sector, primarily due to the difficulties involved in measuring and allocating
reductions in GHG emissions and the risks of double-counting. However, existing policies—such as
EPR or the French general tax on polluting activities (TGAP)—are effective in cutting GHG emissions.
Industries covered by the carbon emissions trading market benefit from reductions in GHG emissions
as a result of the use of recycled materials, largely due to the EPR system.
- The economic efficiency of EPR, which puts very little pressure on public finances and has
successfully created competitive markets in recycled materials. Use of these materials by
manufacturers considerably reduces the carbon intensity of their activities. More particularly, this
closed-loop approach to resource use, to which everyone contributes, maximises reductions in
emissions. Although the model has matured since it was introduced in 1992, there is further scope for
development, as this Climate Report points out. Changes could be introduced under the National
Waste Prevention Programme in France, which plans to set quantified prevention targets, much like
the 100,000 tonne target set in 2010 as part of the Eco-Emballages accreditation procedure, including
optimising selective collection and establishing the conditions for extending the sorting guidelines for
plastic packaging waste, subject to cost effectiveness. The EPR system could also be supplemented
with measures like the weight-based charge.
- Changes to the regulatory framework in both France and Europe aimed at addressing resource
management as part of an integrated approach to life-cycle management and the circular economy.
The role of local authorities in this regard is to facilitate and incentivise buy-in by all stakeholders—
citizens, business and the waste industry. In respect of selective collection of household waste, the
Report shows that the most proactive local authorities are those that have incorporated waste
management and recycling in a broader policy framework, together with their Regional Climate and
Energy Plan (PCET) and sustainable development policy, along the lines of an Agenda 21. This
integrated approach provides the tools necessary to cut GHG emissions while also promoting local
economic development. Boosting selective collection of waste is crucial to attain the 75% recycling
target set by law (from 67% in 2012), and to realise the potential for the EPR model to reduce GHG
emissions.
Operators must be given the time and resources to capture the material flows in their area and from their
industries. Moving beyond a sector-based framework and gradually extending multi-criteria and life-cycle
models (CGDD-SOeS 2014), such as those drawn on in this Report to examine climate, would help to
raise awareness and address waste management and recycling policies in a broader approach. Some
life-cycle stages, such as product packing, distribution and use, are not taken into account in this
assessment and could be the subject of additional research and perhaps shed more light on other
potential mechanisms for mitigating GHG emissions.
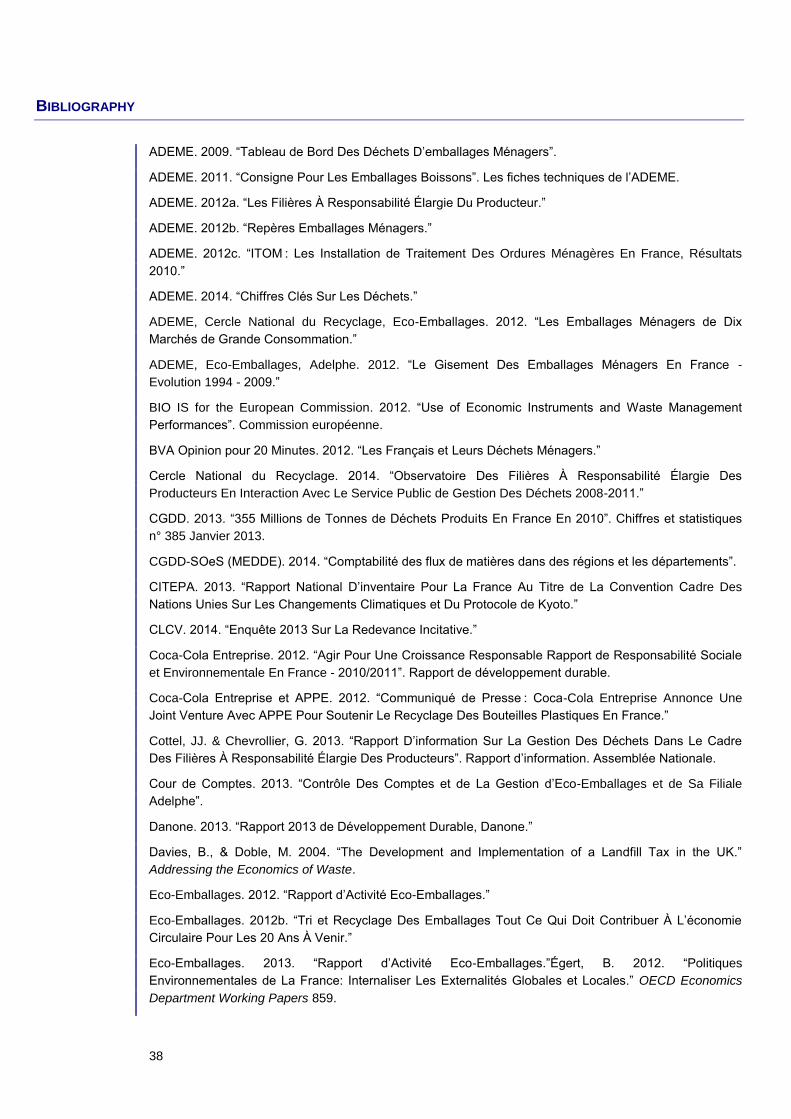
38
BIBLIOGRAPHY
ADEME. 2009. “Tableau de Bord Des Déchets D’emballages Ménagers”.
ADEME. 2011. “Consigne Pour Les Emballages Boissons”. Les fiches techniques de l’ADEME.
ADEME. 2012a. “Les Filières À Responsabilité Élargie Du Producteur.”
ADEME. 2012b. “Repères Emballages Ménagers.”
ADEME. 2012c. “ITOM : Les Installation de Traitement Des Ordures Ménagères En France, Résultats
2010.”
ADEME. 2014. “Chiffres Clés Sur Les Déchets.”
ADEME, Cercle National du Recyclage, Eco-Emballages. 2012. “Les Emballages Ménagers de Dix
Marchés de Grande Consommation.”
ADEME, Eco-Emballages, Adelphe. 2012. “Le Gisement Des Emballages Ménagers En France -
Evolution 1994 - 2009.”
BIO IS for the European Commission. 2012. “Use of Economic Instruments and Waste Management
Performances”. Commission européenne.
BVA Opinion pour 20 Minutes. 2012. “Les Français et Leurs Déchets Ménagers.”
Cercle National du Recyclage. 2014. “Observatoire Des Filières À Responsabilité Élargie Des
Producteurs En Interaction Avec Le Service Public de Gestion Des Déchets 2008-2011.”
CGDD. 2013. “355 Millions de Tonnes de Déchets Produits En France En 2010”. Chiffres et statistiques
n° 385 Janvier 2013.
CGDD-SOeS (MEDDE). 2014. “Comptabilité des flux de matières dans des régions et les départements”.
CITEPA. 2013. “Rapport National D’inventaire Pour La France Au Titre de La Convention Cadre Des
Nations Unies Sur Les Changements Climatiques et Du Protocole de Kyoto.”
CLCV. 2014. “Enquête 2013 Sur La Redevance Incitative.”
Coca-Cola Entreprise. 2012. “Agir Pour Une Croissance Responsable Rapport de Responsabilité Sociale
et Environnementale En France - 2010/2011”. Rapport de développement durable.
Coca-Cola Entreprise et APPE. 2012. “Communiqué de Presse : Coca-Cola Entreprise Annonce Une
Joint Venture Avec APPE Pour Soutenir Le Recyclage Des Bouteilles Plastiques En France.”
Cottel, JJ. & Chevrollier, G. 2013. “Rapport D’information Sur La Gestion Des Déchets Dans Le Cadre
Des Filières À Responsabilité Élargie Des Producteurs”. Rapport d’information. Assemblée Nationale.
Cour de Comptes. 2013. “Contrôle Des Comptes et de La Gestion d’Eco-Emballages et de Sa Filiale
Adelphe”.
Danone. 2013. “Rapport 2013 de Développement Durable, Danone.”
Davies, B., & Doble, M. 2004. “The Development and Implementation of a Landfill Tax in the UK.”
Addressing the Economics of Waste.
Eco-Emballages. 2012. “Rapport d’Activité Eco-Emballages.”
Eco-Emballages. 2012b. “Tri et Recyclage Des Emballages Tout Ce Qui Doit Contribuer À L’économie
Circulaire Pour Les 20 Ans À Venir.”
Eco-Emballages. 2013. “Rapport d’Activité Eco-Emballages.”Égert, B. 2012. “Politiques
Environnementales de La France: Internaliser Les Externalités Globales et Locales.” OECD Economics
Department Working Papers 859.

39
Ernst & Young pour Verre et Avenir. 2013. " L’industrie Du Verre d’Emballage : Un Acteur Economique
Majeur, Engagé Au Coeur Des Territoires Dans Une Economie Circulaire Responsable ".
Eunomia. 2011. “A Comparative Study on Economic Instruments Promoting Waste Prevention.”
European Commission. 2001. “Waste Management Options and Climate Change”.
European Commission. 2008. “Initiative «matières Premières» — Répondre a Nos Besoins
Fondamentaux Pour Assurer La Croissance et Créer Des Emplois En Europe”. Communication de la
Commission au Parlement européen, au Conseil, au Comité économique et social européen et au Comité
des régions.
European Commission. 2010. “The Environmental Impact of the Dutch Packaging Tax”.
European Commission. 2011. “Une Europe Efficace Dans L’utilisation Des Ressources – Initiative Phare
Relevant de La Stratégie Europe 2020”. Communication de la Commission au Parlement européen, au
Conseil, au Comité économique et social européen et au Comité des régions.
European Commission. 2014b. Directive Proposal Amending Directives 2008/98/EC on Waste, 94/62/EC
on Packaging and Packaging Waste, 1999/31/EC on the Landfill of Waste, 2000/53/EC on End-of-Life
Vehicles, 2006/66/EC on Batteries and Accumulators and Waste Batteries and Accumulators, and
2012/19/EU on Waste Electrical and Electronic Equipment.
European Commission. 2014. “Towards a Circular Economy: A Zero Waste Programme for Europe”.
Report from the Commission to the European Parliament, the Council, the European Economic and Social
Committee and the Committee of the Region.
European Commission 2006. “Inclusion of Additional Activities and Gases into the EU Emissions Trading
Scheme.”
European Environment Agency. 2005. “Effectiveness of Packaging Waste Management Systems in
Selected Countries: An EEA Pilot Study”
European Environment Agency. 2011a. “Projections of Municipal Waste Management and GHG".
European Environment Agency. 2011b. “Waste Opportunities — Past and Future Climate Benefits from
Better Municipal Waste Management in Europe”.
European Environment Agency. 2014. “Progress on Resource Efficiency and Decoupling in the EU‑27.”
European Topic Centre on Sustainable Consumption and Production. 2011. “Overview of the Use of
Landfill Taxes in Europe”. Copenhagen Resource Institute.
Germain, J. & Jarlier, P. 2014. “Rapport D’information Sur Le Bilan et Les Perspectives D’évolution de La
Redevance et de La Taxe D’enlèvement Des Ordures Ménagères (REOM et TEOM),” Sénat (Commission
des finances).
GIEC. 2014. “Climate Change 2014. Mitigation of Climate Change. Rapport, Contribution Du Groupes de
Travail III Au Cinquième Rapport D’évaluation Du Groupe D’experts Intergouvernemental Sur L’évolution
Du Climat”.
Glachant, M. 2005. “Le Concept de Responsabilité Élargie Du Producteur et La Réduction À La Source
Des Déchets de Consommation.” Annales Des Mines–Responsabilité et Environnement juillet (39).
Glachant, M. pour l’UFC Que Choisir ? 2006. “La Prévention Des Déchets D’emballages En France”.
CERNA, Ecole des Mines de Paris.
Grand Toulouse, communauté urbaine. 2012. “Plan Climat : Le Plan D’actions de La Communauté
Urbaine Du Grand Toulouse et de La Ville de Toulouse.”
INCPEN. 2009. "Table For One: The Energy Cost To Feed One Person".
IPSOS for Eco-Emballages, 2014. “The packaging waste sorting practices in France"

40
Loi N° 2009-967 Du 3 Août 2009 de Programmation Relative À La Mise En Œuvre Du Grenelle de
L’environnement. 2009. 2009-967.
Loi N° 2010-788 Du 12 Juillet 2010 Portant Engagement National Pour L’environnement. 2010. 2010-788.
Martinsen, T. & Vassnes, E. 2004. “Waste Tax in Norway.” Addressing the Economics of Waste.
McKinsey & Company. 2009. “Greenhouse Gas Emissions and the Potential for Mitigation from Materials
Management within OECD Countries.”
MEDDE. 2013. Projet de Plan National de Prévention Des Déchets : 2014-2020.
MEDDE. 2014. Projet de Loi de Programmation Pour La Transition Énergétique.
MEDDE. 2014b. “Communiqué de Presse : Déchets D’emballages Ménagers Philippe MARTIN Demande
Un Plan D’action Pour Atteindre L’objectif de 75 % de Recyclage.”
MEDDTL. 2011. “Premier Bilan de La Réforme de La TGAP de 2009 et de La Politique de Soutien Sur
Les Déchets Ménagers et Assimilés.”
OECD. 2001. “Responsabilité Élargie Des Producteurs, Manuel À L’intention Des Pouvoirs Publics”.
OECD. 2004. “Economic Analysis of Solid Waste Management Policies.” Addressing the Economics of
Waste.
OECD. 2012b. “Waste Management and Climate Change”.
OECD. 2012. “Greenhouse Gas Emissions and the Potential for Mitigation from Materials Management
within OECD Countries”.
Parlement et Conseil européens.Directive 2008/98/CE Relative Aux Déchets et Abrogeant Certaines
Directives. 2008. 2008/98/CE.
Parlement et Conseil européens. Directive 94/62/CE Relative Aux Emballages et Aux Déchets
D’emballages. 94/62/CE.
Parlement et Conseil européens. Directive No 2004/12/CE Modifiant La Directive No 94/62/CE Relative
Aux Emballages et Aux Déchets D’emballages. 2004. 2004/12/CE.
Peterson, C. & Godin, J. 2011. “Clean Development Mechanism and Development of a Methodology for
the Recycling of Municipal Solid Waste”. Banque Mondiale.
PNUE. 2010. “Waste and Climate Change”.
Terra S.A. pour l’ADEME. 2013. “Etat Des Lieux Du Parc Des Centres de Tri de Recyclables Secs
Ménagers En France.”

41
LATEST PUBLICATIONS IN CDC CLIMAT’S “CLIMATE REPORTS” SERIES
No. 49 The previous common agricultural policy (2003-2013) reduced French agricultural
emissions
Mathilde Baudrier, Valentin Bellassen & Claudine Foucherot – April 2015
No. 48 Development and outlook for agriculture in international climate negotiations
Clothilde Tronquet & Claudine Foucherot – February 2015
No. 47 Climate change mitigation through wood products in the French policy framework:
prioritising firewood
Mariana Deheza, Carmen N’Goran & Valentin Bellassen – September 2014
No. 46 Smart Unconventional MOnetary (SUMO) Policies: Giving Impetus to Green Investment
Camille Ferron & Romain Morel – July 2014
No. 45 Introducing short term flexibility in the EU-ETS to assure its long-term credibility: a multi
criteria analysis of policy options
Zuheir Desai, Emilie Alberola And Nicolas Berghmans – July 2014
No. 44 Ex-post evaluation of the Kyoto Protocol: Four key lessons for the 2015 Paris Agreement
Romain Morel & Igor Shishlov – May 2014
No. 43 Use of Kyoto credits by European installations: from an efficient market to a burst
bubble
Nicolas Stephan, Valentin Bellassen & Emilie Alberola – January 2014
No. 42 Power sector in Phase 2 of the EU ETS: fewer CO2 emissions, but just as much coal
Nicolas Berghmans & Emilie Alberola - November 2013
No. 41 The European Union's 2030 climate and energy package: let's avoid "3 x 30%" in 2030!
Valentin Bellassen, Nicolas Berghmans, Olivier Gloaguen, Oliver Sartor, Nicolas Stephan, Igor
Shishlov and Emilie Alberola - August 2013
No. 40 Forestry and climate change mitigation in European policies: prioritising firewood
Frederic Baron, Valentin Bellassen & Mariana Deheza- April 2013
No. 39 More than 800 agricultural and agri-food sites affected by the EU ETS
Claudine Foucherot & Valentin Bellassen - March 2013
No. 38 The economic tools of Chinese climate and energy policy
on the occasion of the 12th
five-year plan
Di Zhou and Anaïs Delbosc - January 2013
No. 37 10 lessons from 10 years of the CDM
Claudine Foucherot & Valentin Bellassen - March 2012
No. 36 Regional Climate – Air – Energy Plans: a tool for guiding the energy and climate
transition in French regions
Jérémie de Charentenay, Alexia Leseur et Cécile Bordier - September 2012
No. 35 Delivering REDD+ incentives to local stakeholders: lessons from forest carbon
frameworks in developed countries
Mariana Deheza, Carmen N’Goran & Valentin Bellassen – September 2012
All CDC Climat Research publications are available from:
http://www.cdcclimat.com