missouri timber price trends · 3 editor’s note - tom treiman and jason jensen, editors we‘ve...
TRANSCRIPT

1
MISSOURI TIMBER
PRICE TRENDS July-Sept., 2012, Vol. 22 No. 3
Missouri Department of Conservation, Forestry Division
North/ Southwest Stumpage Prices- (Prices and volume reported in Doyle MBF scale
High Low Average $/Board foot Last Qtr Last Yr. Vol. # of Rpts.
Veneer Walnut, Black $3,100 $1,200 $2,455 $2.45 $2,415 - 48 12
Sawlogs Hickory $220 $50 $85 $.09 - - 35 5 Mixed Hardwoods $220 $40 $85 $.09 $80 $95 1,070 18 Oak (mixed species) $280 $30 $140 $.14 $145 $120 659 9 Post Oak $160 $60 $70 $.07 - - 15 3 Red oak (group) $600 $35 $100 $.10 $85 $95 1,576 13 Soft Maple $300 $50 $200 $.20 $200 - 244 3 Walnut, Black $1,250 $400 $745 $.75 $770 $835 119 16 White oak (group) $800 $50 $185 $.19 $175 $245 1,517 16
Ozarks Stumpage Prices- (Prices and volume reported in International ¼ MBF scale)
High Low Average $/Board foot Last Qtr. Last Yr. Vol. # of Rpts.
Sawlogs Hickory $260 $60 $165 $.17 $135 $80 220 15 Mixed Hardwoods $260 $50 $190 $.19 $230 $200 573 12 Oak (mixed species) $220 $40 $125 $.13 $140 $130 2,687 16 Post Oak $120 $70 $90 $.09 $90 $115 54 9 Red oak (group) $260 $110 $200 $.20 $185 $155 3,387 16 Shortleaf Pine $260 $50 $165 $.17 $145 $55 47 10 Walnut, Black $665 $85 $225 $.23 $225 - 10 5 White oak (group) $260 $110 $180 $.18 $180 $150 503 18
Ozarks Salvage Prices- (Prices and volume reported in International ¼ MBF scale)
High Low Avg. Vol. # of Rpts.
Sawlogs Oak (mixed species) $150 $42 $111 1422 4
Note: MBF = 1,000 board feet. To convert either prices or volume from MBF to board feet divide by 1,000.
2
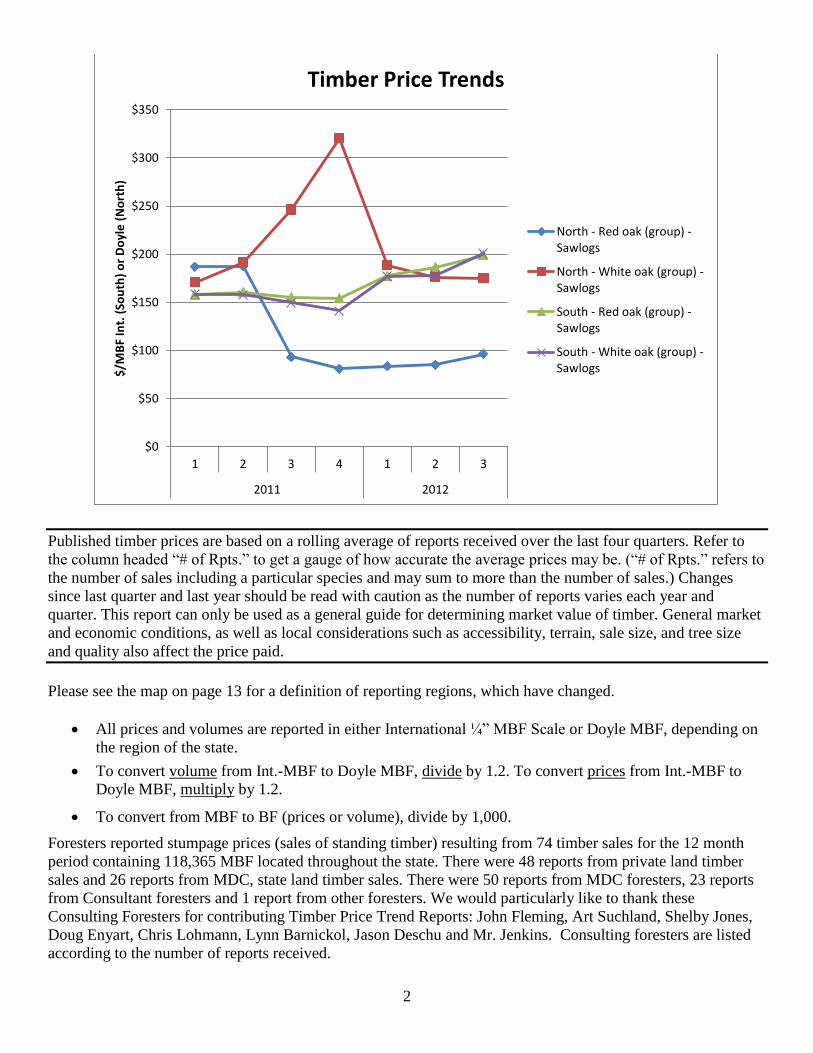
Published timber prices are based on a rolling average of reports received over the last four quarters. Refer to
the column headed ―# of Rpts.‖ to get a gauge of how accurate the average prices may be. (―# of Rpts.‖ refers to
the number of sales including a particular species and may sum to more than the number of sales.) Changes
since last quarter and last year should be read with caution as the number of reports varies each year and
quarter. This report can only be used as a general guide for determining market value of timber. General market
and economic conditions, as well as local considerations such as accessibility, terrain, sale size, and tree size
and quality also affect the price paid.
Please see the map on page 13 for a definition of reporting regions, which have changed.
All prices and volumes are reported in either International ¼‖ MBF Scale or Doyle MBF, depending on
the region of the state.
To convert volume from Int.-MBF to Doyle MBF, divide by 1.2. To convert prices from Int.-MBF to
Doyle MBF, multiply by 1.2.
To convert from MBF to BF (prices or volume), divide by 1,000.
Foresters reported stumpage prices (sales of standing timber) resulting from 74 timber sales for the 12 month
period containing 118,365 MBF located throughout the state. There were 48 reports from private land timber
sales and 26 reports from MDC, state land timber sales. There were 50 reports from MDC foresters, 23 reports
from Consultant foresters and 1 report from other foresters. We would particularly like to thank these
Consulting Foresters for contributing Timber Price Trend Reports: John Fleming, Art Suchland, Shelby Jones,
Doug Enyart, Chris Lohmann, Lynn Barnickol, Jason Deschu and Mr. Jenkins. Consulting foresters are listed
according to the number of reports received.
$0
$50
$100
$150
$200
$250
$300
$350
1 2 3 4 1 2 3
2011 2012
$/M
BF
Int.
(So
uth
) o
r D
oyl
e (
No
rth
)
Timber Price Trends
North - Red oak (group) -Sawlogs
North - White oak (group) -Sawlogs
South - Red oak (group) -Sawlogs
South - White oak (group) -Sawlogs
3
Editor’s Note - Tom Treiman and Jason Jensen, Editors We‘ve made some changes to try to improve the report for both landowners and foresters with this issue of the
Missouri Department of Conservation‘s Timber Price Trends. Due to a slow economy, and the voluntary nature
of timber sale reporting in Missouri, the number of reports we receive has fallen off in recent years. The result is
that some average prices were based on very few reports. Due to these issues, we began calculating average
prices based on a rolling dataset of all reports from the past 12 months. The oldest quarterly report drops out as
new quarterly report comes in. This should provide more reports to back up each average price, as well as
removing some artificial volatility from the numbers.
We have also reduced the number of reporting regions from three to two (North/ Southwest and Ozark). This
will also help to increase the number of reports that go into each published Timber Price Trend. Each region
will report prices in the scale most commonly used in that region (Doyle for the North/ Southwest Region and
International ¼ for the Ozark Region) with no ―Statewide‖ attempt to merge the two. This will further increase
the reliability of the data by eliminating error associated with converting from one scale to the other.
We would like to thank the members of the Missouri Forest Resources Advisory Council (MOFRAC) who
helped with these changes in direction. The Missouri Consulting Foresters Association and the Missouri
Department of Conservation have been instrumental in taking steps to encourage more reporting from their
members and employees. Timber sale reports are critical in providing an accurate assessment of market
conditions.
One of the most valuable sources for information on timber markets is the local Missouri Department of
Conservation Resource Forester or your Consulting Forester. Contact the nearest Forest District office for up-
to-date, local advice. The Missouri Department of Conservation's Forestry Division, (573) 751-4115, will be
happy to provide you with the name and address of the Resource Forester or MDC Regional Office nearest to
you. You can locate a Consulting Forester by visiting the Mo. Consulting Forester's Association web site at:
www.missouriforesters.com or by visiting the Private Land Assistance page of the MDC website
http://mdc.mo.gov/landown/ and clicking on the ―Conservation
Assistance Contractors‖ link.
The logger plays a critical role in the harvesting of your timber
sale. The Master Logger Certification (MLC) program can
make your choice easier. The MLC program can help provide
piece of mind for the landowner. Master Loggers are
professional, properly trained, and meet the highest standards
placed on the industry today. The MLC program is a
performance based program that recognizes both training and
experience. To find a Master Logger in your area visit the
following website:
http://www.moforest.org/MLC/mmldirectory.html
The Professional Timber Harvester (PTH) program provides
four levels of chainsaw safety training, provides instruction on
use and implementation of ―best management practices‖ and
forest management. PTH trained loggers possess the knowledge
to harvest your timber while insuring that your residual trees,
soil, and property are properly cared for. To locate a PTH
trained logger in your area visit the following
website: http://www.moforest.org/loggersindex.php
4
Current Market
Conditions By Jason Jensen
Markets have improved over the
previous quarter. Mills were
previously having a hard time
moving grade lumber. Many mills
had been placed on a quota for the
amount of grade lumber they
could sell and were sitting on
significant inventories of lumber.
Demand for grade lumber appears
to be up although prices haven‘t
had the same corresponding
increase. Flooring grades seem to
be in demand as well as most
other grades. There is even a little
movement in the pine market
although I don‘t anticipate that
will last. One concern in the
Ozarks is that some mills have
been placed on a quota for the
amount of railroad ties they can
produce. This is a significant
concern since the tie market has
really kept Missouri‘s timber
industry ―propped up‖ during
these tough economic times. The
white oak market continues to be
strong especially with stave
quality timber. The ―white wood‖
species continue to be popular
among consumers and demand is
good especially in the River Hills.
Log inventories on average tend to
be low at most mills. This is a
concern especially going into fall/
winter.
U.S. Housing Starts
Surge to Fastest Pace
Since 2008 By Jason Lange, Reuters
Groundbreaking on new U.S.
homes surged in September to its
fastest pace in more than four
years, a sign the housing sector‘s
budding recovery is gaining
traction and supporting the wider
economic recovery.
Housing starts increased 15 per
cent last month to a seasonally
adjusted annual rate of 872,000
units, the Commerce Department
said on Wednesday.
That was the quickest pace since
July 2008, though data on starts is
volatile and subject to substantial
revisions.
The U.S. economy has shown
signs of faster growth in recent
months as the jobless rate has
fallen and retail sales data has
pointed to stronger consumer
spending.
The data showed housing, which
was battered by the 2007-09
recession, is increasingly one of
the brighter spots in the economy
and could add to growth this year
for the first time since 2005.
―One of the big headwinds for the
economy has been the weak
housing market and this indicates
that headwind has dissipated,‖
said Gary Thayer, an economic
strategist at Wells Fargo Advisors
in St. Louis, Missouri.
The brighter economic signal is
likely to be welcomed at the White
House, where a sluggish economy
is weighing on President Barack
Obama‘s chances of re-election
next month.
Economists estimate that for every
new house built, at least three new
jobs are created.
More home building could help
compensate for some of the
weakness recently in factory
output, which is seen as due to
sluggish export demand and
cooling investment in capital
goods.
Economists polled by Reuters had
forecast residential construction
rising to a 770,000-unit rate.
August‘s starts were revised to
show a 758,000-unit pace instead
of the previously reported
750,000.
Housing remains hampered by an
glut of unsold homes, and the
housing starts rate is still about 60
per cent below its January 2006
peak.
September groundbreaking for
single-family homes, the largest
segment of the market, rose 11 per
cent to a 603,000-unit pace – the
highest level since August 2008.
Starts for multi-family homes
climbed 25.1 per cent.
―Things are lining up for housing
and housing is likely to contribute
to GDP growth this year ,‖ said
John Canally, an economist at
LPL Financial in Boston. ―It‘s
another step in the right direction,
but you still have a long, long way
to get back to ‗normal‘ in
housing.‖
Building permits grew by 11.6 per
cent to a 894,000-unit pace in
September. August‘s permits were
unrevised at 801,000 units.
Economists had expected permits
to rise to a 810,000-unit pace last
month.
U.S. home sales have been
creeping up and the steep decline
in prices since 2006 appears to
have bottomed. That has helped
home-builder sentiment, which

5
this month rose to a fresh six-year
high.
In a bid to help the economy by
encouraging people to buy homes,
the Fed said last month it would
buy $40-billion (U.S.) in
mortgage-backed securities every
month until the jobs outlook
improves substantially.
The Fed‘s efforts to lower
borrowing costs have pushed
interest rates on 30-year
mortgages to all-time lows. Last
week, fixed 30-year mortgage
rates rose 1 basis point to average
3.57 per cent, the Mortgage
Bankers Association said.
Applications for U.S. home
mortgages fell last week, but
demand for purchase loans, a
leading indicator of home sales,
reached the highest level since
June, the association said.
Year-over year, Chinese
log and lumber imports
down 19% from
Jan-Aug, 2012
October 15, 2012 By: Wood Resource Quarterly
Importation of both logs and
lumber to China fell substantially
in 2012. Total imports, by value,
during the first eight months was $
4.3 billion dollars, or 19% less
than in 2011, with the biggest
declines in logs imported from
Russia and the US, and in lumber
from North America.
The reduction in construction
activities in China during 2012 has
resulted in reduced demand for
lumber, and as a consequence, a
sharp decline in the importation of
softwood logs and lumber to the
country. During the first eight
months this year, China imported
logs and lumber worth 4.3 billion
dollars, or 19 percent less than the
same period last year, as reported
in the Wood Resource Quarterly
(www.woodprices.com). By
volume, log imports were down 17
percent and lumber imports down
five percent.
The importation of softwood
lumber in August was down for
the third consecutive quarter to 1.1
million m3, which was a decline
of 21 percent from May and 23
percent lower than in August
2011. Canada and Russia are the
two dominant suppliers of
softwood lumber to China,
together accounting for 84 percent
of the total imports, with the US,
Chile and New Zealand making up
most of the remaining import
volume.
During the first eight months of
this year, Russia, Chile and New
Zealand have increased their
shipments to China, while
volumes from North America have
declined. Exports from the US are
down as much as 41 percent as
compared to the same period in
2011.
In August, the average import
value for all softwood lumber
imported to China was down nine
dollars to $203/m3 from a year
ago, according to Customs data.
The cost for Russian lumber fell as
much as $19/m3, while Canadian
average costs were down only five
dollars to $200/m3 over the past
year. Costs for Canadian lumber
have steadily increased from
earlier this year and here at a 12
month-high in August.
Chinese softwood log imports
have fallen dramatically this year.
From January through August,
imports from Russia were down
21 percent, and from the US, 31
percent as compared to the same
period in 2011. The two other
major log-supplying countries,
New Zealand and Canada, have
shipped practically the same
volume this year as last year.
With the reduced demand for
logs by the lumber industry in
China, log prices have fallen
through most of 2012. According
to the latest issue of the WRQ,
average import softwood log
values in the 3Q/12 were down 13
percent from a year ago, and
domestic
Chinese-fir log prices have fallen
about six percent in 12 months.
St. Louis area firms
complete biomass boiler
project at the University
of Missouri-Columbia By: Robert Kelly,
St. Louis Post-dispatch
Ladue-based McCarthy Building
Cos. Inc., Chesterfield-based
CB&E Construction Group and
Fenton-based Kaiser Electric
crews completed a project for the
University of Missouri –
Columbia that replaces a coal
boiler at its Columbia campus
power plant with a more efficient
and cleaner biomass unit.
The new boiler, which was
retrofitted to the university‘s

6
existing heating duct system, is
expected to use an estimated
100,000 tons of in-state renewable
energy sources such as chipped
hardwoods and wood waste.
The new unit is also expected to
reduce the campus‘ fossil fuel use
by 25 percent. Since 2007, the
power plant has been using about
5,000 tons of biomass per year,
plus coal, in its other boilers.
Along with wiring the new
biomass boiler, Kaiser Electric
crews also provided electrical
service, lighting and control and
instrumentation wiring on the $75
million project.
The general contractor on the
project was McCarthy in
partnership with CB&E
Construction Group. Sega
Engineering and Technical
Services of Overland Park, Kansas
was the project engineer.
Verifying Forest
Sustainability
More customers and
policymakers seek
assurances that the
forest-derived fuel or
feedstock they purchase
is harvested in a
sustainable manner.
By: Charles A. Levesque and
Eric W. Kingsley Increased talk about the use of
woody biomass for energy in the
U.S. has many people wondering
how best to assure that the fuel
and feedstock used by wood
energy firms is harvested
sustainably. The forest products
industry—sawmills and pulp
mills, in particular—has been
down this road for more than 15
years and many have turned to the
major forest certification systems
available in the U.S., namely the
Sustainable Forestry Initiative, the
Forest Stewardship Council and
the American Tree Farm System.
These systems may or may not be
the best way to demonstrate the
sustainability of feedstock
harvesting for the woody biomass
energy sector. In the end, your
customers‘ needs and your
company values should drive what
you do about forest sustainability.
The Forest Certification
Systems
SFI, FSC and ATFS are private,
non-governmental programs, all of
which are part of one of two major
forest certification systems in the
world: the Forest Stewardship
Council and Programme for the
Endorsement of Forest
Certification. In the U.S., the FSC
system is part of the Forest
Stewardship Council international
program, whereas SFI and ATFS
are part of PEFC.
Collectively, the three certification
systems currently have 92 million
acres certified in the U.S. Some of
those acres are certified to both
SFI and FSC and are therefore
double counted, and further
confusing, FSC does not allow for
reciprocity with SFI or ATFS, and
vice versa. Importantly, SFI and
ATFS do allow reciprocity
between their systems because
they are both part of PEFC. SFI is
for larger ownerships, over 20,000
acres, while ATFS is for
ownerships smaller than 20,000
acres. Most tree farms are much
smaller and average just over 200
acres.
So what do these systems do? In a
nutshell, each of the FSC, SFI and
ATFS systems has a standard— a
series of detailed requirements for
how a forest property must be
managed—under which a
landowner must manage in order
to become certified. An outside
accredited entity sends an auditor
to conduct a third-part audit to
determine conformance with the
many detailed criteria in the
standard.
The audit will be conducted by an
entity that has no direct affiliation
with the company or landowner
being audited, ensuring that there
are no conflicts of interest. If
landowners pass the initial and
subsequent annual audits, they can
make claims about products
relative to their certification
program. They can also label their
product with the logo of the
program, if they get a companion
certification to the system‘s chain
of custody. A CoC system
essentially assures that a product
indeed came from a certified
forest when a landowner makes
that claim.
A Bit of History Concerns over rainforest
destruction lead to the Statement
of Forest Principles at the 1992
Earth Summit in Rio de Janeiro.
The forest principles laid out the
definition of a sustainably
managed forest, which was further
refined through the Montreal
Process. Ultimately, this led to the
formation of the FSC in 1993 by a
group of people from
environmental organizations,
social sciences and the forest
industry.

7
The SFI was created one year later
by the American Forest and Paper
Association, the national trade
group of the U.S. forest products
industry. Originally a self-
verification system, SFI changed
into a full third-party system by
the late 1990s. SFI only covers the
U.S. and Canada, but similar
country-based forest certification
systems from around the world
became aligned under another
international umbrella system
called PEFC. SFI and ATFS had
to pass the requirements of PEFC
to be recognized as part of that
system; SFI in 2005 and ATFS in
2008. Notably, ATFS was created
for U.S. landowners in the 1940s
and only changed to a third-party
certification system within the past
10 years.
Energy Plants and
Sustainability Energy producing plants that use
wood as feedstock, whether they
are producing electricity, heat,
pellets or biofuel, generally have
one thing in common: they do not
own the forestland from which
their feedstock timber is
harvested. As a result, they tend to
have little direct control over
where and how their feedstock is
produced in the woods. Some
sawmills and pulp mills are
similar in that regard, but even
those that own forestland in large
acreages do not own enough to
rely solely on their own land for
feedstock.
SFI, FSC and ATFS help address
the challenge of accountability
when sourcing feedstock from
forests owned by outside parties.
In each case, certified entities are
allowed to make public claims
about sustainability, based on the
premise that being certified to the
rigorous third-party audited
standard is an indication that they
are managing in a sustainable way.
If a wood-using energy plant were
able to obtain the vast majority of
its wood supply from certified
forest land, it could use a CoC
system to claim that its wood
supply comes from sustainably
harvested forests. This, however,
is where the rub is. Most places in
the U.S. simply do not have
enough certified acreage to allow
a manufacturing plant to make this
claim, and the relatively low-value
landowners receive from
harvesting wood for energy
purposes—as opposed to lumber,
etc.—means that biomass users
have limited opportunity to
incentivize new certified acreage.
Exceptions might include parts of
Maine and Wisconsin, where
substantial acreage is already
certified to one or more of the
systems. But if you aren‘t located
in Maine and Wisconsin or some
other pocket of certified forest,
what do you do?
SFI has an option called fiber
sourcing certification, which uses
a different standard than the
regular land management SFI
standard. Fiber sourcing certifies
the entire wood procurement
system of the facility. It is a less
rigorous system, but it reaches out
to all the forest landowners who
provide woody feedstock.
Another Approach: Design
Your Own System In some cases, it might not be
feasible or practical to use SFI,
FSC or ATFS to demonstrate your
commitment to forest
sustainability, especially if your
customers are not demanding it. In
this case, there are ways to design
your own system. One approach
Innovative Natural Resource
Solutions has used with clients is
developing a tracking system for
wood sources. With this approach,
it can be useful to show
information about where your
wood comes from, the amount that
comes from certified forests, or
the amount that was harvested
with a licensed or certified forester
and/or logger involved. There are
many other ways to add additional
components to a self-designed
system. In the end, the system
should do what you and your
customers need it to do.
Fourth Quarter
Hardwood Price
Increase Expected By: Andy Johnson
During the first eight months of
2012, brisk industrial lumber
shipments, rising flooring-grade
lumber sales and record exports to
the Far East helped many North
American hardwood sawmills get
back into the black. Relatively
tight log supplies, limited access
to capital, and a growing aversion
to sawing unprofitable items kept
mills from overproducing markets,
as often occurred during past
upturns. Consequently, green and
kiln-dried lumber prices were
unusually stable well into the
summer.
With kilns turning quickly and
exports seasonally slow, prices for
some items are now under

8
downward pressure. However, we
expect only minor price decreases
before hardwood lumber supply
and demand are again balanced,
probably by the end of October.
If exports to Asia stay at record
levels, domestic demand gradually
expands, and lumber production
stays at or near the current level—
as we are forecasting—then spot
shortages are likely by December.
Green sawmills should have very
little trouble moving lumber at
steady to somewhat higher prices
in the fourth quarter.
Despite the challenges of the day,
domestic and international
markets will offer hardwood
producers plenty of business
opportunities through year-end.
There are still three full months
left in 2012, and we expect them
to be fairly good ones.
Why wood pulp is
world's new wonder
material By: Will Ferguson
THE hottest new material in town
is light, strong and conducts
electricity. What's more, it's been
around a long, long time.
Nanocrystalline cellulose (NCC),
which is produced by processing
wood pulp, is being hailed as the
latest wonder material. Japan-
based Pioneer Electronics is
applying it to the next generation
of flexible electronic displays.
IBM is using it to create
components for computers. Even
the US army is getting in on the
act, using it to make lightweight
body armour and ballistic glass.
To ramp up production, the US
opened its first NCC factory in
Madison, Wisconsin, on 26 July,
marking the rise of what the US
National Science Foundation
predicts will become a $600
billion industry by 2020.
So why all the fuss? Well, not
only is NCC transparent but it is
made from a tightly packed array
of needle-like crystals which have
a strength-to-weight ratio that is
eight times better than stainless
steel. Even better, it's incredibly
cheap.
"It is the natural, renewable
version of a carbon nanotube at a
fraction of the price," says Jeff
Youngblood of Purdue
University's NanoForestry
Institute in West Lafayette,
Indiana.
The $1.7 million factory, which is
owned by the US Forest Service,
will produce two types of NCC:
crystals and fibrils.
Production of NCC starts with
"purified" wood, which has had
compounds such as lignin and
hemicellulose removed. It is then
milled into a pulp and hydrolysed
in acid to remove impurities
before being separated and
concentrated as crystals into a
thick paste that can be applied to
surfaces as a laminate or
processed into strands, forming
nanofibrils. These are hard, dense
and tough, and can be forced into
different shapes and sizes. When
freeze-dried, the material is
lightweight, absorbent and good at
insulating.
"The beauty of this material is that
it is so abundant we don't have to
make it," says Youngblood. "We
don't even have to use entire trees;
nanocellulose is only 200
nanometres long. If we wanted we
could use twigs and branches or
even sawdust. We are turning
waste into gold."
The US facility is the second pilot
production plant for cellulose-
based nanomaterials in the world.
The much larger CelluForce
facility opened in Montreal,
Canada, in November 2011 and is
now producing a tonne of NCC a
day.
Theodore Wegner, assistant
director of the US factory, says it
will be producing NCC on a large
scale. It will be sold at just several
dollars a kilogram within a couple
of years. He says it has taken this
long to unlock the potential of
NCC because the technology to
explore its properties, such as
electron scanning microscopes,
only emerged in the last decade or
so.
NCC will replace metal and
plastic car parts and could make
nonorganic plastics obsolete in the
not-too-distant future, says Phil
Jones, director of new ventures
and disruptive technologies at the
French mineral processing
company IMERYS. "Anyone who
makes a car or a plastic bag will
want to get in on this," he says.
In addition, the human body can
deal with cellulose safely, says
Jones, so NCC is less dangerous to
process than inorganic composites.
"The worst thing that could
happen is a paper cut," he says.

9
Missouri Organizes For
Energy Independence By: Jim Lane
Independence, MO – Despite
having as much as two billion
barrels of fossil petroleum at
attractive depths in the southwest
part of the state, Missouri has
never developed much of a liquid
fuels production industry. It‘s
heavy oils have been costly to
extract, and attempts to use new
technologies such as microbial
enhanced oil recovery and
fracking have not yet proved
generally successful.
Like many states (or countries)
that have limited oil reserves or
reserves that are economically
unfeasible to extract at this time –
the path to energy independence
lies generally in Missouri‘s
substantial ―above-ground oil
fields‖ – which is to say, in her
considerable biobased resources.
To date, the state has become
home to six corn ethanol plants
with 275 million gallons of fuel
capacity and can produce 825,000
tons of distillers grains, using up
about 15 percent of the Missouri
corn crop in the process – and
eight biodiesel plants that with
228 million gallons in capacity.
Missouri‘s progress to date: first-
gen biofuels
Overall, Missouri consumes 4.2
billion gallons each year of motor
gasoline and diesel – so it‘s a long
road to energy independence.
Which, according to the Digest‘s
thesis, has kept the state overly
exposed to the boom and bust
economies that result from energy
dependence.
As the Digest noted in a previous
report, states that produced
enough fuel to meet their internal
demand for gasoline maintained
growth rates 2.5 times above the
national average, and either
completely avoided the 2007-09
recession or experienced a lighter
version of it. These states
maintained a GDP growth in
2007-08 at five times the rate of
states that were less than 20
percent energy independent.
Cellulosic biofuels production in
Missouri
There‘s production here today of
cellulosic biofuels in Missouri on
a pilot scale. Last summer, ICM
finished construction of its $31
million cellulosic ethanol plant
near St. Joseph. The facility has
the capacity to produce 250,000
gallons a year from switchgrass,
sorghum and corn stover from a
250 mile radius. The facility is one
of a handful the company has
received federal loans for in order
to complete construction.
Growth down in the Boot Heel
Here‘s the great news. In the
southeastern section of the state,
Missouri Delta AgBioWorks –
partnered with the state‘s Dept. of
Agriculture, Sikeston Area
Chamber of Commerce, Memphis
BioWorks, Delta Regional
Authority, Mo Technical
Corporation as well as many other
organizations and Universities –
has set a goal to build a Bio-based
economy in the 7 counties of
Missouri‘s most productive
agriculture region known as the
Boot Heel of Missouri.
AgBioWorks is, itself, a multi-
state consortium focused on
development of a bio-based
economy in a region
encompassing parts of Missouri,
Kentucky, Arkansas, Tennessee
and Mississippi – 98 countries that
make up the Mississippi Delta
region. . The group has estimated
that in its region is up to 59
million tons in sustainable
biomass reserves – up to 7.9
billion gallons of ethanol-
equivalent fuels (using the
maximum yields from cellulosic
productino we‘ve seen to date in
demonstration-level projects).
That‘s enough to lift Missouri,
were all of the production realized
and enough directed the Show Me
State‘s way, into energy
independence.
The full AgBioWorks report on
regional biomass resources, and
the proposed development of its
bioeconomy, is here.
Among the near-term advantages
the group sees: redeployment of
existing industrial infrastructure;
introduction of new, high-value
crops; opportunities to attract
regional investment in pilot and
demonstration projects; and the
opportunities to increase grower
incomes by making marginal lands
economically feasible.
Specifically, the AgBioWorks
plans envisions up to five 200 ton
per day oilseed crushing facilities,
between 13 and 33 150,000 ton
pellet plants for wood biomass,
and up to 117 biorefineries using
lignocellulosic feedstock, with
average production capacities of
40 million gallons each. In the
process, creating more than 5,000
new, direct jobs.
―Our focus is not only on bio-fuels
but bio-based products,‖ explains

10
Missouri Delta AgBioWorks
director Chris Evans. ―Biomass
energy crops such as Giant
Miscanthus, Sweet Sorghum,
sugar beets, and Canola are just a
few of the crops that are being
grown and researched here and
show the most potential as future
feedstock for the region. Missouri
Delta AgBioWorks along with
MRI Global are also in the process
of organizing an Algae Summit to
be held November of 2012 in
Sikeston, Missouri.‖
―Our top priority from day one has
been to create and protect
Missouri jobs and help folks get
back to work,‖ Missouri governor
Jay Nixon explained recently as he
announced a $635K Delta
Regional Authority grant, which
included $75K for Missouri
AgBioWorks.
―The new ag economy can be
energy – it can also be food or
pharmaceuticals,‖ Sikeston Area
Chamber executive director Missy
Marshall told local reporters at the
time of the grants. ―There are
chemical components from crop
residue used to make plastic.
Literally anything a petroleum
product may be involved in can be
produced.‖
USDA steps in to assist
Last year, the USDA announced
today the establishment of its first
Biomass Crop Assistance Program
(BCAP) Project Area to promote
the production of dedicated
feedstocks for bioenergy, and
chose a 39-county contiguous
region in Missouri and Kansas for
the project.
A likely candidate for turning all
that feedstock into bioenergy – in
the short term, the Abengoa
Bioenergy project in Hugoton,
Kansas is one possible destination.
Producers in the area will plant up
to 50,000 acres of mixes of
perennial native plants, such as
switchgrass, for the manufacture
of biomass pellet fuels and other
biomass products to be used for
power and heat generation. The
proposed crops also will provide
long term resource conserving
vegetative cover. The project is a
joint effort between the agriculture
producers of Show Me Energy
Cooperative.
The program provides an
opportunity for teams of crop
producers and bioenergy facilities
to submit proposals to USDA to
be selected as a BCAP project
area. If selected, crop producers
will be eligible for
reimbursements of up to 75
percent of the cost of establishing
a bioenergy perennial crop.
Other feedstock developments
Yesterday, researchers from the
University of Missouri were
awarded a $5.4 million grant from
the DOE to research non-food
crops as potential biofuel
feedstocks. About 100 million
acres of marginalized agricultural
land in 10 states along the
Missouri and Mississippi Rivers
are unused or underutilized but
could potentially grow non-food
feedstocks for biofuels.
Just last month, a $200,000 grant
opened up a new biofuel research
field in Southeastern Missouri
designed to test soybeans and
sweet sorghum. The grant, coming
foam the Delta Regional
Authority, the Missouri Research
Corp., and the Missouri
Department of Agriculture, is
sponsoring Southeast Missouri
State University as it pioneers the
10-acre test plot to be harvested
this fall. The plot will also look at
miscanthus, switchgrass,
sunflowers, canola, and sugar
beets as it aims to arm local
farmers with new crops and
techniques to increase their
earnings.
Earlier this summer, CLC bio and
the International Laboratory for
Tropical Agricultural
Biotechnology at the Donald
Danforth Plant Science Center,
announced a collaboration to
benefit the Virus Resistant
Cassava for Africa project.
The partnership includes
researchers at the Donald Danforth
Plant Science Center in St Louis,
MO, the National Crops
Resources Research Institute in
Uganda and the Kenya
Agricultural Research Institute.
VIRCA is applying RNAi
technology to enhance resistance
to virus disease in cassava
cultivars preferred by farmers.
VIRCA‘s goal is to develop, test
and deliver virus resistant cassava
to smallholder farmers with no
royalty fees.
Local financing and capacity
expansion
As we have noted in the Digest
over the years, communities that
take an active role in financing
energy projects see stronger
project flow, and also retain more
of the profits within the
community, which can then be
redeployed into other
opportunities for economic
diversification and high
technology.

11
Missouri‘s St. Joseph City Council
last December took a step in this
direction, in authorizing up to
$25.5 million in industrial
development bonds to kickstart the
local Terra Bioenergy biodiesel
facility that started and stalled in
2008. In order to qualify for the
bonds and property tax
abatements, Blue Sun must create
at least 30 jobs by Dec. 31, 2014,
with an average salary of $41,600
per year, plus benefits. The project
is expected to result in the addition
of 30 million gallons in biodiesel
capacity when completed this
summer – adding to the 30 million
gallons already being produced in
St. Joe by AGP.
What can the Show-Me state show
you?
Five themes emerge from the story
of Missouri‘s biobased
development.
1. If you can‘t drill it, mill it.
No state or community needs to be
left behind in the search for energy
independence. Those communities
that have fossil resources – well,
you know that most of those are
going to be developed. But those
who have less wealth below the
ground, have opportunities above-
ground that can supply both food,
fuel and fibers.
2. Slow but steady wins the race.
Missouri built its initial wave of
bioenergy capacity, based on
existing biomass resources it knew
how to aggregate and process –
primarily, its abundant corn and
soy assets. The state has generally
avoided the irrational exuberance
that usually greets new energy
technologies – and thereby
avoided the waves of irrational
skepticism that follow in the
boom-and-bust cycle.
3. Invest locally.
The state has been investing and,
using their bonding authorities,
localized communities are getting
involved too. That‘s keeping ―eyes
on the prize‖ in terms of assuring
that all resources in the
community are directed towards a
project‘s success, while ensuring
that the rewards from the risks are
enjoyed at home.
4. Have ambition.
130+ biobased production
facilities sounds outrageous? Well,
its ambitious – at $8 per gallon of
capacity for capital expenditure, it
would require more than $35
billion in financing. But think of it
this way – the F35A fighter
program at the Pentagon is
expected to cost $323 billion, at
$132 million per fighter
5. Work regionally – partner early
and often.
It‘s a mighty lift, and biomass
boundaries have nothing to do
with state boundaries – in fact,
river resources, which form a lot
of state boundary lines, are
generally the heart, not the border,
of project opportunity areas. Inter-
state and inter-community
cooperation is a must.
But public-private partnership is
even more key. Take, for example,
the bond program that the St.
Joseph City Council approved – to
revive the Terra Bioenergy project
– done in partnership with Blue
Sun Biodiesel and with some strict
covenants on that organization.
Missouri Timber Price Trends
tracks market prices for
Stumpage. Reports on the
Stumpage Market are received
from Missouri Department of
Conservation Resource Foresters
and private consulting foresters.
Stumpage refers to timber sold on
the stump and does not reflect
delivered mill prices. These
reports should serve as a general
guide to track stumpage prices.
Landowners should not use this
report to replace a timber
inventory and marketing
assistance as methods of
conducting a sale. Missouri
Department of Conservation
Resource Foresters will be able to
provide information on current,
local market conditions. Details of
all private sales and delivered
prices are kept confidential.

12
Missouri Department of Conservation
Forestry Division Offices
MDC CENTRAL OFFICE ............................573/751-4115 PO Box 180, Jefferson City 65102 Lisa Allen, State Forester ................................................ x 3120 Mike Hoffmann, Forest Management Chief ..................... x 3307 John Tuttle, Forest Management Chief ........................... x 3304
CENTRAL REGION ...................................573/815-7900 3500 E. Gans Rd., Columbia 65201 Susan Troxel-DeWitt, Regional Supervisor ..................... x 3478 CALIFORNIA OFFICE 410C W. Buchanan St., California 65018 ........... 573/796-0286 CAMDENTON OFFICE 783 Thunder Mtn. Rd., Camdenton 65020 ........... 573/346-2210 FULTON OFFICE – NRCS Office 4549 State Rd. H, Fulton 65251 ........................... 573/592-1400 LINN OFFICE - USDA Service Center 1315 E. Main St., Linn 65051 ............................... 573/897-3797 NEW FRANKLIN – MU-HARC Office 10 Research Ctr. Rd., New Franklin 65274 .......... 660/848-2525
KANSAS CITY ...........................................816/622-0900 12405 SE Ranson Rd, Lees Summit 64082 Mark Nelson, Regional Supervisor ................................. x 1239 BURR OAK WOODS NATURE CENTER 1401 NW Park Rd., Blue Springs 64015 .............. 816/228-3766 CLINTON OFFICE PO Box 368, Clinton 64735 .................................. 660/885-6981 DISCOVERY CENTER 4750 Troost, Kansas City 64110 .......................... 816/759-7300 SEDALIA OFFICE 2000 S. Limit, Sedalia 65301 ............................... 660/530-5500
NORTHEAST .............................................660/785-2420 3500 S. Baltimore, Kirksville 63501 Danny Hartwig, Regional Supervisor ............................... x 6516 HANNIBAL OFFICE 653 Clinic Rd., Hannibal 63401 ............................ 573/248-2530 KAHOKA OFFICE RR 1 Box 16A, Kahoka 63445 .............................. 660/727-2955 MACON OFFICE – Mark Twain Water Quality 2108 US Hwy. 63 Suite D, Macon 63552 ............. 660/385-6359 UNIONVILLE OFFICE 28988 US Hwy. 136, Unionville 63565 ................. 660/947-2439
NORTHWEST ............................................816/271-3100 701 James McCarthy Dr., St. Joseph 64507 Bryan Gragg, Regional Supervisor ................................. x 1438 ALBANY OFFICE 508 E. Hwy. 136, Albany 64402 ........................... 660/726-3746 CHILLICOTHE OFFICE 15368 LIV 2386, Chillicothe 64601 ....................... 660/646-6122
OZARK .......................................................417/256-7161 551 Joe Jones Blvd., West Plains 65775 Terry Truttmann, Regional Supervisor ............................. x 240 ALTON OFFICE PO Box 181, Alton 65606 .................................... 417/778-6594 AVA OFFICE HCR 71 Box 46, Ava 65608 ............................... 417/683-3628 DONIPHAN OFFICE Route 8 Box 8118, Doniphan 63935 .................... 573/996-2557 EMINENCE OFFICE HCR 1 Box 177K, Eminence 65466 .................... 573/226-3616
HOUSTON OFFICE 1020 Hwy 63 North, Houston 65483 .................... 417/967-3385 ROLLA OFFICE 125655 State Route Y, Rolla 65401 .................... 573/368-2225 SALEM OFFICE PO Box 386, Salem 65560 .................................. 573/729-3182 VAN BUREN OFFICE PO Box 850, Van Buren 63965 ........................... 573/323-8515
SOUTHEAST ............................................. 573/290-5730 2302 County Park Rd., Cape Girardeau 63701 Joe Garvey, Regional Supervisor ..................................... x 245 ELLINGTON OFFICE Route 2 Box 198, Ellington 63638 ....................... 573/663-7130 FARMINGTON OFFICE 812 Progress Dr., Farmington 63640 ................... 573/756-6488 FREDERICKTOWN OFFICE 1051 Madison CR 212, Fredericktown 63645 ...... 573/783-5468 IRONTON OFFICE 303 S. Main, Ironton 63650 .................................. 573/330-6550 MARBLE HILL OFFICE Route 5 Box 129, Marble Hill 63764 ..................... 573/238-2321 NEW MADRID OFFICE PO Box 131, New Madrid 63869 .......................... 573/748-5134 PERRYVILLE OFFICE 2206 W. St. Joseph, Perryville 63775 .................. 573/547-4537 PIEDMONT OFFICE Route 4 Box 1002, Piedmont 63957 .................... 573/223-4525 POPLAR BLUFF OFFICE 107 Magazine Lane, Poplar Bluff 63901 ............. 573/840-9788
SOUTHWEST ............................................ 417/895-6880 2630 N. Mayfair, Springfield 65803 Rod Tucker, Regional Supervisor .................................. x 1630 BOLIVAR OFFICE 412 S. Killingsworth, Bolivar 65613 ...................... 417/326-5189 BRANSON OFFICE 226 Claremont Dr., Branson 65616 .................... 417/334-3324 CASSVILLE OFFICE PO Box 607, Cassville 65625 .............................. 417/847-5949 JOPLIN OFFICE 705 S. Illinois, Ste. 6B Joplin 64801 ..................... 417/629-3423 LEBANON FORESTRY OFFICE 2350 S. Jefferson, Lebanon 65536 ...................... 417/532-7612 NEOSHO OFFICE 1510 S. US Hwy. 71, Neosho 64850 .................... 417/451-4158
ST. LOUIS ................................................. 636/441-4554 2630 Hwy. D, St. Charles 63304 Cathy deJong, Regional Supervisor. ................................. x 311 MERAMEC WORK STATION 3220 South Hwy 185, Sullivan 63080 .................. 573/468-3335 POWDER VALLEY NATURE CENTER 11715 Cragwold Rd., Kirkwood 63122 ................ 314/301-1500 ROCKWOODS OFFICE 2751 Glencoe Rd., Wildwood 63038 .................... 636/458-2236 WARRENTON OFFICE PO Box 157, Warrenton 63383 ............................ 636/456-3368
GEORGE O. WHITE NURSERY ................ 573/674-3229 14027 Shafer Rd., Licking 65542 George Clark, Supervisor .................................................. x222
