missouri department of social services medicaid fee for … · · 2016-12-06missouri department...
TRANSCRIPT

Missouri Department of Social Services
Medicaid Fee-for-Service Access Monitoring Plan
December 16, 2016 Draft for Public Comment

2
Table of Contents OVERVIEW OF THE MO HEALTHNET, MISSOURI MEDICAID PROGRAM 4 Fee-for-service physician related programs 4
EPSDT Error! Bookmark not defined. Health Homes 4 Asthma Educators and In-home Environmental Assessors 5 Applied Behavior Analysis 5
MO HealthNet Physician-related Provider Types 5 Physicians 6 Podiatrists 6 Advanced Practice Registered Nurses and Nurse Practitioners 6 Nurse Midwives 6 Certified Registered Nurse Anesthetists and Anesthesiologist Assistants 7 Behavioral Health Providers 7 Clinic 7 Lab & X-Ray 8 Independent Diagnostic Testing Facility (IDTF) 8 Ambulatory Surgical Center (ASC) 8 Rural Health Clinics (RHC) 8 Federally Qualified Health Clinic (FQHC) 9
REIMBURSEMENT METHODOLOGY 10 Federally Qualified Health Centers (FQHCs) and Rural Health Clinics (RHCs) 10
Telehealth 11 Copayment 11 Health Homes 12 Managed Care program 12
ACCESS MONITORING REVIEW PLAN 14 Data to Assess Access: Future Tools and Reports 15 Data to Assess Access: Service-Specific Analyses 16
Annual Provider Rate Study 16 Data to Assess Access: Fee-for-service Network Access Report 25
FFS Network Adequacy - Primary Care Services (Primary Care Providers) 26 FFS Network Adequacy - Primary Care Services (Federally Qualified Health Centers) 28 FFS Network Adequacy - Primary Care Services (Rural Health Clinics) 30 FFS Network Adequacy - Primary Care Services (Dental) 32 FFS Network Adequacy – Physician Specialty Services (Cardiology) 34 FFS Network Adequacy – Physician Specialty Services (Neurology) 36 FFS Network Adequacy – Physician Specialty Services (Ophthalmology) 38 FFS Network Adequacy – Physician Specialty Services (Urology/Nephrology) 40 FFS Network Adequacy – Physician Specialty Services (Radiology) 42 FFS Network Adequacy – Behavioral Health Services (LCSW - LMSW) 44 FFS Network Adequacy – Behavioral Health Services (Psychology) 46 FFS Network Adequacy – Behavioral Health Services (LPC - PLPC) 48 FFS Network Adequacy – Behavioral Health Services (Psychiatry) 50 FFS Network Adequacy – Behavioral Health Services (CMHC) 52 FFS Network Adequacy – OB/GYN Providers 54 FFS Network Adequacy – Home Health Agencies 56
Data to Assess Access: Fee-for-service Utilization Review 58

3
Recently adopted federal rules at 42 C.F.R. §§447.203‐204 (the Access Rule) set forth a transparent, data driven procedural process for States to demonstrate that the States’ Medicaid fee-for-service payments comply with the access standards in Section 1902(a)(30)(A) of the Social Security Act (the Act). Pursuant to the Act, States are to define methods and procedures to assure that payments to providers are “sufficient to enlist enough providers so that care and services are available under the plan at least to the extent that such care and services are available to the general population in the geographic area.” Among other requirements in the Access Rule, the States are to develop “a medical assistance access review plan” to review participant access to certain Medicaid services.1 The Access Rule applies to fee-for-service (FFS) payments and does not apply to the managed care organization payments to providers. In part, the Access rule requires:
State Medicaid programs, including Missouri’s Medicaid Program, MO HealthNet, must submit an initial FFS Access Monitoring Review Plan (Review Plan).
States must submit subsequent FFS Review Plan by October 1, 2019, and every three years thereafter.
The FFS Review Plan must analyze certain categories of services for sufficient access under a state‐established methodology.
A FFS Review Plan may be needed when States submit state plan amendments (SPAs) reducing or restructuring rates, which includes an analysis of the current level of access, the expected SPA impact on access, and information and concerns shared by stakeholders.
States must establish or maintain ongoing means for providers and participants to provide input related to access to care issues or concerns.
The MO HealthNet Division (MHD) compiled this initial Review Plan to report on the existing FFS access to care and service payment rates based on existing or currently available information. Consistent with CMS guidance, MHD will continue to develop more sophisticated analysis over time to review and monitor adequacy, including:
1) the extent to which beneficiary needs are fully met; 2) the availability of care through enrolled providers to beneficiaries in each geographic area, by
provider type and site of service; 3) changes in beneficiary utilization of covered services in each geographic area; 4) the characteristics of the beneficiary population; and 5) actual or estimated levels of provider payment available from other payers, including other
public and private payers, by provider type and site of service.
1 42 C.F.R. 447.203(b)

4
Overview of the MO HealthNet, Missouri Medicaid Program MO HealthNet utilizes multiple delivery and reimbursement models, including traditional fee-for-service and HMO-styled managed care. To determine which program a participant takes part in depends on a number of factors including the participant’s eligibility group, where the participant lives and the services needed.
Fee-for-service physician related programs The goal of the physician’s program, including primary care and physician specialist services, is to provide access to proper health care in the appropriate setting and to improve the general health and well-being of MO HealthNet participants. The physician’s program funds physician-related services provided to fee-for-service MO HealthNet participants. Services are provided by physicians, advanced practitioners, nurses/technicians, and certain behavioral health providers at various locations. The physician-related program comprises 8.79% of the total Medicaid program dollars. As of June 2016, there were 39,428 physician-related providers enrolled in MO HealthNet. In FY 2016, approximately 65% of physician-related services were paid to clinics, rural health clinics, and federally qualified health clinics.
PLEASE NOTE: In the MO HealthNet fee-for-service program, behavioral health services are appropriated, in part, via the Physician’s program line and therefore the reporting of behavioral health and physician’s service rate reimbursement is sometimes blended. MO HealthNet will work to refine existing reporting tools to the extent possible, to more clearly separate and isolate behavioral health service costs, rates and network impact consistent with the requirements in the Access Rule.
Physician-related services include diagnostic, therapeutic, rehabilitative, or palliative care; lab and x-ray; family planning; and behavioral health. The following services are limited to certain MO HealthNet participants:
Early Periodic Screening Diagnosis and Treatment (EPSDT);
Health Home coordination for individuals with chronic conditions;
Asthma education and in-home environmental assessments; and
Applied behavioral analysis.
The Early Periodic Screening Diagnosis Treatment program (or Healthy Children and Youth program) provides primary and preventative services to MO HealthNet participants who are infants, children, and youth under the age of 21 years. To ensure a child’s health, a primary care provider is designated to manage a coordinated, comprehensive, continuous health care program to address the child's primary health care needs. Full, partial, and inter-periodic health screenings; medical and dental examinations; immunizations; and any medically-necessary treatment to correct or improve defects and chronic conditions found during the screening are considered EPSDT benefits. Health Homes Section 2703 of the ACA gives MO HealthNet the option to pay providers to coordinate care through a "health home" for individuals with chronic conditions. A team of health care professionals acting as a

5
health home may include physicians and other professionals such as a nurse care manager, care coordinator, behavioral health consultant, nutritionist, or social worker. A health home may be a freestanding practice or a practice based at a hospital or other facility. Health home services include comprehensive care management, care coordination and health promotion, comprehensive transitional care from inpatient to other settings, patient and family support, and referral to community and social support services. Health homes are required to use "health information technology” to link services. MO HealthNet, in conjunction with the Department of Mental Health, currently operates two health home programs:
1. Primary Care Health Home for participants diagnosed with two chronic conditions or diagnosed with one chronic condition and at-risk for development of a second
2. Community Mental Health Center (CMHC) Health Home for participants with a serious and persistent mental illness, serious emotional disorder, or substance use disorder. Clinical care management per member per month (PMPM) payments are made for the reimbursement of required contracted services and the cost of staff primarily responsible for delivery of these specified health home services that are not covered by other MO HealthNet reimbursement methodologies. Asthma Educators and In-home Environmental Assessors Pediatric MO HealthNet participants with a primary diagnosis of asthma who meet specific criteria indicating uncontrolled asthma may receive up to two asthma education services and two in-home environmental assessments per year. Applied Behavior Analysis Applied behavior analysis (ABA) services are covered for individuals under age 21 who have a diagnosis of Autism Spectrum Disorder. ABA services are provided by licensed behavior analysts, ABA qualified licensed psychologists, and licensed assistant behavior analysts. All ABA services require precertification.
MO HealthNet Physician-related Provider Types The MO HealthNet fee-for-service program utilizes a number of different physician related provider types in its program, including:
• Physicians and Podiatrists • Advanced Practitioners • Advanced Practice Registered Nurses (APRN) or Nurse Practitioners (NP) • Nurse Midwives • Physician Assistants (PA) • Assistant Physicians (AP) once licensed by the Board of Healing Arts • Certified Registered Nurse Anesthetists (CRNA) and Anesthesiologists Assistants (AA) • Behavioral health providers:
o Psychiatrists o Psychologists, included provisional licensees o Licensed professional counselors (LPC), including provisional licensees o Licensed clinical social workers (LCSW), including provisional licensees o Licensed behavior analysts

6
Services may be billed by physicians, certain advanced practitioners, or behavioral health providers OR on behalf of professional services provided at the following locations:
• Clinics • Rural health clinics (RHC) • Federally qualified health centers (FQHC) • Ambulatory surgical centers (ASC) • Lab and x-ray facilities • Independent diagnostic testing facilities • Participant's home • Hospital (Inpatient and Outpatient settings) • Nursing facilities
Physicians Physicians, including medical doctors and doctors of osteopathy, enrolled in the MO HealthNet program are identified by the specialty of medicine they practice. Specialties include: allergy immunology; anesthesiology; cardiology; dermatology; emergency medicine; family practice; general practice; general surgery; internal medicine; laryngology; nuclear medicine; neurological surgery; obstetrics/gynecology; ophthalmology; otology; otolaryngology; orthopedic surgery; pathology; pediatrics; physical medicine and rehabilitation; plastic surgery; preventive medicine; proctology; psychiatry; neurology; radiation therapy; radiology; rectal and colon surgery; rehabilitative medicine; rhinology; thoracic surgery; and urology. Podiatrists Podiatrists provide medical, surgical, and mechanical services for the foot or any area not above the ankle joint. However, the following podiatry services are not covered for adults (except pregnant women, the blind, or nursing facility residents): trimming of non-dystrophic nails; debridement of one to five nails by any method; debridement of six or more nails by any method; partial or complete excision of the nail and nail matrix; and strapping of the ankle and/or foot. Advanced Practice Registered Nurses and Nurse Practitioners An advanced practice registered nurse (APRN) or nurse practitioner (NP) is one who has education beyond the basic nursing education and is certified by a nationally recognized professional organization as having a nursing specialty, or who meets criteria for advanced practice nurses established by the Missouri Board of Nursing. Numerous specialties are recognized such as family, gerontology, clinical, obstetrics/GYN, neonatal, mental health, and certified registered nurse anesthetists. APRNs and NPs must enter into a collaborative practice agreement with a physician. Such a collaborative practice agreement may authorize APRNs and NPs to prescribe certain medications. APRNs and NPs are generally employed by physicians, but are not required to be employed by physicians. Nurse Midwives Nurse midwife services are those services related to the management and provision of care to a pregnant woman and her unborn/newborn infant by a certified nurse midwife. These services may be provided throughout the maternity cycle which includes pregnancy, labor and delivery and the initial postpartum period not to exceed six weeks. Covered services include antepartum care, delivery, post-partum care, newborn care, office visits, laboratory services and other services within the scope of practice of a nurse midwife. Nurse midwives may also provide care outside of the maternity cycle such as family planning, counseling, birth control techniques and well-woman gynecological care including

7
routine pap smears and breast examinations (Section 13605, OBRA 93). Nurse midwife services may also include services to the newborn, age 0 through 2 months, and any other MO HealthNet eligible female, age 15 and over. Certified Registered Nurse Anesthetists and Anesthesiologist Assistants A Certified Registered Nurse Anesthetist (CRNA) introduces and manages substances into the body by external or internal means that cause a loss of sensation with or without loss of consciousness. To serve MO HealthNet participants, a CRNA must hold a valid current license as an advanced practice registered nurse (APRN) or nurse practitioner (NP) in the state of Missouri and be currently certified by the Council on Certification of Nurse Anesthetists. An Anesthesiologist Assistant (AA) works under the supervision of a licensed anesthesiologist and provides anesthesia services and related care. An AA can only practice under the direct supervision of an anesthesiologist who is physically present or immediately available and must be licensed by the Missouri Board of Healing Arts. A supervising anesthesiologist shall be allowed to supervise up to four AAs concurrently, consistent with 42 CFR 415.110. An AA and a CRNA are not allowed to bill for the same anesthesia service. Behavioral Health Providers MO HealthNet provides various behavioral health services including psychiatric diagnostic evaluations, individual psychotherapy, group psychotherapy, family psychotherapy, psychological testing, smoking behavioral change, Health and Behavior Assessment and Intervention, and crisis psychotherapy. The following providers are authorized to serve MO HealthNet eligible children under the age of 21:
Psychiatrists
Licensed Psychologists (including provisional licensees)
Licensed Clinical Social Workers (including provisional licensees)
Licensed professional counselors (including provisional licensees)
The following providers are authorized to serve MO HealthNet eligible adults:
Psychiatrists
Licensed Psychologists (including provisional licensees)
Licensed Clinical Social Workers (including provisional licensees) only if the service is provided in an FQHC or RHC
Services provided by licensed professional counselors to adults in any setting are not reimbursable. Clinic Clinics offer preventive, diagnostic, therapeutic, rehabilitative or palliative services that are furnished by a facility that are not part of a hospital but are organized and operated to provide medical care to outpatients. Services furnished to outpatients include those furnished at the clinic by, or under the direction of, a physician and those services furnished outside the clinic by clinic personnel under the direction of a physician.

8
Lab & X-Ray Laboratory and x-ray facilities provide examination and radiology services under the physician program. Laboratories perform examinations of body fluids, tissues or organs by the use of various methods employing specialized equipment such as electron microscopes and radio-immunoassay. A clinical laboratory is a laboratory where microbiological, serological, chemical, hematological, radio bioassay, cytological, immunohematological or pathological examinations are performed on material derived from the human body to provide information for the diagnosis, prevention or treatment of a disease or assessment of a medical condition. Operations of a laboratory are generally directed by a pathologist. X-ray facilities offer radiological services in which x-rays or rays from radioactive substances are used for diagnostic or therapeutic purposes. Such services include, but are not limited to, radium therapy; radioisotopes for diagnostic or therapeutic purposes (e.g., in nuclear medicine); diagnostic tests such as aortograms, pyelograms, myelograms, arteriograms and venticulograms; imaging services; x-rays; and diagnostic ultra-sounds. These operations are generally directed by a radiologist. Independent Diagnostic Testing Facility (IDTF) These providers are independent of a hospital or a physician's office and offer medically necessary diagnostic tests. The IDTF may be a fixed location or a mobile entity. An IDTF must have one or more supervising physicians who are responsible for the direct and ongoing oversight of the quality of the testing performed, the proper operation and calibration of the equipment used to perform tests, and the qualification of non-physician personnel who use the equipment. Ambulatory Surgical Center (ASC) An Ambulatory Surgical Center (ASC) is a free-standing facility functioning as an independent business and administrative entity which maintains neither a physical nor a fiscal relationship to a hospital. An ASC is a facility designed, staffed, equipped, and operated for the primary purpose of providing surgical services. It is neither staffed nor equipped to provide overnight care to patients. Rural Health Clinics (RHC) The Rural Health Clinic Services Act of 1977, designating rural health clinics as health care providers, extended benefits to cover health care services to under-served rural areas where access to traditional physician care had been difficult. In those areas, specifically trained practitioners furnish the health care services needed by the community. Rural health clinics must be located in a rural area that is designated a shortage area for primary care. To be eligible for this designation, a clinic must be located in an area not identified as "urbanized" by the Bureau of the Census and designated as a shortage or under-served area. RHCs must meet the additional staffing and health and safety requirements set forth by the Rural Health Clinic Services Act; be certified by the Public Health Service; be certified for participation in Medicare; and be enrolled as a MO HealthNet provider. An RHC must be designated as either an independent or a provider-based RHC.
Provider-based RHC: must be an integral and subordinate part of a hospital, skilled nursing facility, or home health agency and under common licensure, governance, and professional supervision with its parent provider.
Independent RHC: has no financial, organizational or administrative connection to a hospital, skilled nursing facility or home health agency.

9
Federally Qualified Health Clinic (FQHC) The Omnibus Budget Reconciliation Acts of 1989 (OBRA 89) and 1990 (OBRA 90) designates certain community-based health care organizations as unique health care providers called Federally Qualified Health Centers. These laws establish health care services that MO HealthNet and Medicare must cover in an FQHC. The federal laws also set the reimbursement at reasonable cost to the FQHC for such services. In order to qualify for FQHC status, a facility must receive or be eligible for a grant under Section 329, 330 or 340 of the Public Health Service Act; meet the requirements for receiving such a grant; or have been a Federally Funded Health Center as of January 1, 1990. The FQHC program has two goals:
1. To provide adequate reimbursement to community-based primary health care organizations (FQHCs) so that they, in turn, may better serve a large number of MO HealthNet participants and/or provide more services, thus improving access to primary care.
2. To enable FQHCs to use other resources previously subsidizing MO HealthNet to serve uninsured individuals who, although not eligible for MO HealthNet, have a difficult time obtaining primary care because of economic or geographic barriers.

10
Reimbursement Methodology The majority of services provided by physician-related professionals are reimbursed on a fee schedule although a few services are reimbursed manually, whereby each procedure or claim is priced individually by a medical consultant based on the unique circumstances of the case. Certain procedures are only reimbursable with prior approval. Services rendered by someone other than a physician or podiatrist, including appropriate supplies, are billable by the physician only where there is direct personal supervision by the physician. This applies to services rendered by auxiliary personnel employed by the physician and working under his/her on-site supervision such as nurses, non-physician anesthetists (including Certified Registered Nurse Anesthetists and Anesthesiologist Assistants), technicians, and other aides. The following advanced practitioners can bill MO HealthNet independently from a physician, but must still operate within the terms of their collaborative practice arrangement with the physician:
• Advanced Practice Registered Nurses (APRN) and Nurse Practitioners (NP), • Nurse Midwives, • Physician Assistants (PA), and • Assistant Physicians (AP) once licensed by the Board of Healing Arts.
The services of physicians, podiatrists, advanced practitioners, and behavioral health providers may be administered in multiple settings including the physician's office, the participant's home (or other place of residence such as a nursing facility), the hospital (inpatient/outpatient) or settings such as a medical clinic or ambulatory surgical care facility. The services of a nurse midwife may also be administered in the home of the participant (delivery and newborn care only) or a birthing center. MO HealthNet reimbursement may also be made directly to the facility which employs the health care professionals. Facilities which receive direct payment from the physician-related services program include clinics, laboratory and x-ray facilities, independent diagnostic testing facilities (IDTF), rural health clinics (RHC), and federally qualified health clinics (FQHC, and hospitals (inpatient and outpatient). Each provider offering health care services through the facility, in addition to being employed by the participating clinic, must be a MO HealthNet provider. Ambulatory surgical centers are also reimbursed for a facility fee which does not include professional services of the performing practitioner.
Federally Qualified Health Centers (FQHCs) and Rural Health Clinics (RHCs) The reimbursement methodology for RHCs and FQHCs is different than other physician-related services. FQHCs are reimbursed on an interim basis at a specified percentage of the billed MO HealthNet FQHC covered charges. For dates of service prior to January 1, 2016, FQHC services were reimbursed at 97% of the covered charges and for dates of service beginning January 1, 2016 FQHC service are reimbursed at 92% of the covered charges. Fee-for-service claims are submitted to MO HealthNet Division (MHD) and are paid at the applicable interim percentage. FQHCs that are contracted with MO HealthNet Managed Care health plans also receive payments from the health plan. For dates of service prior to July 1, 2015, FQHCs that were contracted with the health plans were paid a rate negotiated with the health plan and for dates of service beginning July 1, 2015, health plans are required to pay 90% of

11
covered charges. An FQHC contracted with a health plan may submit a request to MHD for a supplemental interim payment for the difference between the health plan payment and the applicable interim payment percentage. Beginning January 1, 2016, these requests may only be submitted on a quarterly basis. An annual audit of the MO HealthNet cost report is performed by the Institutional Reimbursement Unit (IRU) to determine reasonable costs. A settlement is made to adjust the reimbursement to 100% of the reasonable costs to provide MO HealthNet FQHC covered services. Hospital-based, or provider based, RHCs (PBRHCs) are reimbursed on an interim basis at the lower of 100% of their usual and customary charges or their cost-to-charge ratio. For dates of service beginning July 1, 2015, PBRHCs that are contracted with MO HealthNet Managed Care health plans are to be reimbursed by the health plan at 90% of covered charges. For dates of service prior to July 1, 2015, PBRHCs that were contracted with health plans were paid a rate negotiated with the health plan. A PBRHC contracted with a health plan may submit a request to MHD for a supplemental interim payment for the difference between the health plan payment and the applicable interim payment percentage. Beginning January 1, 2016, these requests may only be submitted on a quarterly basis. An annual review of the finalized Medicare cost report is done by the IRU to determine reasonable costs. A settlement is made to adjust the reimbursement to 100% of the reasonable costs to provide MO HealthNet PBRHC covered services. The RHCs that are based in skilled nursing facilities and home health agencies are reimbursed their usual and customary charges multiplied by the lower of the Medicare RHC rate or the rate approved by the MO HealthNet Division. An independent RHC (IRHC) has no financial, organizational or administrative connection to a hospital, skilled nursing facility or home health agency. IRHCs are reimbursed on an interim basis at 100% of their Medicare RHC rate. For dates of service beginning July 1, 2015, IRHCs that are contracted with MO HealthNet Managed Care health plans are to be reimbursed by the health plan at 90% of the Medicare RHC rate. For dates of service prior to July 1, 2015, IRHCs that were contracted with health plans were paid a rate negotiated with the health plan. An IRHC contracted with a health plan may submit a request to MHD for a supplemental interim payment for the difference between the health plan payment and the applicable interim payment percentage. Beginning January 1, 2016, these requests may only be submitted on a quarterly basis. An annual audit of the Medicare cost report is reviewed by the IRU within the MO HealthNet Division to determine reasonable costs, which is subject to a limit of the Medicare cost per visit. A settlement is made to adjust the reimbursement to 100% of the reasonable costs to provide MO HealthNet IRHC covered services. Telehealth Certain health professionals are also authorized to provide services through telehealth technology. The health professional receives reimbursement for services rendered according to the fee schedule. In addition, the originating site which hosts the MO HealthNet participant during the telehealth conference is eligible to receive an originating site facility fee. MHD will not reimburse the originating site fee if the distant site and originating site are within 24 miles of one another. Copayment A copayment, a portion of the providers’ charges paid by the participant, is required on many physician related services and is determined in state regulation (13 CSR 70-4.050). According to 42 CFR Section 447.56(c)(1), MHD is required to reimburse providers a rate less any assessed co-pay. It is the responsibility of the provider to collect the copay from the participant. The copayment for a service can range between $0.50 to $3.00 for physician-related services; however, some services and participants

12
are exempt from copay requirements. See additional detail below for copay exemptions. Health Homes Practices that are enrolled in MO HealthNet’s primary care or CMHC health home programs receive a per-member, per month (PMPM) reimbursement for each eligible health home patient enrolled in the program who receives health home services in a given month. See service information below for additional information on health homes. Rate History 7/1/16: 2% rate increase for all physician related services. 7/1/16: 3.79% rate increase for Medicare parity for physician-related services. 1/1/16: 1% rate increase for all physician related services. 1/1/13-12/31/14: Federally funded rate increase for certain physician specialties for primary care evaluation and management and services related to immunization administration for vaccines and toxoids. Managed Care program The MO HealthNet Division operates an HMO-style managed care program known as MO HealthNet Managed Care. Effective May 1, 2017, statewide participation in MO HealthNet Managed Care is mandatory for the following MO HealthNet eligibility groups:
MO HealthNet for Families - Adults and Children;
MO HealthNet for Children;
Refugees;
MO HealthNet for Pregnant Women;
Children's Health Insurance Program (CHIP);
Children in state care and custody; and
Show Me Healthy Babies Program (SMHB)
Those participants who receive Supplemental Security Income (SSI), meet the SSI medical disability definition, or get adoption subsidy benefits may stay in MO HealthNet Managed Care or may choose to “opt out” and receive services on a fee-for-service basis instead. While Managed Care participants represent 47.55% of the total MO HealthNet participants, the Managed Care program comprises 18.12% of the total MO HealthNet program dollars. As of June 2016, there were 465,587 individuals enrolled in Managed Care. MHD estimates an additional 243,781 individuals will receive managed care services after May 1, 2017. MO HealthNet Managed Care health plans contract with the state and are paid a monthly capitation payment for providing services for each enrollee. Federal Regulation 42 CFR 438-Managed Care and State Authority 208.166 require capitation payments made on behalf of managed care participants to be actuarially sound. Therefore, MO HealthNet must maintain capitation rates at a sufficient level to ensure continued health plan and provider participation. In MO HealthNet Managed Care, enrollees receive the majority of their services through the managed care benefit. Examples of services included in the capitation payment paid to health plans are: hospital; physician; emergency medical services; EPSDT services; family planning services; dental; optical; audiology; personal care; and mental health services. Services provided on a fee-for-service basis

13
outside of the capitation payment include: pharmacy services; transplants; school-based therapy; Department of Health and Senior Services newborn screening services; certain mental health services, including ICF/MR; community psychiatric rehabilitation services; CSTAR services; smoking cessation; and mental health services for children in the care and custody of the state. MO HealthNet Managed Care is intended to provide MO HealthNet participants a number of advantages over traditional fee-for-service MO HealthNet. Each MO HealthNet Managed Care participant chooses a MO HealthNet Managed Care health plan and a primary care provider from within the network of the health plan. Managed Care participants are guaranteed access to primary care and other services as needed. MO HealthNet Managed Care health plans are required by contract to ensure that routine exams are scheduled within thirty days, urgent care within twenty-four hours, and emergency services must be available at all times. Behavioral health appointments for routine care with behavioral symptoms are required by contract to be scheduled within one week or five business days, whichever is earlier, urgent care within twenty-four hours, and after care appointments following hospitalizations must be within seven days of discharge. MO HealthNet Managed Care health plans are required by contract to ensure that children receive all EPSDT exams (complete physicals on a regular schedule), are fully immunized, and receive any medically necessary service. MO HealthNet Managed Care health plans are also required by contract to provide care management to ensure that enrollee services, especially those provided to children and pregnant women, are properly coordinated. The Division monitors performance of the health plans and assists them with improvement. MO HealthNet Managed Care most importantly provides the means to ensure access, manage and coordinate benefits, and monitor quality of care and outcomes while controlling costs.

14
Access Monitoring Review Plan The MO HealthNet Division (MHD) currently utilizes multiple data sources and methodologies to guide state policies affecting access to Medicaid services and, as part of future enhancements to its analysis, MO HealthNet will develop additional tools to inform whether participants have sufficient access to care. These tools will provide access to a larger body of data or organize the existing data in ways which illustrate the successes or gaps in FFS service access. Currently, MHD publishes performance and demographic summary reports to keep the public informed regarding the performance of its programs and their impact on the health of Missouri participants in the Medicaid program. Below is a list of existing reports posted on the Missouri Department of Social Services (DSS) or MO HealthNet’s website, which are updated monthly, annually or semi-annually.
Quick Facts about DSS: for the MO HealthNet program, provides a county level look of the number of people enrolled for MO HealthNet services, MO HealthNet dollars spent in a given state fiscal year, the estimated federal portion of the MO HealthNet dollars spent, MO HealthNet dollars for inpatient hospital services, MO HealthNet dollars for physician services, MO HealthNet dollars for nursing home services, MO HealthNet dollars for pharmacy services, and MO HealthNet dollars for managed care payments. http://dss.mo.gov/mis/cqfacts/2015-missouri-counties-quick-facts.pdf DSS Performance Management Monthly Report: The DSS Performance Management Monthly Reports (Dashboard) is a monthly publication which graphically indicates performance measures for DSS. Information contained in this publication is the best available at the time of publication for the indicated month. Because of delays in processing or pending data analysis, some data may not be updated for a given month. The latest month shown on each graph is the most current that was available at the time of publication for that month. http://dss.mo.gov/reports/dashboards/
Missouri Family Support Division/MO HealthNet Division Monthly Management Report: The Monthly Management Report is a monthly publication detailing information concerning the Temporary Assistance, Medicaid and Food Stamp programs administered by the Family Support Division and the MO HealthNet Division. Payment data is for informational purposes only and is not meant to provide an auditable account of expenditures. Unless otherwise indicated, information contained in this publication is intended for monthly use only. Counts of families and persons should NOT be summed from one month to the next to obtain aggregate values (3 month, 6 month, or 12 month totals etc.) as persons may receive assistance in more than one month. http://dss.mo.gov/re/fsd_mhdmr.htm
Annual Summaries for Enrollment Data: Provides MO HealthNet managed care health plan enrollment by state fiscal year. http://dss.mo.gov/mhd/mc/pages/enroll.htm

15
Data to Assess Access: Future Tools and Reports In addition to the various initiatives that were discussed previously, the MO HealthNet Division is working to develop additional tools to assess whether there is adequate access for specific provider types as well as for those providers who provide specific services. For future analysis, the MHD will expand a “secret shopper” survey of fee-for-service primary care provider and psychiatrist offices which is currently used to monitor the managed care health plans access. The MHD will also develop the reporting capability look at capturing or monitoring the impact of tele-medicine and tele-monitoring on providing adequate care for fee-for-service participants. The Department of Social Services, Missouri Medicaid Audit & Compliance Division (MMAC) is working on a number of initiatives in an effort to improve internal, administrative efficiencies and to improve the number of providers participating in the Missouri Medicaid program. The administrative efficiencies are intended to reduce and streamline the process of provider enrollment and re-verification which should decrease the provider’s administrative costs and consequently lessen the reasons why a provider may not participate in the Medicaid program.

16
Data to Assess Access: Service-Specific Analyses Consistent with 42 CFR Section 447.203(5)(ii), MO HealthNet should analyze the following service categories:
Primary care;
Physician specialist;
Behavioral health;
Pre and post-natal obstetrics;
Home health services For the inaugural report regarding FFS access monitoring, MHD utilized existing resources which were previously planned or completed with sufficient time for analysis and public comment. These resources include:
1. Annual Provider Rate Study 2. Fee-for-service Network Access Report 3. Utilization Report
In the future, MHD will work to compile such additional data points as an analysis of participant grievances, complaints and appeals and to complete a “secret shopper” appointment and access survey of primary care physicians and psychologists. Annual Provider Rate Study The MO HealthNet Division completes an annual review, required by state statute, of provider rates for specific types of services and provider types. MHD used utilization data obtained from the Medicaid Management Information System (MMIS) for Ambulance, Audiology, Dental, Durable Medical Equipment, Optical, Physician and Rehabilitation Center Therapy for SFY-2015. These reports identified the type of service, provider type, units paid, paid amount, procedure codes, modifiers and the pricing indicator. The MO HealthNet allowed amount for SFY-2015 for all programs was obtained from the MMIS. The Medicare allowed amount as of January 1, 2015, was also obtained from the MMIS. Section 208.152.1(23) of the Revised Statutes of Missouri requires the MO HealthNet Division (MHD) to annually . . . report the status of MO HealthNet provider reimbursement rates as compared to one hundred percent of the Medicare reimbursement rates and compared to the average dental reimbursement rates paid by third-party payors licensed by the state. The MHD submitted rate studies on January 1, 2008, 2009, 2010, 2011, 2012, 2013, 2014 and 2015 and the July 2008 Four-Year Plan to Reach Reimbursement Parity (also referred to as the Four-Year Plan). This study is based on state fiscal year (SFY) 2016 rates. Methodology Some MO HealthNet programs are not included in this report. Please see the table (below) for a detailed explanation.

17
MO HealthNet Program Areas Excluded from SFY-2016 Rate Study
MO HealthNet Program Area
Rationale
Comprehensive Day Rehab
This program is unique to Missouri and valid Medicare comparisons are not available.
Federally Qualified Health Center (FQHC)
Per federal law, both Medicare and MO HealthNet reimburse FQHCs for 100% of costs. Cost settlements are based on data from audited cost reports.
Home Health MO HealthNet reimburses on a per visit basis, while Medicare reimburses per episode of diagnosis. Valid comparisons between the two reimbursement methodologies are not possible.
Hospice Rates are established annually by Medicare and authorized by Section 1814 (l)(1)(C)(ii) of the Social Security Act. Since MO HealthNet's reimbursement mirrors Medicare reimbursement, no adjustments are required.
Hospitals MO HealthNet reimburses hospitals using a rate per day. Medicare reimburses hospitals through Diagnostic Related Groups (DRGs). Through the DRG system, Medicare has established set amounts to pay hospitals for each diagnosis. The reimbursement methodologies used by MO HealthNet and Medicare are different enough that no comparison is possible.
Non-Emergency Medical Transportation (NEMT)
Medicare does not cover NEMT. MO HealthNet NEMT capitated rates are paid for each participant based on a contractual arrangement with a third party vendor.
Nursing Facilities Most nursing facility beds in Missouri are paid through the MO HealthNet program using a rate per day based on individual cost reports. Comparability to Medicare is not possible because Medicare only pays for nursing facility care in very limited circumstances and then for only a very limited time in limited amounts.
Pharmacy MO HealthNet reimburses at the lower of Wholesale Acquisition Cost (WAC) plus 10%, the Federal Upper Limit (FUL), the Missouri Maximum Acquisition Cost (MAC) or billed charge. Medicare Part D is based on capitated rates and comparability to MO HealthNet Pharmacy is not possible.
Rural Health Center (RHC)
Per federal law, both Medicare and MO HealthNet reimburse independent RHCs for 100% of allowable cost per visit up to a cap established by CMS. Provider based (hospital based) RHCs are paid based on a ratio of Medicaid charges to total charges. Cost settlements are based on data from audited cost reports.
State Institutions The reimbursement methodology for state institutions is similar to that of the MO HealthNet Hospital program.
School-Based Therapy
Services are provided for children in a school-based setting. Medicare does not reimburse for these types of services.
Comparison to MO HealthNet Rates When Medicare or Dental Rates Were Available
18
When available, the current Medicare allowed amount was obtained through the MMIS.
For Dental rates, MHD used the 2015 National Dental Advisory Service Fee Report (Yale Wasserman, 2015). Target rates were at the 50th percentile, meaning half of dentists charge more and half charge less than the target rate. This is referred to as the Usual, Customary, and Reasonable (UCR) target throughout the report.
Data were grouped according to the age of the participant on the date the service was provided. Children were defined as individuals under the age of 21, and adults were defined as individuals age 21 and over.
Codes were grouped together logically for each program area. Codes not utilized in SFY-2015 were excluded from the analysis.
The reported measures include number of codes, units of service, MHD cost, comparison group cost and the MHD cost as a percentage of the comparison group.
The MHD cost was computed by multiplying the number of units delivered for each code by the current MO HealthNet allowed amount. This calculation was used instead of the amount paid because the amount paid may reflect adjustments made which are unrelated to the rate.
The comparison group cost was calculated by multiplying the number of units delivered for each code by the current allowable Medicare or dental UCR.
The percentage comparison rate was calculated by measuring the MHD cost as a percentage of the comparison group.
Analysis of MO HealthNet Rates With No Medicare Comparison Codes were grouped into the “no Medicare comparison group” if:
MHD reimburses the code but Medicare does not reimburse the code; or
MHD manually prices the code and there is no valid Medicare comparison.
The amount paid in SFY-2015 for these items is reported in the tables below.
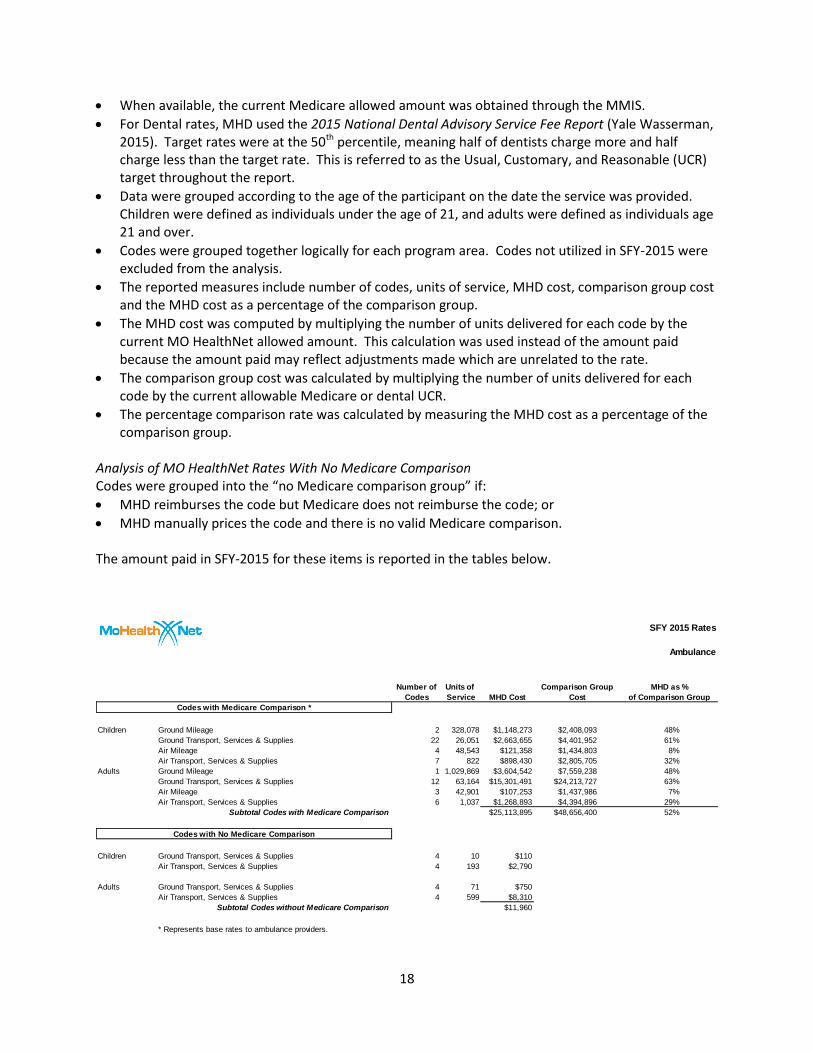
Number of Units of Comparison Group
Codes Service MHD Cost Cost
Children Ground Mileage 2 328,078 $1,148,273 $2,408,093 48%
Ground Transport, Services & Supplies 22 26,051 $2,663,655 $4,401,952 61%
Air Mileage 4 48,543 $121,358 $1,434,803 8%
Air Transport, Services & Supplies 7 822 $898,430 $2,805,705 32%
Adults Ground Mileage 1 1,029,869 $3,604,542 $7,559,238 48%
Ground Transport, Services & Supplies 12 63,164 $15,301,491 $24,213,727 63%
Air Mileage 3 42,901 $107,253 $1,437,986 7%
Air Transport, Services & Supplies 6 1,037 $1,268,893 $4,394,896 29%
Subtotal Codes with Medicare Comparison $25,113,895 $48,656,400 52%
Children Ground Transport, Services & Supplies 4 10 $110
Air Transport, Services & Supplies 4 193 $2,790
Adults Ground Transport, Services & Supplies 4 71 $750
Air Transport, Services & Supplies 4 599 $8,310
Subtotal Codes without Medicare Comparison $11,960
* Represents base rates to ambulance providers.
Codes with No Medicare Comparison
SFY 2015 Rates
Ambulance
MHD as %
Codes with Medicare Comparison *
of Comparison Group

19
Number of Units of Comparison Group
Codes Service MHD Cost Cost of Comparison Group
Children Evaluations & Testing 35 13,034 $276,734 $494,136 56%
Adults Evaluations & Testing 13 1,379 $23,344 $45,106 52%
Subtotal Codes with Medicare Comparison $300,078 $539,242 56%
Children Repairs/Replacement Parts* 19 8,315 $73,689
Hearing Aids 24 328 $219,193
Adults Repairs/Replacement Parts 10 473 $7,756
Hearing Aids 25 672 $163,310
Subtotal Codes without Medicare Comparison $463,948
Adult eligibility for the Audiology program is limited to blind persons, pregnant women, and nursing facility residents (including ICF/IDD).
Codes with No Medicare Comparison
Codes with Medicare Comparison
SFY 2016 Rates
Audiology
MHD as %
Number of Units of Comparison Group
Codes Service MHD Cost Cost
Children Dental Services 124 340,388 $10,734,941 $33,541,538 32%
Adults Dental Services 112 46,373 $2,430,219 $7,980,711 30%
Subtotal Codes with UCR Comparison $13,165,160 $41,522,249 32%
Children Dental Services 22 24,735 $1,576,750 $2,861,827 55%
Adults Dental Services 23 22,142 $1,439,841 $2,685,195 54%
Subtotal Codes with Medicare Comparison $3,016,591 $5,547,022 54%
Total Codes with UCR and Medicare Comparisons $16,181,751 $47,069,271 34%
Children Dental Services 3 566 $11,307
Adults Dental Services 4 8 $145
Subtotal Codes without Medicare Comparison $11,452
Dental Rate Parity
MO HealthNet covers orthodontic treatment for children. The treatment must be prior authorized. The rate of reimbursement is determined by the severity
of the case. MO HealthNet pays a 25% down payment, then quarterly payments for 24 months. During SFY-2015, 1,649 units were billed. MO
HealthNet's cost was $373,276.
SFY 2015 Rates
Dental
Codes with No Medicare Comparison
Orthodontics
MHD as %
of Comparison Group
Codes with UCR Comparison
Codes with Medicare Comparison

20
Number of Units of Comparison Group
Codes Service MHD Cost Cost *
Children Supplies-Purchase 160 533,042 $1,615,935 $1,789,019 90%
Enteral & Parenteral Therapy-Purchase 27 1,382,340 $3,544,682 $4,029,833 88%
Equipment-Purchase 132 13,778 $1,836,614 $1,951,304 94%
Equipment-Rental 43 14,898 $2,564,980 $3,376,088 76%
Orthotic & Prosthetic-Purchase 301 18,887 $2,787,666 $3,883,553 72%
Repairs 80 1,266 $152,124 $156,070 97%
Adults Supplies-Purchase 151 412,976 $2,480,677 $2,856,361 87%
Enteral & Parenteral Therapy-Purchase 24 1,175,412 $2,045,884 $2,440,523 84%
Equipment-Purchase 257 20,359 $8,078,445 $8,401,575 96%
Equipment-Rental 59 29,202 $3,721,568 $4,138,457 90%
Orthotic & Prosthetic-Purchase 348 21,039 $5,489,535 $7,433,381 74%
Repairs 201 7,630 $1,047,940 $1,072,048 98%
Subtotal Codes with Medicare Comparison $35,366,049 $41,528,213 85%
Children Supplies-Purchase 69 2,446,308 $1,929,924
Enteral & Parenteral Therapy-Purchase 20 3,089,388 $3,834,676
Equipment-Purchase 36 5,172 $1,964,210
Equipment-Rental 20 10,538 $1,104,919
Orthotic & Prosthetic-Purchase 22 699 $56,075
Repairs 25 4,938 $142,749
Adults Supplies-Purchase 33 1,005,738 $1,070,711
Enteral & Parenteral Therapy-Purchase 7 75,308 $157,946
Equipment-Purchase 29 1,085 $967,523
Equipment-Rental 27 107,968 $10,292,774
Orthotic & Prosthetic-Purchase 16 762 $37,746
Repairs 30 15,378 $622,204
Subtotal Codes without Medicare Comparison $22,181,457
Codes with No Medicare Comparison
of Comparison Group
Codes with Medicare Comparison
FY 2015 Rates
Durable Medical Equipment
MHD as %
Number of Units of Comparison Group
Codes Service MHD Cost Cost
Children Exams/Procedures 45 42,580 $1,848,392 $5,163,065 36%
Frames/Lens 113 104,056 $1,686,280 $4,680,617 36%
Adults Exams/Procedures 57 39,328 $1,465,762 $4,231,373 35%
Frames/Lens 147 116,962 $2,844,351 $5,952,543 48%
Subtotal Codes with Medicare Comparison $7,844,785 $20,027,598 39%
Children Exams/Procedures/Frames/Lens 9 33,306 $171,686
Adults Exams/Procedures/Frames/Lens 12 34,216 $269,114
Subtotal Codes without Medicare Comparison $440,800
FY 2016 Rates
Optical
Codes with No Medicare Comparison
MHD as %
of Comparison Group
Codes with Medicare Comparison

21
Number of Units of Comparison Group
Codes Service MHD Cost Cost
Children Therapies, Tests & Evaluations 17 3,758 $37,580 $168,089 22%
Adults Therapies, Tests & Evaluations 7 7 $750 $2,849 26%
Subtotal Codes with Medicare Comparison $38,330 $170,938 22%
Children Therapies, Tests & Evaluations 1 55 $550
of Comparison Group
Codes with No Medicare Comparison
SFY 2015 Rates
Rehab Center Therapy
MHD as %
Codes with Medicare Comparison

22
Number of Units of Comparison Group MHD as %
Codes Service MHD Cost Cost of Comparison Group
Children X-ray (CPT 51725-95962; G0202 - G0206) 944 222,718 $4,241,160 $6,023,511 70%
Anesthesia (CPT 00100-01999) 459 2,113,407 $1,753,488 $3,950,164 44%
Lab (CPT 83020-89060) 790 414,781 $5,808,843 $6,873,917 85%
Surgery (CPT 10021-69990) 2,408 61,427 $11,255,503 $18,964,775 59%
Medical Services (G0108-99480) 770 997,343 $41,920,749 $75,114,278 56%
Nurse Midwife (CPT 11976-99460) 30 930 $98,175 $171,224 57%
Podiatry (CPT 10060-99349) 153 6,815 $340,715 $618,157 55%
Psychologist (CPT 90832-96116) * 40 143,129 $5,201,711 $10,859,374 48%
Ambulatory Surgical Center (10060-74420) 249 2,508 $805,270 $1,255,353 64%
Adults X-ray (CPT 51725-95962; G0202 - G0206) 1,360 879,344 $24,065,240 $34,424,109 70%
Anesthesia (CPT 00100-01999) 593 6,821,381 $5,413,392 $12,396,783 44%
Lab (CPT 83020-89060) 987 1,797,380 $25,266,228 $36,719,131 69%
Surgery (CPT 10021-69990) 4,187 274,756 $53,606,074 $96,528,843 56%
Medical Services (G0108-99479) 1,072 1,732,090 $85,699,940 $158,081,891 54%
Nurse Midwife (CPT 11976-99460) 30 3,418 $357,336 $630,365 57%
Podiatry (CPT 10060-99349) 317 39,870 $1,901,859 $3,466,554 55%
Psychologist (CPT 90832-96116) * 40 65,352 $3,408,333 $5,671,900 60%
Ambulatory Surgical Center (10060-74420) 607 7,662 $2,455,997 $3,524,691 70%
Subtotal Codes with Medicare Comparison $273,600,013 $475,275,021 58%
Children Medical Services (CPT 90633-90748) 42 139,287 $1,415,690 $5,922,562 24%
Subtotal Vaccine for Children Program $1,415,690 $5,922,562 24%
Children Surgery (Dental Codes Paid Under Physician) 41 12,071 $662,964 $1,906,522 35%
Adult Surgery (Dental Codes Paid Under Physician) 39 3,094 $333,862 $1,113,568 30%
Subtotal Codes with UCR Comparison $996,826 $3,020,090 33%
Total Codes with UCR and Medicare Comparisons $276,012,529 $484,217,673 57%
Children
Primary Care Rates and Vaccines for Children (Codes
Paid Under Physician, Increased Payment Amount) 132 225,099 $10,163,496
Adult
Primary Care Rates and Vaccines for Children (Codes
Paid Under Physician, Increased Payment Amount) 88 256,941 $11,566,969
Subtotal Codes with Primary Care Rate Increases $21,730,465
Total Codes with UCR, Medicare Comparisons and
Primary Care Rate Increase $297,742,994 $484,217,673 61%
Children X-ray (CPT 10021-96004, Q0092, R0070, R0075) 10 64 $4,620
Lab (CPT 80005-89325; G0103 - S3854) 66 6,363 $435,272
Surgery (CPT 11975-69799) 71 2,134 $115,150
Medical Services (CPT 01996-V2632) 54 63,148 $710,940
Nurse Midwife (CPT 58300-99396) 8 43 $1,390
Podiatry (CPT 15365-Q4048) 5 32 $1,212
Psychologist (CPT 90810 - 90885) 2 116 $2,784
Ambulatory Surgical Center (CPT 10120-V2632) 2 39,357 $305,626
Adults X-ray (CPT 10022-95936, R0070) 27 480 $13,604
Lab (CPT 81213-88399; S3854) 112 90,785 $1,334,190
Surgery (11975-69799) 109 16,890 $441,609
Medical Services (01996-V2632) 54 83,202 $6,456,885
Nurse Midwife (CPT 58300-99396) 5 184 $5,005
Podiatry (CPT 15365-Q4048) 14 124 $5,167
Psychologist (CPT 90810 - 90885) - 0 $0
Ambulatory Surgical Center (CPT 10120-V2632) 9 269 $35,257
Subtotal Codes without Medicare Comparison $9,868,710
Physician Rate Parity
Codes with Primary Care Rate Increases **
Physician Rate Parity with Primary Care Rate Increase
Codes with No Medicare Comparison
SFY 2015 Rates
Physicians
Codes with Medicare Comparison
Vaccines for Children Program Comparison
Codes with UCR Comparison

23
Missouri Vaccine for Children Program Through the Vaccine for Children (VFC) Program, federally provided vaccines are available at no cost to MO HealthNet providers for eligible children ages 0-18 years of age. MO HealthNet reimburses providers for the administration of the free vaccine. MO HealthNet currently reimburses $5.53 per vaccine component. The legislation that created the VFC program required that the federal government establish a limit on the amount of money that a provider can charge for the administration of the vaccines to VFC-eligible children. Each state has a different limit; Missouri’s limit is $21.53. Factors Influencing the Parity Comparison Several factors may influence the parity comparison between MHD and Medicare rates:
• If a specific Medicare rate was lowered and the MO HealthNet rate remained constant then the parity percentage for that code would have increased. Conversely, if Medicare raised its rate and the MO HealthNet rate remained constant then the parity percentage decreased.
• The UCR target for the Dental program could have changed from the previous year. Therefore, a similar effect may have occurred in the Dental program.
• The methodology used in calculating the comparison costs' aggregated codes, their rates and utilization may influence findings. Utilization reports were updated to SFY-2015 utilization. If utilization changed between years, the percentage of parity may have fluctuated, too. Likewise, the addition of newly utilized codes in SFY-2015 would influence the parity percentage.
Primary Care Rate Increase Between January 1, 2013 and December 31, 2014, payments for primary care services furnished by a physician with a primary specialty or subspecialty of family medicine, general internal medicine, or pediatric medicine was paid at parity with Medicare. The primary care services covered are for Evaluation and Management Healthcare Common Procedure Coding System (HCPCS) codes 99201-99499 and services related to immunization administration for vaccines and toxoids Current Procedural Terminology (CPT) codes 90465, 90466, 90467, 90468, 90471, 90472, 904723, 90474, or their successor codes. The primary care rate increase amounts are reported separately in the tables above of this report. The primary care rate increase amounts are not included in the MO HealthNet Rate Parity table below.
* Beginning in 2013, there have been major changes in the Psychiatry section of the CPT. Services
impacted consist of Assessment, Individual Therapy, Individual Interactive Therapy, Individual
Therapy with Evaluation and Management, and Crisis Intervention. The 2012 codes used by MHD for
these services are being replaced with new codes.
** Beginning January 1, 2013 federal law allows state Medicaid agencies to increase payments to
certain physician specialties for primary care Evaluation and Management (E/M) Healthcare
Common Procedure Coding System (HCPCS) codes 99201-99499 and services related to
immunization administration for vaccines and toxoids Current Procedural Terminology (CPT) codes
90465, 90466, 90467, 90468, 90471, 90472, 904723, 90474, or successor codes.

24
Conclusion The overall MO HealthNet rate for the SFY-2016 rate study is 56% of Medicare. This is a 1% decrease from the percentage found in the SFY-2015 and SFY-2014 rate studies. Please see the enclosed tables above for detailed findings by program area.
Comparison Group
MHD Cost Cost
Ambulance $25,113,895 $48,656,400 52%
Audiology $300,078 $539,242 56%
Dental $16,181,751 $47,069,271 34%
DME $35,366,049 $41,528,213 85%
Optical $7,844,785 $20,027,598 39%
Physician $276,012,529 $484,217,673 57%
Rehab Center Therapy $38,330 $170,938 22%
Subtotal Codes with Medicare Comparison $360,857,417 $642,209,334 56%
Ambulance $11,960
Audiology $463,948
Dental $384,728
DME $22,181,457
Optical $440,800
Physician $9,868,710
Rehab Center Therapy $550
Subtotal Codes without Medicare Comparison $33,352,153
Codes with No Medicare Comparison
SFY 2015 Rates
Summary
MHD as %
of Comparison Group
Codes with Medicare Comparison
MO HealthNet Rate Parity
Program SFY-2016 Rates as a Percentage
of Medicare
SFY-2015 Rates as a Percentage
of Medicare
Ambulance 52% 51%
Audiology 56% 54%
Dental* 34% 35%
Durable Medical Equipment 85% 85%
Optical 39% 39%
Physician** 57% 58%
Rehabilitation Center Therapy 22% 21%
*Dental is compared to the Usual, Customary, and Reasonable (UCR) rate and Medicare. **Percentage does not include the Primary Care Rate Increase.

25
Data to Assess Access: Fee-for-service Network Access Report
Data Sources Statewide Medicaid Population – per provider data from the State’s Cognos system Statewide Medicaid Provider files – per provider data from the State’s Cognos system Statewide FQHC, IRHC,PBRHC, CMHC listing – per Exhibit C of the Managed Care Contract Data Analysis was performed using Optum’s Geo Networks software Description This report is divided into five categories identified on separate worksheets across the bottom of the workbook.
1. Primary Care Services including, Primary Care Physicians, Federally Qualified Health Centers, Rural Health Center (Independent and Provider Based) and Dental Providers
2. Physician Specialty Services including, Cardiology, Neurology, Ophthalmology, Urology/Nephrology and Radiology
3. Behavioral Health Service including, Licensed Clinical Social Workers/Licensed Master Social Worker, Psychology, Licensed Professional Counselor/Provisional Licensed Professional Counselor, Psychiatry Child and Adult, Community Mental Health Center
4. Obstetrics and Gynecology Providers 5. Home Health Agencies
Each worksheet contains the following columns:
County – Names all Missouri Counties and St. Louis City
Total Population – Number of residents per county
Eligibles – Medicaid participants per county
% Medicaid – Percentage of county population that are Medicaid participants
County Type Urban, Basic, Rural – County classifications based on total population.
Providers – Total number of available Medicaid Providers per county
Ratio – Medicaid Participant to Medicaid Provider Ratio
Distance Columns 1,2,3 – Percentage of Medicaid participants with “provider type” within “x” miles. This is not limited by county, if there are 0 providers in a particular county, members may still have an available provider within the distance standard in a nearby county.
Distance standards were applied consistent with 20 CSR 400-7.095 which are used for MO HealthNet’s HMO Managed Care Plans (below). The Primary Care distance standard was used for any provider type, not identified on this list. The three distance columns on the report indicate Urban (closest), Basic (middle), Rural (furthest). When access standards are reviewed for Managed Care Plans each region must meet 90% access based on their county classification. This FFS report was not been grouped into regions, therefore, it reports percentages for all three county classifications. It is assumed that each county would only be required to meet a certain percentage, based on their county classification. Due to a software licensing issue, providers located in bordering states were not included in this analysis and therefore approximately 60 providers who have practice locations outside of Missouri were not analyzed. MHD will continue to monitor the number and potential impact of not including these

26
bordering state providers to understand whether alternative analysis should be completed to provide a complete picture of access. FFS Network Adequacy - Primary Care Services (Primary Care Providers)
CountyTotal
PopulationEligibles % Medicaid
County Type
Urban
Basic
Rural
Providers Ratio
Distance
1 provider
within 10 miles
Distance
1 provider
within 20 miles
Distance
1 provider
within 30 miles
Adair 25602 4947 19.3% R 77 64:1 1 1 1Andrew 17379 4822 27.7% R 20 241:1 0.963 1 1
Atchison 5382 924 17.2% R 10 92:1 0.929 1 1
Audrain 25887 6299 24.3% R 53 119:1 0.94 1 1Barry 35662 13341 37.4% R 68 196:1 0.905 1 1
Barton 12057 2869 23.8% R 16 179:1 0.757 1 1Bates 16584 3391 20.4% R 32 106:1 0.9 1 1
Benton 18806 4790 25.5% R 26 184:1 0.931 1 1Bollinger 12394 3195 25.8% R 3 1065:1 0.745 1 1
Boone 172717 22941 13.3% B 685 33:1 0.988 1 1
Buchanan 89486 18459 20.6% B 199 93:1 0.981 1 1Butler 42972 13648 31.8% R 132 103:1 0.909 1 1
Caldwell 9034 1693 18.7% R 6 282:1 0.709 1 1Callaway 44750 7644 17.1% R 66 116:1 0.953 1 1
Camden 44021 7510 17.1% R 106 71:1 0.946 1 1Cape Girardeau 78043 14234 18.2% B 266 54:1 0.973 1 1
Carroll 9043 1865 20.6% R 18 104:1 0.9 1 1Carter 6258 2185 34.9% R 21 104:1 0.604 1 1Cass 100889 15118 15.0% B 138 110:1 0.99 1 1
Cedar 13952 4299 30.8% R 15 287:1 0.912 1 1Chariton 7694 2018 26.2% R 11 183:1 0.888 1 1
Christian 82101 14800 18.0% B 60 247:1 0.963 1 1Clark 6917 1365 19.7% R 4 341:1 0.793 1 1
Clay 233682 30763 13.2% B 403 76:1 1 1 1Clinton 20299 2120 10.4% R 6 353:1 0.926 1 1
Cole 76557 12634 16.5% B 195 65:1 0.956 1 1
Cooper 17585 3333 19.0% R 56 60:1 0.798 1 1Crawford 24650 6103 24.8% R 17 359:1 0.894 1 1
Dade 7628 1881 24.7% R 5 376:1 0.8 1 1Dallas 16389 3891 23.7% R 5 778:1 0.722 1 1
Daviess 8297 1725 20.8% R 2 863:1 0.816 1 1
DeKalb 12692 2922 23.0% R 34 86:1 0.958 1 1
Dent 15655 4321 27.6% R 10 432:1 0.833 1 1
Douglas 13546 3386 25.0% R 7 484:1 0.867 1 1
Dunklin 31344 12438 39.7% R 50 249:1 0.843 0.947 1
Franklin 102084 19871 19.5% B 213 93:1 0.99 1 1
Gasconade 14866 3112 20.9% R 24 130:1 0.86 1 1
Gentry 6826 1515 22.2% R 18 84:1 0.725 1 1
Greene 285865 57947 20.3% U 822 70:1 0.985 1 1
Grundy 10197 2279 22.3% R 38 60:1 0.875 1 1
Harrison 8639 2178 25.2% R 35 62:1 0.782 0.999 1
Henry 22028 5609 25.5% R 61 92:1 0.858 1 1
Hickory 9219 1917 20.8% R 5 383:1 0.919 1 1
Holt 4516 796 17.6% R 7 114:1 0.844 1 1
Howard 10159 2195 21.6% R 9 244:1 0.8 1 1
Howell 40173 12761 31.8% R 102 125:1 0.87 1 1
Iron 10267 3399 33.1% R 48 71:1 0.841 1 1
Jackson 683191 147751 21.6% U 2236 66:1 1 1 1
Jasper 117543 24278 20.7% B 83 293:1 0.975 1 1
Jefferson 222716 30761 13.8% B 224 137:1 0.997 1 1
Johnson 54362 6748 12.4% R 107 63:1 0.926 1 1
Knox 4000 807 20.2% R 5 161:1 0.793 1 1
Laclede 35439 9941 28.1% R 41 242:1 0.907 0.985 1
Lafayette 32688 6297 19.3% R 84 75:1 0.992 1 1
Lawrence 38023 5472 14.4% R 11 497:1 0.936 1 1
Lewis 10138 1745 17.2% R 4 436:1 0.853 1 1
Lincoln 54249 9810 18.1% R 56 175:1 0.933 1 1
Linn 12311 2131 17.3% R 15 142:1 0.868 1 1
Livingston 15053 2945 19.6% R 55 54:1 0.872 1 1
Demographics Primary Care

27
CountyTotal
PopulationEligibles % Medicaid
County Type
Urban
Basic
Rural
Providers Ratio
Distance
1 provider
within 10 miles
Distance
1 provider
within 20 miles
Distance
1 provider
within 30 miles
Macon 15479 3096 20.0% R 42 74:1 0.844 1 1
Madison 12368 3644 29.5% R 14 260:1 0.78 1 1
Maries 9013 1381 15.3% R 4 345:1 0.926 1 1
Marion 28920 7115 24.6% R 79 90:1 0.966 1 1
McDonald 22800 6626 29.1% R 12 552:1 0.887 1 1
Mercer 3719 722 19.4% R 8 90:1 0.82 1 1
Miller 25141 6281 25.0% R 48 131:1 0.926 1 1
Mississippi 14232 4705 33.1% R 4 1176:1 0.999 1 1
Moniteau 15856 2600 16.4% R 11 236:1 0.978 1 1
Monroe 8707 977 11.2% R 2 489:1 0.661 1 1
Montgomery 11841 2713 22.9% R 4 678:1 0.801 1 1
Morgan 20240 5158 25.5% R 35 147:1 0.968 1 1
New Madrid 18272 5771 31.6% R 12 481:1 0.926 1 1
Newton 58598 17745 30.3% B 390 46:1 0.973 1 1
Nodaway 23081 2662 11.5% R 34 78:1 0.637 0.995 1
Oregon 10911 3634 33.3% R 4 909:1 0.85 1 1
Osage 13703 1413 10.3% R 15 94:1 0.914 1 1
Ozark 9492 2429 25.6% R 3 810:1 0.662 0.949 1
Pemiscot 17650 7173 40.6% R 13 552:1 0.934 1 1
Perry 19202 3669 19.1% R 28 131:1 0.938 1 1
Pettis 42225 10827 25.6% R 70 155:1 0.948 1 1
Phelps 44847 9505 21.2% R 91 104:1 0.932 1 1
Pike 18541 3395 18.3% R 25 136:1 0.857 1 1
Platte 94788 9061 9.6% B 146 62:1 0.985 1 1
Polk 31054 7867 25.3% R 58 136:1 0.925 1 1
Pulaski 53436 8076 15.1% R 29 278:1 0.944 1 1
Putnam 4829 1082 22.4% R 16 68:1 0.601 1 1
Ralls 10255 2006 19.6% R 12 167:1 0.89 1 1
Randolph 25072 5833 23.3% R 63 93:1 0.943 1 1
Ray 22949 3522 15.3% R 18 196:1 0.907 1 1
Reynolds 6565 1798 27.4% R 26 69:1 0.66 1 1
Ripley 13969 4979 35.6% R 47 106:1 0.96 0.996 1
Saline 23347 5057 21.7% R 54 94:1 0.848 1 1
Schuyler 4370 955 21.9% R 3 318:1 0.885 1 1
Scotland 4863 822 16.9% R 21 39:1 0.719 1 1
Scott 38903 12455 32.0% R 70 178:1 1 1 1
Shannon 8329 2337 28.1% R 8 292:1 0.21 1 1
Shelby 6108 1543 25.3% R 2 772:1 0.883 1 1
St. Charles 379493 33082 8.7% U 814 41:1 0.998 1 1
St. Clair 9457 2123 22.4% R 24 88:1 0.781 1 1
St. Francois 65960 16584 25.1% B 185 90:1 0.97 1 1
St. Louis City 317419 100441 31.6% U 2867 35:1 1 1 1
St. Louis Co. 1001876 156695 15.6% U 1802 87:1 1 1 1
Ste. Genevieve 17914 2803 15.6% R 35 80:1 0.826 1 1
Stoddard 29867 8421 28.2% R 88 96:1 0.964 1 1
Stone 31104 5756 18.5% R 12 480:1 0.929 1 1
Sullivan 6411 1529 23.8% R 9 170:1 0.846 1 1
Taney 54230 13078 24.1% R 197 66:1 0.993 1 1
Texas 25642 6584 25.7% R 31 212:1 0.891 0.991 1
Vernon 21001 5049 24.0% R 42 120:1 0.871 1 1
Warren 33253 6188 18.6% R 26 238:1 0.988 1 1
Washington 25077 7202 28.7% R 18 400:1 0.709 1 1
Wayne 13452 4681 34.8% R 23 204:1 0.909 1 1
Webster 36888 9281 25.2% R 21 442:1 0.928 1 1
Worth 2073 431 20.8% R 4 108:1 0.794 1 1
Wright 18291 6926 37.9% R 13 533:1 0.879 1 1
TOTAL: 6,063,589 1,187,627 19.6% 14,857 1.0 1.0 1.0
Demographics Primary Care

28
FFS Network Adequacy - Primary Care Services (Federally Qualified Health Centers)
CountyTotal
PopulationEligibles % Medicaid
County Type
Urban
Basic
Rural
Facilities Ratio
Distance
1 provider
within 10 miles
Distance
1 provider
within 20 miles
Distance
1 provider
within 30 miles
Adair 25602 4947 19.3% R 5 989:1 90.3 100 100Andrew 17379 4822 27.7% R 3 1607:1 93.9 100 100
Atchison 5382 924 17.2% R 0 0 11.7 75
Audrain 25887 6299 24.3% R 1 6299:1 57.2 82.6 100Barry 35662 13341 37.4% R 0 3.1 56.4 92.6
Barton 12057 2869 23.8% R 1 2869:1 68.1 96.8 100Bates 16584 3391 20.4% R 2 1696:1 70.4 100 100
Benton 18806 4790 25.5% R 1 4790:1 58.2 100 100Bollinger 12394 3195 25.8% R 2 1598:1 67 94.6 100
Boone 172717 22941 13.3% B 4 5735:1 87.9 99.3 100
Buchanan 89486 18459 20.6% B 5 3692:1 97.1 99.5 100Butler 42972 13648 31.8% R 2 6824:1 80.4 99.5 100
Caldwell 9034 1693 18.7% R 3 564:1 70.9 100 100Callaway 44750 7644 17.1% R 1 7644:1 57.8 99.8 100
Camden 44021 7510 17.1% R 2 3755:1 73.9 98.4 100Cape Girardeau 78043 14234 18.2% B 2 7117:1 69.3 98.3 100
Carroll 9043 1865 20.6% R 1 1865:1 68 93.5 100Carter 6258 2185 34.9% R 1 2185:1 12.1 74.9 100Cass 100889 15118 15.0% B 1 15118:1 54.5 82.4 99.5
Cedar 13952 4299 30.8% R 1 4299:1 54.9 77.1 100Chariton 7694 2018 26.2% R 3 673:1 65.1 96.1 100
Christian 82101 14800 18.0% B 0 11.6 94.7 100Clark 6917 1365 19.7% R 1 1365:1 79.3 100 100
Clay 233682 30763 13.2% B 1 30763:1 84.3 99.9 100Clinton 20299 2120 10.4% R 0 0 29.7 100
Cole 76557 12634 16.5% B 1 12634:1 80.5 99.1 100
Cooper 17585 3333 19.0% R 0 0 29.1 100Crawford 24650 6103 24.8% R 0 1.7 10.6 76.4
Dade 7628 1881 24.7% R 0 0 13.3 100Dallas 16389 3891 23.7% R 1 3891:1 23.7 96.3 100
Daviess 8297 1725 20.8% R 0 0 68.3 100
DeKalb 12692 2922 23.0% R 0 3.4 94.5 100
Dent 15655 4321 27.6% R 0 1.9 9.9 96.6
Douglas 13546 3386 25.0% R 1 3386:1 73.7 100 100
Dunklin 31344 12438 39.7% R 1 12438:1 62.7 93.5 100
Franklin 102084 19871 19.5% B 3 6624:1 46.4 82.2 100
Gasconade 14866 3112 20.9% R 0 0 19.3 94.7
Gentry 6826 1515 22.2% R 1 1515:1 22.1 50.1 100
Greene 285865 57947 20.3% U 3 19316:1 90.9 99.6 100
Grundy 10197 2279 22.3% R 0 0 6.6 40.2
Harrison 8639 2178 25.2% R 0 10 24.1 100
Henry 22028 5609 25.5% R 1 5609:1 58.1 85.2 100
Hickory 9219 1917 20.8% R 2 959:1 65.7 100 100
Holt 4516 796 17.6% R 1 796:1 47.7 100 100
Howard 10159 2195 21.6% R 0 1.9 37.5 100
Howell 40173 12761 31.8% R 1 12761:1 51.7 89.3 100
Iron 10267 3399 33.1% R 3 1133:1 83.6 100 100
Jackson 683191 147751 21.6% U 11 13432:1 95.6 100 100
Jasper 117543 24278 20.7% B 3 8093:1 58 96 100
Jefferson 222716 30761 13.8% B 6 5127:1 85.3 100 100
Johnson 54362 6748 12.4% R 0 0 32.6 100
Knox 4000 807 20.2% R 1 807:1 74.5 95.2 100
Laclede 35439 9941 28.1% R 1 9941:1 75.2 97.7 100
Lafayette 32688 6297 19.3% R 5 1259:1 69.8 100 100
Lawrence 38023 5472 14.4% R 1 5472:1 41.9 98 100
Lewis 10138 1745 17.2% R 0 0 16.6 95.2
Lincoln 54249 9810 18.1% R 0 0.9 67.9 94.6
Linn 12311 2131 17.3% R 0 26 91.8 100
Livingston 15053 2945 19.6% R 0 2.3 11.5 94.8
Demographics FQHC

29
CountyTotal
PopulationEligibles % Medicaid
County Type
Urban
Basic
Rural
Facilities Ratio
Distance
1 provider
within 10 miles
Distance
1 provider
within 20 miles
Distance
1 provider
within 30 miles
Macon 15479 3096 20.0% R 2 1548:1 59.1 99.5 100
Madison 12368 3644 29.5% R 0 0 39.4 100
Maries 9013 1381 15.3% R 0 2.5 64.6 100
Marion 28920 7115 24.6% R 1 7115:1 81.7 95.6 100
McDonald 22800 6626 29.1% R 2 3313:1 45.6 95.2 100
Mercer 3719 722 19.4% R 1 722:1 15.4 100 100
Miller 25141 6281 25.0% R 0 29.6 93.3 100
Mississippi 14232 4705 33.1% R 1 4705:1 51.4 100 100
Moniteau 15856 2600 16.4% R 1 2600:1 63.3 100 100
Monroe 8707 977 11.2% R 0 0 7.5 73.2
Montgomery 11841 2713 22.9% R 0 0 22.5 98.3
Morgan 20240 5158 25.5% R 2 2579:1 54.1 100 100
New Madrid 18272 5771 31.6% R 4 1443:1 54.2 100 100
Newton 58598 17745 30.3% B 1 17745:1 78.6 99.1 100
Nodaway 23081 2662 11.5% R 0 0 10.7 77
Oregon 10911 3634 33.3% R 1 3634:1 45.7 100 100
Osage 13703 1413 10.3% R 1 1413:1 64 95 100
Ozark 9492 2429 25.6% R 1 2429:1 45.8 88.3 100
Pemiscot 17650 7173 40.6% R 2 3587:1 72.1 100 100
Perry 19202 3669 19.1% R 2 1835:1 79.5 97.2 100
Pettis 42225 10827 25.6% R 2 5414:1 81.9 100 100
Phelps 44847 9505 21.2% R 2 4753:1 70.1 96.3 99.8
Pike 18541 3395 18.3% R 0 0 3.3 12.6
Platte 94788 9061 9.6% B 1 9061:1 75.9 94 100
Polk 31054 7867 25.3% R 1 7867:1 60.9 88.1 100
Pulaski 53436 8076 15.1% R 1 8076:1 18.8 97.2 100
Putnam 4829 1082 22.4% R 0 0 3.6 97.2
Ralls 10255 2006 19.6% R 0 16.9 54.4 100
Randolph 25072 5833 23.3% R 0 1.2 61.9 100
Ray 22949 3522 15.3% R 0 13.2 75.2 100
Reynolds 6565 1798 27.4% R 2 899:1 44.3 91.4 100
Ripley 13969 4979 35.6% R 1 4979:1 23.3 95.9 100
Saline 23347 5057 21.7% R 1 5057:1 76.6 100 100
Schuyler 4370 955 21.9% R 0 0 32.6 100
Scotland 4863 822 16.9% R 0 0 56.9 100
Scott 38903 12455 32.0% R 3 4152:1 90.5 100 100
Shannon 8329 2337 28.1% R 1 2337:1 21 100 100
Shelby 6108 1543 25.3% R 0 0 27.9 97.9
St. Charles 379493 33082 8.7% U 2 16541:1 94.3 100 100
St. Clair 9457 2123 22.4% R 1 2123:1 50.6 89.9 100
St. Francois 65960 16584 25.1% B 1 16584:1 60.6 100 100
St. Louis City 317419 100441 31.6% U 15 6696:1 100 100 100
St. Louis Co. 1001876 156695 15.6% U 2 78348:1 95.6 100 100
Ste. Genevieve 17914 2803 15.6% R 0 4.4 51.2 100
Stoddard 29867 8421 28.2% R 3 2807:1 44.4 92.1 100
Stone 31104 5756 18.5% R 1 5756:1 52.6 95.1 100
Sullivan 6411 1529 23.8% R 1 1529:1 61.3 93.7 100
Taney 54230 13078 24.1% R 2 6539:1 95.8 99.6 100
Texas 25642 6584 25.7% R 1 6584:1 24.2 44.5 79.7
Vernon 21001 5049 24.0% R 0 0.7 57.2 98.9
Warren 33253 6188 18.6% R 1 6188:1 75.2 99.6 100
Washington 25077 7202 28.7% R 1 7202:1 63.2 98.8 100
Wayne 13452 4681 34.8% R 1 4681:1 27.6 100 100
Webster 36888 9281 25.2% R 2 4641:1 68.1 100 100
Worth 2073 431 20.8% R 0 0 0 8.8
Wright 18291 6926 37.9% R 2 3463:1 70 97.9 100
TOTAL: 6,063,589 1,187,627 19.6% 163 72.6 92.4 99.1
Demographics FQHC

30
FFS Network Adequacy - Primary Care Services (Rural Health Clinics)
CountyTotal
PopulationEligibles % Medicaid
County Type
Urban
Basic
Rural
Facilities Ratio
Distance
1 provider
within 10 miles
Distance
1 provider
within 20 miles
Distance
1 provider
within 30 miles
Adair 25602 4947 19.3% R 2 2474:1 83.5 100 100Andrew 17379 4822 27.7% R 0 0 15.4 98.9
Atchison 5382 924 17.2% R 0 0 0 20
Audrain 25887 6299 24.3% R 6 1050:1 94 100 100Barry 35662 13341 37.4% R 9 1482:1 87.8 100 100
Barton 12057 2869 23.8% R 2 1435:1 88.5 100 100Bates 16584 3391 20.4% R 5 678:1 88.9 100 100
Benton 18806 4790 25.5% R 2 2395:1 59.6 90.1 100Bollinger 12394 3195 25.8% R 1 3195:1 67 100 100
Boone 172717 22941 13.3% B 1 22941:1 12.7 92.8 100
Buchanan 89486 18459 20.6% B 0 0.4 75.5 99.1Butler 42972 13648 31.8% R 10 1365:1 83.4 99.6 100
Caldwell 9034 1693 18.7% R 2 847:1 73.8 100 100Callaway 44750 7644 17.1% R 2 3822:1 56.3 87.5 100
Camden 44021 7510 17.1% R 3 2503:1 91.4 100 100Cape Girardeau 78043 14234 18.2% B 11 1294:1 93.5 100 100
Carroll 9043 1865 20.6% R 4 466:1 96.4 100 100Carter 6258 2185 34.9% R 1 2185:1 12.1 100 100Cass 100889 15118 15.0% B 4 3780:1 42.9 100 100
Cedar 13952 4299 30.8% R 3 1433:1 88.8 100 100Chariton 7694 2018 26.2% R 2 1009:1 66.4 100 100
Christian 82101 14800 18.0% B 3 4933:1 94 100 100Clark 6917 1365 19.7% R 1 1365:1 19.2 100 100
Clay 233682 30763 13.2% B 0 0.3 16.9 83.3Clinton 20299 2120 10.4% R 3 707:1 63.6 100 100
Cole 76557 12634 16.5% B 0 0 5 97.9
Cooper 17585 3333 19.0% R 2 1667:1 83.3 100 100Crawford 24650 6103 24.8% R 7 872:1 87.7 99.1 100
Dade 7628 1881 24.7% R 2 941:1 84.4 100 100Dallas 16389 3891 23.7% R 4 973:1 72.2 100 100
Daviess 8297 1725 20.8% R 4 431:1 90.7 100 100
DeKalb 12692 2922 23.0% R 1 2922:1 23.8 99.2 100
Dent 15655 4321 27.6% R 4 1080:1 82 99.1 100
Douglas 13546 3386 25.0% R 1 3386:1 13 100 100
Dunklin 31344 12438 39.7% R 9 1382:1 94.9 100 100
Franklin 102084 19871 19.5% B 3 6624:1 48.8 96.8 100
Gasconade 14866 3112 20.9% R 3 1037:1 81 100 100
Gentry 6826 1515 22.2% R 1 1515:1 31.2 100 100
Greene 285865 57947 20.3% U 4 14487:1 34.8 100 100
Grundy 10197 2279 22.3% R 2 1140:1 87.5 100 100
Harrison 8639 2178 25.2% R 3 726:1 74.2 97.3 100
Henry 22028 5609 25.5% R 2 2805:1 83.2 100 100
Hickory 9219 1917 20.8% R 1 1917:1 81.5 100 100
Holt 4516 796 17.6% R 0 0 9.4 92.6
Howard 10159 2195 21.6% R 1 2195:1 25.9 100 100
Howell 40173 12761 31.8% R 10 1276:1 81.4 99.7 100
Iron 10267 3399 33.1% R 2 1700:1 57.5 89.9 100
Jackson 683191 147751 21.6% U 0 1.8 24.1 81.6
Jasper 117543 24278 20.7% B 4 6070:1 47.1 100 100
Jefferson 222716 30761 13.8% B 2 15381:1 22.9 61.7 100
Johnson 54362 6748 12.4% R 5 1350:1 86.3 100 100
Knox 4000 807 20.2% R 2 404:1 90.5 100 100
Laclede 35439 9941 28.1% R 7 1420:1 84.8 98.5 100
Lafayette 32688 6297 19.3% R 5 1259:1 93.1 100 100
Lawrence 38023 5472 14.4% R 3 1824:1 88.6 100 100
Lewis 10138 1745 17.2% R 4 436:1 87.1 100 100
Lincoln 54249 9810 18.1% R 6 1635:1 92.9 100 100
Linn 12311 2131 17.3% R 2 1066:1 71.5 99.9 100
Livingston 15053 2945 19.6% R 1 2945:1 82.6 100 100
Demographics RHC

31
CountyTotal
PopulationEligibles % Medicaid
County Type
Urban
Basic
Rural
Facilities Ratio
Distance
1 provider
within 10 miles
Distance
1 provider
within 20 miles
Distance
1 provider
within 30 miles
Macon 15479 3096 20.0% R 2 1548:1 80.4 99.3 100
Madison 12368 3644 29.5% R 2 1822:1 78 97.1 100
Maries 9013 1381 15.3% R 2 691:1 86.4 100 100
Marion 28920 7115 24.6% R 3 2372:1 96.4 100 100
McDonald 22800 6626 29.1% R 5 1325:1 86.7 100 100
Mercer 3719 722 19.4% R 1 722:1 66.6 100 100
Miller 25141 6281 25.0% R 4 1570:1 90.8 100 100
Mississippi 14232 4705 33.1% R 4 1176:1 97.4 100 100
Moniteau 15856 2600 16.4% R 1 2600:1 29.3 95.2 100
Monroe 8707 977 11.2% R 2 489:1 67.5 100 100
Montgomery 11841 2713 22.9% R 4 678:1 65.3 100 100
Morgan 20240 5158 25.5% R 2 2579:1 86.1 100 100
New Madrid 18272 5771 31.6% R 4 1443:1 52.9 100 100
Newton 58598 17745 30.3% B 2 8873:1 37.4 98.9 100
Nodaway 23081 2662 11.5% R 2 1331:1 63.9 97.1 100
Oregon 10911 3634 33.3% R 2 1817:1 86.9 100 100
Osage 13703 1413 10.3% R 0 1.3 76.4 100
Ozark 9492 2429 25.6% R 2 1215:1 61.8 88.3 100
Pemiscot 17650 7173 40.6% R 8 897:1 96.5 100 100
Perry 19202 3669 19.1% R 5 734:1 81.6 99.4 100
Pettis 42225 10827 25.6% R 0 1.7 25.3 100
Phelps 44847 9505 21.2% R 6 1584:1 90.3 100 100
Pike 18541 3395 18.3% R 5 679:1 88.2 100 100
Platte 94788 9061 9.6% B 0 0 3.4 37.7
Polk 31054 7867 25.3% R 9 874:1 91.6 100 100
Pulaski 53436 8076 15.1% R 4 2019:1 87.5 100 100
Putnam 4829 1082 22.4% R 1 1082:1 60.1 100 100
Ralls 10255 2006 19.6% R 2 1003:1 77.4 100 100
Randolph 25072 5833 23.3% R 2 2917:1 90.5 100 100
Ray 22949 3522 15.3% R 2 1761:1 61.9 100 100
Reynolds 6565 1798 27.4% R 1 1798:1 41.5 67.2 100
Ripley 13969 4979 35.6% R 1 4979:1 72.8 99.2 100
Saline 23347 5057 21.7% R 3 1686:1 96.3 100 100
Schuyler 4370 955 21.9% R 1 955:1 87.4 100 100
Scotland 4863 822 16.9% R 1 822:1 86.9 100 100
Scott 38903 12455 32.0% R 11 1132:1 99.4 100 100
Shannon 8329 2337 28.1% R 2 1169:1 79 100 100
Shelby 6108 1543 25.3% R 2 772:1 80.7 100 100
St. Charles 379493 33082 8.7% U 0 1.7 50.8 99.9
St. Clair 9457 2123 22.4% R 4 531:1 77 100 100
St. Francois 65960 16584 25.1% B 4 4146:1 95.4 100 100
St. Louis City 317419 100441 31.6% U 0 0 0 0
St. Louis Co. 1001876 156695 15.6% U 0 0 0.1 10
Ste. Genevieve 17914 2803 15.6% R 5 561:1 78 100 100
Stoddard 29867 8421 28.2% R 11 766:1 94.3 100 100
Stone 31104 5756 18.5% R 4 1439:1 84.3 100 100
Sullivan 6411 1529 23.8% R 3 510:1 83.5 100 100
Taney 54230 13078 24.1% R 8 1635:1 95.5 100 100
Texas 25642 6584 25.7% R 5 1317:1 87.3 98.6 100
Vernon 21001 5049 24.0% R 3 1683:1 87.1 100 100
Warren 33253 6188 18.6% R 1 6188:1 88.1 100 100
Washington 25077 7202 28.7% R 6 1200:1 75.5 96.8 100
Wayne 13452 4681 34.8% R 2 2341:1 67.9 96.3 100
Webster 36888 9281 25.2% R 6 1547:1 92.8 100 100
Worth 2073 431 20.8% R 1 431:1 79.1 100 100
Wright 18291 6926 37.9% R 7 989:1 87.9 100 100
TOTAL: 6,063,589 1,187,627 19.6% 364 38.8 60.5 76.4
RHCDemographics

32
FFS Network Adequacy - Primary Care Services (Dental)
CountyTotal
PopulationEligibles % Medicaid
County Type
Urban
Basic
Rural
Providers Ratio
Distance
1 provider
within 10 miles
Distance
1 provider
within 20 miles
Distance
1 provider
within 30 miles
Adair 25602 4947 19.3% R 7 707:1 90.3 100 100Andrew 17379 4822 27.7% R 5 964:1 95.1 100 100
Atchison 5382 924 17.2% R 1 924:1 54 94.2 100
Audrain 25887 6299 24.3% R 3 2100:1 57.4 96.5 100Barry 35662 13341 37.4% R 4 3335:1 31.3 100 100
Barton 12057 2869 23.8% R 0 3.7 100Bates 16584 3391 20.4% R 4 848:1 50.5 100 100
Benton 18806 4790 25.5% R 2 2395:1 61.6 100 100Bollinger 12394 3195 25.8% R 6 533:1 67 94.6 100
Boone 172717 22941 13.3% B 19 1207:1 88.5 99.3 100
Buchanan 89486 18459 20.6% B 18 1026:1 97.3 99.4 100Butler 42972 13648 31.8% R 14 975:1 84 99.6 100
Caldwell 9034 1693 18.7% R 4 423:1 69.9 100 100Callaway 44750 7644 17.1% R 5 1529:1 74.3 100 100
Camden 44021 7510 17.1% R 6 1252:1 90.2 100 100Cape Girardeau 78043 14234 18.2% B 19 749:1 93 100 100
Carroll 9043 1865 20.6% R 8 233:1 68 93.5 100Carter 6258 2185 34.9% R 1 2185:1 48.3 97.8 100Cass 100889 15118 15.0% B 11 1374:1 88.6 97.8 100
Cedar 13952 4299 30.8% R 2 2150:1 59.4 78.9 100Chariton 7694 2018 26.2% R 17 119:1 66.9 96.5 100
Christian 82101 14800 18.0% B 13 1138:1 86.4 100 100Clark 6917 1365 19.7% R 2 683:1 79.3 100 100
Clay 233682 30763 13.2% B 20 1538:1 97.1 100 100Clinton 20299 2120 10.4% R 1 2120:1 13.2 100 100
Cole 76557 12634 16.5% B 24 526:1 90.4 100 100
Cooper 17585 3333 19.0% R 0 0 84.2 100Crawford 24650 6103 24.8% R 1 6103:1 44 97.5 100
Dade 7628 1881 24.7% R 0 13.1 53.4 100Dallas 16389 3891 23.7% R 2 1946:1 64.9 100 100
Daviess 8297 1725 20.8% R 2 863:1 56.3 95.8 100
DeKalb 12692 2922 23.0% R 3 974:1 78 100 100
Dent 15655 4321 27.6% R 1 4321:1 78.1 94.8 100
Douglas 13546 3386 25.0% R 7 484:1 73.7 96.3 100
Dunklin 31344 12438 39.7% R 6 2073:1 76.2 94.7 100
Franklin 102084 19871 19.5% B 10 1987:1 66.6 87.5 100
Gasconade 14866 3112 20.9% R 2 1556:1 72.2 100 100
Gentry 6826 1515 22.2% R 1 1515:1 43 100 100
Greene 285865 57947 20.3% U 60 966:1 96 100 100
Grundy 10197 2279 22.3% R 3 760:1 85.4 100 100
Harrison 8639 2178 25.2% R 3 726:1 67.4 96.3 100
Henry 22028 5609 25.5% R 3 1870:1 80.3 99.5 100
Hickory 9219 1917 20.8% R 3 639:1 65.7 100 100
Holt 4516 796 17.6% R 2 398:1 54 100 100
Howard 10159 2195 21.6% R 2 1098:1 61.7 100 100
Howell 40173 12761 31.8% R 9 1418:1 79.6 99.6 100
Iron 10267 3399 33.1% R 0 0 38.1 100
Jackson 683191 147751 21.6% U 148 998:1 99.5 100 100
Jasper 117543 24278 20.7% B 17 1428:1 91.9 100 100
Jefferson 222716 30761 13.8% B 17 1809:1 92.1 100 100
Johnson 54362 6748 12.4% R 0 0.8 47.6 100
Knox 4000 807 20.2% R 1 807:1 82.4 95.9 100
Laclede 35439 9941 28.1% R 1 9941:1 80.7 99.2 100
Lafayette 32688 6297 19.3% R 10 630:1 40.6 98.1 100
Lawrence 38023 5472 14.4% R 2 2736:1 58.4 100 100
Lewis 10138 1745 17.2% R 0 0 31.3 100
Lincoln 54249 9810 18.1% R 4 2453:1 76.1 100 100
Linn 12311 2131 17.3% R 4 533:1 76.3 93.6 100
Livingston 15053 2945 19.6% R 7 421:1 83.7 100 100
Demographics Dental

33
CountyTotal
PopulationEligibles % Medicaid
County Type
Urban
Basic
Rural
Providers Ratio
Distance
1 provider
within 10 miles
Distance
1 provider
within 20 miles
Distance
1 provider
within 30 miles
Macon 15479 3096 20.0% R 0 0 26.3 98.1
Madison 12368 3644 29.5% R 0 0 33.6 100
Maries 9013 1381 15.3% R 0 22.9 88.7 100
Marion 28920 7115 24.6% R 14 508:1 94.7 100 100
McDonald 22800 6626 29.1% R 18 368:1 64.6 97.8 100
Mercer 3719 722 19.4% R 0 0 2.2 100
Miller 25141 6281 25.0% R 1 6281:1 30.8 100 100
Mississippi 14232 4705 33.1% R 1 4705:1 57.2 100 100
Moniteau 15856 2600 16.4% R 5 520:1 63.3 100 100
Monroe 8707 977 11.2% R 0 0 13.2 61.9
Montgomery 11841 2713 22.9% R 0 3.1 45.5 100
Morgan 20240 5158 25.5% R 2 2579:1 73.1 100 100
New Madrid 18272 5771 31.6% R 7 824:1 56.2 100 100
Newton 58598 17745 30.3% B 10 1775:1 83.4 99.7 100
Nodaway 23081 2662 11.5% R 4 666:1 64.7 98 100
Oregon 10911 3634 33.3% R 3 1211:1 47.6 100 100
Osage 13703 1413 10.3% R 6 236:1 64 100 100
Ozark 9492 2429 25.6% R 4 607:1 45.8 88.3 100
Pemiscot 17650 7173 40.6% R 7 1025:1 73.9 100 100
Perry 19202 3669 19.1% R 10 367:1 81.6 99 100
Pettis 42225 10827 25.6% R 12 902:1 87.9 100 100
Phelps 44847 9505 21.2% R 15 634:1 89 99.3 100
Pike 18541 3395 18.3% R 0 0.3 12.6 100
Platte 94788 9061 9.6% B 3 3020:1 93.5 100 100
Polk 31054 7867 25.3% R 9 874:1 64.6 100 100
Pulaski 53436 8076 15.1% R 12 673:1 77.4 100 100
Putnam 4829 1082 22.4% R 2 541:1 60.1 100 100
Ralls 10255 2006 19.6% R 1 2006:1 33.9 100 100
Randolph 25072 5833 23.3% R 0 0.9 56.8 100
Ray 22949 3522 15.3% R 0 24.8 100 100
Reynolds 6565 1798 27.4% R 10 180:1 43.8 71 100
Ripley 13969 4979 35.6% R 0 0 20.6 99.2
Saline 23347 5057 21.7% R 2 2529:1 93.1 100 100
Schuyler 4370 955 21.9% R 0 0 32.6 100
Scotland 4863 822 16.9% R 0 0 56.9 100
Scott 38903 12455 32.0% R 16 778:1 92.3 100 100
Shannon 8329 2337 28.1% R 0 0 38.4 100
Shelby 6108 1543 25.3% R 0 0 7.3 36.8
St. Charles 379493 33082 8.7% U 23 1438:1 98.6 100 100
St. Clair 9457 2123 22.4% R 4 531:1 50.6 89.9 100
St. Francois 65960 16584 25.1% B 13 1276:1 84.9 100 100
St. Louis City 317419 100441 31.6% U 122 823:1 100 100 100
St. Louis Co. 1001876 156695 15.6% U 75 2089:1 100 100 100
Ste. Genevieve 17914 2803 15.6% R 1 2803:1 56 100 100
Stoddard 29867 8421 28.2% R 13 648:1 77 96.8 100
Stone 31104 5756 18.5% R 6 959:1 71.7 100 100
Sullivan 6411 1529 23.8% R 0 1.9 36.6 100
Taney 54230 13078 24.1% R 1 13078:1 83.1 99.9 100
Texas 25642 6584 25.7% R 6 1097:1 58.5 95.6 100
Vernon 21001 5049 24.0% R 7 721:1 76.8 99 100
Warren 33253 6188 18.6% R 3 2063:1 93.5 100 100
Washington 25077 7202 28.7% R 14 514:1 65.9 95.6 100
Wayne 13452 4681 34.8% R 2 2341:1 74.1 100 100
Webster 36888 9281 25.2% R 9 1031:1 82.7 100 100
Worth 2073 431 20.8% R 0 0 8.1 100
Wright 18291 6926 37.9% R 3 2309:1 57 94.1 100
TOTAL: 6,063,589 1,187,627 19.6% 1,023 83.2 96.4 99.9
Demographics Dental

34
FFS Network Adequacy – Physician Specialty Services (Cardiology)
CountyTotal
PopulationEligibles % Medicaid
County Type
Urban
Basic
Rural
Providers Ratio
Distance
1 provider
within 25 miles
Distance
1 provider
within 50 miles
Distance
1 provider
within 100 miles
Adair 25602 4947 19.3% R 7 707:1 100 100 100
Andrew 17379 4822 27.7% R 0 98.7 100 100Atchison 5382 924 17.2% R 3 308:1 100 100 100
Audrain 25887 6299 24.3% R 2 3150:1 87.6 100 100Barry 35662 13341 37.4% R 0 7.3 100 100
Barton 12057 2869 23.8% R 0 64.8 100 100Bates 16584 3391 20.4% R 1 3391:1 100 100 100
Benton 18806 4790 25.5% R 2 2395:1 100 100 100
Bollinger 12394 3195 25.8% R 0 74.5 100 100Boone 172717 22941 13.3% B 46 499:1 100 100 100
Buchanan 89486 18459 20.6% B 22 839:1 99.9 100 100Butler 42972 13648 31.8% R 18 758:1 100 100 100
Caldwell 9034 1693 18.7% R 0 44.9 100 100Callaway 44750 7644 17.1% R 3 2548:1 100 100 100
Camden 44021 7510 17.1% R 4 1878:1 100 100 100Cape Girardeau 78043 14234 18.2% B 17 837:1 100 100 100
Carroll 9043 1865 20.6% R 3 622:1 100 100 100
Carter 6258 2185 34.9% R 0 56 100 100Cass 100889 15118 15.0% B 49 309:1 100 100 100
Cedar 13952 4299 30.8% R 0 93.5 100 100Chariton 7694 2018 26.2% R 0 90.3 100 100
Christian 82101 14800 18.0% B 0 98.4 100 100Clark 6917 1365 19.7% R 0 33.5 100 100Clay 233682 30763 13.2% B 48 641:1 100 100 100
Clinton 20299 2120 10.4% R 0 100 100 100
Cole 76557 12634 16.5% B 9 1404:1 100 100 100
Cooper 17585 3333 19.0% R 6 556:1 100 100 100
Crawford 24650 6103 24.8% R 0 95.9 100 100
Dade 7628 1881 24.7% R 0 14.4 100 100
Dallas 16389 3891 23.7% R 0 91.5 100 100
Daviess 8297 1725 20.8% R 0 27.9 100 100
DeKalb 12692 2922 23.0% R 0 17.5 100 100
Dent 15655 4321 27.6% R 0 4.5 100 100
Douglas 13546 3386 25.0% R 0 0 100 100
Dunklin 31344 12438 39.7% R 2 6219:1 87.6 100 100
Franklin 102084 19871 19.5% B 20 994:1 100 100 100
Gasconade 14866 3112 20.9% R 8 389:1 100 100 100
Gentry 6826 1515 22.2% R 0 0 100 100
Greene 285865 57947 20.3% U 34 1704:1 100 100 100
Grundy 10197 2279 22.3% R 2 1140:1 100 100 100
Harrison 8639 2178 25.2% R 0 6.8 99.2 100
Henry 22028 5609 25.5% R 2 2805:1 100 100 100
Hickory 9219 1917 20.8% R 0 89.4 100 100
Holt 4516 796 17.6% R 0 68.1 100 100
Howard 10159 2195 21.6% R 0 98.1 100 100
Howell 40173 12761 31.8% R 11 1160:1 100 100 100
Iron 10267 3399 33.1% R 1 3399:1 89.9 100 100
Jackson 683191 147751 21.6% U 223 663:1 100 100 100
Jasper 117543 24278 20.7% B 5 4856:1 100 100 100
Jefferson 222716 30761 13.8% B 20 1538:1 100 100 100
Johnson 54362 6748 12.4% R 37 182:1 100 100 100
Knox 4000 807 20.2% R 0 74.5 100 100
Laclede 35439 9941 28.1% R 1 9941:1 97.3 100 100
Lafayette 32688 6297 19.3% R 22 286:1 100 100 100
Lawrence 38023 5472 14.4% R 0 24.7 100 100
Lewis 10138 1745 17.2% R 0 5.9 100 100
Lincoln 54249 9810 18.1% R 7 1401:1 100 100 100
Linn 12311 2131 17.3% R 6 355:1 100 100 100
Livingston 15053 2945 19.6% R 1 2945:1 100 100 100
Demographics Cardiology

35
CountyTotal
PopulationEligibles % Medicaid
County Type
Urban
Basic
Rural
Providers Ratio
Distance
1 provider
within 25 miles
Distance
1 provider
within 50 miles
Distance
1 provider
within 100 miles
Macon 15479 3096 20.0% R 12 258:1 100 100 100
Madison 12368 3644 29.5% R 0 69.3 100 100
Maries 9013 1381 15.3% R 0 100 100 100
Marion 28920 7115 24.6% R 15 474:1 99.8 100 100
McDonald 22800 6626 29.1% R 0 82.5 100 100
Mercer 3719 722 19.4% R 0 64 100 100
Miller 25141 6281 25.0% R 1 6281:1 100 100 100
Mississippi 14232 4705 33.1% R 0 100 100 100
Moniteau 15856 2600 16.4% R 0 100 100 100
Monroe 8707 977 11.2% R 0 87.8 100 100
Montgomery 11841 2713 22.9% R 0 93.5 100 100
Morgan 20240 5158 25.5% R 2 2579:1 99.5 100 100
New Madrid 18272 5771 31.6% R 0 94.5 100 100
Newton 58598 17745 30.3% B 26 683:1 100 100 100
Nodaway 23081 2662 11.5% R 0 13.3 100 100
Oregon 10911 3634 33.3% R 0 9.7 100 100
Osage 13703 1413 10.3% R 0 97.9 100 100
Ozark 9492 2429 25.6% R 0 17.8 100 100
Pemiscot 17650 7173 40.6% R 3 2391:1 100 100 100
Perry 19202 3669 19.1% R 4 917:1 100 100 100
Pettis 42225 10827 25.6% R 3 3609:1 100 100 100
Phelps 44847 9505 21.2% R 7 1358:1 99.9 100 100
Pike 18541 3395 18.3% R 1 3395:1 100 100 100
Platte 94788 9061 9.6% B 13 697:1 100 100 100
Polk 31054 7867 25.3% R 8 983:1 100 100 100
Pulaski 53436 8076 15.1% R 3 2692:1 100 100 100
Putnam 4829 1082 22.4% R 5 216:1 100 100 100
Ralls 10255 2006 19.6% R 0 93 100 100
Randolph 25072 5833 23.3% R 8 729:1 100 100 100
Ray 22949 3522 15.3% R 2 1761:1 100 100 100
Reynolds 6565 1798 27.4% R 0 11.6 100 100
Ripley 13969 4979 35.6% R 0 20.6 100 100
Saline 23347 5057 21.7% R 0 16.6 100 100
Schuyler 4370 955 21.9% R 0 100 100 100
Scotland 4863 822 16.9% R 1 822:1 100 100 100
Scott 38903 12455 32.0% R 5 2491:1 100 100 100
Shannon 8329 2337 28.1% R 0 76.1 100 100
Shelby 6108 1543 25.3% R 0 89.6 100 100
St. Charles 379493 33082 8.7% U 63 525:1 100 100 100
St. Clair 9457 2123 22.4% R 0 95.9 100 100
St. Francois 65960 16584 25.1% B 23 721:1 100 100 100
St. Louis City 317419 100441 31.6% U 144 698:1 100 100 100
St. Louis Co. 1001876 156695 15.6% U 324 484:1 100 100 100
Ste. Genevieve 17914 2803 15.6% R 4 701:1 100 100 100
Stoddard 29867 8421 28.2% R 0 79.2 100 100
Stone 31104 5756 18.5% R 0 82.3 100 100
Sullivan 6411 1529 23.8% R 1 1529:1 100 100 100
Taney 54230 13078 24.1% R 20 654:1 99.5 100 100
Texas 25642 6584 25.7% R 0 16.3 100 100
Vernon 21001 5049 24.0% R 2 2525:1 99.2 100 100
Warren 33253 6188 18.6% R 0 100 100 100
Washington 25077 7202 28.7% R 1 7202:1 100 100 100
Wayne 13452 4681 34.8% R 0 41.3 100 100
Webster 36888 9281 25.2% R 0 66.3 100 100
Worth 2073 431 20.8% R 0 0 17.2 100
Wright 18291 6926 37.9% R 0 5.5 100 100
TOTAL: 6,063,589 1,187,627 19.6% 1,343 92.7 100.0 100.0
Demographics Cardiology

36
FFS Network Adequacy – Physician Specialty Services (Neurology)
CountyTotal
PopulationEligibles % Medicaid
County Type
Urban
Basic
Rural
Providers Ratio
Distance
1 provider
within 25 miles
Distance
1 provider
within 50 miles
Distance
1 provider
within 100 miles
Adair 25602 4947 19.3% R 11 450:1 100 100 100
Andrew 17379 4822 27.7% R 0 96.8 100 100Atchison 5382 924 17.2% R 0 0 0 100
Audrain 25887 6299 24.3% R 4 1575:1 88.9 100 100Barry 35662 13341 37.4% R 0 10.8 100 100
Barton 12057 2869 23.8% R 1 2869:1 100 100 100Bates 16584 3391 20.4% R 3 1130:1 100 100 100
Benton 18806 4790 25.5% R 1 4790:1 100 100 100
Bollinger 12394 3195 25.8% R 0 50.7 100 100Boone 172717 22941 13.3% B 46 499:1 100 100 100
Buchanan 89486 18459 20.6% B 4 4615:1 99.4 100 100Butler 42972 13648 31.8% R 1 13648:1 99.5 100 100
Caldwell 9034 1693 18.7% R 0 85.1 100 100Callaway 44750 7644 17.1% R 1 7644:1 100 100 100
Camden 44021 7510 17.1% R 4 1878:1 98.5 100 100Cape Girardeau 78043 14234 18.2% B 23 619:1 99.2 100 100
Carroll 9043 1865 20.6% R 1 1865:1 100 100 100
Carter 6258 2185 34.9% R 0 37.5 100 100Cass 100889 15118 15.0% B 9 1680:1 100 100 100
Cedar 13952 4299 30.8% R 2 2150:1 100 100 100Chariton 7694 2018 26.2% R 0 43.2 100 100
Christian 82101 14800 18.0% B 2 7400:1 100 100 100Clark 6917 1365 19.7% R 0 0 22.9 100Clay 233682 30763 13.2% B 16 1923:1 100 100 100
Clinton 20299 2120 10.4% R 0 100 100 100
Cole 76557 12634 16.5% B 6 2106:1 100 100 100
Cooper 17585 3333 19.0% R 0 81.8 100 100
Crawford 24650 6103 24.8% R 0 68.6 100 100
Dade 7628 1881 24.7% R 0 22.8 100 100
Dallas 16389 3891 23.7% R 0 68.2 100 100
Daviess 8297 1725 20.8% R 0 100 100 100
DeKalb 12692 2922 23.0% R 2 1461:1 100 100 100
Dent 15655 4321 27.6% R 0 7.8 100 100
Douglas 13546 3386 25.0% R 0 0 100 100
Dunklin 31344 12438 39.7% R 1 12438:1 85.3 100 100
Franklin 102084 19871 19.5% B 1 19871:1 81.7 100 100
Gasconade 14866 3112 20.9% R 0 42 100 100
Gentry 6826 1515 22.2% R 1 1515:1 100 100 100
Greene 285865 57947 20.3% U 34 1704:1 100 100 100
Grundy 10197 2279 22.3% R 0 94.3 100 100
Harrison 8639 2178 25.2% R 2 1089:1 99.6 100 100
Henry 22028 5609 25.5% R 5 1122:1 100 100 100
Hickory 9219 1917 20.8% R 0 89.4 100 100
Holt 4516 796 17.6% R 0 3.1 84.7 100
Howard 10159 2195 21.6% R 0 59.7 100 100
Howell 40173 12761 31.8% R 5 2552:1 100 100 100
Iron 10267 3399 33.1% R 0 61 100 100
Jackson 683191 147751 21.6% U 100 1478:1 100 100 100
Jasper 117543 24278 20.7% B 2 12139:1 100 100 100
Jefferson 222716 30761 13.8% B 4 7690:1 100 100 100
Johnson 54362 6748 12.4% R 7 964:1 100 100 100
Knox 4000 807 20.2% R 0 76.8 100 100
Laclede 35439 9941 28.1% R 0 63 100 100
Lafayette 32688 6297 19.3% R 6 1050:1 100 100 100
Lawrence 38023 5472 14.4% R 0 40.1 100 100
Lewis 10138 1745 17.2% R 0 2.8 100 100
Lincoln 54249 9810 18.1% R 1 9810:1 100 100 100
Linn 12311 2131 17.3% R 0 18.6 100 100
Livingston 15053 2945 19.6% R 1 2945:1 100 100 100
Demographics Neurology
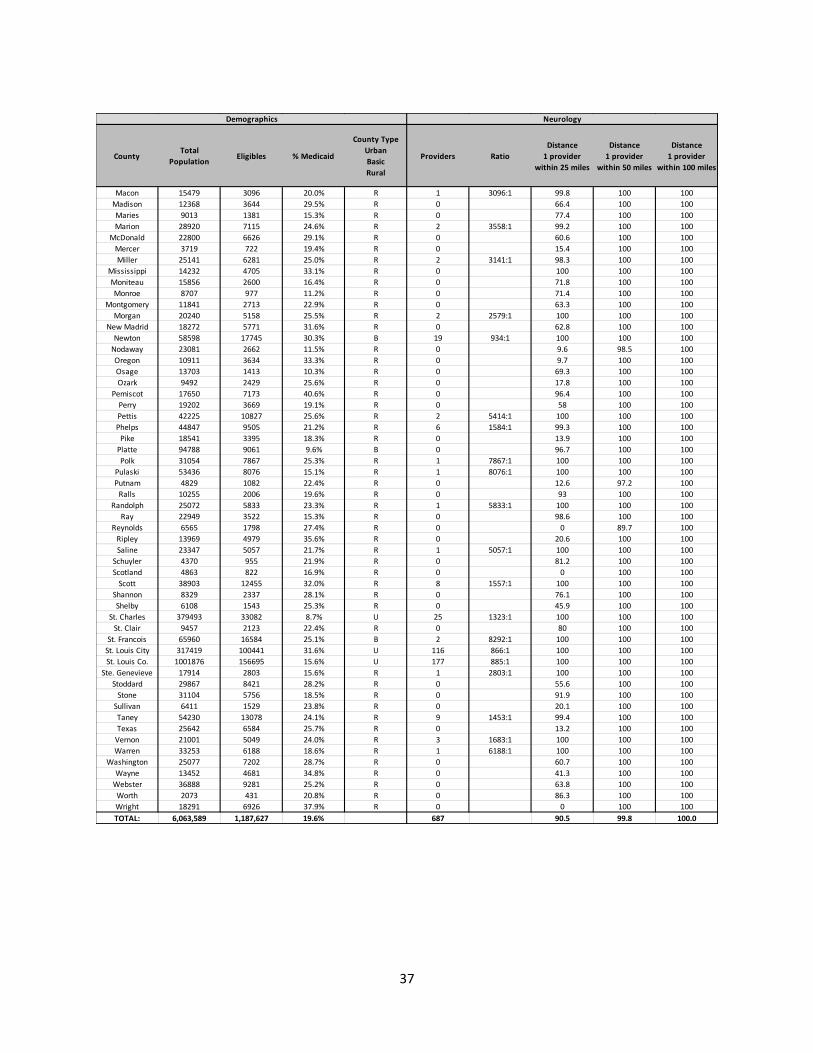
37
CountyTotal
PopulationEligibles % Medicaid
County Type
Urban
Basic
Rural
Providers Ratio
Distance
1 provider
within 25 miles
Distance
1 provider
within 50 miles
Distance
1 provider
within 100 miles
Macon 15479 3096 20.0% R 1 3096:1 99.8 100 100
Madison 12368 3644 29.5% R 0 66.4 100 100
Maries 9013 1381 15.3% R 0 77.4 100 100
Marion 28920 7115 24.6% R 2 3558:1 99.2 100 100
McDonald 22800 6626 29.1% R 0 60.6 100 100
Mercer 3719 722 19.4% R 0 15.4 100 100
Miller 25141 6281 25.0% R 2 3141:1 98.3 100 100
Mississippi 14232 4705 33.1% R 0 100 100 100
Moniteau 15856 2600 16.4% R 0 71.8 100 100
Monroe 8707 977 11.2% R 0 71.4 100 100
Montgomery 11841 2713 22.9% R 0 63.3 100 100
Morgan 20240 5158 25.5% R 2 2579:1 100 100 100
New Madrid 18272 5771 31.6% R 0 62.8 100 100
Newton 58598 17745 30.3% B 19 934:1 100 100 100
Nodaway 23081 2662 11.5% R 0 9.6 98.5 100
Oregon 10911 3634 33.3% R 0 9.7 100 100
Osage 13703 1413 10.3% R 0 69.3 100 100
Ozark 9492 2429 25.6% R 0 17.8 100 100
Pemiscot 17650 7173 40.6% R 0 96.4 100 100
Perry 19202 3669 19.1% R 0 58 100 100
Pettis 42225 10827 25.6% R 2 5414:1 100 100 100
Phelps 44847 9505 21.2% R 6 1584:1 99.3 100 100
Pike 18541 3395 18.3% R 0 13.9 100 100
Platte 94788 9061 9.6% B 0 96.7 100 100
Polk 31054 7867 25.3% R 1 7867:1 100 100 100
Pulaski 53436 8076 15.1% R 1 8076:1 100 100 100
Putnam 4829 1082 22.4% R 0 12.6 97.2 100
Ralls 10255 2006 19.6% R 0 93 100 100
Randolph 25072 5833 23.3% R 1 5833:1 100 100 100
Ray 22949 3522 15.3% R 0 98.6 100 100
Reynolds 6565 1798 27.4% R 0 0 89.7 100
Ripley 13969 4979 35.6% R 0 20.6 100 100
Saline 23347 5057 21.7% R 1 5057:1 100 100 100
Schuyler 4370 955 21.9% R 0 81.2 100 100
Scotland 4863 822 16.9% R 0 0 100 100
Scott 38903 12455 32.0% R 8 1557:1 100 100 100
Shannon 8329 2337 28.1% R 0 76.1 100 100
Shelby 6108 1543 25.3% R 0 45.9 100 100
St. Charles 379493 33082 8.7% U 25 1323:1 100 100 100
St. Clair 9457 2123 22.4% R 0 80 100 100
St. Francois 65960 16584 25.1% B 2 8292:1 100 100 100
St. Louis City 317419 100441 31.6% U 116 866:1 100 100 100
St. Louis Co. 1001876 156695 15.6% U 177 885:1 100 100 100
Ste. Genevieve 17914 2803 15.6% R 1 2803:1 100 100 100
Stoddard 29867 8421 28.2% R 0 55.6 100 100
Stone 31104 5756 18.5% R 0 91.9 100 100
Sullivan 6411 1529 23.8% R 0 20.1 100 100
Taney 54230 13078 24.1% R 9 1453:1 99.4 100 100
Texas 25642 6584 25.7% R 0 13.2 100 100
Vernon 21001 5049 24.0% R 3 1683:1 100 100 100
Warren 33253 6188 18.6% R 1 6188:1 100 100 100
Washington 25077 7202 28.7% R 0 60.7 100 100
Wayne 13452 4681 34.8% R 0 41.3 100 100
Webster 36888 9281 25.2% R 0 63.8 100 100
Worth 2073 431 20.8% R 0 86.3 100 100
Wright 18291 6926 37.9% R 0 0 100 100
TOTAL: 6,063,589 1,187,627 19.6% 687 90.5 99.8 100.0
Demographics Neurology

38
FFS Network Adequacy – Physician Specialty Services (Ophthalmology)
CountyTotal
PopulationEligibles % Medicaid
County Type
Urban
Basic
Rural
Providers Ratio
Distance
1 provider
within 25 miles
Distance
1 provider
within 50 miles
Distance
1 provider
within 100 miles
Adair 25602 4947 19.3% R 6 825:1 100 100 100
Andrew 17379 4822 27.7% R 0 100 100 100Atchison 5382 924 17.2% R 0 2.9 100 100
Audrain 25887 6299 24.3% R 3 2100:1 87.6 100 100Barry 35662 13341 37.4% R 1 13341:1 61.8 100 100
Barton 12057 2869 23.8% R 0 62.3 100 100Bates 16584 3391 20.4% R 1 3391:1 100 100 100
Benton 18806 4790 25.5% R 0 46.4 100 100
Bollinger 12394 3195 25.8% R 0 53.5 100 100Boone 172717 22941 13.3% B 43 534:1 100 100 100
Buchanan 89486 18459 20.6% B 7 2637:1 99.4 100 100Butler 42972 13648 31.8% R 2 6824:1 99.5 100 100
Caldwell 9034 1693 18.7% R 0 1.7 100 100Callaway 44750 7644 17.1% R 1 7644:1 100 100 100
Camden 44021 7510 17.1% R 4 1878:1 98.5 100 100Cape Girardeau 78043 14234 18.2% B 17 837:1 99.1 100 100
Carroll 9043 1865 20.6% R 0 14.6 100 100
Carter 6258 2185 34.9% R 0 56 100 100Cass 100889 15118 15.0% B 9 1680:1 100 100 100
Cedar 13952 4299 30.8% R 0 79.3 100 100Chariton 7694 2018 26.2% R 0 54 100 100
Christian 82101 14800 18.0% B 1 14800:1 100 100 100Clark 6917 1365 19.7% R 0 0 22.9 100Clay 233682 30763 13.2% B 8 3845:1 100 100 100
Clinton 20299 2120 10.4% R 0 86.8 100 100
Cole 76557 12634 16.5% B 7 1805:1 100 100 100
Cooper 17585 3333 19.0% R 0 79.3 100 100
Crawford 24650 6103 24.8% R 0 30.6 100 100
Dade 7628 1881 24.7% R 0 14.4 100 100
Dallas 16389 3891 23.7% R 0 78 100 100
Daviess 8297 1725 20.8% R 0 22.1 100 100
DeKalb 12692 2922 23.0% R 0 22.1 100 100
Dent 15655 4321 27.6% R 0 8 100 100
Douglas 13546 3386 25.0% R 0 0 100 100
Dunklin 31344 12438 39.7% R 2 6219:1 98.3 100 100
Franklin 102084 19871 19.5% B 5 3974:1 81.7 100 100
Gasconade 14866 3112 20.9% R 0 6.1 100 100
Gentry 6826 1515 22.2% R 1 1515:1 100 100 100
Greene 285865 57947 20.3% U 30 1932:1 100 100 100
Grundy 10197 2279 22.3% R 0 9.5 100 100
Harrison 8639 2178 25.2% R 1 2178:1 100 100 100
Henry 22028 5609 25.5% R 2 2805:1 100 100 100
Hickory 9219 1917 20.8% R 0 39.6 100 100
Holt 4516 796 17.6% R 0 31.9 100 100
Howard 10159 2195 21.6% R 0 20.2 100 100
Howell 40173 12761 31.8% R 4 3190:1 100 100 100
Iron 10267 3399 33.1% R 0 66.7 100 100
Jackson 683191 147751 21.6% U 67 2205:1 100 100 100
Jasper 117543 24278 20.7% B 3 8093:1 100 100 100
Jefferson 222716 30761 13.8% B 2 15381:1 100 100 100
Johnson 54362 6748 12.4% R 7 964:1 100 100 100
Knox 4000 807 20.2% R 0 74.5 100 100
Laclede 35439 9941 28.1% R 5 1988:1 99.1 100 100
Lafayette 32688 6297 19.3% R 1 6297:1 100 100 100
Lawrence 38023 5472 14.4% R 0 96.9 100 100
Lewis 10138 1745 17.2% R 0 3.3 100 100
Lincoln 54249 9810 18.1% R 4 2453:1 100 100 100
Linn 12311 2131 17.3% R 1 2131:1 99.8 100 100
Livingston 15053 2945 19.6% R 0 16.3 100 100
Demographics Ophthalmology

39
CountyTotal
PopulationEligibles % Medicaid
County Type
Urban
Basic
Rural
Providers Ratio
Distance
1 provider
within 25 miles
Distance
1 provider
within 50 miles
Distance
1 provider
within 100 miles
Macon 15479 3096 20.0% R 0 35.4 100 100
Madison 12368 3644 29.5% R 0 66.4 100 100
Maries 9013 1381 15.3% R 0 63.9 100 100
Marion 28920 7115 24.6% R 15 474:1 100 100 100
McDonald 22800 6626 29.1% R 0 12.2 100 100
Mercer 3719 722 19.4% R 0 15.4 100 100
Miller 25141 6281 25.0% R 0 96.3 100 100
Mississippi 14232 4705 33.1% R 0 100 100 100
Moniteau 15856 2600 16.4% R 0 67.6 100 100
Monroe 8707 977 11.2% R 0 29.7 100 100
Montgomery 11841 2713 22.9% R 0 40.7 100 100
Morgan 20240 5158 25.5% R 0 51.5 100 100
New Madrid 18272 5771 31.6% R 0 70.7 100 100
Newton 58598 17745 30.3% B 10 1775:1 97.3 100 100
Nodaway 23081 2662 11.5% R 1 2662:1 99.6 100 100
Oregon 10911 3634 33.3% R 0 9.7 100 100
Osage 13703 1413 10.3% R 0 69.3 100 100
Ozark 9492 2429 25.6% R 0 13.3 100 100
Pemiscot 17650 7173 40.6% R 0 96.4 100 100
Perry 19202 3669 19.1% R 0 5.6 100 100
Pettis 42225 10827 25.6% R 5 2165:1 100 100 100
Phelps 44847 9505 21.2% R 4 2376:1 99.4 100 100
Pike 18541 3395 18.3% R 0 10.5 100 100
Platte 94788 9061 9.6% B 12 755:1 99.7 100 100
Polk 31054 7867 25.3% R 1 7867:1 100 100 100
Pulaski 53436 8076 15.1% R 0 63.4 100 100
Putnam 4829 1082 22.4% R 0 12.6 100 100
Ralls 10255 2006 19.6% R 0 100 100 100
Randolph 25072 5833 23.3% R 0 4.8 100 100
Ray 22949 3522 15.3% R 0 88.5 100 100
Reynolds 6565 1798 27.4% R 0 0 88.6 100
Ripley 13969 4979 35.6% R 1 4979:1 100 100 100
Saline 23347 5057 21.7% R 0 10 100 100
Schuyler 4370 955 21.9% R 0 81.2 100 100
Scotland 4863 822 16.9% R 0 0 100 100
Scott 38903 12455 32.0% R 1 12455:1 100 100 100
Shannon 8329 2337 28.1% R 0 76.1 100 100
Shelby 6108 1543 25.3% R 0 7.9 100 100
St. Charles 379493 33082 8.7% U 21 1575:1 100 100 100
St. Clair 9457 2123 22.4% R 0 44.2 100 100
St. Francois 65960 16584 25.1% B 14 1185:1 100 100 100
St. Louis City 317419 100441 31.6% U 116 866:1 100 100 100
St. Louis Co. 1001876 156695 15.6% U 144 1088:1 100 100 100
Ste. Genevieve 17914 2803 15.6% R 0 46.8 100 100
Stoddard 29867 8421 28.2% R 1 8421:1 100 100 100
Stone 31104 5756 18.5% R 0 100 100 100
Sullivan 6411 1529 23.8% R 0 24.1 100 100
Taney 54230 13078 24.1% R 3 4359:1 99.1 100 100
Texas 25642 6584 25.7% R 0 13.2 100 100
Vernon 21001 5049 24.0% R 1 5049:1 99.2 100 100
Warren 33253 6188 18.6% R 0 98.8 100 100
Washington 25077 7202 28.7% R 0 40.6 100 100
Wayne 13452 4681 34.8% R 0 41.3 100 100
Webster 36888 9281 25.2% R 3 3094:1 98.1 100 100
Worth 2073 431 20.8% R 0 100 100 100
Wright 18291 6926 37.9% R 0 9.7 100 100
TOTAL: 6,063,589 1,187,627 19.6% 598 89.1 99.9 100.0
OphthalmologyDemographics

40
FFS Network Adequacy – Physician Specialty Services (Urology/Nephrology)
CountyTotal
PopulationEligibles % Medicaid
County Type
Urban
Basic
Rural
Providers Ratio
Distance
1 provider
within 25 miles
Distance
1 provider
within 50 miles
Distance
1 provider
within 100 miles
Adair 25602 4947 19.3% R 6 825:1 100 100 100
Andrew 17379 4822 27.7% R 0 100 100 100Atchison 5382 924 17.2% R 0 2.9 100 100
Audrain 25887 6299 24.3% R 2 3150:1 88.9 100 100Barry 35662 13341 37.4% R 1 13341:1 89.1 100 100
Barton 12057 2869 23.8% R 0 22.5 100 100Bates 16584 3391 20.4% R 0 92.2 100 100
Benton 18806 4790 25.5% R 0 63.2 100 100
Bollinger 12394 3195 25.8% R 0 77.3 100 100Boone 172717 22941 13.3% B 37 620:1 100 100 100
Buchanan 89486 18459 20.6% B 10 1846:1 99.6 100 100Butler 42972 13648 31.8% R 8 1706:1 100 100 100
Caldwell 9034 1693 18.7% R 2 847:1 100 100 100Callaway 44750 7644 17.1% R 0 99.2 100 100
Camden 44021 7510 17.1% R 9 834:1 98.5 100 100Cape Girardeau 78043 14234 18.2% B 10 1423:1 100 100 100
Carroll 9043 1865 20.6% R 3 622:1 100 100 100
Carter 6258 2185 34.9% R 0 56 100 100Cass 100889 15118 15.0% B 3 5039:1 100 100 100
Cedar 13952 4299 30.8% R 0 83.6 100 100Chariton 7694 2018 26.2% R 0 90.3 100 100
Christian 82101 14800 18.0% B 1 14800:1 99.5 100 100Clark 6917 1365 19.7% R 0 0 22.9 100Clay 233682 30763 13.2% B 18 1709:1 100 100 100
Clinton 20299 2120 10.4% R 0 100 100 100
Cole 76557 12634 16.5% B 9 1404:1 100 100 100
Cooper 17585 3333 19.0% R 3 1111:1 100 100 100
Crawford 24650 6103 24.8% R 0 49.6 100 100
Dade 7628 1881 24.7% R 0 27.5 100 100
Dallas 16389 3891 23.7% R 0 80.4 100 100
Daviess 8297 1725 20.8% R 0 100 100 100
DeKalb 12692 2922 23.0% R 3 974:1 100 100 100
Dent 15655 4321 27.6% R 0 4.6 100 100
Douglas 13546 3386 25.0% R 0 0 100 100
Dunklin 31344 12438 39.7% R 5 2488:1 98.9 100 100
Franklin 102084 19871 19.5% B 5 3974:1 97.3 100 100
Gasconade 14866 3112 20.9% R 1 3112:1 51.5 100 100
Gentry 6826 1515 22.2% R 0 77.9 100 100
Greene 285865 57947 20.3% U 37 1566:1 100 100 100
Grundy 10197 2279 22.3% R 3 760:1 100 100 100
Harrison 8639 2178 25.2% R 1 2178:1 99.5 100 100
Henry 22028 5609 25.5% R 4 1402:1 100 100 100
Hickory 9219 1917 20.8% R 0 56.1 100 100
Holt 4516 796 17.6% R 0 28.8 100 100
Howard 10159 2195 21.6% R 0 98.1 100 100
Howell 40173 12761 31.8% R 6 2127:1 93.4 100 100
Iron 10267 3399 33.1% R 2 1700:1 89.9 100 100
Jackson 683191 147751 21.6% U 122 1211:1 100 100 100
Jasper 117543 24278 20.7% B 26 934:1 100 100 100
Jefferson 222716 30761 13.8% B 20 1538:1 100 100 100
Johnson 54362 6748 12.4% R 9 750:1 100 100 100
Knox 4000 807 20.2% R 0 74.5 100 100
Laclede 35439 9941 28.1% R 1 9941:1 97.6 100 100
Lafayette 32688 6297 19.3% R 1 6297:1 100 100 100
Lawrence 38023 5472 14.4% R 0 100 100 100
Lewis 10138 1745 17.2% R 0 2.8 100 100
Lincoln 54249 9810 18.1% R 3 3270:1 100 100 100
Linn 12311 2131 17.3% R 1 2131:1 100 100 100
Livingston 15053 2945 19.6% R 4 736:1 100 100 100
Demographics Urology/Nephrology

41
CountyTotal
PopulationEligibles % Medicaid
County Type
Urban
Basic
Rural
Providers Ratio
Distance
1 provider
within 25 miles
Distance
1 provider
within 50 miles
Distance
1 provider
within 100 miles
Macon 15479 3096 20.0% R 1 3096:1 100 100 100
Madison 12368 3644 29.5% R 1 3644:1 100 100 100
Maries 9013 1381 15.3% R 0 77.4 100 100
Marion 28920 7115 24.6% R 1 7115:1 99.2 100 100
McDonald 22800 6626 29.1% R 0 56.2 100 100
Mercer 3719 722 19.4% R 0 79.4 100 100
Miller 25141 6281 25.0% R 4 1570:1 100 100 100
Mississippi 14232 4705 33.1% R 0 100 100 100
Moniteau 15856 2600 16.4% R 0 100 100 100
Monroe 8707 977 11.2% R 0 87.8 100 100
Montgomery 11841 2713 22.9% R 0 93.5 100 100
Morgan 20240 5158 25.5% R 4 1290:1 100 100 100
New Madrid 18272 5771 31.6% R 0 70.6 100 100
Newton 58598 17745 30.3% B 14 1268:1 100 100 100
Nodaway 23081 2662 11.5% R 3 887:1 99.6 100 100
Oregon 10911 3634 33.3% R 0 9.7 100 100
Osage 13703 1413 10.3% R 0 95.8 100 100
Ozark 9492 2429 25.6% R 0 27 100 100
Pemiscot 17650 7173 40.6% R 0 96.4 100 100
Perry 19202 3669 19.1% R 1 3669:1 100 100 100
Pettis 42225 10827 25.6% R 4 2707:1 100 100 100
Phelps 44847 9505 21.2% R 4 2376:1 99.7 100 100
Pike 18541 3395 18.3% R 1 3395:1 99.8 100 100
Platte 94788 9061 9.6% B 1 9061:1 99.3 100 100
Polk 31054 7867 25.3% R 3 2622:1 100 100 100
Pulaski 53436 8076 15.1% R 1 8076:1 100 100 100
Putnam 4829 1082 22.4% R 2 541:1 100 100 100
Ralls 10255 2006 19.6% R 0 93 100 100
Randolph 25072 5833 23.3% R 9 648:1 100 100 100
Ray 22949 3522 15.3% R 3 1174:1 100 100 100
Reynolds 6565 1798 27.4% R 0 11.6 100 100
Ripley 13969 4979 35.6% R 0 20.6 100 100
Saline 23347 5057 21.7% R 1 5057:1 86.9 100 100
Schuyler 4370 955 21.9% R 0 82.7 100 100
Scotland 4863 822 16.9% R 0 0 100 100
Scott 38903 12455 32.0% R 4 3114:1 100 100 100
Shannon 8329 2337 28.1% R 0 0 100 100
Shelby 6108 1543 25.3% R 0 45.9 100 100
St. Charles 379493 33082 8.7% U 25 1323:1 100 100 100
St. Clair 9457 2123 22.4% R 1 2123:1 54.3 100 100
St. Francois 65960 16584 25.1% B 13 1276:1 100 100 100
St. Louis City 317419 100441 31.6% U 124 810:1 100 100 100
St. Louis Co. 1001876 156695 15.6% U 224 700:1 100 100 100
Ste. Genevieve 17914 2803 15.6% R 4 701:1 100 100 100
Stoddard 29867 8421 28.2% R 1 8421:1 100 100 100
Stone 31104 5756 18.5% R 0 96.5 100 100
Sullivan 6411 1529 23.8% R 1 1529:1 100 100 100
Taney 54230 13078 24.1% R 4 3270:1 99.4 100 100
Texas 25642 6584 25.7% R 0 2.8 100 100
Vernon 21001 5049 24.0% R 3 1683:1 100 100 100
Warren 33253 6188 18.6% R 0 100 100 100
Washington 25077 7202 28.7% R 3 2401:1 98.8 100 100
Wayne 13452 4681 34.8% R 0 45.9 100 100
Webster 36888 9281 25.2% R 0 72.3 100 100
Worth 2073 431 20.8% R 0 20.9 100 100
Wright 18291 6926 37.9% R 0 5.5 100 100
TOTAL: 6,063,589 1,187,627 19.6% 93.9 99.9 100.0
Demographics Urology/Nephrology

42
FFS Network Adequacy – Physician Specialty Services (Radiology)
CountyTotal
PopulationEligibles % Medicaid
County Type
Urban
Basic
Rural
Providers Ratio
Distance
1 provider
within 25 miles
Distance
1 provider
within 50 miles
Distance
1 provider
within 100 miles
Adair 25602 4947 19.3% R 16 309:1 100 100 100
Andrew 17379 4822 27.7% R 0 98.9 100 100Atchison 5382 924 17.2% R 7 132:1 100 100 100
Audrain 25887 6299 24.3% R 8 787:1 88.9 100 100Barry 35662 13341 37.4% R 4 3335:1 100 100 100
Barton 12057 2869 23.8% R 5 574:1 100 100 100Bates 16584 3391 20.4% R 1 3391:1 100 100 100
Benton 18806 4790 25.5% R 0 48.3 100 100
Bollinger 12394 3195 25.8% R 0 88.4 100 100Boone 172717 22941 13.3% B 95 241:1 100 100 100
Buchanan 89486 18459 20.6% B 17 1086:1 99.6 100 100Butler 42972 13648 31.8% R 17 803:1 100 100 100
Caldwell 9034 1693 18.7% R 0 45.8 100 100Callaway 44750 7644 17.1% R 8 956:1 100 100 100
Camden 44021 7510 17.1% R 44 171:1 98.5 100 100Cape Girardeau 78043 14234 18.2% B 76 187:1 100 100 100
Carroll 9043 1865 20.6% R 1 1865:1 100 100 100
Carter 6258 2185 34.9% R 0 95.7 100 100Cass 100889 15118 15.0% B 24 630:1 100 100 100
Cedar 13952 4299 30.8% R 2 2150:1 100 100 100Chariton 7694 2018 26.2% R 0 45.9 100 100
Christian 82101 14800 18.0% B 4 3700:1 100 100 100Clark 6917 1365 19.7% R 0 0 22.9 100Clay 233682 30763 13.2% B 46 669:1 100 100 100
Clinton 20299 2120 10.4% R 0 100 100 100
Cole 76557 12634 16.5% B 33 383:1 100 100 100
Cooper 17585 3333 19.0% R 16 208:1 100 100 100
Crawford 24650 6103 24.8% R 0 53.2 100 100
Dade 7628 1881 24.7% R 0 27.2 100 100
Dallas 16389 3891 23.7% R 0 80.4 100 100
Daviess 8297 1725 20.8% R 0 42.5 100 100
DeKalb 12692 2922 23.0% R 0 26.8 100 100
Dent 15655 4321 27.6% R 1 4321:1 100 100 100
Douglas 13546 3386 25.0% R 0 21.6 100 100
Dunklin 31344 12438 39.7% R 4 3110:1 87.7 100 100
Franklin 102084 19871 19.5% B 7 2839:1 83.7 100 100
Gasconade 14866 3112 20.9% R 0 8 100 100
Gentry 6826 1515 22.2% R 1 1515:1 100 100 100
Greene 285865 57947 20.3% U 107 542:1 100 100 100
Grundy 10197 2279 22.3% R 2 1140:1 100 100 100
Harrison 8639 2178 25.2% R 0 76.1 100 100
Henry 22028 5609 25.5% R 18 312:1 100 100 100
Hickory 9219 1917 20.8% R 0 66.5 100 100
Holt 4516 796 17.6% R 0 71.2 100 100
Howard 10159 2195 21.6% R 0 98.1 100 100
Howell 40173 12761 31.8% R 49 260:1 100 100 100
Iron 10267 3399 33.1% R 0 92.9 100 100
Jackson 683191 147751 21.6% U 344 430:1 100 100 100
Jasper 117543 24278 20.7% B 8 3035:1 100 100 100
Jefferson 222716 30761 13.8% B 13 2366:1 100 100 100
Johnson 54362 6748 12.4% R 0 52.4 100 100
Knox 4000 807 20.2% R 0 74.5 100 100
Laclede 35439 9941 28.1% R 7 1420:1 97.1 100 100
Lafayette 32688 6297 19.3% R 22 286:1 100 100 100
Lawrence 38023 5472 14.4% R 0 100 100 100
Lewis 10138 1745 17.2% R 0 5.5 100 100
Lincoln 54249 9810 18.1% R 15 654:1 100 100 100
Linn 12311 2131 17.3% R 0 30 100 100
Livingston 15053 2945 19.6% R 2 1473:1 100 100 100
Demographics Radiology

43
CountyTotal
PopulationEligibles % Medicaid
County Type
Urban
Basic
Rural
Providers Ratio
Distance
1 provider
within 25 miles
Distance
1 provider
within 50 miles
Distance
1 provider
within 100 miles
Macon 15479 3096 20.0% R 7 442:1 99.7 100 100
Madison 12368 3644 29.5% R 1 3644:1 100 100 100
Maries 9013 1381 15.3% R 0 77.4 100 100
Marion 28920 7115 24.6% R 51 140:1 99.8 100 100
McDonald 22800 6626 29.1% R 0 60.9 100 100
Mercer 3719 722 19.4% R 0 64 100 100
Miller 25141 6281 25.0% R 0 96.6 100 100
Mississippi 14232 4705 33.1% R 1 4705:1 100 100 100
Moniteau 15856 2600 16.4% R 0 98.6 100 100
Monroe 8707 977 11.2% R 0 87.8 100 100
Montgomery 11841 2713 22.9% R 0 42.4 100 100
Morgan 20240 5158 25.5% R 0 50.5 100 100
New Madrid 18272 5771 31.6% R 0 94.5 100 100
Newton 58598 17745 30.3% B 44 403:1 100 100 100
Nodaway 23081 2662 11.5% R 0 22.9 100 100
Oregon 10911 3634 33.3% R 0 9.7 100 100
Osage 13703 1413 10.3% R 0 69.3 100 100
Ozark 9492 2429 25.6% R 0 17.8 100 100
Pemiscot 17650 7173 40.6% R 1 7173:1 100 100 100
Perry 19202 3669 19.1% R 1 3669:1 100 100 100
Pettis 42225 10827 25.6% R 12 902:1 100 100 100
Phelps 44847 9505 21.2% R 40 238:1 100 100 100
Pike 18541 3395 18.3% R 1 3395:1 99.8 100 100
Platte 94788 9061 9.6% B 15 604:1 99.7 100 100
Polk 31054 7867 25.3% R 9 874:1 100 100 100
Pulaski 53436 8076 15.1% R 0 57.1 100 100
Putnam 4829 1082 22.4% R 1 1082:1 100 100 100
Ralls 10255 2006 19.6% R 0 93 100 100
Randolph 25072 5833 23.3% R 11 530:1 100 100 100
Ray 22949 3522 15.3% R 1 3522:1 100 100 100
Reynolds 6565 1798 27.4% R 20 90:1 100 100 100
Ripley 13969 4979 35.6% R 0 23.3 100 100
Saline 23347 5057 21.7% R 6 843:1 100 100 100
Schuyler 4370 955 21.9% R 0 82.7 100 100
Scotland 4863 822 16.9% R 0 0 100 100
Scott 38903 12455 32.0% R 30 415:1 100 100 100
Shannon 8329 2337 28.1% R 0 76.1 100 100
Shelby 6108 1543 25.3% R 0 78.4 100 100
St. Charles 379493 33082 8.7% U 241 137:1 100 100 100
St. Clair 9457 2123 22.4% R 7 303:1 100 100 100
St. Francois 65960 16584 25.1% B 7 2369:1 100 100 100
St. Louis City 317419 100441 31.6% U 296 339:1 100 100 100
St. Louis Co. 1001876 156695 15.6% U 606 259:1 100 100 100
Ste. Genevieve 17914 2803 15.6% R 2 1402:1 100 100 100
Stoddard 29867 8421 28.2% R 0 64.6 100 100
Stone 31104 5756 18.5% R 0 100 100 100
Sullivan 6411 1529 23.8% R 1 1529:1 100 100 100
Taney 54230 13078 24.1% R 15 872:1 99.6 100 100
Texas 25642 6584 25.7% R 15 439:1 98.6 100 100
Vernon 21001 5049 24.0% R 4 1262:1 100 100 100
Warren 33253 6188 18.6% R 0 98.8 100 100
Washington 25077 7202 28.7% R 0 65.6 100 100
Wayne 13452 4681 34.8% R 0 94.9 100 100
Webster 36888 9281 25.2% R 0 67.3 100 100
Worth 2073 431 20.8% R 0 86.3 100 100
Wright 18291 6926 37.9% R 0 19.5 100 100
TOTAL: 6,063,589 1,187,627 19.6% 2,470 93.8 99.9 100.0
Demographics Radiology

44
FFS Network Adequacy – Behavioral Health Services (LCSW - LMSW)
CountyTotal
PopulationEligibles % Medicaid
County Type
Urban
Basic
Rural
Providers Ratio
Distance
1 provider
within 10 miles
Distance
1 provider
within 20 miles
Distance
1 provider
within 40 miles
Adair 25602 4947 19.3% R 8 618:1 90.7 100 100
Andrew 17379 4822 27.7% R 7 689:1 94.7 100 100
Atchison 5382 924 17.2% R 1 924:1 80.2 100 100
Audrain 25887 6299 24.3% R 11 573:1 82.4 100 100
Barry 35662 13341 37.4% R 10 1334:1 81 100 100
Barton 12057 2869 23.8% R 10 287:1 81.9 95.9 100
Bates 16584 3391 20.4% R 2 1696:1 50.5 100 100
Benton 18806 4790 25.5% R 7 684:1 76.5 100 100
Bollinger 12394 3195 25.8% R 3 1065:1 67.2 94.6 100
Boone 172717 22941 13.3% B 74 310:1 100 100 100
Buchanan 89486 18459 20.6% B 42 440:1 97.5 99.5 100
Butler 42972 13648 31.8% R 18 758:1 90.2 99.5 100
Caldwell 9034 1693 18.7% R 0 4.3 65.4 100
Callaway 44750 7644 17.1% R 17 450:1 96.1 100 100
Camden 44021 7510 17.1% R 3 2503:1 81.8 100 100
Cape Girardeau 78043 14234 18.2% B 28 508:1 92.5 100 100
Carroll 9043 1865 20.6% R 1 1865:1 2.8 91.2 100
Carter 6258 2185 34.9% R 3 728:1 48 100 100
Cass 100889 15118 15.0% B 15 1008:1 81.6 97.8 100
Cedar 13952 4299 30.8% R 5 860:1 91.2 100 100
Chariton 7694 2018 26.2% R 3 673:1 51.5 100 100
Christian 82101 14800 18.0% B 5 2960:1 91.4 100 100
Clark 6917 1365 19.7% R 0 0 22.9 100
Clay 233682 30763 13.2% B 68 452:1 99.7 100 100
Clinton 20299 2120 10.4% R 2 1060:1 58 100 100
Cole 76557 12634 16.5% B 32 395:1 91.8 100 100
Cooper 17585 3333 19.0% R 5 667:1 71.1 100 100
Crawford 24650 6103 24.8% R 4 1526:1 87 100 100
Dade 7628 1881 24.7% R 0 25.5 100 100
Dallas 16389 3891 23.7% R 4 973:1 87.1 100 100
Daviess 8297 1725 20.8% R 0 0 58.1 100
DeKalb 12692 2922 23.0% R 4 731:1 73.6 99.8 100
Dent 15655 4321 27.6% R 0 5.6 28.5 100
Douglas 13546 3386 25.0% R 4 847:1 86.7 100 100
Dunklin 31344 12438 39.7% R 15 829:1 63.1 94.9 100
Franklin 102084 19871 19.5% B 14 1419:1 83.8 100 100
Gasconade 14866 3112 20.9% R 1 3112:1 32.8 97.6 100
Gentry 6826 1515 22.2% R 3 505:1 72.8 100 100
Greene 285865 57947 20.3% U 132 439:1 98.1 100 100
Grundy 10197 2279 22.3% R 7 326:1 85.4 100 100
Harrison 8639 2178 25.2% R 4 545:1 75.4 98 100
Henry 22028 5609 25.5% R 22 255:1 80.8 99.5 100
Hickory 9219 1917 20.8% R 2 959:1 81.5 100 100
Holt 4516 796 17.6% R 5 159:1 78.1 100 100
Howard 10159 2195 21.6% R 2 1098:1 92.8 100 100
Howell 40173 12761 31.8% R 15 851:1 91.5 100 100
Iron 10267 3399 33.1% R 6 567:1 87.7 100 100
Jackson 683191 147751 21.6% U 371 398:1 99.3 100 100
Jasper 117543 24278 20.7% B 35 694:1 98.9 100 100
Jefferson 222716 30761 13.8% B 40 769:1 97.1 100 100
Johnson 54362 6748 12.4% R 6 1125:1 62.8 100 100
Knox 4000 807 20.2% R 1 807:1 74.5 95.2 100
Laclede 35439 9941 28.1% R 5 1988:1 82.8 99.1 100
Lafayette 32688 6297 19.3% R 12 525:1 73.5 100 100
Lawrence 38023 5472 14.4% R 4 1368:1 94.5 100 100
Lewis 10138 1745 17.2% R 1 1745:1 61.9 98.7 100
Lincoln 54249 9810 18.1% R 5 1962:1 84.1 99.7 100
Linn 12311 2131 17.3% R 1 2131:1 48.4 96.7 100
Livingston 15053 2945 19.6% R 0 0 19.2 100
Demographics LCSW - LMSW
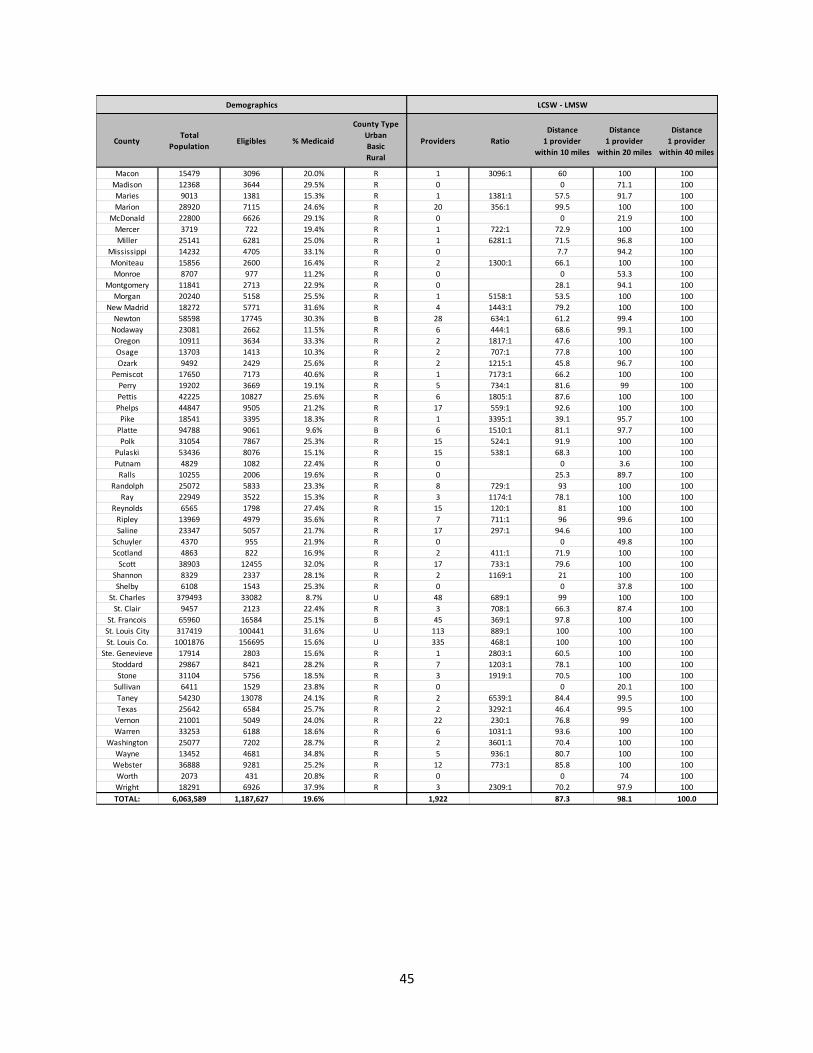
45
CountyTotal
PopulationEligibles % Medicaid
County Type
Urban
Basic
Rural
Providers Ratio
Distance
1 provider
within 10 miles
Distance
1 provider
within 20 miles
Distance
1 provider
within 40 miles
Macon 15479 3096 20.0% R 1 3096:1 60 100 100
Madison 12368 3644 29.5% R 0 0 71.1 100
Maries 9013 1381 15.3% R 1 1381:1 57.5 91.7 100
Marion 28920 7115 24.6% R 20 356:1 99.5 100 100
McDonald 22800 6626 29.1% R 0 0 21.9 100
Mercer 3719 722 19.4% R 1 722:1 72.9 100 100
Miller 25141 6281 25.0% R 1 6281:1 71.5 96.8 100
Mississippi 14232 4705 33.1% R 0 7.7 94.2 100
Moniteau 15856 2600 16.4% R 2 1300:1 66.1 100 100
Monroe 8707 977 11.2% R 0 0 53.3 100
Montgomery 11841 2713 22.9% R 0 28.1 94.1 100
Morgan 20240 5158 25.5% R 1 5158:1 53.5 100 100
New Madrid 18272 5771 31.6% R 4 1443:1 79.2 100 100
Newton 58598 17745 30.3% B 28 634:1 61.2 99.4 100
Nodaway 23081 2662 11.5% R 6 444:1 68.6 99.1 100
Oregon 10911 3634 33.3% R 2 1817:1 47.6 100 100
Osage 13703 1413 10.3% R 2 707:1 77.8 100 100
Ozark 9492 2429 25.6% R 2 1215:1 45.8 96.7 100
Pemiscot 17650 7173 40.6% R 1 7173:1 66.2 100 100
Perry 19202 3669 19.1% R 5 734:1 81.6 99 100
Pettis 42225 10827 25.6% R 6 1805:1 87.6 100 100
Phelps 44847 9505 21.2% R 17 559:1 92.6 100 100
Pike 18541 3395 18.3% R 1 3395:1 39.1 95.7 100
Platte 94788 9061 9.6% B 6 1510:1 81.1 97.7 100
Polk 31054 7867 25.3% R 15 524:1 91.9 100 100
Pulaski 53436 8076 15.1% R 15 538:1 68.3 100 100
Putnam 4829 1082 22.4% R 0 0 3.6 100
Ralls 10255 2006 19.6% R 0 25.3 89.7 100
Randolph 25072 5833 23.3% R 8 729:1 93 100 100
Ray 22949 3522 15.3% R 3 1174:1 78.1 100 100
Reynolds 6565 1798 27.4% R 15 120:1 81 100 100
Ripley 13969 4979 35.6% R 7 711:1 96 99.6 100
Saline 23347 5057 21.7% R 17 297:1 94.6 100 100
Schuyler 4370 955 21.9% R 0 0 49.8 100
Scotland 4863 822 16.9% R 2 411:1 71.9 100 100
Scott 38903 12455 32.0% R 17 733:1 79.6 100 100
Shannon 8329 2337 28.1% R 2 1169:1 21 100 100
Shelby 6108 1543 25.3% R 0 0 37.8 100
St. Charles 379493 33082 8.7% U 48 689:1 99 100 100
St. Clair 9457 2123 22.4% R 3 708:1 66.3 87.4 100
St. Francois 65960 16584 25.1% B 45 369:1 97.8 100 100
St. Louis City 317419 100441 31.6% U 113 889:1 100 100 100
St. Louis Co. 1001876 156695 15.6% U 335 468:1 100 100 100
Ste. Genevieve 17914 2803 15.6% R 1 2803:1 60.5 100 100
Stoddard 29867 8421 28.2% R 7 1203:1 78.1 100 100
Stone 31104 5756 18.5% R 3 1919:1 70.5 100 100
Sullivan 6411 1529 23.8% R 0 0 20.1 100
Taney 54230 13078 24.1% R 2 6539:1 84.4 99.5 100
Texas 25642 6584 25.7% R 2 3292:1 46.4 99.5 100
Vernon 21001 5049 24.0% R 22 230:1 76.8 99 100
Warren 33253 6188 18.6% R 6 1031:1 93.6 100 100
Washington 25077 7202 28.7% R 2 3601:1 70.4 100 100
Wayne 13452 4681 34.8% R 5 936:1 80.7 100 100
Webster 36888 9281 25.2% R 12 773:1 85.8 100 100
Worth 2073 431 20.8% R 0 0 74 100
Wright 18291 6926 37.9% R 3 2309:1 70.2 97.9 100
TOTAL: 6,063,589 1,187,627 19.6% 1,922 87.3 98.1 100.0
Demographics LCSW - LMSW

46
FFS Network Adequacy – Behavioral Health Services (Psychology)
CountyTotal
PopulationEligibles % Medicaid
County Type
Urban
Basic
Rural
Providers Ratio
Distance
1 provider
within 10 miles
Distance
1 provider
within 20 miles
Distance
1 provider
within 40 miles
Adair 25602 4947 19.3% R 2 2474:1 89.5 100 100
Andrew 17379 4822 27.7% R 0 82.1 97.6 100
Atchison 5382 924 17.2% R 0 0 0 93.3
Audrain 25887 6299 24.3% R 4 1575:1 57.6 84.2 100
Barry 35662 13341 37.4% R 15 889:1 79.6 98.1 100
Barton 12057 2869 23.8% R 3 956:1 68.1 95.9 100
Bates 16584 3391 20.4% R 4 848:1 50.5 100 100
Benton 18806 4790 25.5% R 3 1597:1 64.1 100 100
Bollinger 12394 3195 25.8% R 0 2.6 83.8 100
Boone 172717 22941 13.3% B 51 450:1 90.2 100 100
Buchanan 89486 18459 20.6% B 14 1319:1 96.5 99.4 100
Butler 42972 13648 31.8% R 4 3412:1 84.7 98.9 100
Caldwell 9034 1693 18.7% R 0 0 7.1 100
Callaway 44750 7644 17.1% R 1 7644:1 73.2 99.8 100
Camden 44021 7510 17.1% R 10 751:1 81.2 99.2 100
Cape Girardeau 78043 14234 18.2% B 11 1294:1 92.7 100 100
Carroll 9043 1865 20.6% R 0 0 2.8 100
Carter 6258 2185 34.9% R 0 0 85.8 100
Cass 100889 15118 15.0% B 10 1512:1 81.1 97.8 100
Cedar 13952 4299 30.8% R 4 1075:1 91 100 100
Chariton 7694 2018 26.2% R 0 0 0 90.7
Christian 82101 14800 18.0% B 15 987:1 92.4 99.9 100
Clark 6917 1365 19.7% R 0 0 0 0
Clay 233682 30763 13.2% B 21 1465:1 98.2 100 100
Clinton 20299 2120 10.4% R 0 10.6 89.9 100
Cole 76557 12634 16.5% B 14 902:1 89 98.7 100
Cooper 17585 3333 19.0% R 1 3333:1 62.1 97.9 100
Crawford 24650 6103 24.8% R 0 3 64.8 100
Dade 7628 1881 24.7% R 4 470:1 84.4 100 100
Dallas 16389 3891 23.7% R 0 0 76.5 100
Daviess 8297 1725 20.8% R 0 3 31.5 100
DeKalb 12692 2922 23.0% R 0 0 6.4 100
Dent 15655 4321 27.6% R 2 2161:1 82.6 95.7 100
Douglas 13546 3386 25.0% R 0 0 26.3 100
Dunklin 31344 12438 39.7% R 0 0 0 37.9
Franklin 102084 19871 19.5% B 6 3312:1 49.3 83.1 100
Gasconade 14866 3112 20.9% R 0 0 16.2 100
Gentry 6826 1515 22.2% R 1 1515:1 45.4 80.3 100
Greene 285865 57947 20.3% U 209 277:1 98.1 100 100
Grundy 10197 2279 22.3% R 1 2279:1 85.4 99.5 100
Harrison 8639 2178 25.2% R 0 8.8 75.5 100
Henry 22028 5609 25.5% R 37 152:1 79.1 99.5 100
Hickory 9219 1917 20.8% R 0 0 49.3 100
Holt 4516 796 17.6% R 0 0 12.6 100
Howard 10159 2195 21.6% R 0 20 63.8 100
Howell 40173 12761 31.8% R 1 12761:1 49.5 81.1 100
Iron 10267 3399 33.1% R 0 0 33 100
Jackson 683191 147751 21.6% U 163 906:1 99.5 100 100
Jasper 117543 24278 20.7% B 31 783:1 92.5 100 100
Jefferson 222716 30761 13.8% B 5 6152:1 82.1 100 100
Johnson 54362 6748 12.4% R 3 2249:1 61.5 100 100
Knox 4000 807 20.2% R 0 0 15.9 100
Laclede 35439 9941 28.1% R 6 1657:1 88.1 98.2 100
Lafayette 32688 6297 19.3% R 2 3149:1 36.3 87.9 100
Lawrence 38023 5472 14.4% R 1 5472:1 89.4 100 100
Lewis 10138 1745 17.2% R 0 0 0 93.1
Lincoln 54249 9810 18.1% R 4 2453:1 66.8 90.9 100
Linn 12311 2131 17.3% R 0 0 14.8 100
Livingston 15053 2945 19.6% R 2 1473:1 80 100 100
Demographics Psychology

47
CountyTotal
PopulationEligibles % Medicaid
County Type
Urban
Basic
Rural
Providers Ratio
Distance
1 provider
within 10 miles
Distance
1 provider
within 20 miles
Distance
1 provider
within 40 miles
Macon 15479 3096 20.0% R 0 0 18.5 96.2
Madison 12368 3644 29.5% R 0 0 23.2 100
Maries 9013 1381 15.3% R 0 2.5 28 100
Marion 28920 7115 24.6% R 3 2372:1 94.1 97.1 100
McDonald 22800 6626 29.1% R 1 6626:1 59.2 97.8 100
Mercer 3719 722 19.4% R 0 0 0 100
Miller 25141 6281 25.0% R 3 2094:1 43.3 96.4 100
Mississippi 14232 4705 33.1% R 0 5.5 88.4 100
Moniteau 15856 2600 16.4% R 0 0 92.5 100
Monroe 8707 977 11.2% R 0 0 13.3 95
Montgomery 11841 2713 22.9% R 0 0 22.5 100
Morgan 20240 5158 25.5% R 3 1719:1 66 100 100
New Madrid 18272 5771 31.6% R 0 2.3 15.7 89.2
Newton 58598 17745 30.3% B 34 522:1 86.9 100 100
Nodaway 23081 2662 11.5% R 2 1331:1 63.1 97.3 100
Oregon 10911 3634 33.3% R 0 0 3.9 95.3
Osage 13703 1413 10.3% R 0 0 21.6 100
Ozark 9492 2429 25.6% R 0 0 6.6 100
Pemiscot 17650 7173 40.6% R 0 0 0 0
Perry 19202 3669 19.1% R 0 0 4.4 100
Pettis 42225 10827 25.6% R 5 2165:1 88.1 100 100
Phelps 44847 9505 21.2% R 5 1901:1 93.1 100 100
Pike 18541 3395 18.3% R 0 0 2.6 100
Platte 94788 9061 9.6% B 9 1007:1 90 99.3 100
Polk 31054 7867 25.3% R 18 437:1 73.1 100 100
Pulaski 53436 8076 15.1% R 5 1615:1 73.9 100 100
Putnam 4829 1082 22.4% R 0 0 3.6 100
Ralls 10255 2006 19.6% R 0 13.6 58.4 100
Randolph 25072 5833 23.3% R 0 0 1.4 95.3
Ray 22949 3522 15.3% R 0 1.4 81.3 100
Reynolds 6565 1798 27.4% R 0 0 36 100
Ripley 13969 4979 35.6% R 0 10.5 27.1 99.6
Saline 23347 5057 21.7% R 2 2529:1 68.9 98.6 100
Schuyler 4370 955 21.9% R 0 0 32.6 100
Scotland 4863 822 16.9% R 0 0 0 87.7
Scott 38903 12455 32.0% R 2 6228:1 75 100 100
Shannon 8329 2337 28.1% R 0 0 0 67.5
Shelby 6108 1543 25.3% R 0 0 0 72.5
St. Charles 379493 33082 8.7% U 23 1438:1 97.9 100 100
St. Clair 9457 2123 22.4% R 0 0 58.3 100
St. Francois 65960 16584 25.1% B 1 16584:1 50.4 100 100
St. Louis City 317419 100441 31.6% U 103 975:1 100 100 100
St. Louis Co. 1001876 156695 15.6% U 111 1412:1 99.8 100 100
Ste. Genevieve 17914 2803 15.6% R 0 4.4 35.9 100
Stoddard 29867 8421 28.2% R 1 8421:1 11.4 39.7 100
Stone 31104 5756 18.5% R 2 2878:1 72.1 98.3 100
Sullivan 6411 1529 23.8% R 1 1529:1 56.2 95.6 100
Taney 54230 13078 24.1% R 17 769:1 77.8 97.4 100
Texas 25642 6584 25.7% R 0 16.1 44.8 100
Vernon 21001 5049 24.0% R 21 240:1 80.3 99 100
Warren 33253 6188 18.6% R 1 6188:1 93.5 100 100
Washington 25077 7202 28.7% R 1 7202:1 20.5 95.1 100
Wayne 13452 4681 34.8% R 1 4681:1 56.8 96.3 100
Webster 36888 9281 25.2% R 7 1326:1 92.3 100 100
Worth 2073 431 20.8% R 0 3.7 74 100
Wright 18291 6926 37.9% R 10 693:1 83.6 100 100
TOTAL: 6,063,589 1,187,627 19.6% 1,057 77.2 89.8 98.4
Demographics Psychology

48
FFS Network Adequacy – Behavioral Health Services (LPC - PLPC)
CountyTotal
PopulationEligibles % Medicaid
County Type
Urban
Basic
Rural
Providers Ratio
Distance
1 provider
within 10 miles
Distance
1 provider
within 20 miles
Distance
1 provider
within 40 miles
Adair 25602 4947 19.3% R 13 381:1 91.7 100 100
Andrew 17379 4822 27.7% R 2 2411:1 86.8 99.4 100
Atchison 5382 924 17.2% R 3 308:1 89.9 100 100
Audrain 25887 6299 24.3% R 11 573:1 62 98.8 100
Barry 35662 13341 37.4% R 27 494:1 80.1 99.5 100
Barton 12057 2869 23.8% R 6 478:1 68.1 98.6 100
Bates 16584 3391 20.4% R 5 678:1 70.4 100 100
Benton 18806 4790 25.5% R 4 1198:1 61.9 100 100
Bollinger 12394 3195 25.8% R 0 5.4 31.4 100
Boone 172717 22941 13.3% B 69 332:1 92.6 100 100
Buchanan 89486 18459 20.6% B 32 577:1 98.4 99.6 100
Butler 42972 13648 31.8% R 15 910:1 90.4 99.5 100
Caldwell 9034 1693 18.7% R 0 0 14.7 100
Callaway 44750 7644 17.1% R 10 764:1 92.2 100 100
Camden 44021 7510 17.1% R 22 341:1 90.4 100 100
Cape Girardeau 78043 14234 18.2% B 74 192:1 90.9 100 100
Carroll 9043 1865 20.6% R 1 1865:1 68 93.5 100
Carter 6258 2185 34.9% R 3 728:1 85.1 100 100
Cass 100889 15118 15.0% B 20 756:1 92.4 100 100
Cedar 13952 4299 30.8% R 6 717:1 96.9 100 100
Chariton 7694 2018 26.2% R 1 2018:1 31.9 58.6 100
Christian 82101 14800 18.0% B 37 400:1 95.8 100 100
Clark 6917 1365 19.7% R 3 455:1 79.3 100 100
Clay 233682 30763 13.2% B 57 540:1 98.4 100 100
Clinton 20299 2120 10.4% R 1 2120:1 33.7 97.6 100
Cole 76557 12634 16.5% B 48 263:1 95.2 100 100
Cooper 17585 3333 19.0% R 5 667:1 64.8 99.2 100
Crawford 24650 6103 24.8% R 7 872:1 83.4 100 100
Dade 7628 1881 24.7% R 1 1881:1 71.3 100 100
Dallas 16389 3891 23.7% R 3 1297:1 80.1 100 100
Daviess 8297 1725 20.8% R 0 0 33.6 100
DeKalb 12692 2922 23.0% R 0 0 6.4 100
Dent 15655 4321 27.6% R 5 864:1 90.6 100 100
Douglas 13546 3386 25.0% R 2 1693:1 73.7 100 100
Dunklin 31344 12438 39.7% R 8 1555:1 70.7 98.9 100
Franklin 102084 19871 19.5% B 18 1104:1 82.4 100 100
Gasconade 14866 3112 20.9% R 2 1556:1 76.8 100 100
Gentry 6826 1515 22.2% R 1 1515:1 46.5 80.3 100
Greene 285865 57947 20.3% U 289 201:1 98.2 100 100
Grundy 10197 2279 22.3% R 6 380:1 85.4 100 100
Harrison 8639 2178 25.2% R 1 2178:1 67.4 96.3 100
Henry 22028 5609 25.5% R 36 156:1 79.1 99.5 100
Hickory 9219 1917 20.8% R 2 959:1 76.6 100 100
Holt 4516 796 17.6% R 3 265:1 53.6 100 100
Howard 10159 2195 21.6% R 5 439:1 72.8 100 100
Howell 40173 12761 31.8% R 16 798:1 81.9 100 100
Iron 10267 3399 33.1% R 1 3399:1 60 100 100
Jackson 683191 147751 21.6% U 264 560:1 99.8 100 100
Jasper 117543 24278 20.7% B 51 476:1 94.4 100 100
Jefferson 222716 30761 13.8% B 42 732:1 98.5 100 100
Johnson 54362 6748 12.4% R 18 375:1 77.3 100 100
Knox 4000 807 20.2% R 1 807:1 82.4 95.9 100
Laclede 35439 9941 28.1% R 18 552:1 91.5 99.7 100
Lafayette 32688 6297 19.3% R 18 350:1 66.2 99 100
Lawrence 38023 5472 14.4% R 7 782:1 93.5 100 100
Lewis 10138 1745 17.2% R 4 436:1 73.6 100 100
Lincoln 54249 9810 18.1% R 13 755:1 85.4 100 100
Linn 12311 2131 17.3% R 0 0 8.3 100
Livingston 15053 2945 19.6% R 4 736:1 80 100 100
Demographics LPC - PLPC
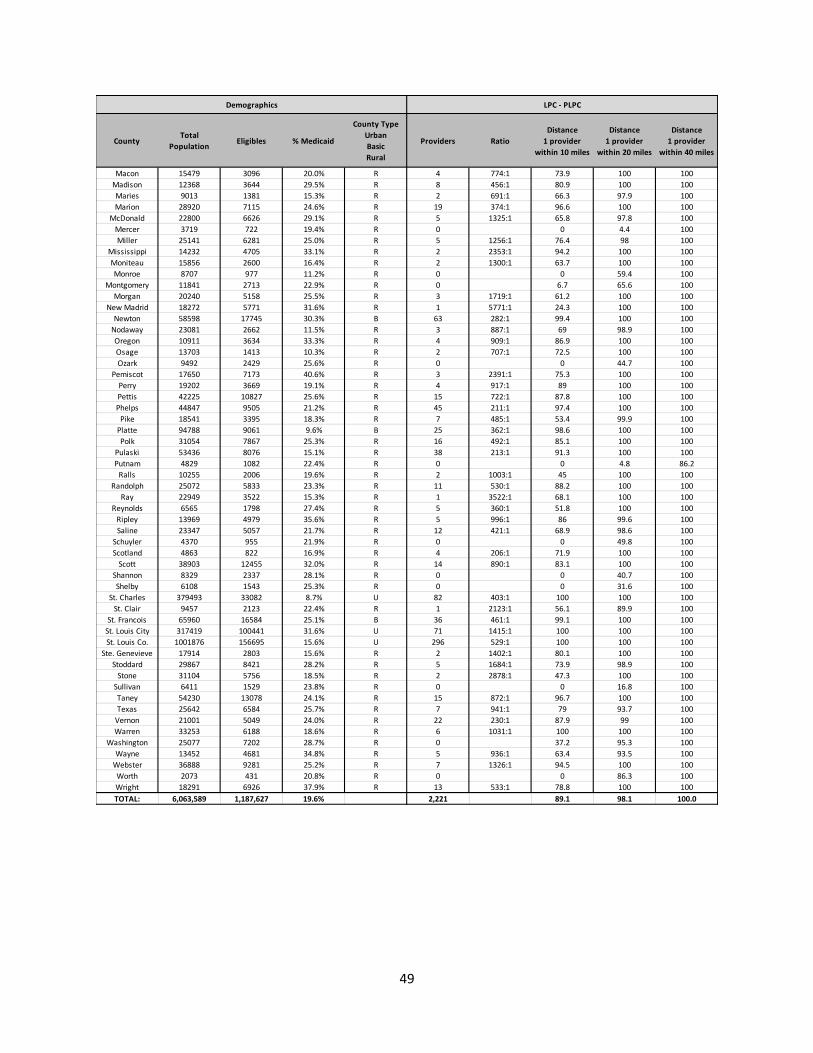
49
CountyTotal
PopulationEligibles % Medicaid
County Type
Urban
Basic
Rural
Providers Ratio
Distance
1 provider
within 10 miles
Distance
1 provider
within 20 miles
Distance
1 provider
within 40 miles
Macon 15479 3096 20.0% R 4 774:1 73.9 100 100
Madison 12368 3644 29.5% R 8 456:1 80.9 100 100
Maries 9013 1381 15.3% R 2 691:1 66.3 97.9 100
Marion 28920 7115 24.6% R 19 374:1 96.6 100 100
McDonald 22800 6626 29.1% R 5 1325:1 65.8 97.8 100
Mercer 3719 722 19.4% R 0 0 4.4 100
Miller 25141 6281 25.0% R 5 1256:1 76.4 98 100
Mississippi 14232 4705 33.1% R 2 2353:1 94.2 100 100
Moniteau 15856 2600 16.4% R 2 1300:1 63.7 100 100
Monroe 8707 977 11.2% R 0 0 59.4 100
Montgomery 11841 2713 22.9% R 0 6.7 65.6 100
Morgan 20240 5158 25.5% R 3 1719:1 61.2 100 100
New Madrid 18272 5771 31.6% R 1 5771:1 24.3 100 100
Newton 58598 17745 30.3% B 63 282:1 99.4 100 100
Nodaway 23081 2662 11.5% R 3 887:1 69 98.9 100
Oregon 10911 3634 33.3% R 4 909:1 86.9 100 100
Osage 13703 1413 10.3% R 2 707:1 72.5 100 100
Ozark 9492 2429 25.6% R 0 0 44.7 100
Pemiscot 17650 7173 40.6% R 3 2391:1 75.3 100 100
Perry 19202 3669 19.1% R 4 917:1 89 100 100
Pettis 42225 10827 25.6% R 15 722:1 87.8 100 100
Phelps 44847 9505 21.2% R 45 211:1 97.4 100 100
Pike 18541 3395 18.3% R 7 485:1 53.4 99.9 100
Platte 94788 9061 9.6% B 25 362:1 98.6 100 100
Polk 31054 7867 25.3% R 16 492:1 85.1 100 100
Pulaski 53436 8076 15.1% R 38 213:1 91.3 100 100
Putnam 4829 1082 22.4% R 0 0 4.8 86.2
Ralls 10255 2006 19.6% R 2 1003:1 45 100 100
Randolph 25072 5833 23.3% R 11 530:1 88.2 100 100
Ray 22949 3522 15.3% R 1 3522:1 68.1 100 100
Reynolds 6565 1798 27.4% R 5 360:1 51.8 100 100
Ripley 13969 4979 35.6% R 5 996:1 86 99.6 100
Saline 23347 5057 21.7% R 12 421:1 68.9 98.6 100
Schuyler 4370 955 21.9% R 0 0 49.8 100
Scotland 4863 822 16.9% R 4 206:1 71.9 100 100
Scott 38903 12455 32.0% R 14 890:1 83.1 100 100
Shannon 8329 2337 28.1% R 0 0 40.7 100
Shelby 6108 1543 25.3% R 0 0 31.6 100
St. Charles 379493 33082 8.7% U 82 403:1 100 100 100
St. Clair 9457 2123 22.4% R 1 2123:1 56.1 89.9 100
St. Francois 65960 16584 25.1% B 36 461:1 99.1 100 100
St. Louis City 317419 100441 31.6% U 71 1415:1 100 100 100
St. Louis Co. 1001876 156695 15.6% U 296 529:1 100 100 100
Ste. Genevieve 17914 2803 15.6% R 2 1402:1 80.1 100 100
Stoddard 29867 8421 28.2% R 5 1684:1 73.9 98.9 100
Stone 31104 5756 18.5% R 2 2878:1 47.3 100 100
Sullivan 6411 1529 23.8% R 0 0 16.8 100
Taney 54230 13078 24.1% R 15 872:1 96.7 100 100
Texas 25642 6584 25.7% R 7 941:1 79 93.7 100
Vernon 21001 5049 24.0% R 22 230:1 87.9 99 100
Warren 33253 6188 18.6% R 6 1031:1 100 100 100
Washington 25077 7202 28.7% R 0 37.2 95.3 100
Wayne 13452 4681 34.8% R 5 936:1 63.4 93.5 100
Webster 36888 9281 25.2% R 7 1326:1 94.5 100 100
Worth 2073 431 20.8% R 0 0 86.3 100
Wright 18291 6926 37.9% R 13 533:1 78.8 100 100
TOTAL: 6,063,589 1,187,627 19.6% 2,221 89.1 98.1 100.0
Demographics LPC - PLPC

50
FFS Network Adequacy – Behavioral Health Services (Psychiatry)
CountyTotal
PopulationEligibles % Medicaid
County Type
Urban
Basic
Rural
Physicians Ratio
Distance
1 provider
within 22 miles
Distance
1 provider
within 45 miles
Distance
1 provider
within 90 miles
Adair 25602 4947 19.3% R 5 989:1 100 100 100
Andrew 17379 4822 27.7% R 0 99.4 100 100
Atchison 5382 924 17.2% R 1 924:1 95.5 100 100
Audrain 25887 6299 24.3% R 11 573:1 86.4 100 100
Barry 35662 13341 37.4% R 3 4447:1 98.6 100 100
Barton 12057 2869 23.8% R 0 8.4 100 100
Bates 16584 3391 20.4% R 2 1696:1 100 100 100
Benton 18806 4790 25.5% R 1 4790:1 98.9 100 100
Bollinger 12394 3195 25.8% R 0 85.2 100 100
Boone 172717 22941 13.3% B 70 328:1 100 100 100
Buchanan 89486 18459 20.6% B 26 710:1 99.4 100 100
Butler 42972 13648 31.8% R 25 546:1 100 100 100
Caldwell 9034 1693 18.7% R 0 14.6 100 100
Callaway 44750 7644 17.1% R 13 588:1 100 100 100
Camden 44021 7510 17.1% R 2 3755:1 100 100 100
Cape Girardeau 78043 14234 18.2% B 22 647:1 100 100 100
Carroll 9043 1865 20.6% R 1 1865:1 96.8 100 100
Carter 6258 2185 34.9% R 1 2185:1 100 100 100
Cass 100889 15118 15.0% B 11 1374:1 98.7 100 100
Cedar 13952 4299 30.8% R 2 2150:1 100 100 100
Chariton 7694 2018 26.2% R 0 30.7 100 100
Christian 82101 14800 18.0% B 2 7400:1 99.1 100 100
Clark 6917 1365 19.7% R 0 0 34.4 100
Clay 233682 30763 13.2% B 40 769:1 100 100 100
Clinton 20299 2120 10.4% R 0 78.4 100 100
Cole 76557 12634 16.5% B 33 383:1 99.8 100 100
Cooper 17585 3333 19.0% R 1 3333:1 100 100 100
Crawford 24650 6103 24.8% R 1 6103:1 97.1 100 100
Dade 7628 1881 24.7% R 0 74.5 100 100
Dallas 16389 3891 23.7% R 1 3891:1 100 100 100
Daviess 8297 1725 20.8% R 0 37.7 100 100
DeKalb 12692 2922 23.0% R 0 11 100 100
Dent 15655 4321 27.6% R 1 4321:1 100 100 100
Douglas 13546 3386 25.0% R 0 0 100 100
Dunklin 31344 12438 39.7% R 6 2073:1 93.7 100 100
Franklin 102084 19871 19.5% B 21 946:1 99.6 100 100
Gasconade 14866 3112 20.9% R 0 21.6 100 100
Gentry 6826 1515 22.2% R 1 1515:1 82.8 100 100
Greene 285865 57947 20.3% U 60 966:1 100 100 100
Grundy 10197 2279 22.3% R 2 1140:1 100 100 100
Harrison 8639 2178 25.2% R 2 1089:1 97.2 100 100
Henry 22028 5609 25.5% R 39 144:1 100 100 100
Hickory 9219 1917 20.8% R 0 61.2 100 100
Holt 4516 796 17.6% R 0 63.7 100 100
Howard 10159 2195 21.6% R 1 2195:1 100 100 100
Howell 40173 12761 31.8% R 16 798:1 99.4 100 100
Iron 10267 3399 33.1% R 2 1700:1 95.2 100 100
Jackson 683191 147751 21.6% U 183 807:1 100 100 100
Jasper 117543 24278 20.7% B 4 6070:1 99.9 100 100
Jefferson 222716 30761 13.8% B 21 1465:1 100 100 100
Johnson 54362 6748 12.4% R 2 3374:1 100 100 100
Knox 4000 807 20.2% R 0 74.5 100 100
Laclede 35439 9941 28.1% R 2 4971:1 98.6 100 100
Lafayette 32688 6297 19.3% R 9 700:1 100 100 100
Lawrence 38023 5472 14.4% R 1 5472:1 100 100 100
Lewis 10138 1745 17.2% R 0 14.7 100 100
Lincoln 54249 9810 18.1% R 3 3270:1 100 100 100
Linn 12311 2131 17.3% R 0 9.1 100 100
Livingston 15053 2945 19.6% R 2 1473:1 100 100 100
Demographics Psychiatry

51
CountyTotal
PopulationEligibles % Medicaid
County Type
Urban
Basic
Rural
Physicians Ratio
Distance
1 provider
within 22 miles
Distance
1 provider
within 45 miles
Distance
1 provider
within 90 miles
Macon 15479 3096 20.0% R 1 3096:1 99 100 100
Madison 12368 3644 29.5% R 1 3644:1 100 100 100
Maries 9013 1381 15.3% R 0 33.4 100 100
Marion 28920 7115 24.6% R 9 791:1 100 100 100
McDonald 22800 6626 29.1% R 0 12.8 100 100
Mercer 3719 722 19.4% R 0 40 100 100
Miller 25141 6281 25.0% R 0 92 100 100
Mississippi 14232 4705 33.1% R 0 94.2 100 100
Moniteau 15856 2600 16.4% R 0 97.6 100 100
Monroe 8707 977 11.2% R 0 68.8 100 100
Montgomery 11841 2713 22.9% R 0 26.2 100 100
Morgan 20240 5158 25.5% R 2 2579:1 100 100 100
New Madrid 18272 5771 31.6% R 0 91.5 100 100
Newton 58598 17745 30.3% B 26 683:1 97.2 100 100
Nodaway 23081 2662 11.5% R 5 532:1 98.5 100 100
Oregon 10911 3634 33.3% R 0 7.7 100 100
Osage 13703 1413 10.3% R 0 42.3 100 100
Ozark 9492 2429 25.6% R 0 13.3 100 100
Pemiscot 17650 7173 40.6% R 3 2391:1 100 100 100
Perry 19202 3669 19.1% R 2 1835:1 99.8 100 100
Pettis 42225 10827 25.6% R 4 2707:1 100 100 100
Phelps 44847 9505 21.2% R 16 594:1 99.7 100 100
Pike 18541 3395 18.3% R 0 5.8 100 100
Platte 94788 9061 9.6% B 8 1133:1 99.7 100 100
Polk 31054 7867 25.3% R 11 715:1 100 100 100
Pulaski 53436 8076 15.1% R 5 1615:1 100 100 100
Putnam 4829 1082 22.4% R 1 1082:1 100 100 100
Ralls 10255 2006 19.6% R 0 89.5 100 100
Randolph 25072 5833 23.3% R 1 5833:1 100 100 100
Ray 22949 3522 15.3% R 0 85 100 100
Reynolds 6565 1798 27.4% R 2 899:1 100 100 100
Ripley 13969 4979 35.6% R 1 4979:1 100 100 100
Saline 23347 5057 21.7% R 5 1011:1 100 100 100
Schuyler 4370 955 21.9% R 0 32.6 100 100
Scotland 4863 822 16.9% R 0 0 100 100
Scott 38903 12455 32.0% R 12 1038:1 98.3 100 100
Shannon 8329 2337 28.1% R 1 2337:1 100 100 100
Shelby 6108 1543 25.3% R 0 31.3 100 100
St. Charles 379493 33082 8.7% U 62 534:1 100 100 100
St. Clair 9457 2123 22.4% R 2 1062:1 100 100 100
St. Francois 65960 16584 25.1% B 25 663:1 100 100 100
St. Louis City 317419 100441 31.6% U 171 587:1 100 100 100
St. Louis Co. 1001876 156695 15.6% U 226 693:1 100 100 100
Ste. Genevieve 17914 2803 15.6% R 2 1402:1 100 100 100
Stoddard 29867 8421 28.2% R 1 8421:1 94.3 100 100
Stone 31104 5756 18.5% R 0 93.4 100 100
Sullivan 6411 1529 23.8% R 0 43.7 100 100
Taney 54230 13078 24.1% R 7 1868:1 98.7 100 100
Texas 25642 6584 25.7% R 0 18.4 100 100
Vernon 21001 5049 24.0% R 21 240:1 100 100 100
Warren 33253 6188 18.6% R 0 92.8 100 100
Washington 25077 7202 28.7% R 3 2401:1 100 100 100
Wayne 13452 4681 34.8% R 2 2341:1 100 100 100
Webster 36888 9281 25.2% R 0 52.6 100 100
Worth 2073 431 20.8% R 0 86.3 100 100
Wright 18291 6926 37.9% R 0 4.9 99.8 100
TOTAL: 6,063,589 1,187,627 19.6% 94.2 99.9 100.0
Demographics Psychiatry

52
FFS Network Adequacy – Behavioral Health Services (CMHC)
CountyTotal
PopulationEligibles % Medicaid
County Type
Urban
Basic
Rural
Facilities Ratio
Distance
1 provider
within 10 miles
Distance
1 provider
within 20 miles
Distance
1 provider
within 40 miles
Adair 25602 4947 19.3% R 2 2474:1 87.3 100 100
Andrew 17379 4822 27.7% R 0 61.4 94.5 100
Atchison 5382 924 17.2% R 0 0 0 40.7
Audrain 25887 6299 24.3% R 1 6299:1 57 84.2 100
Barry 35662 13341 37.4% R 1 13341:1 30.5 68.5 98.6
Barton 12057 2869 23.8% R 0 0 0 78.4
Bates 16584 3391 20.4% R 0 0 0 82.2
Benton 18806 4790 25.5% R 0 0 1.9 94.4
Bollinger 12394 3195 25.8% R 0 0 0 94.6
Boone 172717 22941 13.3% B 0 0.1 6 100
Buchanan 89486 18459 20.6% B 1 18459:1 94.6 99.1 100
Butler 42972 13648 31.8% B 1 13648:1 74.8 98 100
Caldwell 9034 1693 18.7% R 0 0 0 53.6
Callaway 44750 7644 17.1% R 0 22.1 42.1 100
Camden 44021 7510 17.1% R 0 0 0 0.7
Cape Girardeau 78043 14234 18.2% B 2 7117:1 70.7 94.4 100
Carroll 9043 1865 20.6% R 0 0 0 0
Carter 6258 2185 34.9% R 0 0 18.5 65.9
Cass 100889 15118 15.0% B 0 0.3 69.9 100
Cedar 13952 4299 30.8% R 0 0 0 14
Chariton 7694 2018 26.2% R 0 0 3.8 89.2
Christian 82101 14800 18.0% B 0 39.8 88.4 100
Clark 6917 1365 19.7% R 0 0 0 0
Clay 233682 30763 13.2% B 1 30763:1 82.1 90.9 100
Clinton 20299 2120 10.4% R 0 0 15.9 100
Cole 76557 12634 16.5% B 1 12634:1 81 96.7 100
Cooper 17585 3333 19.0% R 0 0 0 12.4
Crawford 24650 6103 24.8% R 0 0 5.5 99.4
Dade 7628 1881 24.7% R 0 0 0 97.6
Dallas 16389 3891 23.7% R 0 0 0 67.8
Daviess 8297 1725 20.8% R 0 0 15.1 100
DeKalb 12692 2922 23.0% R 0 0 3 100
Dent 15655 4321 27.6% R 0 0 0.3 96.8
Douglas 13546 3386 25.0% R 0 0 0 8.1
Dunklin 31344 12438 39.7% R 0 0 0 32.2
Franklin 102084 19871 19.5% B 0 0.5 15 93.3
Gasconade 14866 3112 20.9% R 0 0 0 90
Gentry 6826 1515 22.2% R 0 0 0 30.7
Greene 285865 57947 20.3% U 3 19316:1 84.6 98.3 100
Grundy 10197 2279 22.3% R 1 2279:1 85.4 100 100
Harrison 8639 2178 25.2% R 0 0 5.5 91.6
Henry 22028 5609 25.5% R 2 2805:1 59.8 83.2 100
Hickory 9219 1917 20.8% R 0 0 0 8.8
Holt 4516 796 17.6% R 0 0 0 100
Howard 10159 2195 21.6% R 0 0 22.2 97
Howell 40173 12761 31.8% R 1 12761:1 49.6 77.3 100
Iron 10267 3399 33.1% R 0 0 0 4.1
Jackson 683191 147751 21.6% U 8 18469:1 94.1 100 100
Jasper 117543 24278 20.7% B 0 51.7 89.2 100
Jefferson 222716 30761 13.8% B 1 30761:1 37.8 99.2 100
Johnson 54362 6748 12.4% R 0 0 7.7 100
Knox 4000 807 20.2% R 0 0 15.9 100
Laclede 35439 9941 28.1% R 0 0 0 2.9
Lafayette 32688 6297 19.3% R 0 0 11.5 85.7
Lawrence 38023 5472 14.4% R 0 28.5 80.6 100
Lewis 10138 1745 17.2% R 0 0 0 84.2
Lincoln 54249 9810 18.1% R 0 0.9 60.6 100
Linn 12311 2131 17.3% R 0 0 0 36.5
Livingston 15053 2945 19.6% R 0 0 16 100
Demographics CMHC

53
CountyTotal
PopulationEligibles % Medicaid
County Type
Urban
Basic
Rural
Facilities Ratio
Distance
1 provider
within 10 miles
Distance
1 provider
within 20 miles
Distance
1 provider
within 40 miles
Macon 15479 3096 20.0% R 0 4.3 78.6 100
Madison 12368 3644 29.5% R 0 0 0 5.3
Maries 9013 1381 15.3% R 0 2.5 11.8 100
Marion 28920 7115 24.6% R 2 3558:1 83 95.6 100
McDonald 22800 6626 29.1% R 0 0 1.3 89.3
Mercer 3719 722 19.4% R 0 0 0 100
Miller 25141 6281 25.0% R 0 0 0 66
Mississippi 14232 4705 33.1% R 0 4.4 88.4 100
Moniteau 15856 2600 16.4% R 0 0 11.5 100
Monroe 8707 977 11.2% R 1 977:1 61 100 100
Montgomery 11841 2713 22.9% R 0 0 1.9 99.6
Morgan 20240 5158 25.5% R 0 0 0 10.9
New Madrid 18272 5771 31.6% R 0 6.3 15.7 93.7
Newton 58598 17745 30.3% B 1 17745:1 45.2 78.6 100
Nodaway 23081 2662 11.5% R 0 0 0 26.2
Oregon 10911 3634 33.3% R 0 0 3.9 95.3
Osage 13703 1413 10.3% R 0 0 19.5 100
Ozark 9492 2429 25.6% R 0 0 6.6 71.9
Pemiscot 17650 7173 40.6% R 0 0 0 0
Perry 19202 3669 19.1% R 0 0 0.4 35.2
Pettis 42225 10827 25.6% R 0 0 0 15.4
Phelps 44847 9505 21.2% R 1 9505:1 73.3 96.4 100
Pike 18541 3395 18.3% R 0 0 4.2 98.3
Platte 94788 9061 9.6% B 0 69.6 90.8 100
Polk 31054 7867 25.3% R 0 0 11.8 83.7
Pulaski 53436 8076 15.1% R 0 0 7.3 88.9
Putnam 4829 1082 22.4% R 0 0 3.6 76.2
Ralls 10255 2006 19.6% R 1 2006:1 26.9 89 100
Randolph 25072 5833 23.3% R 1 5833:1 85.7 100 100
Ray 22949 3522 15.3% R 0 0 0.8 96.8
Reynolds 6565 1798 27.4% R 0 0 0 0
Ripley 13969 4979 35.6% R 0 0 10.5 96
Saline 23347 5057 21.7% R 0 0 0 1.6
Schuyler 4370 955 21.9% R 0 0 32.6 100
Scotland 4863 822 16.9% R 0 0 0 87.7
Scott 38903 12455 32.0% R 1 12455:1 70.9 98.3 100
Shannon 8329 2337 28.1% R 0 0 0 38.4
Shelby 6108 1543 25.3% R 1 1543:1 24.4 85.9 100
St. Charles 379493 33082 8.7% U 3 11027:1 97.5 100 100
St. Clair 9457 2123 22.4% R 0 0 15.9 100
St. Francois 65960 16584 25.1% B 0 0 6.8 98.4
St. Louis City 317419 100441 31.6% U 5 20088:1 100 100 100
St. Louis Co. 1001876 156695 15.6% U 5 31339:1 95.5 100 100
Ste. Genevieve 17914 2803 15.6% R 0 0 8.7 86.3
Stoddard 29867 8421 28.2% R 0 0 9.7 100
Stone 31104 5756 18.5% R 0 0 2.9 74.8
Sullivan 6411 1529 23.8% R 0 0 13 100
Taney 54230 13078 24.1% R 0 0 0 83.9
Texas 25642 6584 25.7% R 0 0 0 58.2
Vernon 21001 5049 24.0% R 0 0 0 3.6
Warren 33253 6188 18.6% R 0 0 69.2 100
Washington 25077 7202 28.7% R 0 0 4.3 90.7
Wayne 13452 4681 34.8% R 0 8.6 27.9 100
Webster 36888 9281 25.2% R 0 5.2 25.8 97.4
Worth 2073 431 20.8% R 0 0 0 0
Wright 18291 6926 37.9% R 0 0 0 18.2
TOTAL: 6,063,589 1,187,627 19.6% 48 54.6 67.5 90.1
Demographics CMHC

54
FFS Network Adequacy – OB/GYN Providers
CountyTotal
PopulationEligibles % Medicaid
County Type
Urban
Basic
Rural
Physicians Ratio
Distance
1 provider
within 15 miles
Distance
1 provider
within 30 miles
Distance
1 provider
within 60 miles
Adair 25602 4947 19.3% R 4 1237:1 99.9 100 100
Andrew 17379 4822 27.7% R 3 1607:1 98.7 100 100
Atchison 5382 924 17.2% R 1 924:1 86.6 100 100
Audrain 25887 6299 24.3% R 2 3150:1 66.7 100 100
Barry 35662 13341 37.4% R 2 6671:1 89.9 100 100
Barton 12057 2869 23.8% R 6 478:1 89.3 100 100
Bates 16584 3391 20.4% R 1 3391:1 91.4 100 100
Benton 18806 4790 25.5% R 2 2395:1 85.2 100 100
Bollinger 12394 3195 25.8% R 0 14.8 100 100
Boone 172717 22941 13.3% B 53 433:1 98.9 100 100
Buchanan 89486 18459 20.6% B 23 803:1 99 100 100
Butler 42972 13648 31.8% R 7 1950:1 96.1 100 100
Caldwell 9034 1693 18.7% R 0 40 100 100
Callaway 44750 7644 17.1% R 1 7644:1 96.5 100 100
Camden 44021 7510 17.1% R 6 1252:1 88.9 100 100
Cape Girardeau 78043 14234 18.2% B 20 712:1 92.8 100 100
Carroll 9043 1865 20.6% R 4 466:1 95.3 100 100
Carter 6258 2185 34.9% R 1 2185:1 50.2 100 100
Cass 100889 15118 15.0% B 11 1374:1 92.8 100 100
Cedar 13952 4299 30.8% R 5 860:1 98 100 100
Chariton 7694 2018 26.2% R 2 1009:1 81.7 100 100
Christian 82101 14800 18.0% B 2 7400:1 98.3 100 100
Clark 6917 1365 19.7% R 0 0 76.1 100
Clay 233682 30763 13.2% B 43 715:1 97.2 100 100
Clinton 20299 2120 10.4% R 0 22.8 100 100
Cole 76557 12634 16.5% B 24 526:1 98.6 100 100
Cooper 17585 3333 19.0% R 0 11.4 100 100
Crawford 24650 6103 24.8% R 0 34.2 100 100
Dade 7628 1881 24.7% R 2 941:1 100 100 100
Dallas 16389 3891 23.7% R 1 3891:1 84.1 100 100
Daviess 8297 1725 20.8% R 0 14.1 100 100
DeKalb 12692 2922 23.0% R 3 974:1 84.2 100 100
Dent 15655 4321 27.6% R 0 6.2 92.8 100
Douglas 13546 3386 25.0% R 0 0 91.1 100
Dunklin 31344 12438 39.7% R 3 4146:1 53.9 100 100
Franklin 102084 19871 19.5% B 9 2208:1 69.3 100 100
Gasconade 14866 3112 20.9% R 0 0.8 77.7 100
Gentry 6826 1515 22.2% R 1 1515:1 74.7 100 100
Greene 285865 57947 20.3% U 84 690:1 96.7 100 100
Grundy 10197 2279 22.3% R 9 253:1 99.1 100 100
Harrison 8639 2178 25.2% R 1 2178:1 81.9 100 100
Henry 22028 5609 25.5% R 5 1122:1 75 100 100
Hickory 9219 1917 20.8% R 0 0 100 100
Holt 4516 796 17.6% R 0 24.9 100 100
Howard 10159 2195 21.6% R 0 17.8 100 100
Howell 40173 12761 31.8% R 9 1418:1 66.8 100 100
Iron 10267 3399 33.1% R 5 680:1 100 100 100
Jackson 683191 147751 21.6% U 174 849:1 100 100 100
Jasper 117543 24278 20.7% B 12 2023:1 98.3 100 100
Jefferson 222716 30761 13.8% B 11 2796:1 90 100 100
Johnson 54362 6748 12.4% R 7 964:1 97.5 100 100
Knox 4000 807 20.2% R 0 0 95.2 100
Laclede 35439 9941 28.1% R 5 1988:1 85 100 100
Lafayette 32688 6297 19.3% R 4 1574:1 98.2 100 100
Lawrence 38023 5472 14.4% R 2 2736:1 82.1 100 100
Lewis 10138 1745 17.2% R 0 0 28.3 100
Lincoln 54249 9810 18.1% R 2 4905:1 84.4 100 100
Linn 12311 2131 17.3% R 1 2131:1 94.9 100 100
Livingston 15053 2945 19.6% R 4 736:1 95.8 100 100
Demographics OB/GYN

55
CountyTotal
PopulationEligibles % Medicaid
County Type
Urban
Basic
Rural
Physicians Ratio
Distance
1 provider
within 15 miles
Distance
1 provider
within 30 miles
Distance
1 provider
within 60 miles
Macon 15479 3096 20.0% R 2 1548:1 84.1 100 100
Madison 12368 3644 29.5% R 2 1822:1 100 100 100
Maries 9013 1381 15.3% R 0 7.6 93.3 100
Marion 28920 7115 24.6% R 5 1423:1 96.5 100 100
McDonald 22800 6626 29.1% R 1 6626:1 77.7 100 100
Mercer 3719 722 19.4% R 0 0 100 100
Miller 25141 6281 25.0% R 2 3141:1 84.5 100 100
Mississippi 14232 4705 33.1% R 0 33.6 100 100
Moniteau 15856 2600 16.4% R 0 16 100 100
Monroe 8707 977 11.2% R 1 977:1 92.5 100 100
Montgomery 11841 2713 22.9% R 0 0 99.6 100
Morgan 20240 5158 25.5% R 3 1719:1 96.2 100 100
New Madrid 18272 5771 31.6% R 0 26.4 100 100
Newton 58598 17745 30.3% B 24 739:1 96.7 100 100
Nodaway 23081 2662 11.5% R 4 666:1 82.6 100 100
Oregon 10911 3634 33.3% R 1 3634:1 55.9 100 100
Osage 13703 1413 10.3% R 0 7 100 100
Ozark 9492 2429 25.6% R 0 3.3 41.6 100
Pemiscot 17650 7173 40.6% R 2 3587:1 90.1 100 100
Perry 19202 3669 19.1% R 4 917:1 93.2 100 100
Pettis 42225 10827 25.6% R 6 1805:1 99.3 100 100
Phelps 44847 9505 21.2% R 11 864:1 89.9 100 100
Pike 18541 3395 18.3% R 0 0 29.7 100
Platte 94788 9061 9.6% B 10 906:1 98.4 100 100
Polk 31054 7867 25.3% R 8 983:1 84.8 100 100
Pulaski 53436 8076 15.1% R 2 4038:1 89.3 100 100
Putnam 4829 1082 22.4% R 1 1082:1 81.3 100 100
Ralls 10255 2006 19.6% R 1 2006:1 74.9 100 100
Randolph 25072 5833 23.3% R 4 1458:1 96.7 100 100
Ray 22949 3522 15.3% R 0 57.2 100 100
Reynolds 6565 1798 27.4% R 2 899:1 84.5 100 100
Ripley 13969 4979 35.6% R 2 2490:1 96.8 100 100
Saline 23347 5057 21.7% R 6 843:1 74.3 100 100
Schuyler 4370 955 21.9% R 0 17.3 100 100
Scotland 4863 822 16.9% R 3 274:1 100 100 100
Scott 38903 12455 32.0% R 8 1557:1 98.6 100 100
Shannon 8329 2337 28.1% R 0 0 94.8 100
Shelby 6108 1543 25.3% R 0 27.7 100 100
St. Charles 379493 33082 8.7% U 90 368:1 100 100 100
St. Clair 9457 2123 22.4% R 0 10.9 100 100
St. Francois 65960 16584 25.1% B 24 691:1 100 100 100
St. Louis City 317419 100441 31.6% U 151 665:1 100 100 100
St. Louis Co. 1001876 156695 15.6% U 351 446:1 100 100 100
Ste. Genevieve 17914 2803 15.6% R 4 701:1 97.8 100 100
Stoddard 29867 8421 28.2% R 6 1404:1 78.5 100 100
Stone 31104 5756 18.5% R 0 51.8 100 100
Sullivan 6411 1529 23.8% R 2 765:1 82.9 100 100
Taney 54230 13078 24.1% R 13 1006:1 95.5 100 100
Texas 25642 6584 25.7% R 2 3292:1 48 100 100
Vernon 21001 5049 24.0% R 3 1683:1 93.4 100 100
Warren 33253 6188 18.6% R 0 63.6 100 100
Washington 25077 7202 28.7% R 1 7202:1 91.4 100 100
Wayne 13452 4681 34.8% R 2 2341:1 89.5 100 100
Webster 36888 9281 25.2% R 0 23.7 98.1 100
Worth 2073 431 20.8% R 0 7.2 100 100
Wright 18291 6926 37.9% R 0 1.2 63.4 100
TOTAL: 6,063,589 1,187,627 1,341 88.0 99.2 100.0
Demographics OB/GYN

56
FFS Network Adequacy – Home Health Agencies
CountyTotal
PopulationEligibles % Medicaid
County Type
Urban
Basic
Rural
Providers Ratio
Distance
1 provider
within 10 miles
Distance
1 provider
within 20 miles
Distance
1 provider
within 30 miles
Adair 25602 4947 19.3% R 2 2474:1 83.8 100 100
Andrew 17379 4822 27.7% R 0 69 96.8 100
Atchison 5382 924 17.2% R 1 924:1 67.9 94.2 100
Audrain 25887 6299 24.3% R 1 6299:1 57.2 97.6 100
Barry 35662 13341 37.4% R 1 13341:1 32.2 78.5 98.5
Barton 12057 2869 23.8% R 1 2869:1 68.1 95.9 100
Bates 16584 3391 20.4% R 0 0 40.3 92.2
Benton 18806 4790 25.5% R 1 4790:1 59.6 82.5 98.9
Bollinger 12394 3195 25.8% R 0 0 25.3 98.6
Boone 172717 22941 13.3% B 5 4588:1 89.5 100 100
Buchanan 89486 18459 20.6% B 3 6153:1 97.3 99.4 100
Butler 42972 13648 31.8% R 1 13648:1 78 99.6 100
Caldwell 9034 1693 18.7% R 0 2.5 60.2 100
Callaway 44750 7644 17.1% R 0 13.4 55.8 100
Camden 44021 7510 17.1% R 2 3755:1 61.6 94.6 100
Cape Girardeau 78043 14234 18.2% B 3 4745:1 91.1 99.1 100
Carroll 9043 1865 20.6% R 1 1865:1 68 93.5 100
Carter 6258 2185 34.9% R 1 2185:1 39.7 93.8 100
Cass 100889 15118 15.0% B 1 15118:1 49.1 97.8 100
Cedar 13952 4299 30.8% R 2 2150:1 59.4 85.2 100
Chariton 7694 2018 26.2% R 0 0 15.3 56
Christian 82101 14800 18.0% B 1 14800:1 76.6 99.5 100
Clark 6917 1365 19.7% R 1 1365:1 79.3 100 100
Clay 233682 30763 13.2% B 4 7691:1 96.8 100 100
Clinton 20299 2120 10.4% R 0 1.7 72.6 100
Cole 76557 12634 16.5% B 3 4211:1 88 98.7 100
Cooper 17585 3333 19.0% R 0 0 66.5 88.6
Crawford 24650 6103 24.8% R 0 19.9 55.3 100
Dade 7628 1881 24.7% R 0 0 13.3 100
Dallas 16389 3891 23.7% R 0 0 58.2 98.7
Daviess 8297 1725 20.8% R 0 1 47.7 100
DeKalb 12692 2922 23.0% R 1 2922:1 72.5 95.6 100
Dent 15655 4321 27.6% R 1 4321:1 74.8 90.5 100
Douglas 13546 3386 25.0% R 0 0 4.4 64.2
Dunklin 31344 12438 39.7% R 3 4146:1 82.9 93.5 99.4
Franklin 102084 19871 19.5% B 3 6624:1 62.5 100 100
Gasconade 14866 3112 20.9% R 1 3112:1 23.9 41.2 100
Gentry 6826 1515 22.2% R 1 1515:1 45.4 80.3 100
Greene 285865 57947 20.3% U 9 6439:1 86.3 98.4 100
Grundy 10197 2279 22.3% R 1 2279:1 85.4 99 100
Harrison 8639 2178 25.2% R 1 2178:1 67.4 96.1 100
Henry 22028 5609 25.5% R 1 5609:1 58.1 83.2 100
Hickory 9219 1917 20.8% R 0 0 18.8 100
Holt 4516 796 17.6% R 0 6.3 24.7 98.7
Howard 10159 2195 21.6% R 1 2195:1 50.7 100 100
Howell 40173 12761 31.8% R 4 3190:1 70.6 99 100
Iron 10267 3399 33.1% R 1 3399:1 57.5 84.5 100
Jackson 683191 147751 21.6% U 14 10554:1 98.5 100 100
Jasper 117543 24278 20.7% B 1 24278:1 61.6 98.1 100
Jefferson 222716 30761 13.8% B 2 15381:1 76.5 100 100
Johnson 54362 6748 12.4% R 1 6748:1 60.2 100 100
Knox 4000 807 20.2% R 1 807:1 74.5 95.9 100
Laclede 35439 9941 28.1% R 1 9941:1 72.2 95.3 100
Lafayette 32688 6297 19.3% R 1 6297:1 47.5 92 100
Lawrence 38023 5472 14.4% R 1 5472:1 63.5 100 100
Lewis 10138 1745 17.2% R 1 1745:1 19.7 98.2 100
Lincoln 54249 9810 18.1% R 1 9810:1 65 95 100
Linn 12311 2131 17.3% R 0 0 0 10.1
Livingston 15053 2945 19.6% R 0 0 25.2 100
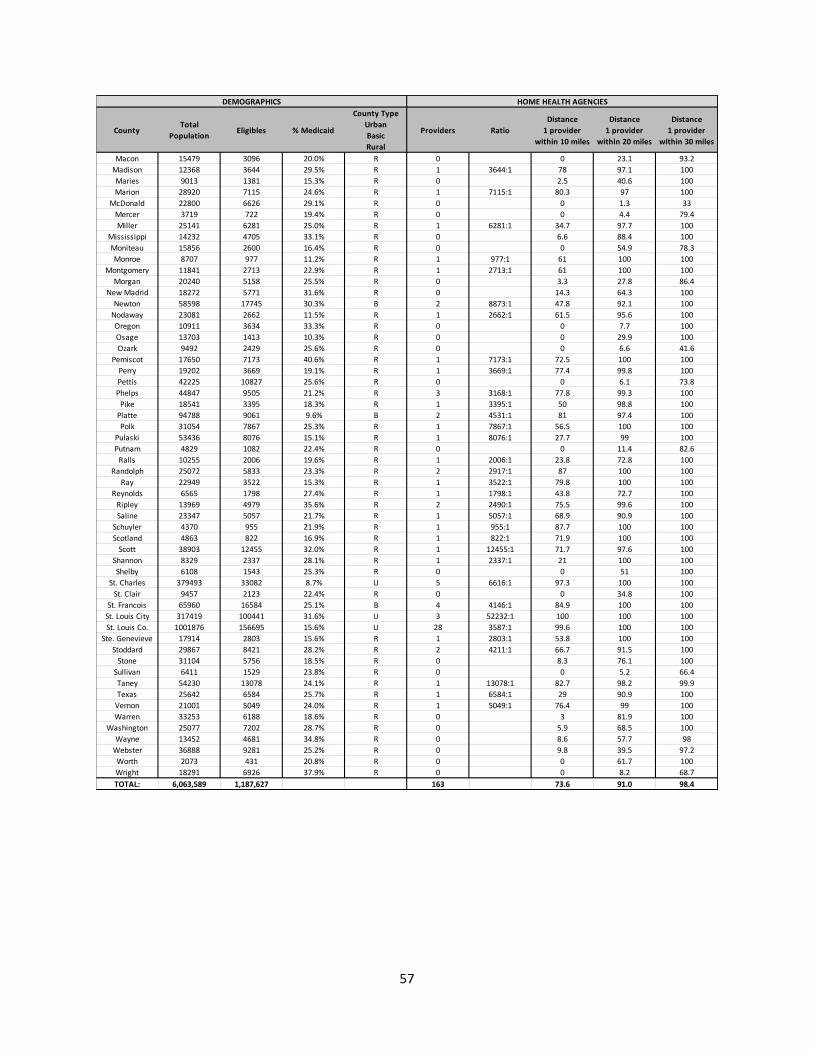
57
CountyTotal
PopulationEligibles % Medicaid
County Type
Urban
Basic
Rural
Providers Ratio
Distance
1 provider
within 10 miles
Distance
1 provider
within 20 miles
Distance
1 provider
within 30 miles
Macon 15479 3096 20.0% R 0 0 23.1 93.2
Madison 12368 3644 29.5% R 1 3644:1 78 97.1 100
Maries 9013 1381 15.3% R 0 2.5 40.6 100
Marion 28920 7115 24.6% R 1 7115:1 80.3 97 100
McDonald 22800 6626 29.1% R 0 0 1.3 33
Mercer 3719 722 19.4% R 0 0 4.4 79.4
Miller 25141 6281 25.0% R 1 6281:1 34.7 97.7 100
Mississippi 14232 4705 33.1% R 0 6.6 88.4 100
Moniteau 15856 2600 16.4% R 0 0 54.9 78.3
Monroe 8707 977 11.2% R 1 977:1 61 100 100
Montgomery 11841 2713 22.9% R 1 2713:1 61 100 100
Morgan 20240 5158 25.5% R 0 3.3 27.8 86.4
New Madrid 18272 5771 31.6% R 0 14.3 64.3 100
Newton 58598 17745 30.3% B 2 8873:1 47.8 92.1 100
Nodaway 23081 2662 11.5% R 1 2662:1 61.5 95.6 100
Oregon 10911 3634 33.3% R 0 0 7.7 100
Osage 13703 1413 10.3% R 0 0 29.9 100
Ozark 9492 2429 25.6% R 0 0 6.6 41.6
Pemiscot 17650 7173 40.6% R 1 7173:1 72.5 100 100
Perry 19202 3669 19.1% R 1 3669:1 77.4 99.8 100
Pettis 42225 10827 25.6% R 0 0 6.1 73.8
Phelps 44847 9505 21.2% R 3 3168:1 77.8 99.3 100
Pike 18541 3395 18.3% R 1 3395:1 50 98.8 100
Platte 94788 9061 9.6% B 2 4531:1 81 97.4 100
Polk 31054 7867 25.3% R 1 7867:1 56.5 100 100
Pulaski 53436 8076 15.1% R 1 8076:1 27.7 99 100
Putnam 4829 1082 22.4% R 0 0 11.4 82.6
Ralls 10255 2006 19.6% R 1 2006:1 23.8 72.8 100
Randolph 25072 5833 23.3% R 2 2917:1 87 100 100
Ray 22949 3522 15.3% R 1 3522:1 79.8 100 100
Reynolds 6565 1798 27.4% R 1 1798:1 43.8 72.7 100
Ripley 13969 4979 35.6% R 2 2490:1 75.5 99.6 100
Saline 23347 5057 21.7% R 1 5057:1 68.9 90.9 100
Schuyler 4370 955 21.9% R 1 955:1 87.7 100 100
Scotland 4863 822 16.9% R 1 822:1 71.9 100 100
Scott 38903 12455 32.0% R 1 12455:1 71.7 97.6 100
Shannon 8329 2337 28.1% R 1 2337:1 21 100 100
Shelby 6108 1543 25.3% R 0 0 51 100
St. Charles 379493 33082 8.7% U 5 6616:1 97.3 100 100
St. Clair 9457 2123 22.4% R 0 0 34.8 100
St. Francois 65960 16584 25.1% B 4 4146:1 84.9 100 100
St. Louis City 317419 100441 31.6% U 3 52232:1 100 100 100
St. Louis Co. 1001876 156695 15.6% U 28 3587:1 99.6 100 100
Ste. Genevieve 17914 2803 15.6% R 1 2803:1 53.8 100 100
Stoddard 29867 8421 28.2% R 2 4211:1 66.7 91.5 100
Stone 31104 5756 18.5% R 0 8.3 76.1 100
Sullivan 6411 1529 23.8% R 0 0 5.2 66.4
Taney 54230 13078 24.1% R 1 13078:1 82.7 98.2 99.9
Texas 25642 6584 25.7% R 1 6584:1 29 90.9 100
Vernon 21001 5049 24.0% R 1 5049:1 76.4 99 100
Warren 33253 6188 18.6% R 0 3 81.9 100
Washington 25077 7202 28.7% R 0 5.9 68.5 100
Wayne 13452 4681 34.8% R 0 8.6 57.7 98
Webster 36888 9281 25.2% R 0 9.8 39.5 97.2
Worth 2073 431 20.8% R 0 0 61.7 100
Wright 18291 6926 37.9% R 0 0 8.2 68.7
TOTAL: 6,063,589 1,187,627 163 73.6 91.0 98.4
DEMOGRAPHICS HOME HEALTH AGENCIES

58
Data to Assess Access: Fee-for-service Utilization Review The MO HealthNet Division (MHD) performed a utilization review of Fee-for-Service (FFS) participants accessing provider services by county type (urban, basic and rural) in Missouri during CY2015. Areas of review include: 1. Primary Care services (including those provided by a physician, FQHC, clinic or dental care); 2. Physician specialist services (including cardiology, radiology, neurology, ophthalmology, urology/nephology and all other specialty services); 3. Behavioral health services (including mental health and substance use disorder); 4. Pre- and post-natal obstetric services including labor and delivery; and 5. Home health services. No provider specialties were omitted for provider types of MD, DO, Nurse Practitioners and Physician Assistants. If the provider specialty type does not fall in the categories listed above they are combined into an ‘other specialty” category. Medical, outpatient and dental claim types were reviewed for the measure of utilization of services. Provider specialties were reviewed at the billing and performing levels and prioritized as follows (in other words, if someone has two specialties such as psychiatry and primary care they are placed in the psychiatry group):
Psychiatry
OB/GYN
Primary Care
Cardiology
Neurology
Ophthalmology
Urology/Nephrology
Radiology
Other Specialty Clinics were queried to look at appropriate billing provider specialties when there was no performing provider present on the claim. Gateway, inpatient, NEMT, ambulance, managed care, Medicare crossover, hospice, pharmacy and nursing home claims are not included in this analysis. The following charts reflect the number of participants with at least one claim by provider type during the measurement year. Child is defined as ages 0-20 and adult as ages 21 and greater.
59

60
An additional analysis using HEDIS-Like methodology for Prenatal and Postpartum Care was also used to measure obstetric care of the FFS population.

61

62

63

64