missouri department of natural resources (mdnr) and u.s ... · a5-1 attachment 6 - aurora-wentworth...
TRANSCRIPT

Missouri Department of Natural Resources (MDNR)
And
U.S. Environmental Protection Agency (EPA) Brownfields Program
Evaluation of Hyperspectral Imagery for Missouri Mine Waste Inventory
September 1, 2006 – June 30, 2007
Final Report
N. Carbone, Missouri Department of Natural Resources;
C. Blodgett, Ph.D., University of Missouri Columbia;
S. Muenks, Missouri Department of Natural Resources;
R. Lea, University of Missouri Columbia;
R. Franson, Missouri Department of Natural Resources
i
Table of Contents
1. PROJECT OVERVIEW AND SUMMARY.............................................................................1 1.1 Overview..............................................................................................................................1 1.2 Summary of Findings...........................................................................................................1
2. PROJECT TASKS.....................................................................................................................4 2.1 Task 1 - Southwest Missouri Mine Waste ...........................................................................4
2.1.1 Determine Lead Levels in Soil ..................................................................................... 4 2.1.2 Locate Mine Waste ....................................................................................................... 7 2.1.3 Identify Contamination Using Vegetation Stress ......................................................... 9
2.2 Task 2 - Southeast Missouri Lead Contamination.............................................................16 2.2.1 Washington County Review of 2005 Imagery............................................................ 16 2.2.2 Big River End Member Analysis................................................................................ 16 2.2.3 Herculaneum End Member Analysis .......................................................................... 16
Figures Figure 1 - Baldwin Park March 2005 Lead Survey Data and SAM Analysis Overlay ...................4 Figure 2 - August 2005 Analyzed HSI Overlaid on Aurora GIS.....................................................5 Figure 3 - Abandoned Mining Area Covered with Chat..................................................................5 Figure 4 - Plot of Several Sample Readings in Area 2, Baldwin Park Mining Operation...............6 Figure 5 - Field Survey Data of Large-Scale Cadmium, Zinc and Lead Mining Operation, Wentworth, MO ...............................................................................................................................7 Figure 6 - Imagery Analysis of Granby Mine Waste.......................................................................8 Figure 7 - Zinc Inhibited Growth.....................................................................................................8 Figure 8 - Granby City Park.............................................................................................................9 Figure 9 - Mullein Growth Inhibited by Zinc ................................................................................10 Figure 10 - Oak and Sycamore Sample Locations.........................................................................11 Figure 11 - Cedar Berries in Zinc Contaminated Area ..................................................................12 Figure 12 - Aurora Sycamore Signatures.......................................................................................12 Figure 13 - Tree and Grass Signatures...........................................................................................13 Figure 14 - Vegetation Signatures .................................................................................................13 Figure 15 - Cedar Spectral Signatures ...........................................................................................14 Figure 16 - Zinc in Soil and Cedar.................................................................................................15
Attachments Attachment 1 - HSI Work Plan Task 1 ..................................................................................... A1-1 Attachment 2 - UMC Cooperative Agreement Task 1 ............................................................. A2-1

ii
Attachment 3 - Collection Plan for SW Missouri Lead/Zinc Project ....................................... A3-1 Attachment 4 - Baldwin Park Sample Data March 2005.......................................................... A4-1 Attachment 5 - Aurora Pre-Survey Analysis and Collection Plan............................................ A5-1 Attachment 6 - Aurora-Wentworth Ground truth Results ........................................................ A6-1 Attachment 7 - Aurora & Non-Contaminated Leaf XRF Readings ......................................... A7-1 Attachment 8 - Wentworth Abandoned Mine Waste and Reused Tailings .............................. A8-1 Attachment 9 - Imagery Analysis of Granby Mine Waste ....................................................... A9-1 Attachment 10 - Granby Survey Notes................................................................................... A10-1 Attachment 11 - Aurora and Granby XRF Readings, May 2007 ........................................... A11-1 Attachment 12 - Aurora Tree Signatures, February 2007....................................................... A12-1 Attachment 13 - Aurora Survey Notes, May 9, 2007 ............................................................. A13-1 Attachment 14 - Aurora Sycamore Analysis and Mine Sites ................................................. A14-1 Attachment 15 - Aurora-Granby Tree Analysis, May 2007 ................................................... A15-1 Attachment 16 - MoRAP Tree Signature Analysis................................................................. A16-1 Attachment 17 - Zinc in Soil and Cedar Correlation, May 2007............................................ A17-1 Attachment 18 - HSI Work Plan Task 2 ................................................................................. A18-1 Attachment 19 - UMC Cooperative Agreement Task 2 ......................................................... A19-1 Attachment 20 - Big River End Member Analysis................................................................. A20-1 Attachment 21 - Herculaneum End Member Analysis ........................................................... A21-1

1
1. PROJECT OVERVIEW AND SUMMARY
1.1 Overview
The Missouri Department of Natural Resources (MDNR), through a U.S. Environmental Protection Agency (EPA) grant, conducted a pilot project in 2005 to evaluate potential applications of Hyperspectral Imagery (HSI) for identifying and characterizing contamination. The Civil Air Patrol (CAP) collected the HSI with their Airborne Real-Time Cueing Hyperspectral Enhanced Reconnaissance (ARCHER) system, and the University of Missouri Columbia (UMC), through the Missouri Resource Assessment Partnership (MoRAP) with MDNR and other state and federal agencies, analyzed the imagery. HSI was collected of a variety of contaminated sites, including several lead mining areas in southwest and southeast MO, and an operational lead smelter in Herculaneum, MO. The report is available at http://www.dnr.mo.gov/env/hwp/hsi/hsi-project.htm.
The initial pilot project had limited time and funding for follow-on ground truth data collection, and for evaluating analytical approaches to some investigations, such as using vegetation stress as a contamination indicator. The SFY '07 project used HSI from the 2005 Pilot Project, and focused on field data collection, re-analysis of the '05 imagery, and follow-on verification of three lead-zinc mining areas in southwest MO. Additionally, HSI of a portion of the Big River in eastern MO and Doe Run lead smelter in Herculaneum, MO was re-analyzed using a different process, end member versus Spectral Angle Mapper (SAM) analysis, to determine if another analytical approach would provide better results. The objective in southwest MO was to evaluate the potential use of HSI to determine lead levels in soil, to locate mine waste over large land areas, and to characterize the extent of contamination through vegetation stress. An end member analysis of Herculaneum and Big River was conducted to evaluate HSI potential to determine the extent of lead dust deposition from the smelter, and deposition of mine waste along the Big River from the collapse of part of a tailings dam.
In June 2007, project personnel were asked to submit areas for HSI collection as part of State Emergency Management Agency (SEMA) earthquake exercise. As a result, ARCHER collected HSI of parts of the Big River and city of Leadwood, where MDNR and EPA are removing tailings and chat piles and mitigating runoff and wind blown contamination from the piles, and Herculaneum, were airborne lead contamination continues to be deposited around the smelter. The SFY '08 Brownfields HSI project will use the SEMA funded imagery to continue ground truth and evaluation of HSI applications to mine waste characterization.
1.2 Summary of Findings
The report provides details of the tasks and activities, and relevant collected data. The following is a summary of findings:
• Lead Levels In Soil. Determining levels of lead contamination in soil from airborne deposition, particularly in differing types of soil, continues to be a challenge. The soil, not the lead contamination, determines the spectral signature, unless the contamination levels are high enough to provide a unique signature. The lead and zinc levels recorded by the project were too
2
few and random to determine if there was a correlation. Based on the data collected, it does not appear HSI analysis of soil will help determine if lead contamination is above clean-up levels.
- Recommendation: Using soil signatures to determine lead levels does not appear productive with current analytical approaches. Vegetation indicators may be more productive, particularly in residential areas.
• Mine Waste. Several locations surveyed in Wentworth and Granby, where spectral analysis from 2005 indicated mine waste existed, did include mine waste. One driveway that was identified in the analysis, did contain reused mine waste.
- Recommendation: Continue evaluation of the use of HSI to support mapping abandoned and reused mine waste.
• Granular Mine Tailings. The majority of locations of suspected abandoned or reused mine waste in Aurora, identified using the signature of chat or chert-like material in Baldwin Park, were concrete parking areas and roads. The signature of relatively fine mine tailings appears to be similar to the aggregate in concrete. The concrete pads and roads that were sampled had very low or non-detectable lead and zinc levels.
- Recommendation: Some mine waste was reused for gravel roads and may show up in the analysis. However, using fine grain chat for a signature may result in a high rate of false indication of potential mine waste.
• Mineralogical Differences. Mine waste varies in mineral composition, even within a geographic mining area. Overburden and other materials removed to reach desired ore also vary in composition and signature.
- Recommendation: For more complete results, several signatures should be used for analysis.
• Airborne Deposition. The end member analysis of the Doe Run lead smelter in Herculaneum showed similar signatures between the slag pile and some residential streets, possibly those used as haul roads. There were also similarities between the smelter compound, several residential areas, the rail line that serves the smelter, and several areas along the river that surrounds the town and smelter. It appears that some of these anomalies may reflect airborne deposition. Unfortunately, the imagery was too old to be used for the ground survey.
- Recommendation. Time lapse between imagery collection and analysis for some conditions, make ground truth collection impractical. New imagery of Herculaneum and more of the surrounding area, collected in June 2007, will be used for the SFY '08 project.
• Tree Species Differentiation. ARCHER HSI appeared to be capable of distinguishing different species of trees. However, the field survey showed minimal correlation. The dense canopy, presence of vines and variety of species may have complicated the analytical process. Additionally, because the original imagery was manually rectified, the location of trees used for signature development could have been off by as much as five meters.
- Recommendation: ARCHER HSI may still be usable for characterizing tree species for other projects, and for distinguishing trees in contaminated and non-contaminated areas, but more analysis using current imagery will be required to verify the capability.
• Conifer Uptake. Conifers appear to provide a good year-round measure for characterizing contamination. Preliminary tests in southwest MO indicated that there is a strong correlation

3
between zinc levels in soil and Cedar trees. These results are similar to a study conducted in Belgium in which Pine trees were used to define the area of zinc contamination from a zinc smelter. Based on the analysis of Cedar in Granby, MO, it appears that the higher the zinc levels in the needles and soil, the less trees, but more grassy areas were a match. If the grassy areas are masked out, this may be the best characterization of the areas of highest contamination based on the Cedar trees. Some types of grass have similar signatures to conifer, and this may be the cause for miss-correlation. Alternatively, the correlation may be an indication that the grass is in zinc contaminated areas. The lower the zinc levels, the lower the correlation to grass and higher correlation to trees. More trees, particularly outside the mining area, should have less zinc. Grass testing was limited.
- Recommendation: More testing will be needed to confirm the tree - soil zinc correlation and to determine if the ARCHER sensor can provide sufficient spectral signature separation to distinguish contaminated from non-contaminated trees.
• Sycamore As An Indicator. The analysis of contaminated Sycamore in the Aurora and Baldwin Park areas matched relatively closely with the known mine sites. The contaminated Sycamores that were tested were identified in imagery as contaminated, and fell within the area of known mine sites. The one non-contaminated Sycamore that was tested was not identified as contaminated and fell outside the know mining area.
- Recommendation. There may be sufficient difference in the signature of contaminated Sycamore to provide an indicator of contaminated areas.
• Visual Vegetation Indicator. Mullein may be a good visual indicator for lead/zinc contamination. The Mullein in Baldwin Park contaminated areas appeared small compared to normal Mullein. The zinc apparently inhibits growth, and field testing indicated that the higher the zinc levels the smaller the plant. Mullein also appears to uptake detectable levels of lead.
- Recommendation. The Mullein data was collected during the February survey, when the plants were still dormant from the winter. However, they were much smaller than those observed in other parts of MO, and size appeared to correlate to zinc levels. In mining areas, Mullein may provide a visual indication of zinc levels.
• Imagery Collection And Analysis. Dated imagery is difficult to use for ground truth, particularly when analyzing vegetation. This project was conducted almost two years after imagery collection. Remediation or other activity had changed the landscape in areas where signatures were developed for the original project, and tree and vine canopy had changed
- Recommendation: Analysis should be conducted soon after collection to improve accuracy of ground truth data analysis.
• ARCHER Imagery Processing. Current data output from ARCHER is not usable. Space Computer Corp (SCC), developer of the ARCHER software, has two applications that will process and geo-register the data for use on Geographic Information Systems (GIS) or imagery analysis applications.
- Recommendation: Purchase the SCC HSI processing software for use in future projects.

4
2. PROJECT TASKS
2.1 Task 1 - Southwest Missouri Mine Waste
2.1.1 Determine Lead Levels in Soil
The objective of this task was to determine if ARCHER HSI could distinguish lead levels in soil or changes in vegetation resulting from 1200 parts per million (ppm) or more lead, the level that triggers remediation in residential areas. The ground truth area was Baldwin Park, Aurora, MO, where EPA and MDNR had conducted extensive testing, and data existed from a March 2005 study. Some remediation had been conducted since the August 2005 ARCHER flight, changing some of the surface area in the park where the readings were taken and possibly affecting the follow-on data collection. The task was to be accomplished through four activities, detailed in the HSI Work Plan Task 1, Attachment 1. UMC, through a Cooperative Agreement, Attachment 2, analyzed the HSI, provided the analyzed data as shape files for GIS overlay, and supported discussions with Project Managers.
Activity 1 - Field Screening and Data Collection. Activity 1 Collection Plan is Attachment 3. The Plan included the following steps.
• The data points from the March 2005 EPA/MDNR field survey of Baldwin Park, Attachment 4, were plotted. Several points in the 1200 ppm Pb and above range were then used as source areas in the August 2005 imagery to develop a soil signature. Figure 1 shows several 1200 ppm points (H#, AR# & VH#).
• UMC used several source areas to develope a representative signature. The signature was used in the Spectral Angle Mapper (SAM) analytical tool in ERDAS IMAGINE, an HSI analysis application, to identify other areas in the imagery that matched the signature. The dark rectangle in Figure 2 is the resulting analysis overlaid on a GIS map background. Yellow areas are those identified by SAM analysis as having the same signature as the source area. The GIS map background that was used is 2006 imagery, so there are differences in the ground cover and some features from the ARCHER imagery causing some SAM analysis to be off.
Figure 1 – Baldwin Park March 2005 Lead Survey Data and SAM Analysis Overlay

5
• Attachment 5 provides larger graphics of Figures 1 & 2 and additional areas of the pre-survey planning. With the lead contamination analysis overlaid on GIS, points were selected and coordinates obtained for three types of locations:
- Locations identified with high levels of lead in the 2005 study;
- Locations within yellow areas that should contain high levels of lead; and
- Locations outside yellow areas that should have no or low levels of lead.
• The Aurora field survey was conducted February 21 - 22, 2007. A random number of sample points in several areas were selected for Handheld X-Ray Fluorescence (XRF) data collection. Attachment 3 provides operating instructions for the Innov-X brand XRF Analyzer that was used in the field survey. The XRF tests for 25 elements in 30-60 seconds, and provides on-instrument readout.
Activity 2 - Imagery/Data Analysis and Reporting. Attachment 6 provides the XRF readings from the February 21 - 22 field survey of Aurora and Wentworth. The following are results of the data review.
• The imagery analysis overlay, yellow highlighted areas, Attachment 5, indicated lead contamination on many streets and roads in Aurora residential areas, the ball fields and picnic areas in Baldwin Park, the grain elevator across the railroad tracks from the park and other commercial areas in Aurora. The analysis indicated that mine waste had been reused for roads and parking areas. The signature used for the analysis came from Area 2, Baldwin Park's abandoned mining operations. Most of the bare areas in the park are covered with relatively small grain chat as shown in Figure 3. The high levels of zinc, 20,000 - 40,000 ppm, inhibit vegetation growth. However, most of the roads and parking areas, including those around the Baldwin Park ball fields, were concrete. While the piles of chat that were once in Baldwin Park may have been used as aggregate in the concrete or for roadbeds, the roads and parking areas that were tested had low levels of both lead and zinc.
Figure 2 – August 2005 Analyzed HSI Overlaid on Aurora GIS
Figure 3 – Abandoned Mining Area Covered with Chat

6
Apparently the spectral signature of the chat is very similar to that of aggregate in concrete, or the concrete mix.
• Attachment 6 provides the XRF soil and leaf readings for the February 21-22 field survey. Figure 4, from Attachment 6, shows the locations of several of the XRF readings in the abandoned mining area of Baldwin Park. Figure 4 notes that lead was detected in Mullein and Sycamore leaves. This information came from the initial readings in the field. Those readings were taken with the XRF in the Thin Film/Filter Analysis mode, which was thought to sample only the surface of the leaves. The readings were taken with the leaves stacked on the ground. Subsequent XRF testing, Attachment 7, with the leaves on a neutral background indicates that the field XRF tests measuring lead and zinc in the soil as well as leaves. The neutral background tests did detect lead in the Mullein leaves, and zinc in the Mullein, Oak and Sycamore from Baldwin Park. Oak and Sycamore leaves from Jefferson City, MO, were tested to determine if there was a background level of zinc uptake in MO. Neither zinc nor lead was detected.
• The HSI analysis and field data for lead levels in soil were inconclusive. The spectral signature used for the analysis was developed from one small area in Baldwin Park that had high lead levels in the March 2005 survey. That signature was then applied to the Aurora imagery of August 2005. The ground truth data was collected in February 2007. Much of the mining area in Baldwin Park had significant four-wheel drive and other traffic since the 2005 survey and imaging. If there had been piles of tailings and chat, they had been removed. The SAM analytical approach that was used allows the operator to determine how close to the source signature the software should identify, marking the pixels in yellow. For this project, the match was keep very close to the original signature, in order to identify areas of higher lead levels. Attachment 6 provides the lead and zinc level for soil and leaves. Figure 4 includes several soil readings in the Baldwin Park mining area. The following are observations:
- Several locations, such as #s25-27 and 46, 51, 54 & 55, were identified in the analysis with lead levels over 1,200 ppm. They were in the 200 - 960 ppm levels, which was near the target level. Locations #s25-27 are Mullein reading. The corresponding soil readings were #s29-30.
- Several locations, such as #s30, 34, 39 & 42, that should have been over 1200 ppm, but were well below that level. Readings #s34 & 39 are field readings of leaves that did indicate lead contamination.
Figure 4 – Plot of Several Sample Readings in Area 2, Baldwin Park Mining Operation

7
- Location #15 was an area that was not expected to have high lead levels, and did not.
- Locations #s2, 4, 5 & 6 were also expected to be low levels, but two readings in the 1100 - 1200 ppm were recorded.
- Parking aprons, such as location #9, were expected to be high, but no lead or zinc was found.
2.1.2 Locate Mine Waste
Imagery and analysis of Granby and Wentworth, MO, from the 2005 Pilot Project were used in the evaluation of HSI for locating mine waste. A SAM analysis was conducted of both areas using locations identified by Project Managers (PM) as source material. Two areas were evaluated; an old cadmium and zinc mining operation in Wentworth, MO, and several abandoned mining sites and a smelter in Granby, MO. The following are results of the field surveys for mine waste in February and May 2007.
• Attachment 8 provides the 2005 imagery and analysis used for the field survey of Wentworth. ARCHER collected one 1/2 km wide strip of imagery of what had been a large cadmium, zinc and lead mining operation east of the small town of Wentworth. Attachment 6 provides the XRF Readings collected around the mining site. Figure 5 provides an overview of the findings. The following are observations:
- The imagery analysis appeared to correlate well with observed mine waste at the Georgette and Baker mines, and with overburden piles in surrounding fields. The owner of the property advised that his grandparents had established the mining operations. He gave permission to survey the area and take readings, and provided an ore specimen, reading #36, Attachment 6, which read high in lead and cadmium.
- Imagery analysis of the circular driveway at the residence indicated that some mine waste had been reused for the driveway. The owner confirmed the analysis. Reuse in roadbeds in the surrounding area was also indicated, but not tested.
- Runoff from the Baker mine waste piles had raised the levels of zinc in a nearby creek. The creek could not be seen in the imagery.
- There was no testing of areas that were not identified as mine waste in the analyzed imagery to determine if the analysis was missing waste.
Figure 5 - Field Survey Data of Large-Scale Cadmium, Zinc and Lead Mining Operation, Wentworth, MO
8
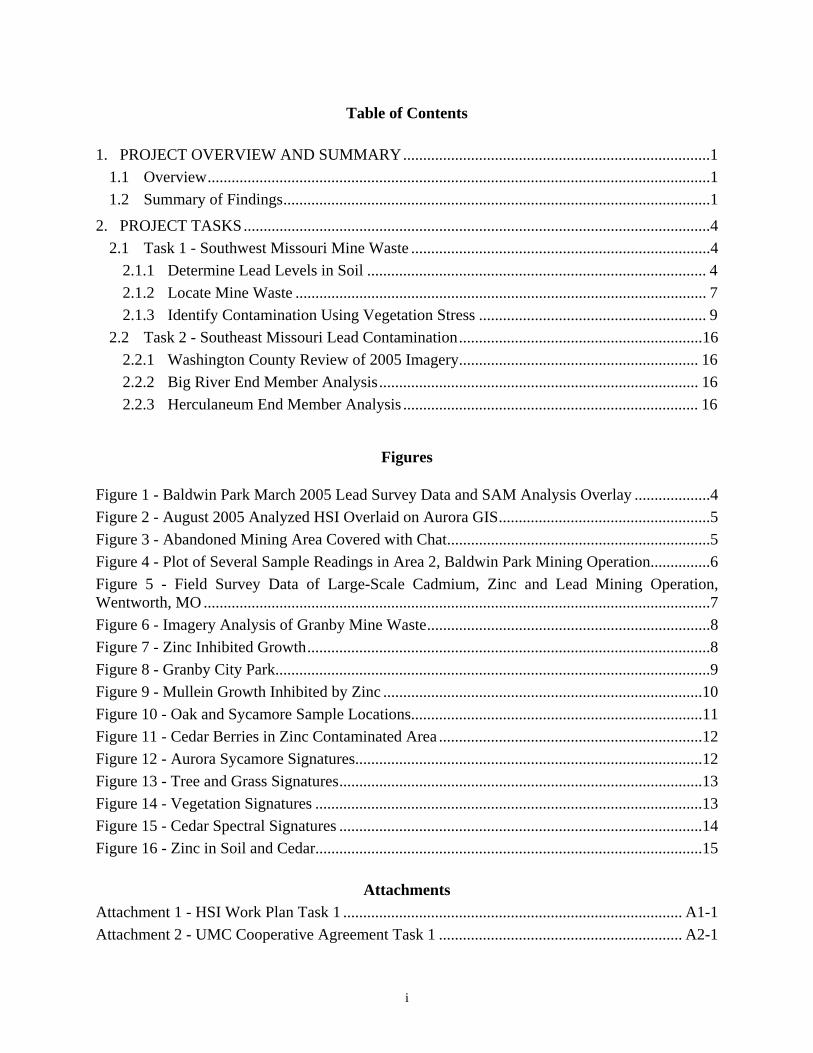
• Attachment 9 provides the imagery analysis of Granby with potential lead-zinc mine waste locations. The site PM identified a known abandoned mining area, which was used to develop a spectral signature. An overview of the analysis with potential mine waste in yellow, Figure 6, identifies two known mining area, several other areas of potential mine waste and an area where a lead smelter stood above the town of Granby. Attachment 9 includes a plot of historic mine sites, red dots, which covered the majority of the imaged area. Much of the potential mine waste identified in the imagery analysis is in areas of historic mining operations. Attachment 10 provides Granby survey notes with select XRF readings for leaves and soils. Attachment 11 provides all XRF reading for May surveys of Aurora and Granby. The following are observations:
- HSI analysis does appear to identify abandoned mine waste, particularly in areas where high levels of zinc in the waste inhibit vegetation growth and the materials are exposed in the imagery. Many of the areas were not accessible. More extensive fieldwork and more recent imagery will be needed to develop a better understanding of the accuracy of the process.
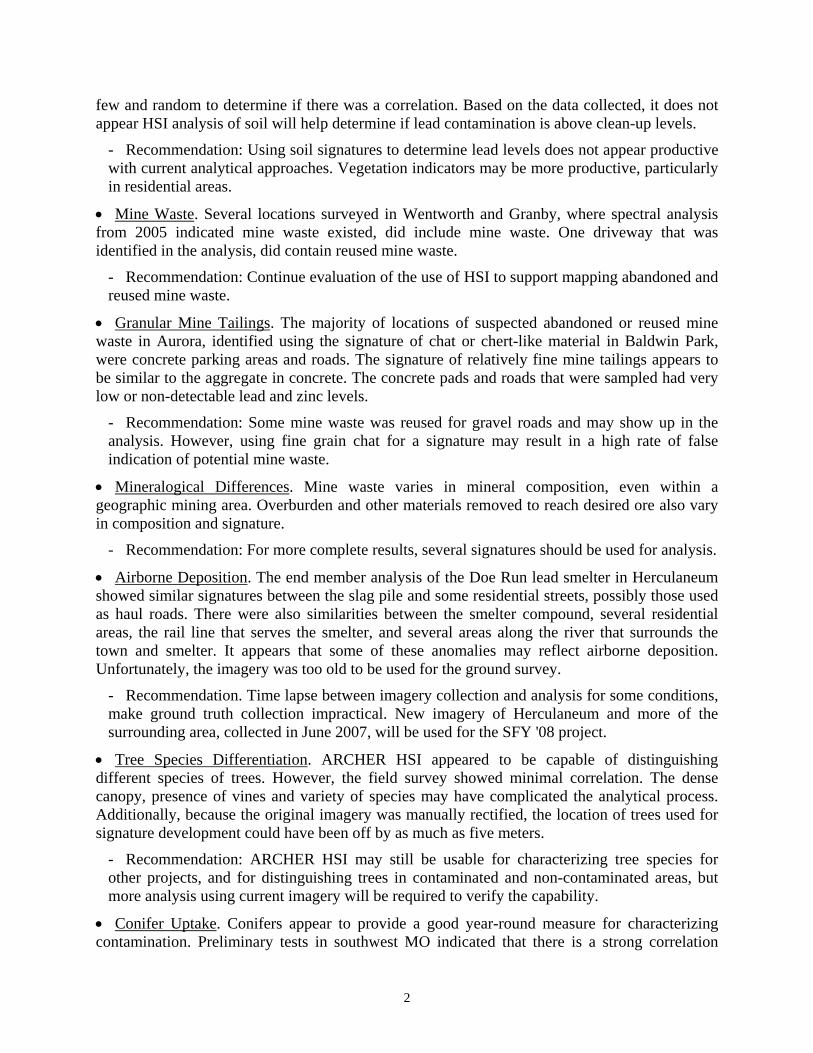
- Analysis of Granby identified three areas of potential mine waste, two mining sites and a smelter, which were visited during the field survey, and two public areas that were used to determine if there was mine waste that was not identified by analysis. The two large mining sites had elevated levels of lead and zinc. The zinc had inhibited growth in large portions of the sites. Figure 7 is a view of mine waste in Mining Site 1, Figure 6, showing the effects of high levels of zinc on vegetation.
- One site, a former lead smelter Bag House, pictured in Attachments 9 and 10, and located in Figure 6, had significantly high levels of lead in the soil around the Bag House floor. The smelter was built on a hill above and west of the Main Street commercial area of Granby. The highest readings, 55,215 ppm Pb / 67,637 ppm Zn were on the hillside that drained toward Main Street and behind commercial buildings on the west side of the street. About 5 blocks south of the site was a small city park. There is a possibility that runoff from the Bag House site could flow to the park, as there is a drainage swale that runs north-south
Figure 6 - Imagery Analysis of Granby Mine Waste
Figure 7 - Zinc Inhibited Growth
Mining Site 1
Mining Site 2
Smelter
Ball Fields City Park

9
through the park. However, we could not confirm that the smelter and park were connected. There were elevated levels of lead and zinc in the drainage ditch.
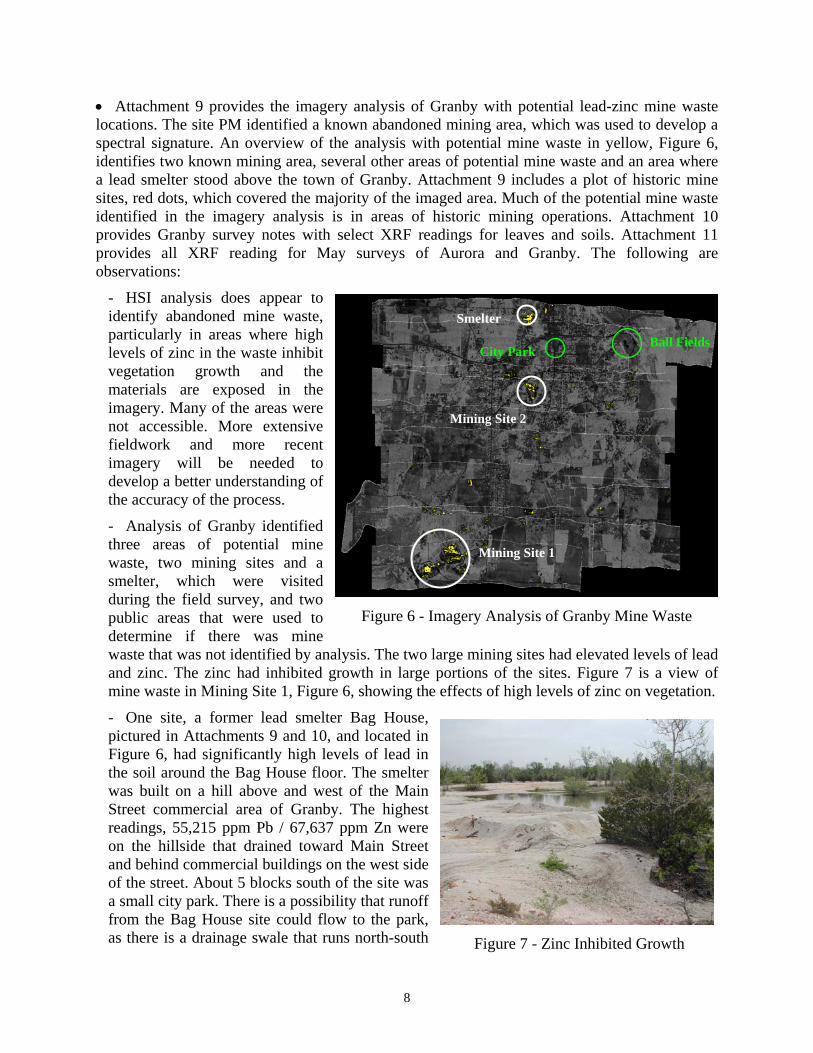
- Imagery analysis of the City Park, page A15-9, Attachment 15, indicated potential mine waste at the southern end of the park in a dirt parking area and in a residential driveway on a hill west of the park. Visual observation and XRF sampling gave no indication of mine waste in the park or surrounding residential areas. However, the material in the parking area could have changed since the imagery was taken in August 2005. A sloped, grass covered area formed the western edge of the park, Figure 8. The park itself was grass covered with a drainage swale running north-south through the park. The swale intersected a drainage ditch that ran east from the park under a road and into a residential area. There were very few grassless areas in the park where imagery analysis might have detected mine waste. However, there was a spot on the western hillside were the grass had been removed. The subsoil tested 5,318 ppm Pb / 16,476 ppm Zn, indicating that the hillside may have been mine waste that was subsequently covered. A small bare spot on the same hillside tested 511 ppm Pb / 7,141 ppm Zn. Additionally, there was one location in the drainage ditch that tested 971 ppm Pb / 11,815 ppm Zn, possibly indicating runoff deposition from surrounding mine waste. Imagery analysis would not have detected buried mine waste, but there is a possibility that the grass could be used as an indicator, if there was a detectable difference between grass signatures in the park and the same type grass in non-contaminated areas. Plantago and Bermuda Grass samples from the park all showed elevated levels of zinc, but no lead. It is not know if the elevated zinc will change the spectral signature of grass sufficiently to identify contaminated soil. There are new HSI analytical tools that purport to identify soil type under vegetation.
- An athletic complex east of the town center was chosen to determine if mine waste existed that was not identified by the imagery analysis. Two XRF samples were taken, with lead in the 100-200 ppm and zinc in the 2,000 to 2,400 ppm levels.
- HSI does appear to identify mine waste that is not covered. Only three sites were tested. New imagery, different analytical approaches and more testing is needed to determine if the process is sufficiently accurate and cost effective to be used as a pre-field survey planning tool.
2.1.3 Identify Contamination Using Vegetation Stress
The third task for southwest Missouri was evaluating the potential application of HSI for identifying lead and zinc contamination through the difference in spectral signatures of trees and other vegetation in contaminated and non-contaminated areas. During the February survey of Aurora, Red Oak, Sycamore and Mullein leaves were collected and tested with an XRF. The soil around the trees and plants were also tested to determine if there was a statistical correlation between levels in leaves and soil, and the locations were recorded for imagery analysis. The ARCHER imagery from August 2005 was used for the analysis. The tree and plant locations
PossibleCovered
MineWaste
Swale andDrainage
Ditch
Park
Figure 8 - Granby City Park

10
were plotted, and a spectral signature for each type tree and plant was developed. A SAM analysis of each spectral signature was conducted, and the results provided as GIS overlays to support the May field survey. The following are results of the field surveys for vegetation stress in February and May 2007.
• February 2007 Survey Aurora. Attachment 12 provides an overview of the objectives, analytical approach and results of the analysis of the February vegetation collection. One segment of imagery from Baldwin Park is shown with the results of analysis of potential signatures for Sycamore, Red Oak and Mullein displayed on the segment. The following are observations from the February survey:
- The August 2005 imagery was manually processed and geo-referenced. Locational accuracy between the trees in the imagery and GPS coordinates taken on site could have been up to 5 meters in error. Therefore, the source signature for individual trees may not have been the intended species. Additionally, there were many different species of trees in Baldwin Park that were intermixed, which could have altered the signature.
- Vegetation changes over the two years between the imagery collection and field survey could have had an impact on the analysis. In particularly, the Mullein found during the survey may not have been there during imaging, and the signature used for the analysis could have been the grass that surrounded the Mullein, or some other vegetation.
- The Sycamore, Oak and Mullein leaves from Baldwin Park did show varying levels of zinc. However, the XRF was not configured to determine if contamination came from dust on the surface or uptake in the leaves.
- The Mullein was noticeably smaller in the high zinc areas than what is normally seen around Missouri, Figure 9. Of the plants that were tested, the smaller the plant the higher the level of zinc. The Mullein plants in the area where the GPS reading was taken were not dense enough to generate a unique signature, assuming that the density of plants in 2007 was similar to 2005 when the imagery was collected. The signature for the Mullein analysis in Attachment 12 appeared to identify many of the same trees as the Sycamore signature. As noted in several spectral libraries, ome grass species have similar signatures to deciduous trees. If the Mullein signature was actually the signature of the surrounding grass, that may explain the correlation to trees.
- HSI appears to identify tree species, as there are different sets of trees in the three analyses. However, the May field survey indicated that the identification was inconsistent, as many of the Red Oaks and Sycamores were Maples or other species.
• May 2007 Survey Aurora. Based on the imagery analysis in Attachment 12, a field survey of Aurora and Granby vegetation was conducted in May 2007. The Aurora survey focused on evaluating the analysis that appeared to identify and distinguish contaminated Sycamore and Red Oak. UMC used tree locations obtained in February to develop contaminated Oak and
Contaminated Mullein
Figure 9 - Mullein Growth Inhibited by Zinc

11
contaminated Sycamore signatures, conducted a SAM analysis of the Aurora imagery, and provided the results as two GIS overlays. Figure 10, from Attachment 13, shows the Oak overlay, where the yellow pixels on the treetops indicate contaminated Oak trees. Based on the analysis, coordinates were developed for fifteen locations, five in the residential area where contamination should have been low, one in a field in the northwest corner of Baldwin Park and the remaining locations in the mining area of the Park. A similar chart was developed for contaminated Sycamore. The field survey visited a number of these locations to verify that the trees were contaminated Oak or Sycamore, and take additional leaf and soil samples as warranted. During the survey it became apparent that Oak and Sycamore correlation was not consistent, and that many of the trees were other species. Additionally, it was noted that Cedar or Juniper appeared to be more visibly affected by the zinc contamination, and that using Cedar as an indicator would provide a year-round, unobstructed vegetation source for analysis. Attachment 13 provides notes, XRF readings for leaves and soil, and some coordinates from the Aurora survey. The following are observations:
- It is important to note that the analysis should have identified only contaminated trees, not all trees of a species. There were Sycamores, which were not identified as contaminated, that were in areas outside of known mining areas. These would have been expected to be non-contaminated and not show up in the analysis. Attachment 14 provides an overlay of know mining sites in the Aurora, Baldwin Park area versus the Sycamore trees identified as contaminated by imagery analysis. Given that there was not sufficient time to collect a large sampling of leaves and soil readings to confirm the accuracy of the analysis, it does appear that the Sycamore analysis is logical in its ability to distinguish contaminated and non-contaminated areas. The Oak analysis identified many more trees and was less logical for distinguishing contaminated areas based on the known mine sites.
- The contaminated Oak and Sycamore used for signature development were in heavily forested areas where tree types were mixed. While it appears that the two signature analyses identify different sets of trees, there were no consistently identifiable species in either analysis. About 30% of the contaminated trees in the survey were the correct species. As noted in Attachment 13, some trees that should have been either Oak or Sycamore were other species including, Black Walnut, Maple, Black Cherry and Elm.
- One grassy area in Baldwin Park showed up as both contaminated Oak and Sycamore. The area included a Poplar tree, a patch of Milkweed, blue flowers and grass. The Milkweed was non-detect for lead and zinc. It is not know why this grassy area showed up as contaminated Oak and Sycamore, although it was in the center of several known mine sites.
A1A1
A15A15
A6 & 7A6 & 7
A4A4
A3A3A2A2
A14A14
A8A8A9A9
A10A10
A11A11
A12A12
A13A13
Sample Locations - AuroraSample Locations - Aurora
A5A5
Figure 10 - Oak and Sycamore Sample Locations

12
- The survey concentrated primarily on Oak and Sycamore in Aurora, with a minimal focus on other species. However, it became apparent in Baldwin Park that Cedar may be more affected by zinc, and a better year-round species for characterization. The Cedars appeared to be dwarfed in the mining area, and the berries, Figure 11, appeared to be smaller than normal. Soil and needle tests of a tree in the Park confirmed elevated levels of Zinc. Further testing in Granby, and in central MO for non-contaminated Cedar, further substantiated a correlation between zinc in soil and needles. Attachment 15 is a chart of the data collected in Aurora, Granby and central MO. The focus of data collection in Granby became Cedar trees.
- There were several ponds in the Baldwin Park mining area, which may have been mine shafts that filled with water. The ponds had no apparent aquatic life or algae, and were an unusually dark color.
- Dead leaves and needles had higher levels of zinc than live ones. Some live leaves were non-detect while dead ones from the same tree had detectable zinc levels. Wipe tests of the leaf surfaces were not done, but the contaminated trees were in areas where vehicle generated or wind blown dust would have been limited. It is more likely that the zinc represents uptake. Attachment 13 provides the results of soil and leaf testing.
- Attachment 15 provides the spectral signatures, and soil and leaf zinc levels for three Sycamore trees in Aurora. One tree, A5, is in a non-contaminated residential area. The other two are in the Baldwin Park mining area. There is a difference in the signatures, particularly at the two peak areas. The left peaks are in the correct order of highest to lowest soil zinc levels, with A5 on the bottom. The center peak has A5 in the middle, but the tree with the highest soil zinc level remains on top. If the left peaks provide an indication of levels of contamination, there may be sufficient separation to be used for characterizing contaminated areas.
• May 2007 Survey Granby. Based on the observations of apparent dwarfed Cedar in contaminated areas of Aurora, Cedar needles, as well as other leaves and grass samples, were collected and soil samples taken in Granby, MO. Attachment 10 provides Cedar, grass and other leaf and soil sample readings from the Granby survey. Attachment 11 provides the XRF data in tabular form, and Attachment 15 provides the results of SAM analysis of Cedar trees applied to all Granby imagery, using data collected during the May survey. Attachment 16 provides
Figure 11 - Cedar Berries in Zinc Contaminated Area
Left Peaks
Center Peaks
Figure 12 - Aurora Sycamore Signatures

13
comments by the MoRAP imagery analyst regarding the Cedar SAM analysis. The following are observations:
- The 2005 imagery used for the Cedar analysis had been manually plotted as part of the Pilot Project. Coordinates generated from the imagery were estimated to be one to five meters off from the same locations developed in GIS. Therefore, locations of specific Cedar trees obtained in the field survey and used to develop spectral signatures for the Cedar analysis, Attachment 15, may not accurately reflect the tree versus the surrounding vegetation. In some spectral libraries, Figure 13, some types of grasses have signatures similar to a general classification of conifer and deciduous trees. However, as seen in Figure 14, there are distinguishable differences in some tree species signatures. The fact that grassy areas showed up in the SAM analysis of Granby Cedar may be an indication that the target signature may have included surrounding vegetation or that the grassy areas that were highlighted have a signature close to Cedar trees.
- Conifer trees in southwest Missouri, may be the best year round contamination indicator since they are evergreen. The best time for collection may be during the winter when leaves are off deciduous trees and grass is brown. Pine trees were used in a European study to identify the extent of contamination from a zinc smelter.
- Cedar has shallow roots and would be better at reflecting contamination in surface, near-surface areas.
- The Cedar trees in Aurora, Baldwin Park, and Granby mining areas generally appeared dwarfed compared to non-mining areas. The Cedar in the Granby smelter bag house area was short and did not have thick foliage. This Cedar was the only tree where lead was detected in the needles by the XRF.
- Attachment 15 provides the spectral signatures, and soil and leaf zinc levels for nine Cedar trees in Aurora and Granby. One Aurora tree, A15, is in a non-contaminated residential area. No soil sample was obtained, but the needles had low zinc levels. The other Aurora tree, A10, was in the Baldwin Park mining area, and did have relatively high zinc readings for both soil and needles. Average soil zinc levels were higher in Granby, approximately 18,000 ppm, than Aurora, approximately 5,000 ppm. One Granby tree, G19E, is in the highly contaminated lead/zinc smelter area on a hill above the downtown area. The remaining trees are in the two abandoned mining areas. Figure 15, from Attachment 15, provides the spectral signatures of
Blue - GrassGreen - DeciduousRed - Conifer
Figure 13 - Tree and Grass Signatures
Green - Blue SpruceRed - Dry Long GrassWhite - Juniper Bush
Figure 14 - Vegetation Signatures

14
the Aurora and Granby Cedar trees. As noted above and in Figure 13, some grasses, and deciduous and conifer trees have similar signatures. Figure 12, Sycamore, and 15, Cedar, are also similar, and both have two peaks in the signatures that may provide a means to measure zinc levels. If the center peaks for Cedar are used, the top three signatures correlate to the three highest levels of zinc in soil. These top three soil readings are two to three times higher than the next two trees, and significantly higher than the remaining trees. If the center peaks provide an indication of levels of contamination, there may be sufficient separation to be used for characterizing contaminated areas.
- Attachment 15 includes an overlay of known zinc mining sites from the Inventory of Mines, Occurrences and Prospects (IMOP) database on the imaged area of Granby. An outline of the mining areas is then overlaid on each SAM analysis of each Cedar signature. While there may have been other mining sites that were not included in the database, the overlay represents the general areas that should have been contaminated from mine waste. The following are observations of the possible validity of the SAM analysis using the overlays for keys.
Tree G-2 (soil 1,022 ppm Pb/ 29,574 ppm Zn). G-2 is one of the three trees with highest soil zinc levels. The signature has highlighted (dense correlation) large numbers of trees both inside and out of the known mining sites. There are also many grassy areas highlighted, the deeper red or healthier grass, including the grassy area in the city park, residential areas east of the park and the mining areas. An XRF sample of a dug out area in the grass on the city park hillside registered 5,000 ppm Pb, and a grassy area in a park drainage ditch registered 900 ppm Pb. The correlation to trees in all areas is medium (about half of all trees had the same signature).
Tree G-6 (soil 504 ppm Pb/ 4,622 Zn). The correlation to trees is less dense throughout the imagery, particularly outside the mining sites and grassy areas. Several trees are identified in the city park, but no grass. The limited number of grassy areas may mean less miss-correlation. Tree correlation around the mining and residential areas is highest of all survey trees. This is one of two trees with low lead and zinc readings.
Tree G-8 (soil 373 ppm Pb/ 12,921 Zn). This tree has similar low lead and zinc readings as G-6, and similar less dense correlation throughout the imagery. The highest correlation is to trees, with minimal grass correlation.
Tree G-16 (soil 1,145 ppm Pb/ 39,832 Zn). This signature had equal correlation with trees and grass in all areas both inside and out of known mining areas. There was medium correlation for trees and grassy areas around the park, as well as south and east of the smelter bag house.
Left Peaks
Center Peaks
Figure 15 - Cedar Spectral Signatures

15
Tree G-17 (soil 1,354 ppm Pb/ 13,950 Zn). The signature had medium levels of correlation both inside and out of the known mining areas. There was less correlation to grass and trees around the smelter than G-16. There was high grass correlation around mine sites.
Tree G-18 (soil 291 ppm Pb/ 16,934 Zn). This signature had the highest correlation of grass and trees outside the known mining areas. Grass correlation was high around residential, mining and smelter areas, with low tree correlation.
Tree G-19E (soil 55,215 ppm Pb/ 67,637 Zn). This was the tree at the abandoned smelter bag house. The correlation to grass around the smelter was the highest. Correlation to grass in mining and residential areas was also among the highest. Correlation to trees was among the lowest in all areas. Because of the size of this tree, dwarfed with sparse foliage, the spectral signature probably included soil or other vegetation in the area.
General. It appears that the higher the zinc levels the more grassy areas and less trees are correlated. If the grassy areas are masked out, this may be the best characterization of the areas of highest contamination based on the Cedar trees. Some types of grass have similar signatures to conifer, and this may be the cause for miss-correlation. Alternatively, the correlation may be an indication that the grass is in zinc contaminated areas. The lower the zinc level, the lower the correlation to grass and higher correlation to trees. More trees, particularly outside the mining area, should have less zinc. The only grass areas that were tested were the city park, some high readings, and the athletic complex, low or non-detect readings.
- Initial sampling of Cedar needles and soil beneath the trees in SW MO and the Jefferson City-Lake Ozark areas indicates that Cedar tissue zinc samples (XRF) are positively correlated to soil zinc samples (XRF). Attachment 17 provides the graph and sample data from non-contaminated areas. Attachment 11 provides the sample data for Aurora and Granby. It appears that Cedar is a good candidate for HSI work. The following are observations:
Zinc occurred in every SW MO mining site visited.
Tissue zinc is correlated with soil zinc.
Cedar is easily picked out on an aerial photo.
Cedar is generally a large enough target for HSI work.
Cedar can be imaged year round, and there is less interference from deciduous trees in the fall/winter.
- Catalpa trees were also noted in Granby
contaminated areas. The tree has large leaves that may provide more area for signature analysis. Catalpa was not found in Aurora.
Figure 16 - Zinc in Soil and Cedar

16
2.2 Task 2 - Southeast Missouri Lead Contamination
2.2.1 Washington County Review of 2005 Imagery
The objective of Task 2, if funding and time permitted, was: to identify known contaminated areas in Potosi and Mineral Point, potential tailings deposition along the Big River, and contamination from haul roads and smelting in Herculaneum. UMC would conduct end member and SAM analysis of HSI from the 2005 Pilot Project; and FFS would collect XRF readings to verify analysis. Attachment 18 provides the Work Plan for Task 2, and Attachment 19 provides Amendment 1 to the UMC Cooperative Agreement to fund HSI analysis for Task 2. Because of limited time and funding, only Activity 2, end member analysis, was conducted with Washington County PMs. The following are results of end member analysis of Big River and Herculaneum.
2.2.2 Big River End Member Analysis
Attachment 20 provides HSI of Big River, both unanalyzed and after the end member analysis. During the 2005 Pilot Project, a SAM analysis was conducted using a location of know contamination near the river, identified by the PM, to develop a spectral signature for river deposition. The signature appeared to identify areas of deposition along the river. For this task, an end member analysis was conducted on each segment of imagery. On April 25, 2007, the Section PM reviewed the end member analysis. The following are observations.
- ARCHER imagery is stored in one-minute segments. SAM signatures can be applied to all segments with consistent results across segments. However, the end member analysis is run on each segment independently, producing different results for each segment. The end member process assigns a color to each pixel depending on the signature. A signature database is established with a new color assigned to each new signature until every unique signature has a color. As it identifies a signature in the database, it assigns that color. Unfortunately, it begins the process over with each segment, so that colors in one segment will represent different signatures in each segment.
- Much of the track was partially cloud covered, obstructing analysis.
- Because of the limited imagery of the Big River and cloud coverage, there was no noticeable correlation of mine waste to deposition from the end member analysis.
2.2.3 Herculaneum End Member Analysis
Attachment 21 provides an end member analysis of August 2005 HSI of the town of Herculaneum, the lead smelter, and the smelter slag pile south of the plant. It also provides a composite end member analysis of a larger area around the smelter using June 2007 HSI. The June 2007 imagery will be used for the SFY '08 project. On April 25, 2007, the Section PM reviewed the 2005 end member analysis. The following are observations.
- There are locations in the residential area west of the smelter and along the Joachim Creek with signatures similar to the smelter grounds.
- There are several signatures in the slag pile area that are similar to locations in the residential area and along the Joachim Creek.

17
- Many of the residential streets have signatures similar to areas in the slag pile. This could be dust from hauling ore or wind blown from the smelter and slag pile. However, the mine waste signature that appeared to identify roads made from reused mine waste in Aurora was not accurate.
General. There are many locations outside the smelter and slag pile with similar signatures. However, without field survey, no conclusions can be drawn. Sampling of soils, trees and other vegetation will be required to determine which signatures may provide an insight into the extent of contamination. This will be accomplished as part of the SFY 2008 project.