missouri deer season summary & population … deer season summary & population status report...
TRANSCRIPT
2016Missouri Deer Season Summary & Population Status Report
Missouri Department of Conservation
Prepared by:
Alicia Lombardo & Whitney Haslag
Resource Science Division
2016 Missouri Deer Season Summary & Population Status Report
Our Mission and Vision
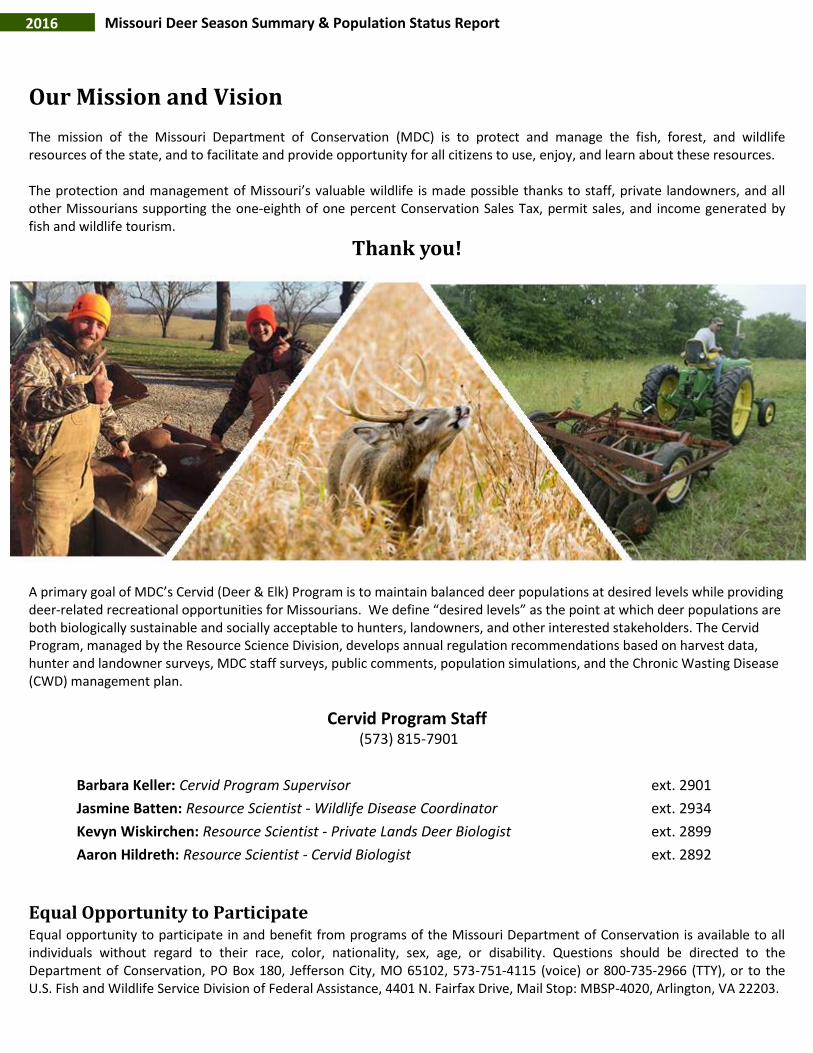
The mission of the Missouri Department of Conservation (MDC) is to protect and manage the fish, forest, and wildlife resources of the state, and to facilitate and provide opportunity for all citizens to use, enjoy, and learn about these resources.
The protection and management of Missouri’s valuable wildlife is made possible thanks to staff, private landowners, and all other Missourians supporting the one-eighth of one percent Conservation Sales Tax, permit sales, and income generated by fish and wildlife tourism.
Thank you!
A primary goal of MDC’s Cervid (Deer & Elk) Program is to maintain balanced deer populations at desired levels while providing deer-related recreational opportunities for Missourians. We define “desired levels” as the point at which deer populations are both biologically sustainable and socially acceptable to hunters, landowners, and other interested stakeholders. The Cervid Program, managed by the Resource Science Division, develops annual regulation recommendations based on harvest data, hunter and landowner surveys, MDC staff surveys, public comments, population simulations, and the Chronic Wasting Disease (CWD) management plan.
Cervid Program Staff (573) 815-7901
Barbara Keller: Cervid Program Supervisor ext. 2901
Jasmine Batten: Resource Scientist - Wildlife Disease Coordinator ext. 2934
Kevyn Wiskirchen: Resource Scientist - Private Lands Deer Biologist ext. 2899
Aaron Hildreth: Resource Scientist - Cervid Biologist ext. 2892
Equal Opportunity to Participate Equal opportunity to participate in and benefit from programs of the Missouri Department of Conservation is available to all individuals without regard to their race, color, nationality, sex, age, or disability. Questions should be directed to the Department of Conservation, PO Box 180, Jefferson City, MO 65102, 573-751-4115 (voice) or 800-735-2966 (TTY), or to the U.S. Fish and Wildlife Service Division of Federal Assistance, 4401 N. Fairfax Drive, Mail Stop: MBSP-4020, Arlington, VA 22203.
2016 Missouri Deer Season Summary & Population Status Report
2016 Overview Season Dates
Archery Deer and Turkey
Sept. 15-Nov. 11, 2016Nov. 23, 2016-Jan. 15, 2017
Firearms Deer Early Youth Portion
Oct. 29-30, 2016
Firearms Deer November Portion
Nov. 12-22, 2016
Firearms Deer Late Youth Portion
Nov. 25-27, 2016
Firearms DeerAntlerless Portion
Dec.2-4, 2016
Firearms DeerAlternative Methods Portion
Dec. 24, 2016-Jan. 3, 2017
What Was New for 2016?
The urban zone portion of firearms deer season was eliminated.
Crossbows were legalized as an archery method and could be used during the archery deer and turkey season.
Hunters could take only two antlered deer during the archery and firearms deer seasons combined. Only one antlered deer could be taken prior to the November portion of firearms season.
Hunters who harvested deer during opening weekend within the Chronic Wasting Disease (CWD) Management Zone were required to take it to a sampling station to be tested for CWD.
New counties were added to the CWD Management Zone.
Hunters were asked new questions when Telechecking a deer.
Hunters could fill two firearms antlerless permits in Carroll, Crawford, Franklin, Gasconade, Jefferson, Livingston, Warren and Washington counties.
Qualifying landowners in Crawford and Washington counties could receive two no-cost firearms antlerless permits.
Crawford, Franklin, Jefferson and Warren counties were open during the antlerless portion of firearms season.
New managed deer hunts were added and others were modified or removed.
Deer hunting regulations changed for most conservation areas.
The antler-point restriction was lifted in Carroll, Franklin, Gasconade, Jefferson, Warren and Washington counties.
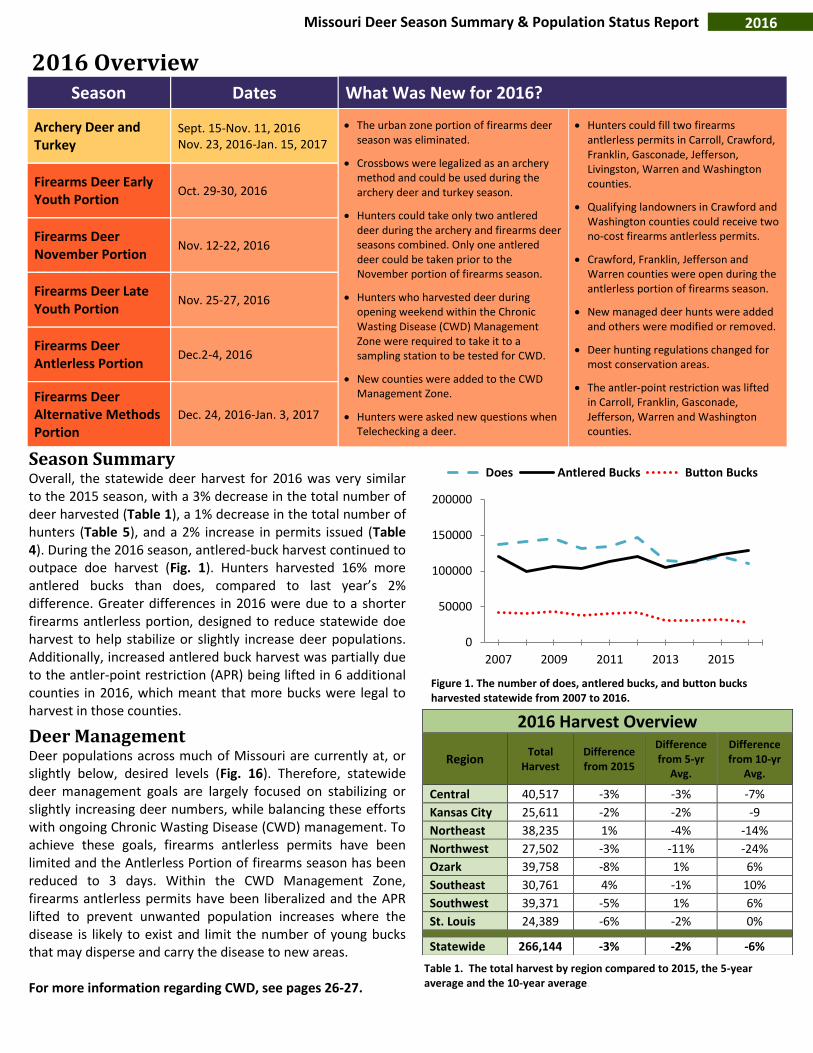
Season Summary Overall, the statewide deer harvest for 2016 was very similar to the 2015 season, with a 3% decrease in the total number of deer harvested (Table 1), a 1% decrease in the total number of hunters (Table 5), and a 2% increase in permits issued (Table 4). During the 2016 season, antlered-buck harvest continued to outpace doe harvest (Fig. 1). Hunters harvested 16% more antlered bucks than does, compared to last year’s 2% difference. Greater differences in 2016 were due to a shorter firearms antlerless portion, designed to reduce statewide doe harvest to help stabilize or slightly increase deer populations. Additionally, increased antlered buck harvest was partially due to the antler-point restriction (APR) being lifted in 6 additional counties in 2016, which meant that more bucks were legal to harvest in those counties.
Deer Management Deer populations across much of Missouri are currently at, or slightly below, desired levels (Fig. 16). Therefore, statewide deer management goals are largely focused on stabilizing or slightly increasing deer numbers, while balancing these efforts with ongoing Chronic Wasting Disease (CWD) management. To achieve these goals, firearms antlerless permits have been limited and the Antlerless Portion of firearms season has been reduced to 3 days. Within the CWD Management Zone, firearms antlerless permits have been liberalized and the APR lifted to prevent unwanted population increases where the disease is likely to exist and limit the number of young bucks that may disperse and carry the disease to new areas.
For more information regarding CWD, see pages 26-27.
0
50000
100000
150000
200000
2007 2009 2011 2013 2015
Does Antlered Bucks Button Bucks
Figure 1. The number of does, antlered bucks, and button bucks harvested statewide from 2007 to 2016.
2016 Harvest Overview
RegionTotal
HarvestDifference from 2015
Difference from 5-yr
Avg.
Difference from 10-yr
Avg.
Central 40,517 -3% -3% -7%
Kansas City 25,611 -2% -2% -9
Northeast 38,235 1% -4% -14%
Northwest 27,502 -3% -11% -24%
Ozark 39,758 -8% 1% 6%
Southeast 30,761 4% -1% 10%
Southwest 39,371 -5% 1% 6%
St. Louis 24,389 -6% -2% 0%
Statewide 266,144 -3% -2% -6%
Table 1. The total harvest by region compared to 2015, the 5-year average and the 10-year average.
2016 Missouri Deer Season Summary & Population Status Report
2016 Deer Season Summaries
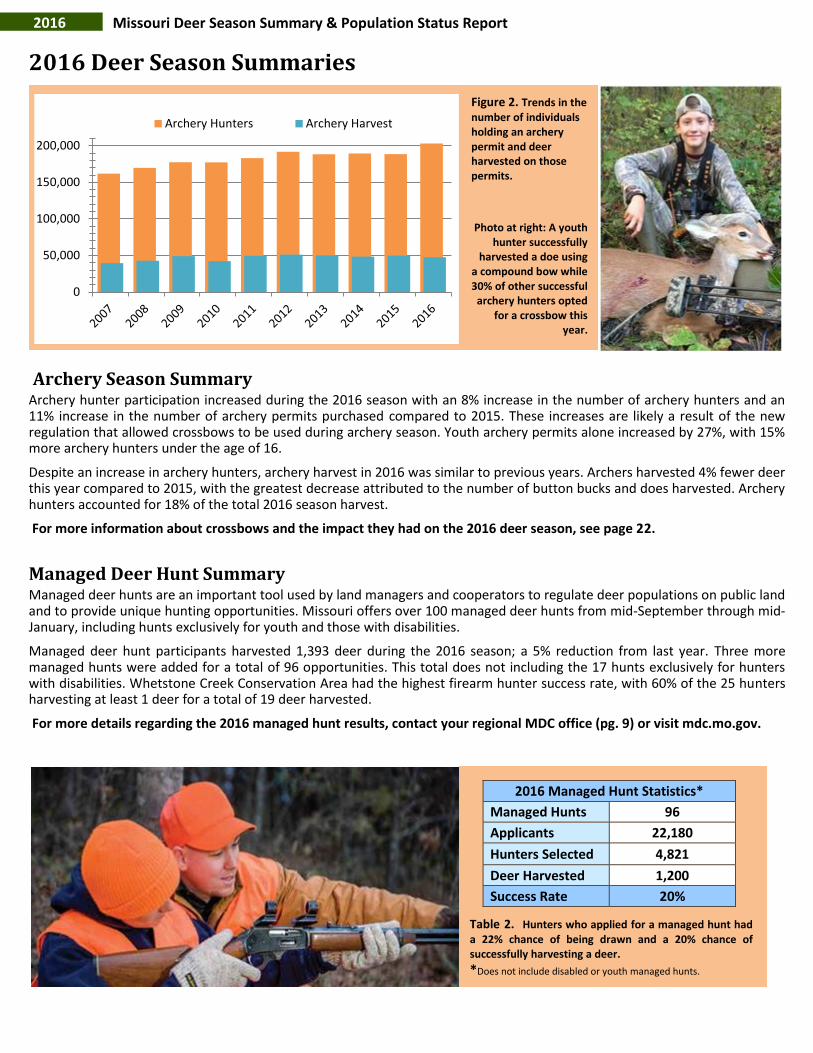
0
50,000
100,000
150,000
200,000
Archery Hunters Archery Harvest
Figure 2. Trends in the number of individuals holding an archery permit and deer harvested on those permits.
Photo at right: A youth hunter successfully
harvested a doe using a compound bow while 30% of other successful
archery hunters opted for a crossbow this
year.
Archery Season Summary Archery hunter participation increased during the 2016 season with an 8% increase in the number of archery hunters and an 11% increase in the number of archery permits purchased compared to 2015. These increases are likely a result of the new regulation that allowed crossbows to be used during archery season. Youth archery permits alone increased by 27%, with 15% more archery hunters under the age of 16.
Despite an increase in archery hunters, archery harvest in 2016 was similar to previous years. Archers harvested 4% fewer deer this year compared to 2015, with the greatest decrease attributed to the number of button bucks and does harvested. Archery hunters accounted for 18% of the total 2016 season harvest.
For more information about crossbows and the impact they had on the 2016 deer season, see page 22.
Managed Deer Hunt Summary Managed deer hunts are an important tool used by land managers and cooperators to regulate deer populations on public land and to provide unique hunting opportunities. Missouri offers over 100 managed deer hunts from mid-September through mid-January, including hunts exclusively for youth and those with disabilities.
Managed deer hunt participants harvested 1,393 deer during the 2016 season; a 5% reduction from last year. Three more managed hunts were added for a total of 96 opportunities. This total does not including the 17 hunts exclusively for hunters with disabilities. Whetstone Creek Conservation Area had the highest firearm hunter success rate, with 60% of the 25 hunters harvesting at least 1 deer for a total of 19 deer harvested.
For more details regarding the 2016 managed hunt results, contact your regional MDC office (pg. 9) or visit mdc.mo.gov.
Table 2. Hunters who applied for a managed hunt had a 22% chance of being drawn and a 20% chance of successfully harvesting a deer.
*Does not include disabled or youth managed hunts.
2016 Managed Hunt Statistics*
Managed Hunts 96
Applicants 22,180
Hunters Selected 4,821
Deer Harvested 1,200
Success Rate 20%
2016 Missouri Deer Season Summary & Population Status Report
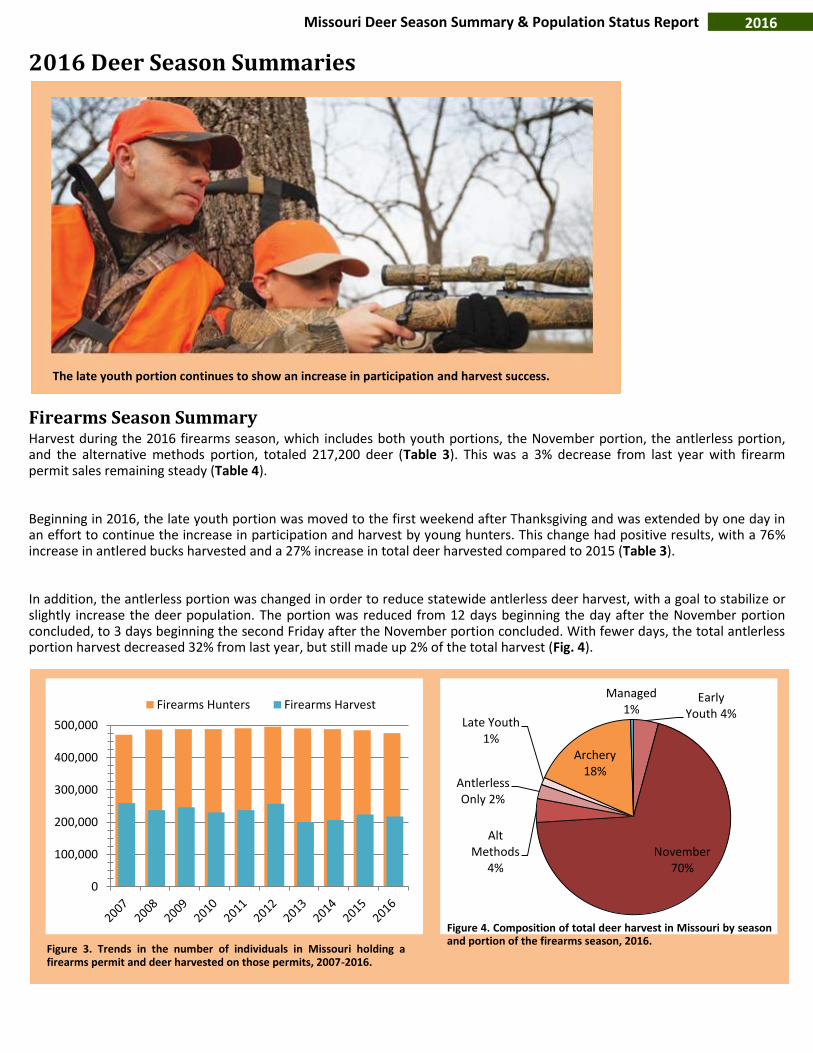
The late youth portion continues to show an increase in participation and harvest success.
2016 Deer Season Summaries
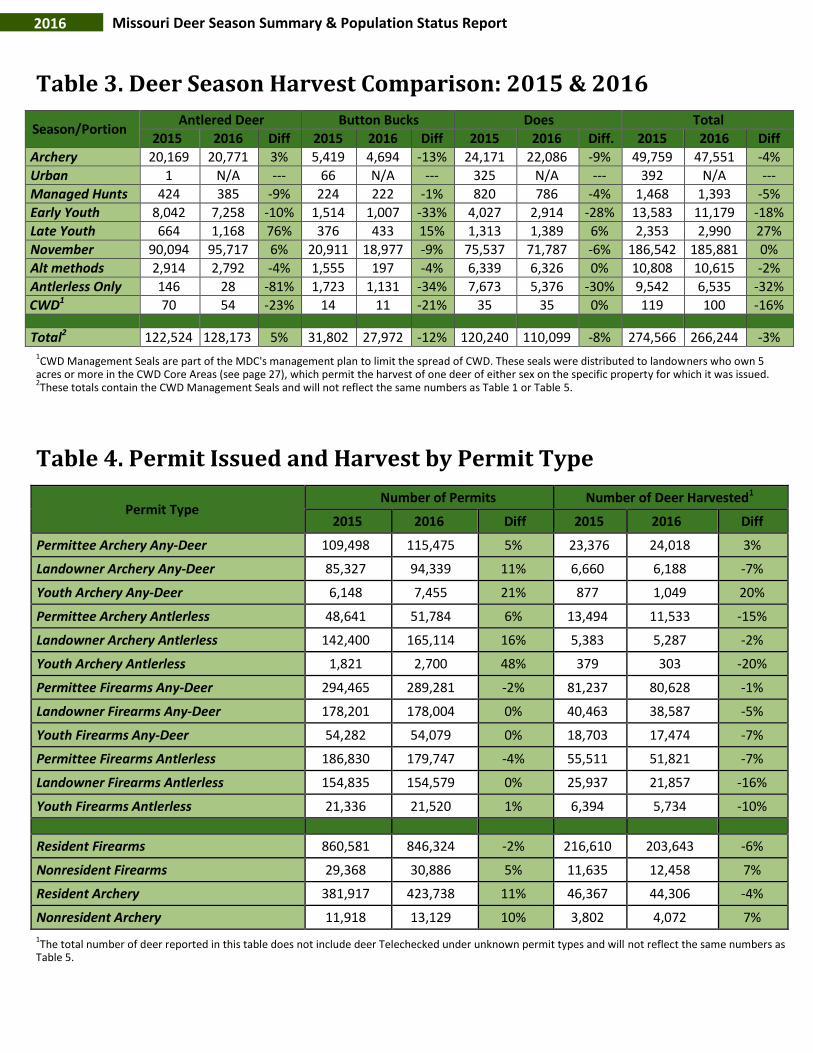
Firearms Season Summary Harvest during the 2016 firearms season, which includes both youth portions, the November portion, the antlerless portion, and the alternative methods portion, totaled 217,200 deer (Table 3). This was a 3% decrease from last year with firearm permit sales remaining steady (Table 4).
Beginning in 2016, the late youth portion was moved to the first weekend after Thanksgiving and was extended by one day in an effort to continue the increase in participation and harvest by young hunters. This change had positive results, with a 76% increase in antlered bucks harvested and a 27% increase in total deer harvested compared to 2015 (Table 3).
In addition, the antlerless portion was changed in order to reduce statewide antlerless deer harvest, with a goal to stabilize or slightly increase the deer population. The portion was reduced from 12 days beginning the day after the November portion concluded, to 3 days beginning the second Friday after the November portion concluded. With fewer days, the total antlerless portion harvest decreased 32% from last year, but still made up 2% of the total harvest (Fig. 4).
Figure 3. Trends in the number of individuals in Missouri holding a firearms permit and deer harvested on those permits, 2007-2016.
0
100,000
200,000
300,000
400,000
500,000
Firearms Hunters Firearms HarvestEarly
Youth 4%
November 70%
Alt Methods
4%
Antlerless Only 2%
Late Youth 1%
Archery 18%
Managed 1%
Figure 4. Composition of total deer harvest in Missouri by season and portion of the firearms season, 2016.
2016 Missouri Deer Season Summary & Population Status Report
Table 3. Deer Season Harvest Comparison: 2015 & 2016
Season/PortionAntlered Deer Button Bucks Does Total
2015 2016 Diff 2015 2016 Diff 2015 2016 Diff. 2015 2016 Diff
Archery 20,169 20,771 3% 5,419 4,694 -13% 24,171 22,086 -9% 49,759 47,551 -4%
Urban 1 N/A --- 66 N/A --- 325 N/A --- 392 N/A ---
Managed Hunts 424 385 -9% 224 222 -1% 820 786 -4% 1,468 1,393 -5%
Early Youth 8,042 7,258 -10% 1,514 1,007 -33% 4,027 2,914 -28% 13,583 11,179 -18%
Late Youth 664 1,168 76% 376 433 15% 1,313 1,389 6% 2,353 2,990 27%
November 90,094 95,717 6% 20,911 18,977 -9% 75,537 71,787 -6% 186,542 185,881 0%
Alt methods 2,914 2,792 -4% 1,555 197 -4% 6,339 6,326 0% 10,808 10,615 -2%
Antlerless Only 146 28 -81% 1,723 1,131 -34% 7,673 5,376 -30% 9,542 6,535 -32%
CWD1 70 54 -23% 14 11 -21% 35 35 0% 119 100 -16%
Total2 122,524 128,173 5% 31,802 27,972 -12% 120,240 110,099 -8% 274,566 266,244 -3%1CWD Management Seals are part of the MDC's management plan to limit the spread of CWD. These seals were distributed to landowners who own 5
acres or more in the CWD Core Areas (see page 27), which permit the harvest of one deer of either sex on the specific property for which it was issued.2These totals contain the CWD Management Seals and will not reflect the same numbers as Table 1 or Table 5.
Table 4. Permit Issued and Harvest by Permit Type
Permit Type Number of Permits Number of Deer Harvested1
2015 2016 Diff 2015 2016 Diff
Permittee Archery Any-Deer 109,498 115,475 5% 23,376 24,018 3%
Landowner Archery Any-Deer 85,327 94,339 11% 6,660 6,188 -7%
Youth Archery Any-Deer 6,148 7,455 21% 877 1,049 20%
Permittee Archery Antlerless 48,641 51,784 6% 13,494 11,533 -15%
Landowner Archery Antlerless 142,400 165,114 16% 5,383 5,287 -2%
Youth Archery Antlerless 1,821 2,700 48% 379 303 -20%
Permittee Firearms Any-Deer 294,465 289,281 -2% 81,237 80,628 -1%
Landowner Firearms Any-Deer 178,201 178,004 0% 40,463 38,587 -5%
Youth Firearms Any-Deer 54,282 54,079 0% 18,703 17,474 -7%
Permittee Firearms Antlerless 186,830 179,747 -4% 55,511 51,821 -7%
Landowner Firearms Antlerless 154,835 154,579 0% 25,937 21,857 -16%
Youth Firearms Antlerless 21,336 21,520 1% 6,394 5,734 -10%
Resident Firearms 860,581 846,324 -2% 216,610 203,643 -6%
Nonresident Firearms 29,368 30,886 5% 11,635 12,458 7%
Resident Archery 381,917 423,738 11% 46,367 44,306 -4%
Nonresident Archery 11,918 13,129 10% 3,802 4,072 7%
1The total number of deer reported in this table does not include deer Telechecked under unknown permit types and will not reflect the same numbers as
Table 5.

2016 Missouri Deer Season Summary & Population Status Report
Table 5. Deer Hunter and Harvest Facts
Archery Firearms Archery & Firearms Combined
Age Distribution of Hunters Number of Hunters Total Hunters1
10 or younger 2,604 22,385 22,647
11-15 10,969 45,509 46,647
16-40 85,967 175,141 189,814
41 or older 103,558 232,376 242,468
Total Hunters 203,098 475,411 501,576
Any-Deer Permits Issued Number of Hunters Number of Hunters1
Resident 112,280 322,395 341,225
Nonresident 10,650 20,965 28,586
Landowner 94,339 178,004 180,634
Antlerless Permits Issued Number of Hunters Total Hunters
1 41,489 174,603 216,092
2 5,228 12,181 17,409
3 491 483 974
4 or more 236 185 421
Deer Harvested Number of Hunters Number of Hunters2
0 165,199 295,187 300,675
1 30,203 147,704 152,152
2 5,848 28,798 37,721
3 1,283 3,371 8,091
4 or more 565 351 2,937
Antlered Deer Harvested Number of Hunters Number of Hunters2
0 182,485 369,242 380,483
1 20,079 105,498 114,319
2 475 653 6,656
Deer Harvested Percent of Hunters Percent of Hunters2
0 81% 62% 60%
1 15% 31% 30%
2 3% 6% 8%
3 or more 0.9% 0.8% 2%
Antlered Deer Harvested Percent of Hunters Percent of Hunters2
0 90% 78% 75%
1 10% 22% 25%
2 0.2% 0.1% 0.2% 1Number of individuals that held an archery and/or firearms any-deer permit 2Number/percent of individuals that harvested the specified number of deer when combining their archery and firearms harvest
2016 Missouri Deer Season Summary & Population Status Report
Regional Deer Populations
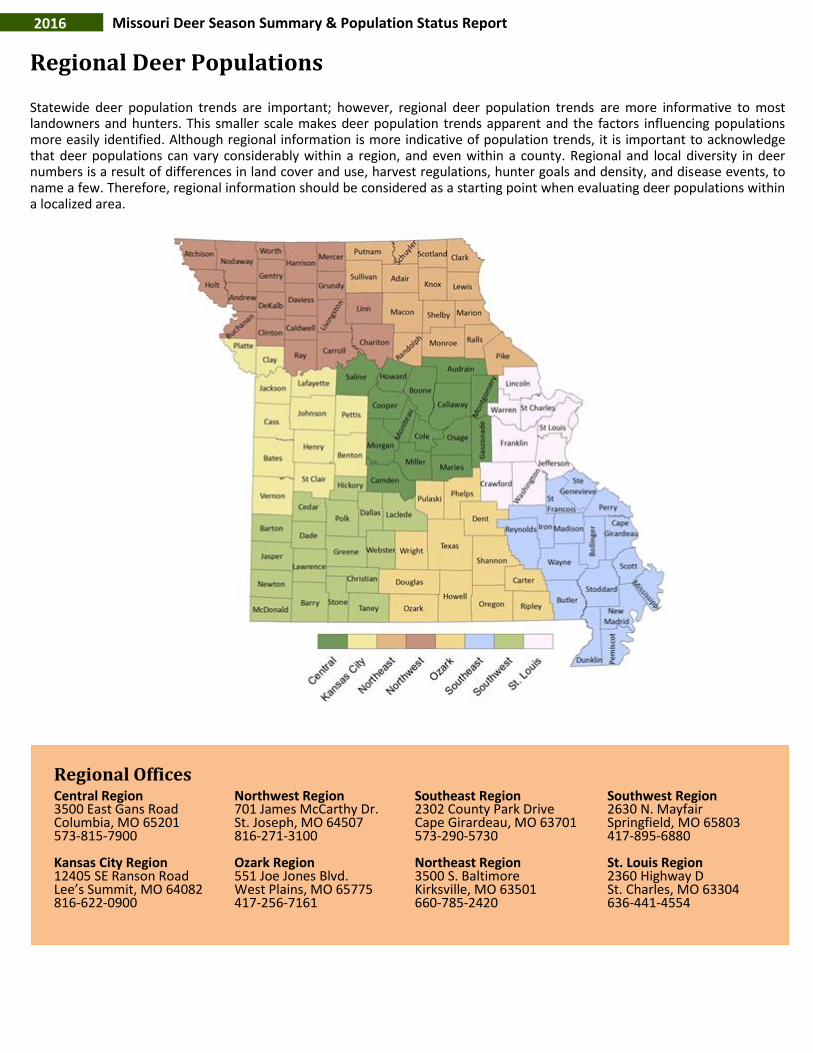
Statewide deer population trends are important; however, regional deer population trends are more informative to most landowners and hunters. This smaller scale makes deer population trends apparent and the factors influencing populations more easily identified. Although regional information is more indicative of population trends, it is important to acknowledge that deer populations can vary considerably within a region, and even within a county. Regional and local diversity in deer numbers is a result of differences in land cover and use, harvest regulations, hunter goals and density, and disease events, to name a few. Therefore, regional information should be considered as a starting point when evaluating deer populations within a localized area.
Regional Offices Central Region 3500 East Gans Road Columbia, MO 65201 573-815-7900 Kansas City Region 12405 SE Ranson Road Lee’s Summit, MO 64082 816-622-0900
Northwest Region 701 James McCarthy Dr. St. Joseph, MO 64507 816-271-3100 Ozark Region 551 Joe Jones Blvd. West Plains, MO 65775 417-256-7161
Southeast Region 2302 County Park Drive Cape Girardeau, MO 63701 573-290-5730 Northeast Region 3500 S. Baltimore Kirksville, MO 63501 660-785-2420
Southwest Region 2630 N. Mayfair Springfield, MO 65803 417-895-6880 St. Louis Region 2360 Highway D St. Charles, MO 63304 636-441-4554

2016 Missouri Deer Season Summary & Population Status Report
Regional Deer Summaries
Central Region In 2016, the Central Region had the highest regional deer harvest with a total of 40,517 deer (Table 6) which was 3% lower than the total for 2015. The deer population in the Central Region is still slowly recovering from a low point in 2013 following a particularly extreme outbreak of hemorrhagic disease in 2012. Overall, the population is well below the biological carrying capacity for the Central Region, and according to recent survey results, deer populations remain at, or slightly below, the socially acceptable level (Fig. 16). The top five harvest counties for 2016 were the same as in 2015 and include Callaway, Morgan, Osage, Camden and Gasconade (Table 6). Callaway County is still the top-harvesting county despite a 5% decrease from 2015. Most of the Central Region is within a CWD Management Zone due to the CWD positive deer detected in Cole County in 2014.
See page 26-27 for more about CWD.
Figure 5. Total harvest breakdown for the Central Region from 2007-
2016.
Kansas City Region Total harvest for the Kansas City Region was 2% lower in 2016 than in 2015. Over the past 10 years, the region’s deer population has been fairly stable, with a slight decrease in 2013 following a severe outbreak of hemorrhagic disease in 2012. Recently, the deer population in the Kansas City Region has been stable to slightly decreasing (Fig. 17). Counties with the highest harvest in 2016 include Benton, St. Clair, Vernon, Henry and Johnson (Table 6). Benton County had a 2% increase in harvest from 2015; whereas, St. Clair County had nearly a 5% decrease in harvest. In order to help increase the deer population across much of Missouri, antlerless permits have been limited and the antlerless season was shortened to 3 days.
Figure 6. Total harvest breakdown for the Kansas City Region from
2007-2016.
Two antlered bucks harvested in St. Clair County tested positive for CWD bringing the total
number of CWD-positive cases in Missouri to 9 for this past season. These are the first 2
cases of CWD for this county and for western Missouri.
See page 26-27 for more about CWD.
2016 Missouri Deer Season Summary & Population Status Report
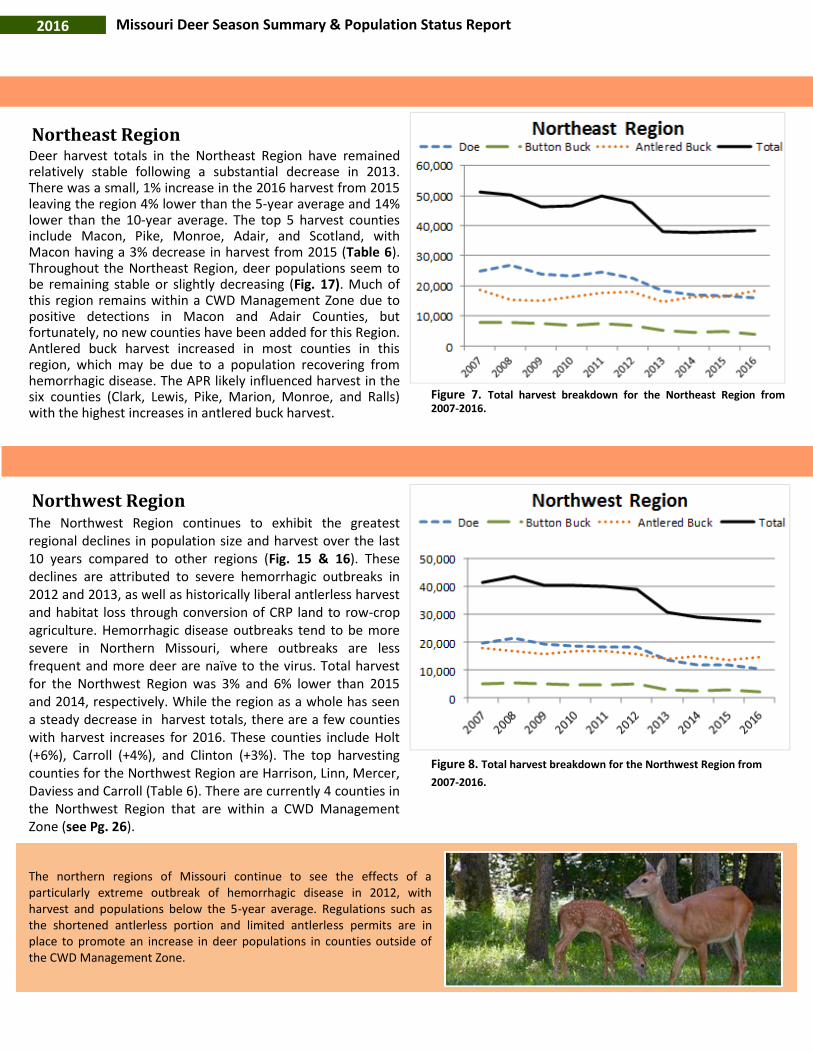
Northeast Region Deer harvest totals in the Northeast Region have remained relatively stable following a substantial decrease in 2013. There was a small, 1% increase in the 2016 harvest from 2015 leaving the region 4% lower than the 5-year average and 14% lower than the 10-year average. The top 5 harvest counties include Macon, Pike, Monroe, Adair, and Scotland, with Macon having a 3% decrease in harvest from 2015 (Table 6). Throughout the Northeast Region, deer populations seem to be remaining stable or slightly decreasing (Fig. 17). Much of this region remains within a CWD Management Zone due to positive detections in Macon and Adair Counties, but fortunately, no new counties have been added for this Region. Antlered buck harvest increased in most counties in this region, which may be due to a population recovering from hemorrhagic disease. The APR likely influenced harvest in the six counties (Clark, Lewis, Pike, Marion, Monroe, and Ralls) with the highest increases in antlered buck harvest.
Figure 7. Total harvest breakdown for the Northeast Region from 2007-2016.
Northwest Region The Northwest Region continues to exhibit the greatest regional declines in population size and harvest over the last 10 years compared to other regions (Fig. 15 & 16). These declines are attributed to severe hemorrhagic outbreaks in 2012 and 2013, as well as historically liberal antlerless harvest and habitat loss through conversion of CRP land to row-crop agriculture. Hemorrhagic disease outbreaks tend to be more severe in Northern Missouri, where outbreaks are less frequent and more deer are naïve to the virus. Total harvest for the Northwest Region was 3% and 6% lower than 2015 and 2014, respectively. While the region as a whole has seen a steady decrease in harvest totals, there are a few counties with harvest increases for 2016. These counties include Holt (+6%), Carroll (+4%), and Clinton (+3%). The top harvesting counties for the Northwest Region are Harrison, Linn, Mercer, Daviess and Carroll (Table 6). There are currently 4 counties in the Northwest Region that are within a CWD Management Zone (see Pg. 26).
Figure 8. Total harvest breakdown for the Northwest Region from
2007-2016.
The northern regions of Missouri continue to see the effects of a particularly extreme outbreak of hemorrhagic disease in 2012, with harvest and populations below the 5-year average. Regulations such as the shortened antlerless portion and limited antlerless permits are in place to promote an increase in deer populations in counties outside of the CWD Management Zone.
2016 Missouri Deer Season Summary & Population Status Report
Regional Deer Summaries
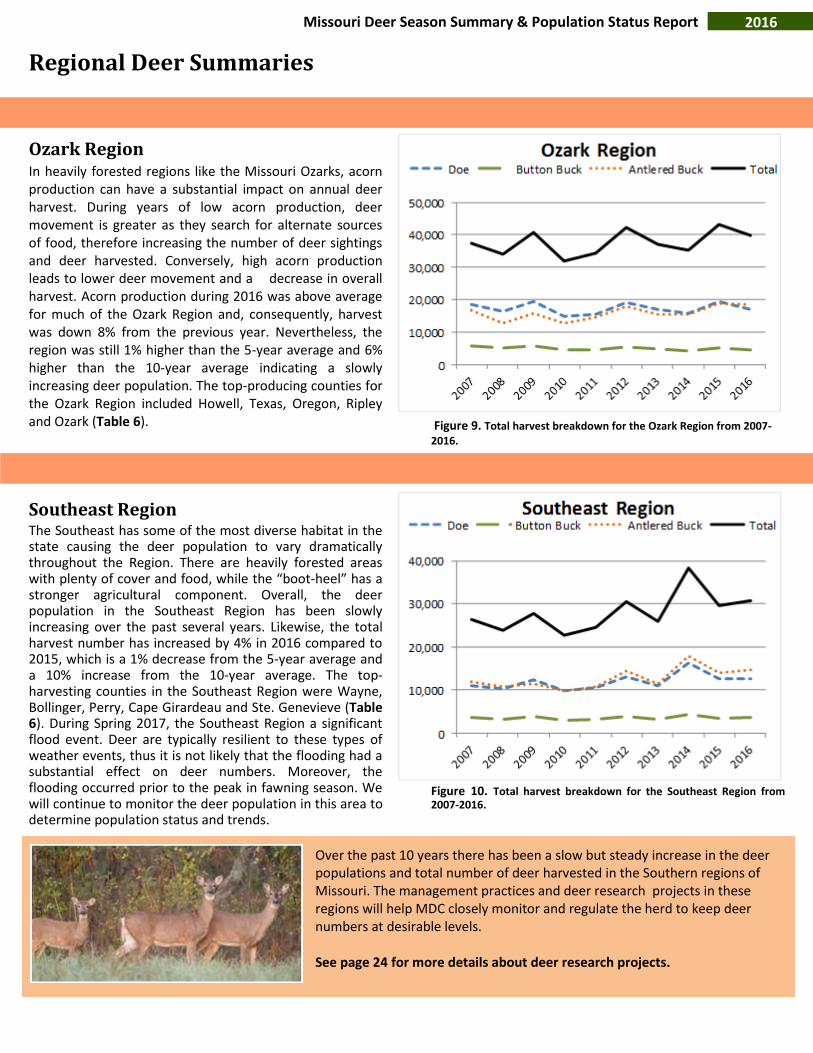
Ozark Region In heavily forested regions like the Missouri Ozarks, acorn production can have a substantial impact on annual deer harvest. During years of low acorn production, deer movement is greater as they search for alternate sources of food, therefore increasing the number of deer sightings and deer harvested. Conversely, high acorn production leads to lower deer movement and a decrease in overall harvest. Acorn production during 2016 was above average for much of the Ozark Region and, consequently, harvest was down 8% from the previous year. Nevertheless, the region was still 1% higher than the 5-year average and 6% higher than the 10-year average indicating a slowly increasing deer population. The top-producing counties for the Ozark Region included Howell, Texas, Oregon, Ripley and Ozark (Table 6).
Figure 9. Total harvest breakdown for the Ozark Region from 2007-2016.
Southeast Region The Southeast has some of the most diverse habitat in the state causing the deer population to vary dramatically throughout the Region. There are heavily forested areas with plenty of cover and food, while the “boot-heel” has a stronger agricultural component. Overall, the deer population in the Southeast Region has been slowly increasing over the past several years. Likewise, the total harvest number has increased by 4% in 2016 compared to 2015, which is a 1% decrease from the 5-year average and a 10% increase from the 10-year average. The top-harvesting counties in the Southeast Region were Wayne, Bollinger, Perry, Cape Girardeau and Ste. Genevieve (Table 6). During Spring 2017, the Southeast Region a significant flood event. Deer are typically resilient to these types of weather events, thus it is not likely that the flooding had a substantial effect on deer numbers. Moreover, the flooding occurred prior to the peak in fawning season. We will continue to monitor the deer population in this area to determine population status and trends.
Figure 10. Total harvest breakdown for the Southeast Region from 2007-2016.
Over the past 10 years there has been a slow but steady increase in the deer populations and total number of deer harvested in the Southern regions of Missouri. The management practices and deer research projects in these regions will help MDC closely monitor and regulate the herd to keep deer numbers at desirable levels. See page 24 for more details about deer research projects.
2016 Missouri Deer Season Summary & Population Status Report
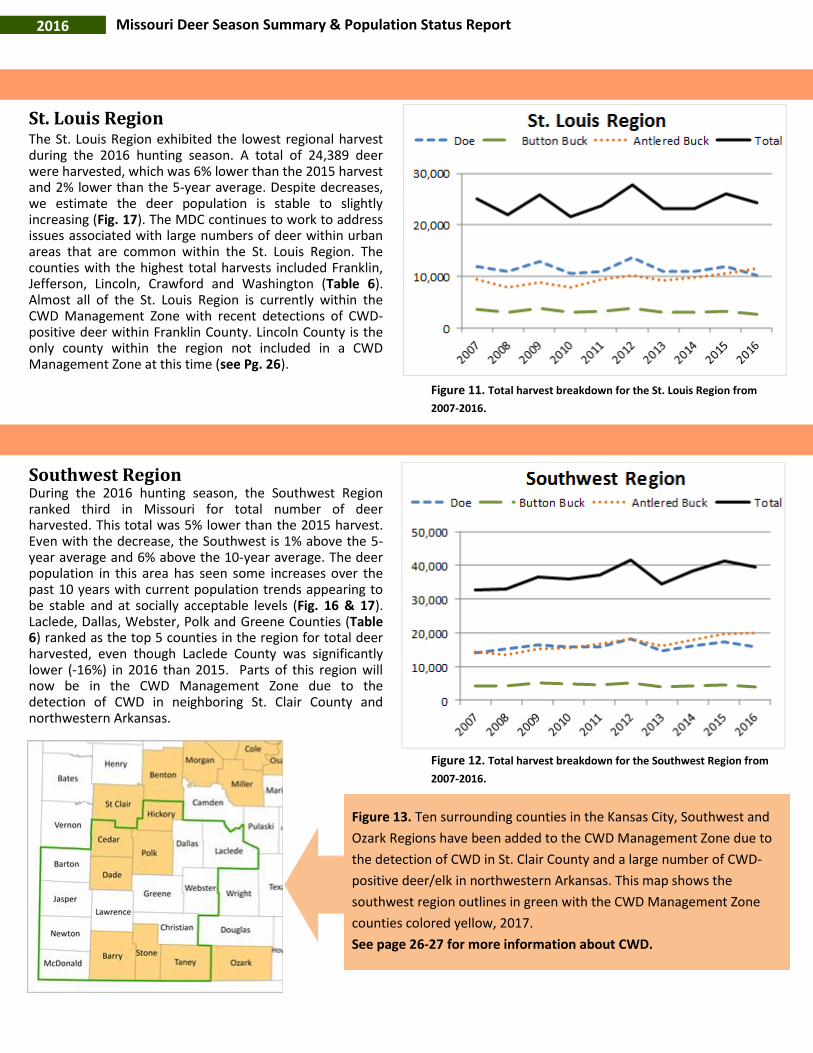
St. Louis Region The St. Louis Region exhibited the lowest regional harvest during the 2016 hunting season. A total of 24,389 deer were harvested, which was 6% lower than the 2015 harvest and 2% lower than the 5-year average. Despite decreases, we estimate the deer population is stable to slightly increasing (Fig. 17). The MDC continues to work to address issues associated with large numbers of deer within urban areas that are common within the St. Louis Region. The counties with the highest total harvests included Franklin, Jefferson, Lincoln, Crawford and Washington (Table 6). Almost all of the St. Louis Region is currently within the CWD Management Zone with recent detections of CWD-positive deer within Franklin County. Lincoln County is the only county within the region not included in a CWD Management Zone at this time (see Pg. 26).
Figure 11. Total harvest breakdown for the St. Louis Region from
2007-2016.
Southwest Region During the 2016 hunting season, the Southwest Region ranked third in Missouri for total number of deer harvested. This total was 5% lower than the 2015 harvest. Even with the decrease, the Southwest is 1% above the 5-year average and 6% above the 10-year average. The deer population in this area has seen some increases over the past 10 years with current population trends appearing to be stable and at socially acceptable levels (Fig. 16 & 17). Laclede, Dallas, Webster, Polk and Greene Counties (Table 6) ranked as the top 5 counties in the region for total deer harvested, even though Laclede County was significantly lower (-16%) in 2016 than 2015. Parts of this region will now be in the CWD Management Zone due to the detection of CWD in neighboring St. Clair County and northwestern Arkansas.
Figure 12. Total harvest breakdown for the Southwest Region from
2007-2016.
Figure 13. Ten surrounding counties in the Kansas City, Southwest and
Ozark Regions have been added to the CWD Management Zone due to
the detection of CWD in St. Clair County and a large number of CWD-
positive deer/elk in northwestern Arkansas. This map shows the
southwest region outlines in green with the CWD Management Zone
counties colored yellow, 2017.
See page 26-27 for more information about CWD.
2016 Missouri Deer Season Summary & Population Status Report
County Deer Population Trends
Deer populations are highly variable within a state, region, and even county due to variation in habitat, harvest regulations, local hunter goals and practices, hunter density, amount of public and private land, and disease outbreaks (e.g., hemorrhagic disease). Therefore, county-wide assessments of deer population trends are not applicable to every local situation, but are a general representation of the current status and population trend for each respective county.
The Cervid Program evaluates a variety of data to assess county-specific deer populations and for regulation development including:
Harvest data—The total number and composition (antlered bucks, does, and button bucks) of harvested deer.
Population data— Population simulations incorporating harvest, age-at-harvest data, and estimated survival/reproduction rates.
Hunter, landowner, and staff surveys — Hunters and landowners are randomly selected to receive mail surveys.
Public & staff input — Input is received via email, the MDC website, public meetings, and phone calls.
Social data is critical when assessing the deer population in relation to public acceptance
levels. In cooperation with the USDA, we send out surveys statewide to 9,000 agricultural
producers to assess perceptions and attitudes toward deer populations and regulations.
Additionally, we survey 35,000 archery hunters and 50,000 firearm hunters in order to
estimate hunter effort, hunter density, and opinions concerning deer populations and
regulations. We also incorporate public comments received throughout the year via the
web, letters, calls, social media, public meetings, emails, and any other feedback.
The Deer Program reviews all this information annually on a county-by-county basis to classify the deer population status and trends (Fig. 16 & 17). Socially acceptable levels (cultural carrying capacity) are the first thing we look at when classifying the status of the deer population. While biological carrying capacity, or the habitat’s limitations on the number of deer that can be supported, is included within our assessment, generally cultural carrying capacity will be met first. We aim for this goal because agricultural producers, motorists, and other stakeholders will often not tolerate deer population levels at biological carrying capacity. By monitoring the population trends for each county we are able to gain an understanding of where the population is headed and adjust harvest regulations accordingly.
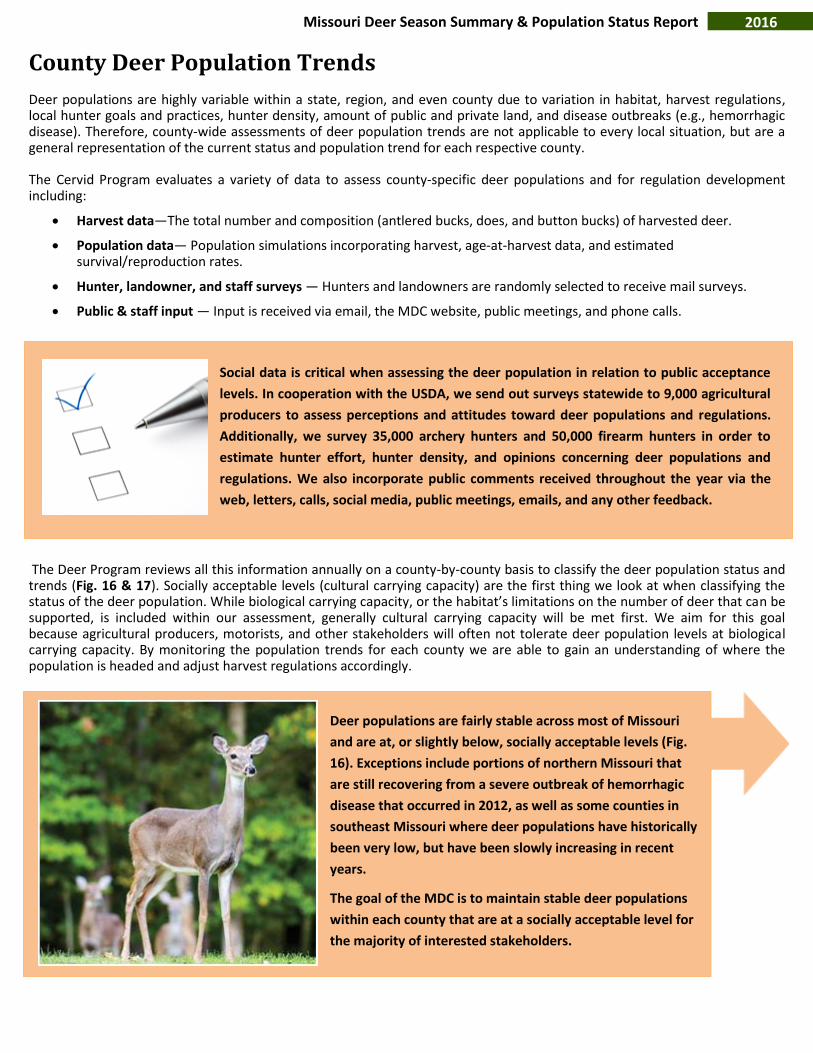
Deer populations are fairly stable across most of Missouri
and are at, or slightly below, socially acceptable levels (Fig.
16). Exceptions include portions of northern Missouri that
are still recovering from a severe outbreak of hemorrhagic
disease that occurred in 2012, as well as some counties in
southeast Missouri where deer populations have historically
been very low, but have been slowly increasing in recent
years.
The goal of the MDC is to maintain stable deer populations
within each county that are at a socially acceptable level for
the majority of interested stakeholders.
2016 Missouri Deer Season Summary & Population Status Report
County Deer Statistics
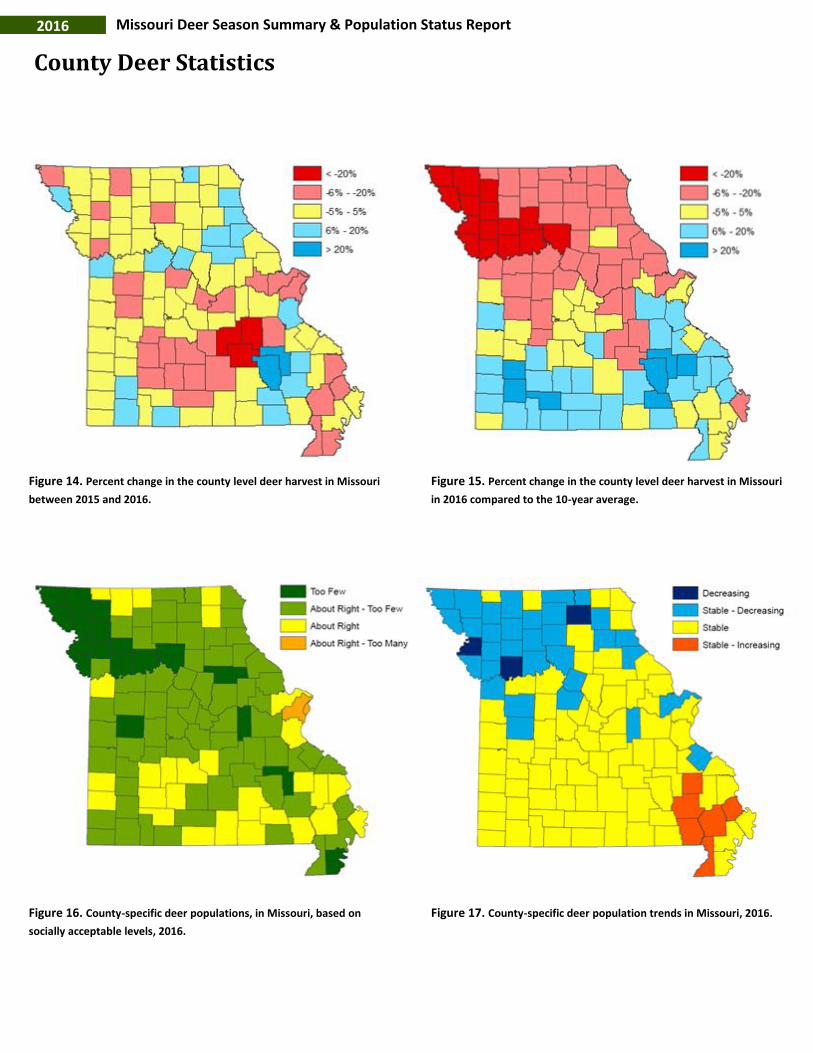
Figure 14. Percent change in the county level deer harvest in Missouri
between 2015 and 2016.
Figure 15. Percent change in the county level deer harvest in Missouri
in 2016 compared to the 10-year average.
Figure 16. County-specific deer populations, in Missouri, based on
socially acceptable levels, 2016.
Figure 17. County-specific deer population trends in Missouri, 2016.
2016 Missouri Deer Season Summary & Population Status Report
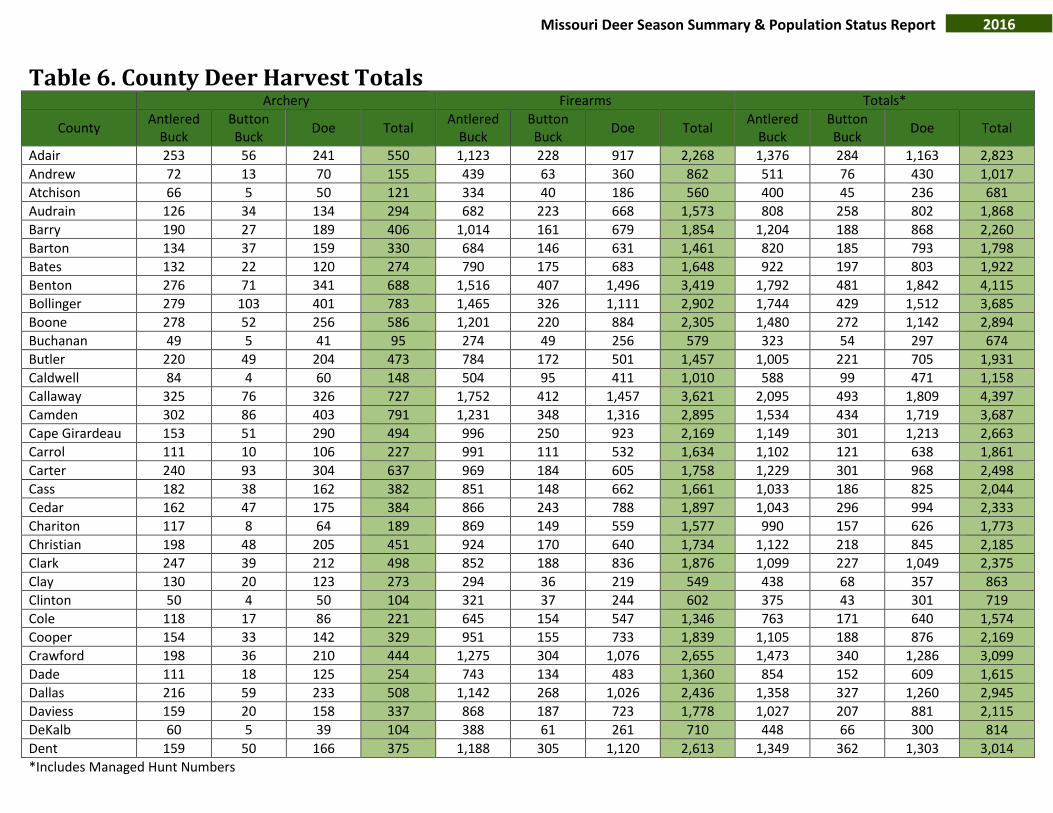
Table 6. County Deer Harvest Totals Archery Firearms Totals*
CountyAntlered
BuckButton Buck
Doe TotalAntlered
BuckButton Buck
Doe TotalAntlered
BuckButton Buck
Doe Total
Adair 253 56 241 550 1,123 228 917 2,268 1,376 284 1,163 2,823
Andrew 72 13 70 155 439 63 360 862 511 76 430 1,017
Atchison 66 5 50 121 334 40 186 560 400 45 236 681
Audrain 126 34 134 294 682 223 668 1,573 808 258 802 1,868
Barry 190 27 189 406 1,014 161 679 1,854 1,204 188 868 2,260
Barton 134 37 159 330 684 146 631 1,461 820 185 793 1,798
Bates 132 22 120 274 790 175 683 1,648 922 197 803 1,922
Benton 276 71 341 688 1,516 407 1,496 3,419 1,792 481 1,842 4,115
Bollinger 279 103 401 783 1,465 326 1,111 2,902 1,744 429 1,512 3,685
Boone 278 52 256 586 1,201 220 884 2,305 1,480 272 1,142 2,894
Buchanan 49 5 41 95 274 49 256 579 323 54 297 674
Butler 220 49 204 473 784 172 501 1,457 1,005 221 705 1,931
Caldwell 84 4 60 148 504 95 411 1,010 588 99 471 1,158
Callaway 325 76 326 727 1,752 412 1,457 3,621 2,095 493 1,809 4,397
Camden 302 86 403 791 1,231 348 1,316 2,895 1,534 434 1,719 3,687
Cape Girardeau 153 51 290 494 996 250 923 2,169 1,149 301 1,213 2,663
Carrol 111 10 106 227 991 111 532 1,634 1,102 121 638 1,861
Carter 240 93 304 637 969 184 605 1,758 1,229 301 968 2,498
Cass 182 38 162 382 851 148 662 1,661 1,033 186 825 2,044
Cedar 162 47 175 384 866 243 788 1,897 1,043 296 994 2,333
Chariton 117 8 64 189 869 149 559 1,577 990 157 626 1,773
Christian 198 48 205 451 924 170 640 1,734 1,122 218 845 2,185
Clark 247 39 212 498 852 188 836 1,876 1,099 227 1,049 2,375
Clay 130 20 123 273 294 36 219 549 438 68 357 863
Clinton 50 4 50 104 321 37 244 602 375 43 301 719
Cole 118 17 86 221 645 154 547 1,346 763 171 640 1,574
Cooper 154 33 142 329 951 155 733 1,839 1,105 188 876 2,169
Crawford 198 36 210 444 1,275 304 1,076 2,655 1,473 340 1,286 3,099
Dade 111 18 125 254 743 134 483 1,360 854 152 609 1,615
Dallas 216 59 233 508 1,142 268 1,026 2,436 1,358 327 1,260 2,945
Daviess 159 20 158 337 868 187 723 1,778 1,027 207 881 2,115
DeKalb 60 5 39 104 388 61 261 710 448 66 300 814
Dent 159 50 166 375 1,188 305 1,120 2,613 1,349 362 1,303 3,014
*Includes Managed Hunt Numbers

2016 Missouri Deer Season Summary & Population Status Report
Table 6. County Deer Harvest Totals Archery Firearms Totals*
County Antlered
Buck Button Buck
Doe Total Antlered
Buck Button Buck
Doe Total Antlered
Buck Button Buck
Doe Total
Douglas 181 41 198 420 1,391 272 985 2,648 1,572 313 1,184 3,069
Dunklin 30 12 40 82 185 26 131 342 215 38 171 424
Franklin 406 91 384 881 2,159 473 1,753 4,385 2,566 565 2,138 5,269
Gasconade 245 39 185 469 1,471 293 987 2,751 1,716 332 1,172 3,220
Gentry 100 11 75 186 564 94 448 1,106 664 105 523 1,292
Green 318 65 330 713 919 180 752 1,851 1,241 248 1,104 2,593
Grundy 125 20 117 262 658 113 504 1,275 783 133 621 1,537
Harrison 242 33 219 494 1,247 180 822 2,249 1,489 213 1,040 2,742
Henry 163 50 196 409 946 287 971 2,204 1,109 337 1,168 2,614
Hickory 168 49 156 373 894 264 863 2,021 1,063 317 1,024 2,404
Holt 75 8 72 155 401 70 283 754 479 78 356 913
Howard 163 30 129 322 917 154 774 1,845 1,082 192 912 2,186
Howell 356 81 368 805 1,950 470 2,004 4,424 2,306 551 2,372 5,229
Iron 83 28 73 184 777 174 463 1,414 860 202 537 1,599
Jackson 284 49 303 636 392 70 266 728 740 164 771 1,675
Jasper 240 39 232 511 998 179 654 1,831 1,238 218 887 2,343
Jefferson 435 123 560 1,118 1,688 333 1,356 3,377 2,124 457 1,916 4,497
Johnson 123 37 149 309 882 199 747 1,828 1,005 236 898 2,139
Knox 235 37 185 457 979 180 862 2,021 1,214 217 1,047 2,478
Laclede 252 67 287 606 1,496 337 1,194 3,027 1,748 404 1,481 3,633
Lafayette 51 23 78 152 477 85 427 989 528 108 505 1,141
Lawrence 159 28 151 338 834 140 554 1,528 993 168 705 1,866
Lewis 157 28 163 348 799 217 740 1,756 956 245 903 2,104
Lincoln 220 68 282 570 1,154 257 1,154 2,565 1,374 325 1,437 3,136
Linn 217 37 195 449 1,158 184 742 2,084 1,376 221 938 2,535
Livingston 141 13 96 250 742 99 487 1,328 883 112 584 1,579
Macon 315 59 266 640 1,637 347 1,370 3,354 1,952 406 1,636 3,994
Madison 148 51 228 427 936 235 686 1,857 1,084 286 914 2,284
Maries 169 52 189 410 790 214 785 1,789 959 266 974 2,199
Marion 146 39 157 342 684 196 647 1,527 830 235 804 1,869
McDonald 163 17 122 302 815 108 464 1,387 978 125 587 1,690
*Includes Managed Hunt Numbers
2016 Missouri Deer Season Summary & Population Status Report
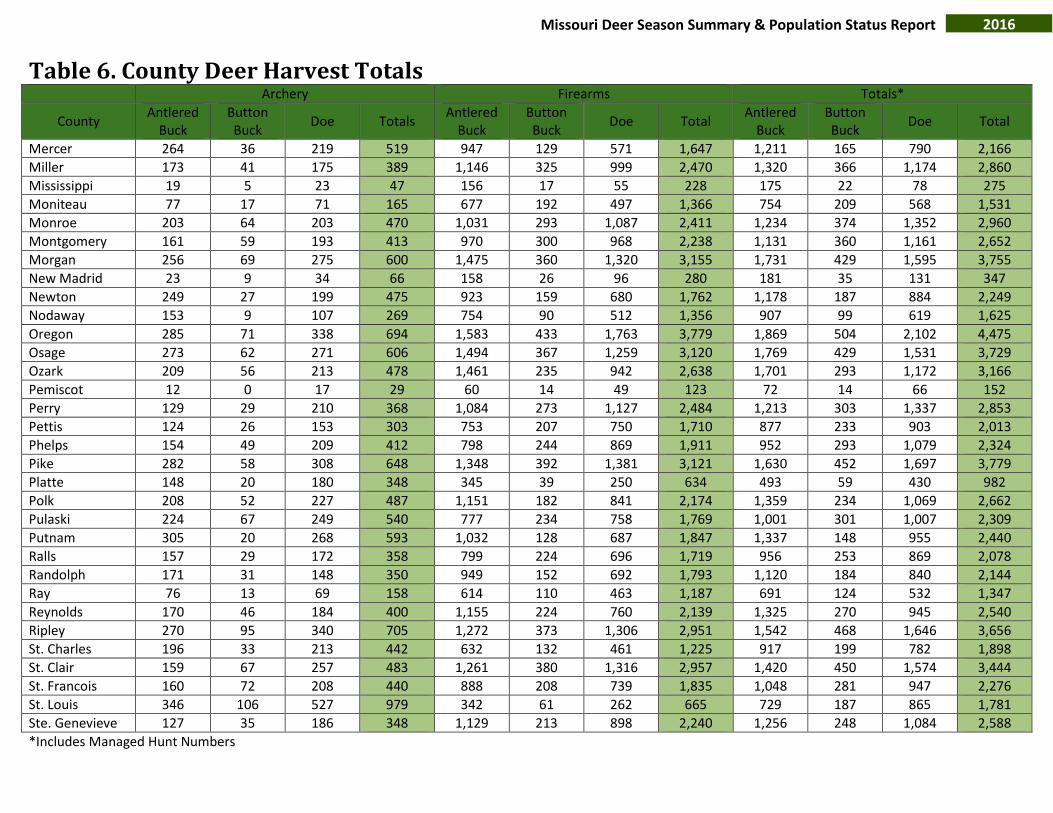
Table 6. County Deer Harvest Totals Archery Firearms Totals*
County Antlered
Buck Button Buck
Doe Totals Antlered
Buck Button Buck
Doe Total Antlered
Buck Button Buck
Doe Total
Mercer 264 36 219 519 947 129 571 1,647 1,211 165 790 2,166
Miller 173 41 175 389 1,146 325 999 2,470 1,320 366 1,174 2,860
Mississippi 19 5 23 47 156 17 55 228 175 22 78 275
Moniteau 77 17 71 165 677 192 497 1,366 754 209 568 1,531
Monroe 203 64 203 470 1,031 293 1,087 2,411 1,234 374 1,352 2,960
Montgomery 161 59 193 413 970 300 968 2,238 1,131 360 1,161 2,652
Morgan 256 69 275 600 1,475 360 1,320 3,155 1,731 429 1,595 3,755
New Madrid 23 9 34 66 158 26 96 280 181 35 131 347
Newton 249 27 199 475 923 159 680 1,762 1,178 187 884 2,249
Nodaway 153 9 107 269 754 90 512 1,356 907 99 619 1,625
Oregon 285 71 338 694 1,583 433 1,763 3,779 1,869 504 2,102 4,475
Osage 273 62 271 606 1,494 367 1,259 3,120 1,769 429 1,531 3,729
Ozark 209 56 213 478 1,461 235 942 2,638 1,701 293 1,172 3,166
Pemiscot 12 0 17 29 60 14 49 123 72 14 66 152
Perry 129 29 210 368 1,084 273 1,127 2,484 1,213 303 1,337 2,853
Pettis 124 26 153 303 753 207 750 1,710 877 233 903 2,013
Phelps 154 49 209 412 798 244 869 1,911 952 293 1,079 2,324
Pike 282 58 308 648 1,348 392 1,381 3,121 1,630 452 1,697 3,779
Platte 148 20 180 348 345 39 250 634 493 59 430 982
Polk 208 52 227 487 1,151 182 841 2,174 1,359 234 1,069 2,662
Pulaski 224 67 249 540 777 234 758 1,769 1,001 301 1,007 2,309
Putnam 305 20 268 593 1,032 128 687 1,847 1,337 148 955 2,440
Ralls 157 29 172 358 799 224 696 1,719 956 253 869 2,078
Randolph 171 31 148 350 949 152 692 1,793 1,120 184 840 2,144
Ray 76 13 69 158 614 110 463 1,187 691 124 532 1,347
Reynolds 170 46 184 400 1,155 224 760 2,139 1,325 270 945 2,540
Ripley 270 95 340 705 1,272 373 1,306 2,951 1,542 468 1,646 3,656
St. Charles 196 33 213 442 632 132 461 1,225 917 199 782 1,898
St. Clair 159 67 257 483 1,261 380 1,316 2,957 1,420 450 1,574 3,444
St. Francois 160 72 208 440 888 208 739 1,835 1,048 281 947 2,276
St. Louis 346 106 527 979 342 61 262 665 729 187 865 1,781
Ste. Genevieve 127 35 186 348 1,129 213 898 2,240 1,256 248 1,084 2,588
*Includes Managed Hunt Numbers
2016 Missouri Deer Season Summary & Population Status Report
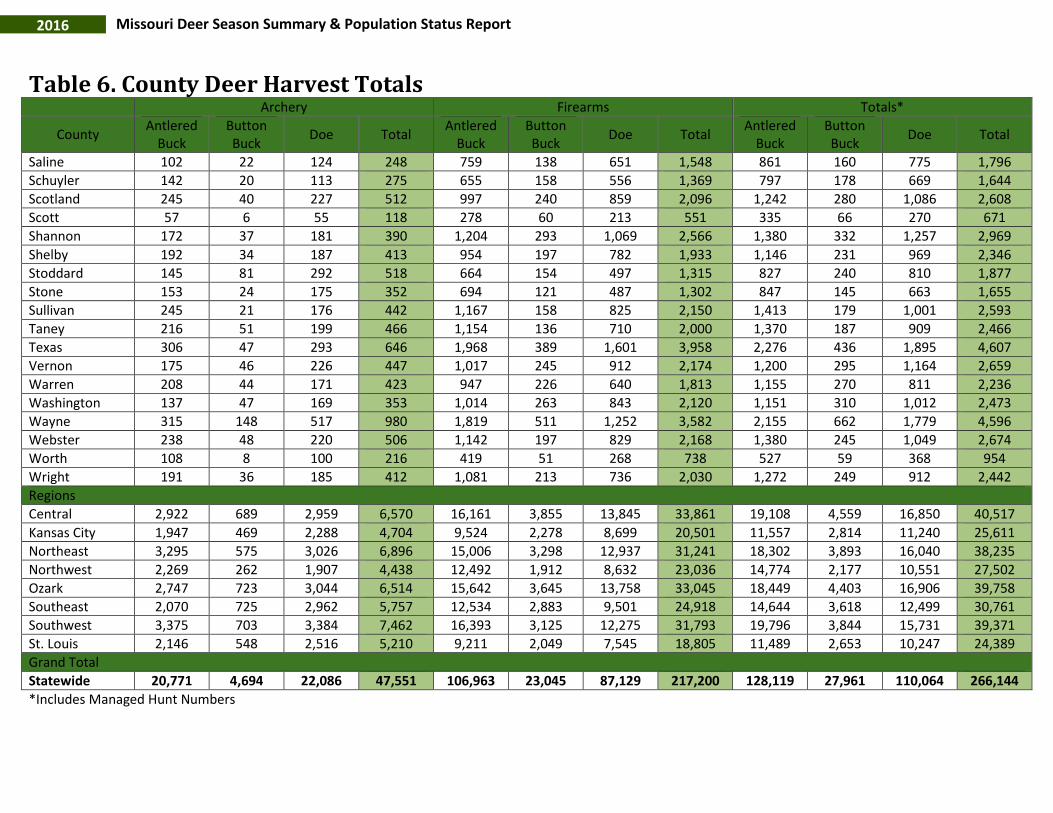
Table 6. County Deer Harvest Totals Archery Firearms Totals*
County Antlered
Buck Button Buck
Doe Total Antlered
Buck Button Buck
Doe Total Antlered
Buck Button Buck
Doe Total
Saline 102 22 124 248 759 138 651 1,548 861 160 775 1,796
Schuyler 142 20 113 275 655 158 556 1,369 797 178 669 1,644
Scotland 245 40 227 512 997 240 859 2,096 1,242 280 1,086 2,608
Scott 57 6 55 118 278 60 213 551 335 66 270 671
Shannon 172 37 181 390 1,204 293 1,069 2,566 1,380 332 1,257 2,969
Shelby 192 34 187 413 954 197 782 1,933 1,146 231 969 2,346
Stoddard 145 81 292 518 664 154 497 1,315 827 240 810 1,877
Stone 153 24 175 352 694 121 487 1,302 847 145 663 1,655
Sullivan 245 21 176 442 1,167 158 825 2,150 1,413 179 1,001 2,593
Taney 216 51 199 466 1,154 136 710 2,000 1,370 187 909 2,466
Texas 306 47 293 646 1,968 389 1,601 3,958 2,276 436 1,895 4,607
Vernon 175 46 226 447 1,017 245 912 2,174 1,200 295 1,164 2,659
Warren 208 44 171 423 947 226 640 1,813 1,155 270 811 2,236
Washington 137 47 169 353 1,014 263 843 2,120 1,151 310 1,012 2,473
Wayne 315 148 517 980 1,819 511 1,252 3,582 2,155 662 1,779 4,596
Webster 238 48 220 506 1,142 197 829 2,168 1,380 245 1,049 2,674
Worth 108 8 100 216 419 51 268 738 527 59 368 954
Wright 191 36 185 412 1,081 213 736 2,030 1,272 249 912 2,442
Regions
Central 2,922 689 2,959 6,570 16,161 3,855 13,845 33,861 19,108 4,559 16,850 40,517
Kansas City 1,947 469 2,288 4,704 9,524 2,278 8,699 20,501 11,557 2,814 11,240 25,611
Northeast 3,295 575 3,026 6,896 15,006 3,298 12,937 31,241 18,302 3,893 16,040 38,235
Northwest 2,269 262 1,907 4,438 12,492 1,912 8,632 23,036 14,774 2,177 10,551 27,502
Ozark 2,747 723 3,044 6,514 15,642 3,645 13,758 33,045 18,449 4,403 16,906 39,758
Southeast 2,070 725 2,962 5,757 12,534 2,883 9,501 24,918 14,644 3,618 12,499 30,761
Southwest 3,375 703 3,384 7,462 16,393 3,125 12,275 31,793 19,796 3,844 15,731 39,371
St. Louis 2,146 548 2,516 5,210 9,211 2,049 7,545 18,805 11,489 2,653 10,247 24,389
Grand Total
Statewide 20,771 4,694 22,086 47,551 106,963 23,045 87,129 217,200 128,119 27,961 110,064 266,144
*Includes Managed Hunt Numbers
2016 Missouri Deer Season Summary & Population Status Report
Adjusting Management to Changing Deer & Hunter Populations
Advancements in Knowledge and Recent Challenges As technology advances, we are certainly able to learn more about wildlife than ever before. With greater insight, the MDC has the opportunity to address some more complicated management objectives with respect to Missouri’s natural resources, including white-tailed deer. Prior to the 1980’s, deer management efforts in Missouri were focused on re-establishing and growing healthy populations statewide. By the late 1980’s, this goal had been achieved within the Northern and Central Regions of Missouri, resulting in management techniques shifting toward the liberalization of hunting quotas in order to prevent overabundance. From there, deer management has become more involved as we work to fine-tune socially acceptable deer populations throughout the state.
To address this overarching objective, deer management in Missouri is focused on establishing and achieving population goals on a more localized level. Regulations and management decisions are considered on a county-by-county basis, which requires an intimate understanding of localized deer populations, as well as stakeholder concerns and opinions.
In order to be successful, we have taken steps to better understand the movement and home ranges of deer across the landscape, patterns of deer mortality and reproduction (see page 24), and changes in hunter participation (see page 21). We are also addressing new challenges by gathering age-at-harvest data through Telecheck measurements and tooth samples. By having a better idea of the age at which deer are harvested, we can apply this information to accurately model population growth at the county level (see page 20).
In order to address changes in Missouri’s hunter population and participation rates, MDC periodically employs new regulations as well as outreach and education tactics that facilitate hunter recruitment and retention. The legalization of crossbows during archery season and hunting clinics designed for beginning hunters are examples of a recent changes made by the Department in response to changes in hunter participation.
Managing wildlife populations for the enjoyment of Missourians may not always be easy, but the Missouri Department of Conservation is up to the task. The MDC will continue to embrace new challenges by employing advances in technology in order to gain further insight and will work with Missourians to ensure our deer and elk populations remain balanced and healthy.
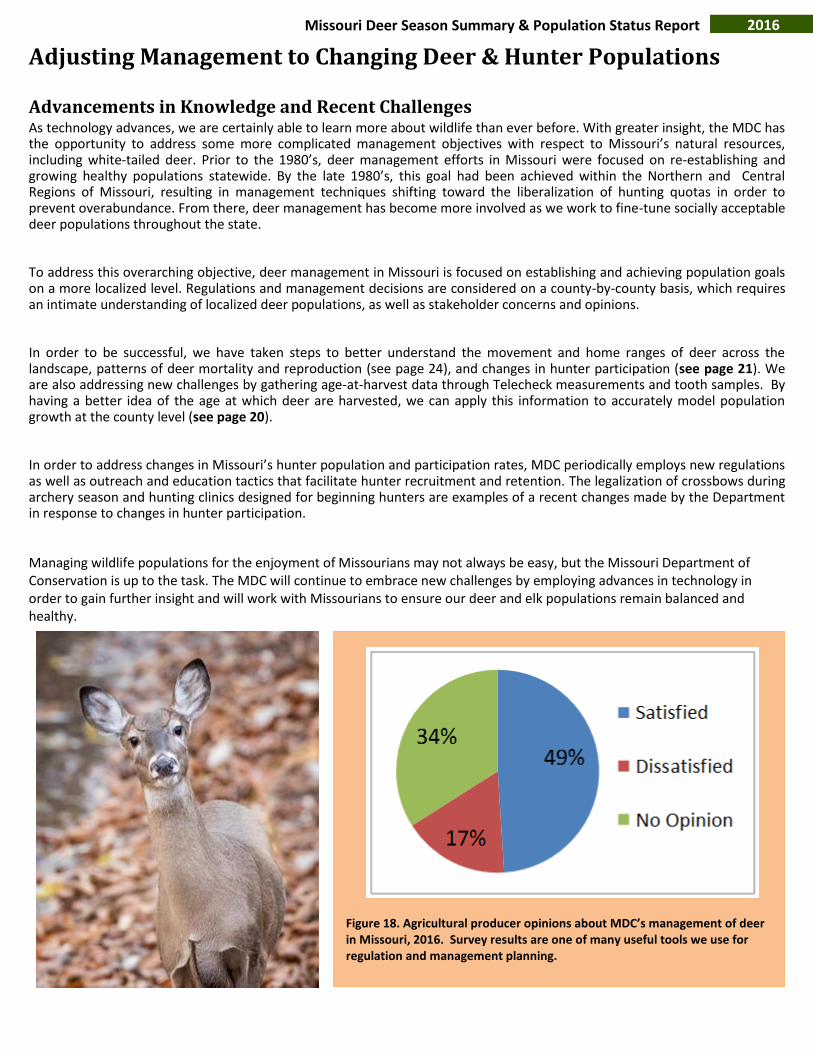
Figure 18. Agricultural producer opinions about MDC’s management of deer in Missouri, 2016. Survey results are one of many useful tools we use for regulation and management planning.
2016 Missouri Deer Season Summary & Population Status Report
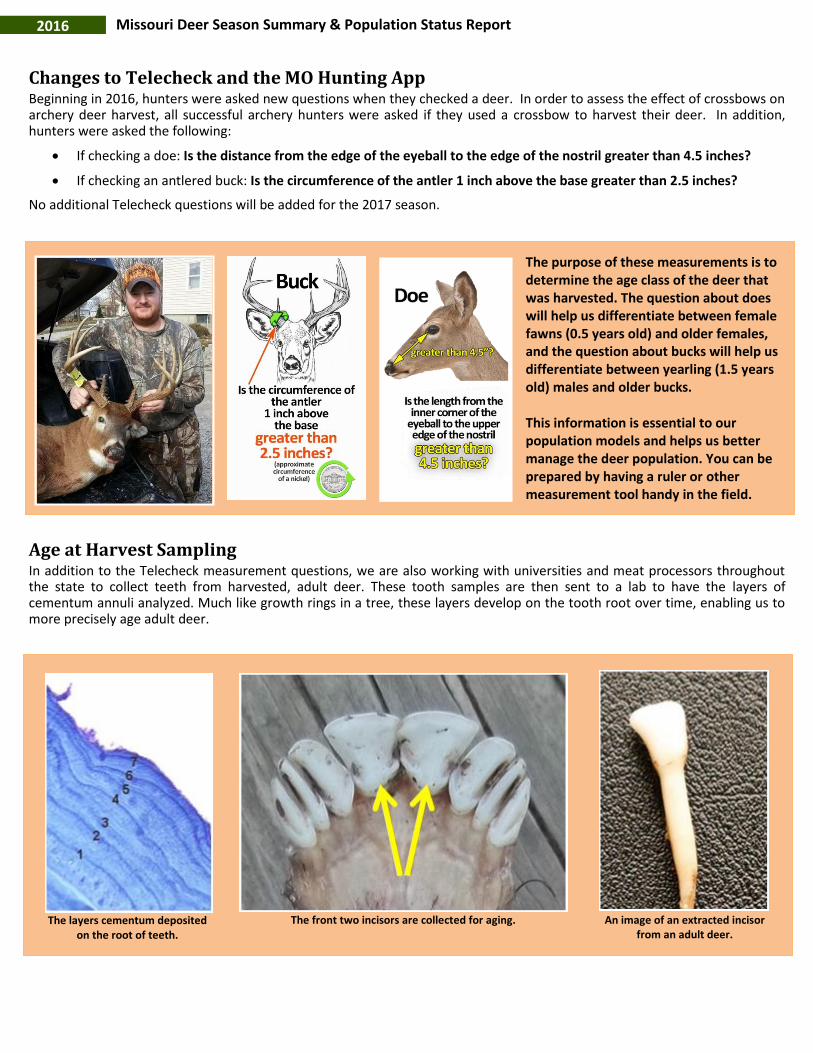
Changes to Telecheck and the MO Hunting App Beginning in 2016, hunters were asked new questions when they checked a deer. In order to assess the effect of crossbows on archery deer harvest, all successful archery hunters were asked if they used a crossbow to harvest their deer. In addition, hunters were asked the following:
If checking a doe: Is the distance from the edge of the eyeball to the edge of the nostril greater than 4.5 inches?
If checking an antlered buck: Is the circumference of the antler 1 inch above the base greater than 2.5 inches?
No additional Telecheck questions will be added for the 2017 season.
The purpose of these measurements is to determine the age class of the deer that was harvested. The question about does will help us differentiate between female fawns (0.5 years old) and older females, and the question about bucks will help us differentiate between yearling (1.5 years old) males and older bucks.
This information is essential to our population models and helps us better manage the deer population. You can be prepared by having a ruler or other measurement tool handy in the field.
Age at Harvest Sampling In addition to the Telecheck measurement questions, we are also working with universities and meat processors throughout the state to collect teeth from harvested, adult deer. These tooth samples are then sent to a lab to have the layers of cementum annuli analyzed. Much like growth rings in a tree, these layers develop on the tooth root over time, enabling us to more precisely age adult deer.
The layers cementum deposited on the root of teeth.
The front two incisors are collected for aging. An image of an extracted incisor from an adult deer.
2016 Missouri Deer Season Summary & Population Status Report
All About Crossbows
Deer hunting is the primary tool that we use to manage deer populations. Thus, the recruitment of new and/or youth hunters and retention of older hunters as they age is of paramount importance to the Cervid Program. About a third of our hunters are from the “baby boomer” generation, and as that generation ages we expect that some hunters will drop out of the sport. Some states have witnessed steady declines in hunter participation over the past 10 years as hunters age and are not replaced by recruitment of youth or novice hunters. Here in Missouri, our hunter numbers have remained relatively stable, thanks in part to youth hunting opportunities and recruitment efforts. However, we continually explore opportunities to improve hunter recruitment and retention. That is why, beginning in 2016 crossbows became a legal weapon for use during archery season. Prior to this regulation change, hunters were required to obtain a medical exemption based on a physician’s reference in order to use crossbows during the archery season. As the number of exemptions issued each year steadily increased, this change was a logical step to increase opportunity for archery hunters.
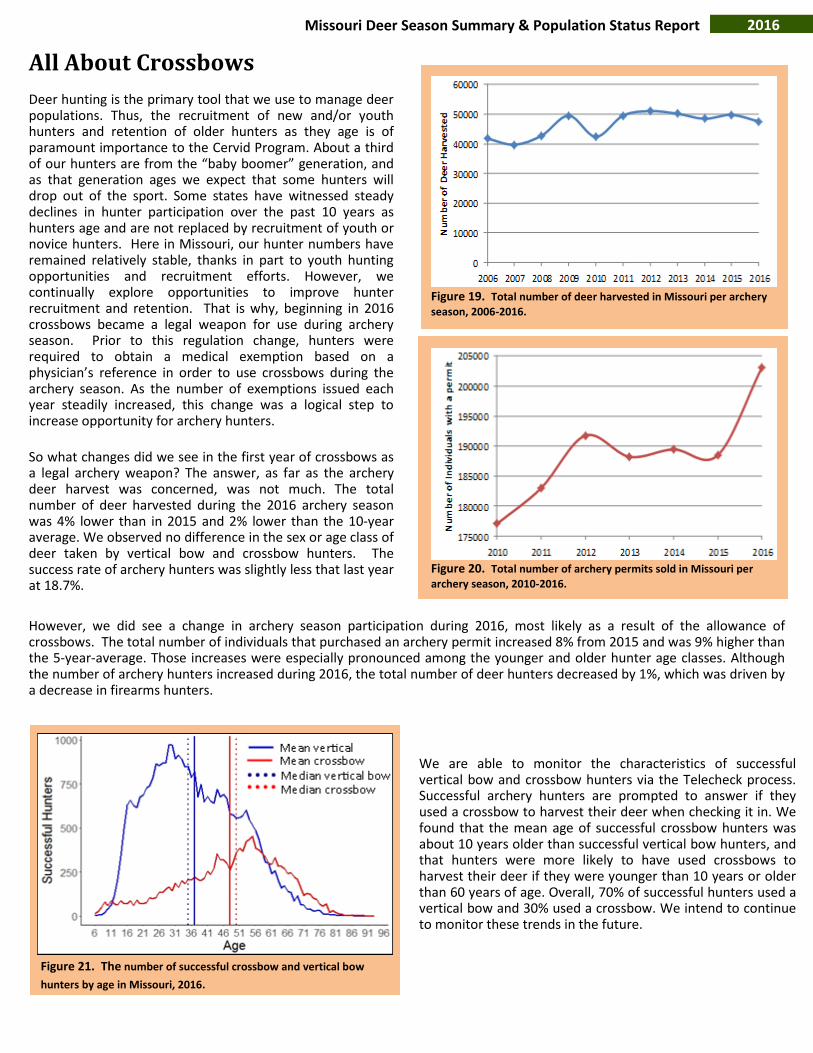
So what changes did we see in the first year of crossbows as a legal archery weapon? The answer, as far as the archery deer harvest was concerned, was not much. The total number of deer harvested during the 2016 archery season was 4% lower than in 2015 and 2% lower than the 10-year average. We observed no difference in the sex or age class of deer taken by vertical bow and crossbow hunters. The success rate of archery hunters was slightly less that last year at 18.7%.
Figure 19. Total number of deer harvested in Missouri per archery
season, 2006-2016.
Figure 20. Total number of archery permits sold in Missouri per
archery season, 2010-2016.
However, we did see a change in archery season participation during 2016, most likely as a result of the allowance of crossbows. The total number of individuals that purchased an archery permit increased 8% from 2015 and was 9% higher than the 5-year-average. Those increases were especially pronounced among the younger and older hunter age classes. Although the number of archery hunters increased during 2016, the total number of deer hunters decreased by 1%, which was driven by a decrease in firearms hunters.
Figure 21. The number of successful crossbow and vertical bow
hunters by age in Missouri, 2016.
We are able to monitor the characteristics of successful vertical bow and crossbow hunters via the Telecheck process. Successful archery hunters are prompted to answer if they used a crossbow to harvest their deer when checking it in. We found that the mean age of successful crossbow hunters was about 10 years older than successful vertical bow hunters, and that hunters were more likely to have used crossbows to harvest their deer if they were younger than 10 years or older than 60 years of age. Overall, 70% of successful hunters used a vertical bow and 30% used a crossbow. We intend to continue to monitor these trends in the future.
2016 Missouri Deer Season Summary & Population Status Report
Deer Management on Private Lands
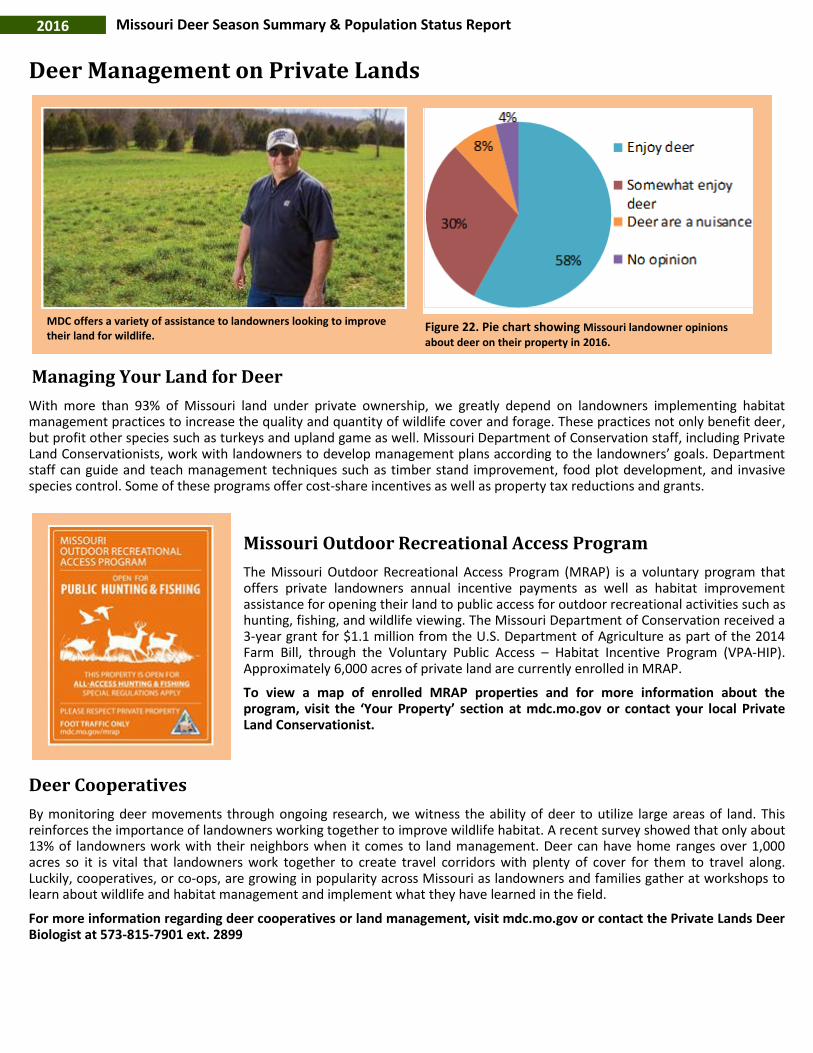
MDC offers a variety of assistance to landowners looking to improve their land for wildlife.
Figure 22. Pie chart showing Missouri landowner opinions
about deer on their property in 2016.
Managing Your Land for Deer
With more than 93% of Missouri land under private ownership, we greatly depend on landowners implementing habitat management practices to increase the quality and quantity of wildlife cover and forage. These practices not only benefit deer, but profit other species such as turkeys and upland game as well. Missouri Department of Conservation staff, including Private Land Conservationists, work with landowners to develop management plans according to the landowners’ goals. Department staff can guide and teach management techniques such as timber stand improvement, food plot development, and invasive species control. Some of these programs offer cost-share incentives as well as property tax reductions and grants.
Missouri Outdoor Recreational Access Program
The Missouri Outdoor Recreational Access Program (MRAP) is a voluntary program that offers private landowners annual incentive payments as well as habitat improvement assistance for opening their land to public access for outdoor recreational activities such as hunting, fishing, and wildlife viewing. The Missouri Department of Conservation received a 3-year grant for $1.1 million from the U.S. Department of Agriculture as part of the 2014 Farm Bill, through the Voluntary Public Access – Habitat Incentive Program (VPA-HIP). Approximately 6,000 acres of private land are currently enrolled in MRAP.
To view a map of enrolled MRAP properties and for more information about the program, visit the ‘Your Property’ section at mdc.mo.gov or contact your local Private Land Conservationist.
Deer Cooperatives
By monitoring deer movements through ongoing research, we witness the ability of deer to utilize large areas of land. This reinforces the importance of landowners working together to improve wildlife habitat. A recent survey showed that only about 13% of landowners work with their neighbors when it comes to land management. Deer can have home ranges over 1,000 acres so it is vital that landowners work together to create travel corridors with plenty of cover for them to travel along. Luckily, cooperatives, or co-ops, are growing in popularity across Missouri as landowners and families gather at workshops to learn about wildlife and habitat management and implement what they have learned in the field.
For more information regarding deer cooperatives or land management, visit mdc.mo.gov or contact the Private Lands Deer Biologist at 573-815-7901 ext. 2899
2016 Missouri Deer Season Summary & Population Status Report
Cervid Program Research Projects
Survival, Recruitment, and Movement Patterns of White-tailed Deer in Missouri
The Missouri Department of Conservation has partnered with the University of Missouri and the University of Montana to evaluate deer reproduction, movement and survival patterns in 2 contrasting Missouri habitats: the glaciated planes of the Northwest and the forested hills of the central Ozarks. The data collected during this 5-year study will influence deer management efforts in the years to come.
Efforts within the two study areas began in January 2015 to trap, affix GPS collars, and monitor male and female deer of all ages. Monitored deer lost each year due to natural death, hunter harvest, or maturation are replenished annually following the hunting season. From December to April, adult deer are captured using specially designed traps and nets, and collared. At this time, transmitters are given to pregnant females that alert researchers when they give birth. This allows the MU crew and MDC staff to locate, capture, and collar fawns during the summer months.
A majority of the data from this project is being collected on private land. Without the help of generous landowners, crews could not gain access to enough varying habitat to locate and trap deer.
For questions or interest in participating, contact the Private Lands Deer Biologist at (573) 815-7901 ext. 2899.
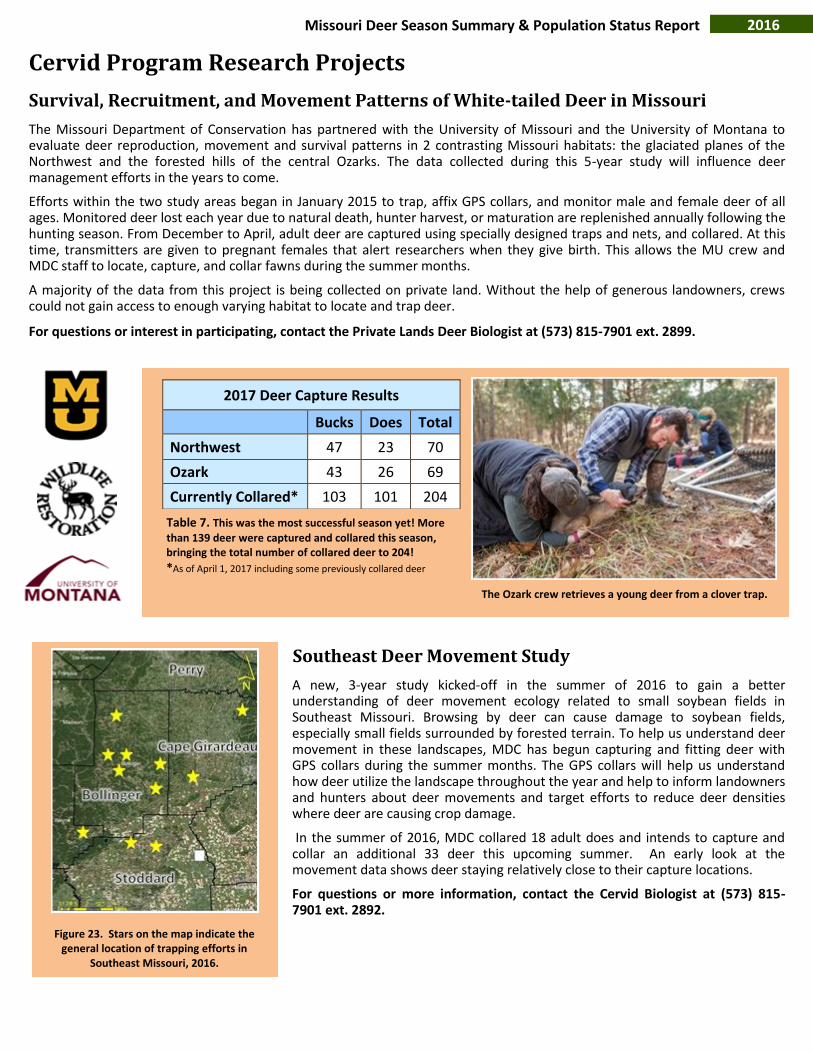
Table 7. This was the most successful season yet! More
than 139 deer were captured and collared this season, bringing the total number of collared deer to 204!
*As of April 1, 2017 including some previously collared deer
The Ozark crew retrieves a young deer from a clover trap.
Southeast Deer Movement Study
A new, 3-year study kicked-off in the summer of 2016 to gain a better understanding of deer movement ecology related to small soybean fields in Southeast Missouri. Browsing by deer can cause damage to soybean fields, especially small fields surrounded by forested terrain. To help us understand deer movement in these landscapes, MDC has begun capturing and fitting deer with GPS collars during the summer months. The GPS collars will help us understand how deer utilize the landscape throughout the year and help to inform landowners and hunters about deer movements and target efforts to reduce deer densities where deer are causing crop damage.
In the summer of 2016, MDC collared 18 adult does and intends to capture and collar an additional 33 deer this upcoming summer. An early look at the movement data shows deer staying relatively close to their capture locations.
For questions or more information, contact the Cervid Biologist at (573) 815-7901 ext. 2892.
Figure 23. Stars on the map indicate the general location of trapping efforts in
Southeast Missouri, 2016.
2017 Deer Capture Results
Bucks Does Total
Northwest 47 23 70
Ozark 43 26 69
Currently Collared* 103 101 204
2016 Missouri Deer Season Summary & Population Status Report
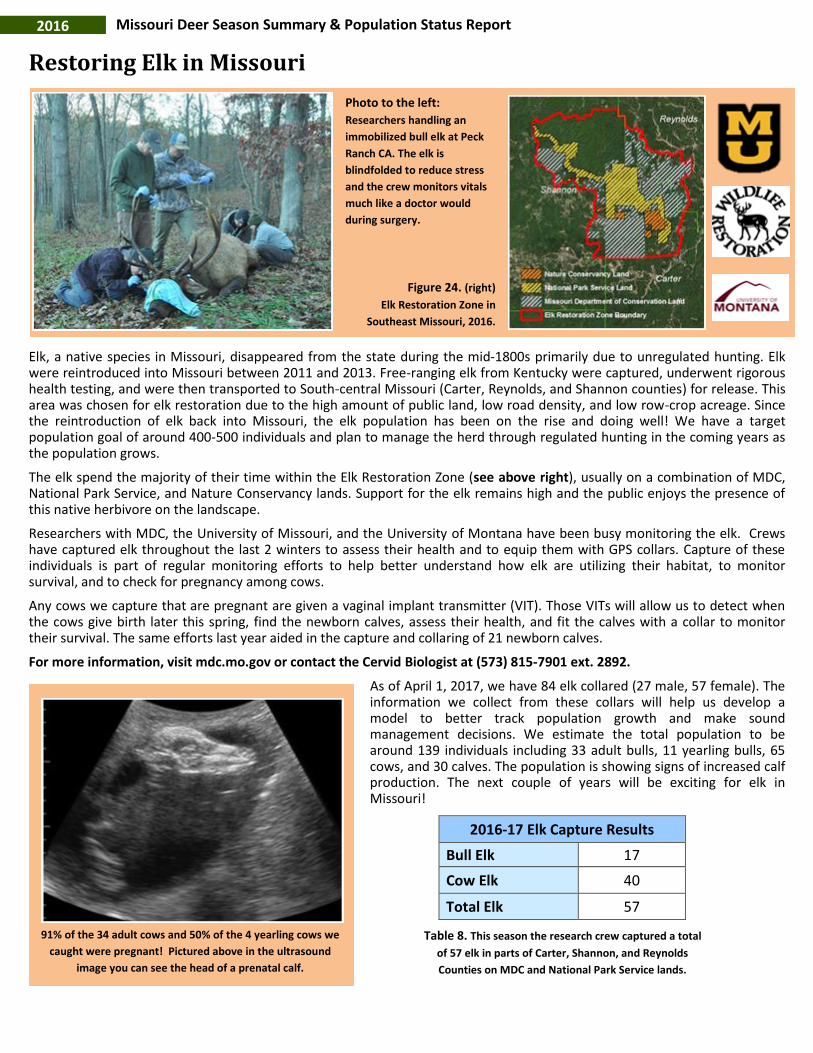
Restoring Elk in Missouri
Photo to the left:
Researchers handling an
immobilized bull elk at Peck
Ranch CA. The elk is
blindfolded to reduce stress
and the crew monitors vitals
much like a doctor would
during surgery.
Figure 24. (right)
Elk Restoration Zone in
Southeast Missouri, 2016.
Elk, a native species in Missouri, disappeared from the state during the mid-1800s primarily due to unregulated hunting. Elk were reintroduced into Missouri between 2011 and 2013. Free-ranging elk from Kentucky were captured, underwent rigorous health testing, and were then transported to South-central Missouri (Carter, Reynolds, and Shannon counties) for release. This area was chosen for elk restoration due to the high amount of public land, low road density, and low row-crop acreage. Since the reintroduction of elk back into Missouri, the elk population has been on the rise and doing well! We have a target population goal of around 400-500 individuals and plan to manage the herd through regulated hunting in the coming years as the population grows.
The elk spend the majority of their time within the Elk Restoration Zone (see above right), usually on a combination of MDC, National Park Service, and Nature Conservancy lands. Support for the elk remains high and the public enjoys the presence of this native herbivore on the landscape.
Researchers with MDC, the University of Missouri, and the University of Montana have been busy monitoring the elk. Crews have captured elk throughout the last 2 winters to assess their health and to equip them with GPS collars. Capture of these individuals is part of regular monitoring efforts to help better understand how elk are utilizing their habitat, to monitor survival, and to check for pregnancy among cows.
Any cows we capture that are pregnant are given a vaginal implant transmitter (VIT). Those VITs will allow us to detect when the cows give birth later this spring, find the newborn calves, assess their health, and fit the calves with a collar to monitor their survival. The same efforts last year aided in the capture and collaring of 21 newborn calves.
For more information, visit mdc.mo.gov or contact the Cervid Biologist at (573) 815-7901 ext. 2892.
As of April 1, 2017, we have 84 elk collared (27 male, 57 female). The information we collect from these collars will help us develop a model to better track population growth and make sound management decisions. We estimate the total population to be around 139 individuals including 33 adult bulls, 11 yearling bulls, 65 cows, and 30 calves. The population is showing signs of increased calf production. The next couple of years will be exciting for elk in Missouri!
91% of the 34 adult cows and 50% of the 4 yearling cows we
caught were pregnant! Pictured above in the ultrasound
image you can see the head of a prenatal calf.
Table 8. This season the research crew captured a total
of 57 elk in parts of Carter, Shannon, and Reynolds
Counties on MDC and National Park Service lands.
2016-17 Elk Capture Results
Bull Elk 17
Cow Elk 40
Total Elk 57
2016 Missouri Deer Season Summary & Population Status Report
Chronic Wasting Disease
What is Chronic Wasting Disease?
Chronic Wasting Disease (CWD) is a fatal, neurological disease of deer caused by an abnormal protein known as a “prion.” The prion causes deterioration of the brain in cervids such as deer, elk, and moose infected with the disease. Infected cervids can spread the disease directly through contact with others or indirectly from infected soil and other surfaces. Additionally, CWD can spread geographically through the natural movements of infected cervids and movement of infected carcasses or captive cervids. In areas where CWD becomes established, it grows in prevalence and distribution, potentially causing significant population declines.
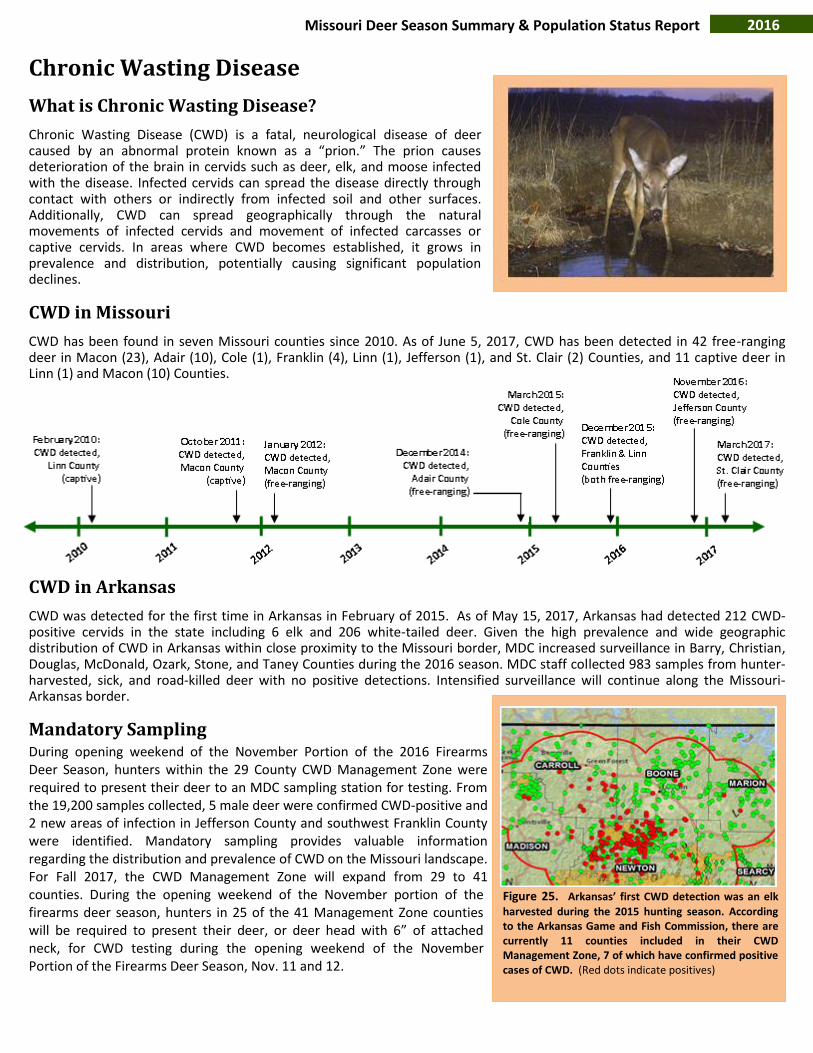
CWD in Missouri
CWD has been found in seven Missouri counties since 2010. As of June 5, 2017, CWD has been detected in 42 free-ranging deer in Macon (23), Adair (10), Cole (1), Franklin (4), Linn (1), Jefferson (1), and St. Clair (2) Counties, and 11 captive deer in Linn (1) and Macon (10) Counties.
CWD in Arkansas
CWD was detected for the first time in Arkansas in February of 2015. As of May 15, 2017, Arkansas had detected 212 CWD-positive cervids in the state including 6 elk and 206 white-tailed deer. Given the high prevalence and wide geographic distribution of CWD in Arkansas within close proximity to the Missouri border, MDC increased surveillance in Barry, Christian, Douglas, McDonald, Ozark, Stone, and Taney Counties during the 2016 season. MDC staff collected 983 samples from hunter-harvested, sick, and road-killed deer with no positive detections. Intensified surveillance will continue along the Missouri-Arkansas border.
Mandatory Sampling During opening weekend of the November Portion of the 2016 Firearms Deer Season, hunters within the 29 County CWD Management Zone were required to present their deer to an MDC sampling station for testing. From the 19,200 samples collected, 5 male deer were confirmed CWD-positive and 2 new areas of infection in Jefferson County and southwest Franklin County were identified. Mandatory sampling provides valuable information regarding the distribution and prevalence of CWD on the Missouri landscape. For Fall 2017, the CWD Management Zone will expand from 29 to 41 counties. During the opening weekend of the November portion of the firearms deer season, hunters in 25 of the 41 Management Zone counties will be required to present their deer, or deer head with 6” of attached neck, for CWD testing during the opening weekend of the November Portion of the Firearms Deer Season, Nov. 11 and 12.
Figure 25. Arkansas’ first CWD detection was an elk
harvested during the 2015 hunting season. According to the Arkansas Game and Fish Commission, there are currently 11 counties included in their CWD Management Zone, 7 of which have confirmed positive cases of CWD. (Red dots indicate positives)

Missouri Deer Season Summary & Population Status Report 2016
Managing CWD
MDC has sampled over 77,000 deer throughout the state since 2001. Routine annual surveillance occurs in half of the state each year, with additional surveillance near CWD-positives. MDC establishes a “CWD Management Zone” around locations where CWD has been detected in Missouri. The CWD Management Zone includes all counties within an approximately 25-mile radius around known locations of CWD-positive deer. Within the CWD Management Zone, MDC implements several regulation changes and management strategies to limit the spread and prevalence of the disease.
In collaboration with the University of Missouri, MDC has implemented a research project to model CWD distribution and potential impacts on Missouri’s deer population. This information may provide insight on management adjustments that could limit CWD distribution and prevalence. Additionally, the study will provide the ability to compare management strategies to detect new cases of CWD early in the infection process and efficiently manage resources.
CWD Management Strategies
The following disease-management strategies apply within the CWD Management Zone:
Allow the harvest of 2 antlerless deer during the firearms season to prevent unwanted population increases and limit the spread of the disease.
Ban the placement of feed, minerals and other consumable deer attractants because they unnaturally concentrate deer and can increase disease spread.
Remove the antler-point restriction. Antler-point restrictions protect young bucks which are most likely to disperse to new areas and may spread the disease across the landscape.
Intensified efforts to sample hunter-harvested deer in the CWD Management Zone.
Post-season targeted sampling within CWD Core Areas to decrease the spread and prevalence in localized areas where the disease is known to exist.
For more information regarding CWD or disease management, visit mdc.mo.gov or contact the Wildlife Disease Coordinator at 573-815-7901 ext. 2934
2013-14 Missouri Deer Season Summary & Population Status Report
Notes
Missouri Department of Conservation