mission sizing and trade studies for low ballistic … · 978-1-4577-0557-1/12/$26.00 ©2012 ieee 1...
TRANSCRIPT

978-1-4577-0557-1/12/$26.00 ©2012 IEEE
1
Mission Sizing and Trade Studies for Low Ballistic
Coefficient Entry Systems to Venus
Soumyo Dutta Daniel Guggenheim School of
Aerospace Engineering, Georgia Institute of
Technology, 270 Ferst Drive
Atlanta, GA 30332 404-894-7783
Brandon Smith NASA Ames
Research Center, Moffett Field, CA 94035
Dinesh Prabhu ERC Inc.,
NASA Ames Research Center,
Moffett Field, CA 94035 [email protected]
Ethiraj Venkatapathy NASA Ames
Research Center, Moffett Field, CA 94035
Abstract—The U.S and the U.S.S.R. have sent seventeen
successful atmospheric entry missions to Venus. Past missions
to Venus have utilized rigid aeroshell systems for entry. This
rigid aeroshell paradigm sets performance limitations since the
size of the entry vehicle is constrained by the fairing diameter
of the launch vehicle. This has limited ballistic coefficients (β)
to well above 100 kg/m2 for the entry vehicles. In order to
maximize the science payload and minimize the Thermal
Protection System (TPS) mass, these missions have entered at
very steep entry flight path angles (γ). Due to Venus’ thick
atmosphere and the steep-γ, high-β conditions, these entry
vehicles have been exposed to very high heat flux, very high
pressures and extreme decelerations (upwards of 100 g’s).
Deployable aeroshells avoid the launch vehicle fairing diameter
constraint by expanding to a larger diameter after the launch.
Due to the potentially larger wetted area, deployable aeroshells
achieve lower ballistic coefficients (well below 100 kg/m2), and
if they are flown at shallower flight path angles, the entry
vehicle can access trajectories with far lower decelerations
(~50-60 g’s), peak heat fluxes (~400 W/cm2) and peak
pressures. The structural and TPS mass of the shallow-γ, low-β
deployables are lower than their steep-γ, high-β rigid aeroshell
counterparts at larger diameters, contributing to lower areal
densities and potentially higher payload mass fractions. For
example, at large diameters, deployables may attain aeroshell
areal densities of 10 kg/m2 as opposed to 50 kg/m2 for rigid
aeroshells. However, the low-β, shallow-γ paradigm also raises
issues, such as the possibility of skip-out during entry. The
shallow-γ could also increase the landing footprint of the
vehicle. Furthermore, the deployable entry systems may be
flexible, so there could be fluid-structure interaction, especially
in the high altitude, low-density regimes. The need for
precision in guidance, navigation and control during entry also
has to be better understood. This paper investigates some of
the challenges facing the design of a shallow-γ, low-β entry
system.
TABLE OF CONTENTS
1. INTRODUCTION ................................................. 1
2. MOTIVATION ..................................................... 2
3. MASS SIZING ...................................................... 3
4. TRAJECTORY CHALLENGES .............................. 5
5. HEATING AND AERODYNAMIC CHALLENGES .... 8
6. FUTURE WORK................................................. 12
7. SUMMARY ........................................................ 12
ACKNOWLEDGEMENTS ....................................... 12
REFERENCES ....................................................... 13
BIOGRAPHIES ...................................................... 14
1. INTRODUCTION
Atmospheric probes and landers that have been sent to Venus in the past have relied on rigid aeroshells to protect the payloads during the initial entry into the planet’s atmosphere. Although this type of vehicle has been used extensively and successfully for entry applications on other planets, Venus’ thick atmosphere subjects the vehicles to large decelerations and heat fluxes.
Due to diameter constraints of launch vehicle fairings, rigid aeroshell vehicles typically have large ballistic coefficients (β), which is a non-dimensional ratio of the vehicle’s entry mass to the product of the drag coefficient (CD) and the projected reference area. Additionally, these vehicles have entered at steep flight path angles (γ) to minimize the total heat load and the resulting Thermal Protection System (TPS) mass. But, the high heat fluxes seen in these trajectories also require the use of high-density materials, such as carbon phenolic, which decrease the payload mass capability of the vehicles. These ranges of the entry parameters lead to the high peak deceleration (nmax) and large peak fluxes (qmax), as is shown in Table 1. Low-β vehicles entering at shallow-γ can reduce the peak deceleration and heat loadings. These vehicles can be deployed after launch or just prior to entry to increase the drag performance of the vehicle without the constraints of the launch vehicle’s fairing diameter.
https://ntrs.nasa.gov/search.jsp?R=20120006657 2018-08-28T15:59:49+00:00Z
2
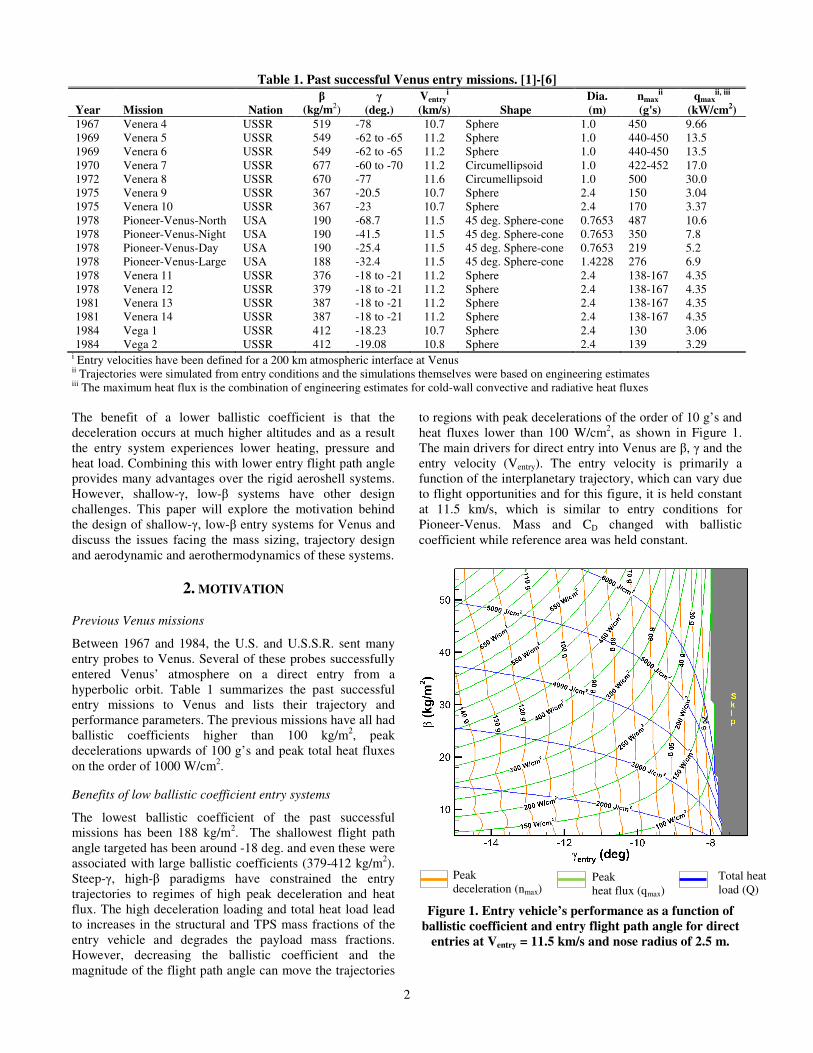
Table 1. Past successful Venus entry missions. [1]-[6]
Year Mission
Nation
β
(kg/m2) γ
(deg.)
Ventryi
(km/s)
Shape
Dia.
(m)
nmaxii
(g's)
qmaxii, iii
(kW/cm2)
1967 Venera 4 USSR 519 -78 10.7 Sphere 1.0 450 9.66 1969 Venera 5 USSR 549 -62 to -65 11.2 Sphere 1.0 440-450 13.5 1969 Venera 6 USSR 549 -62 to -65 11.2 Sphere 1.0 440-450 13.5 1970 Venera 7 USSR 677 -60 to -70 11.2 Circumellipsoid 1.0 422-452 17.0 1972 Venera 8 USSR 670 -77 11.6 Circumellipsoid 1.0 500 30.0 1975 Venera 9 USSR 367 -20.5 10.7 Sphere 2.4 150 3.04 1975 Venera 10 USSR 367 -23 10.7 Sphere 2.4 170 3.37 1978 Pioneer-Venus-North USA 190 -68.7 11.5 45 deg. Sphere-cone 0.7653 487 10.6 1978 Pioneer-Venus-Night USA 190 -41.5 11.5 45 deg. Sphere-cone 0.7653 350 7.8 1978 Pioneer-Venus-Day USA 190 -25.4 11.5 45 deg. Sphere-cone 0.7653 219 5.2 1978 Pioneer-Venus-Large USA 188 -32.4 11.5 45 deg. Sphere-cone 1.4228 276 6.9 1978 Venera 11 USSR 376 -18 to -21 11.2 Sphere 2.4 138-167 4.35 1978 Venera 12 USSR 379 -18 to -21 11.2 Sphere 2.4 138-167 4.35 1981 Venera 13 USSR 387 -18 to -21 11.2 Sphere 2.4 138-167 4.35 1981 Venera 14 USSR 387 -18 to -21 11.2 Sphere 2.4 138-167 4.35 1984 Vega 1 USSR 412 -18.23 10.7 Sphere 2.4 130 3.06 1984 Vega 2 USSR 412 -19.08 10.8 Sphere 2.4 139 3.29
i Entry velocities have been defined for a 200 km atmospheric interface at Venus ii Trajectories were simulated from entry conditions and the simulations themselves were based on engineering estimates iii The maximum heat flux is the combination of engineering estimates for cold-wall convective and radiative heat fluxes
The benefit of a lower ballistic coefficient is that the deceleration occurs at much higher altitudes and as a result the entry system experiences lower heating, pressure and heat load. Combining this with lower entry flight path angle provides many advantages over the rigid aeroshell systems. However, shallow-γ, low-β systems have other design challenges. This paper will explore the motivation behind the design of shallow-γ, low-β entry systems for Venus and discuss the issues facing the mass sizing, trajectory design and aerodynamic and aerothermodynamics of these systems.
2. MOTIVATION
Previous Venus missions
Between 1967 and 1984, the U.S. and U.S.S.R. sent many entry probes to Venus. Several of these probes successfully entered Venus’ atmosphere on a direct entry from a hyperbolic orbit. Table 1 summarizes the past successful entry missions to Venus and lists their trajectory and performance parameters. The previous missions have all had ballistic coefficients higher than 100 kg/m2, peak decelerations upwards of 100 g’s and peak total heat fluxes on the order of 1000 W/cm2.
Benefits of low ballistic coefficient entry systems
The lowest ballistic coefficient of the past successful missions has been 188 kg/m2. The shallowest flight path angle targeted has been around -18 deg. and even these were associated with large ballistic coefficients (379-412 kg/m2). Steep-γ, high-β paradigms have constrained the entry trajectories to regimes of high peak deceleration and heat flux. The high deceleration loading and total heat load lead to increases in the structural and TPS mass fractions of the entry vehicle and degrades the payload mass fractions. However, decreasing the ballistic coefficient and the magnitude of the flight path angle can move the trajectories
to regions with peak decelerations of the order of 10 g’s and heat fluxes lower than 100 W/cm2, as shown in Figure 1. The main drivers for direct entry into Venus are β, γ and the entry velocity (Ventry). The entry velocity is primarily a function of the interplanetary trajectory, which can vary due to flight opportunities and for this figure, it is held constant at 11.5 km/s, which is similar to entry conditions for Pioneer-Venus. Mass and CD changed with ballistic coefficient while reference area was held constant.
Figure 1. Entry vehicle’s performance as a function of
ballistic coefficient and entry flight path angle for direct
entries at Ventry = 11.5 km/s and nose radius of 2.5 m.
Peak deceleration (nmax)
Peak heat flux (qmax)
Total heat load (Q)
Note that the peak deceleration (orange curve) function of the entry flight path angle and shallower angles lead to lower nmax. Also, peak heat flux lowered by a combination of lower ballistic coefficient and shallow flight path angle. The corresponding total heat loads (blue curve) are significantly lower than those for highersteeper-γ systems, despite the longer time due to the lower overall heat flux. Total heat load does actually increase when shallow flight angles are used for a fixed β, but an optimum design could be achieved by balancing the increase in Q (and hence TPS mass) and the reduction in nmax (and structural mass).
Figure 1 also shows the vehicle skip-out given ballistic coefficient. Skip-out in this paper is defined as the situation where the vehicle returns to the entry interface instead of continuing its descent towards the surface. Thus, there is a limit of the flight path angle that avoids skip-out for a given ballistic coefficient. This will be addressed in more detail in a later section. situations were not studied in this paper.
Low ballistic coefficient entry system options
Entry systems for Venus using a rigid aeroshell likely will not achieve ballistic coefficients much lower than kg/m2. In order to achieve a low ballistic coefficient for a given diameter and shape, either the payload mass small or the entry system mass has to be reduced. One can increase the diameter, but for rigid aeroshells this cannot begreater than the current launch vehicle diameter (around 4.5 m). Additionally, since radiatincreases with diameter, reduction in thelimited for rigid aeroshells without new lightweight TPS and structural materials. Thus, for this study, low ballistic coefficient entry systems are synonymous with afterdeployable systems.
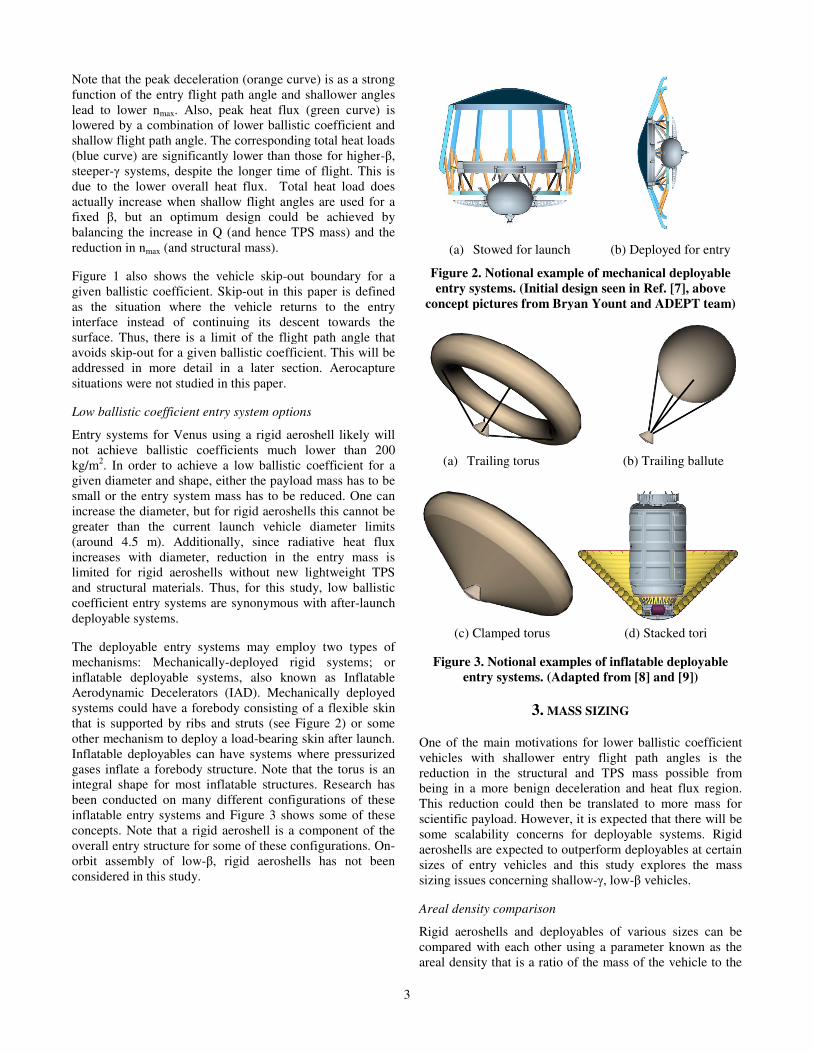
The deployable entry systems may employmechanisms: Mechanically-deployed rigid systems; or inflatable deployable systems, also known as Aerodynamic Decelerators (IAD). Mechanically deployed systems could have a forebody consisting of a flexible skin that is supported by ribs and struts (see Figure other mechanism to deploy a load-bearing skin after launch.Inflatable deployables can have systems where pressurized gases inflate a forebody structure. Note that integral shape for most inflatable structures. Research has been conducted on many different configurations of these inflatable entry systems and Figure 3 shows some of these concepts. Note that a rigid aeroshell is a component of the overall entry structure for some of these configurations.orbit assembly of low-β, rigid aeroshells considered in this study.
3
(orange curve) is as a strong function of the entry flight path angle and shallower angles
(green curve) is by a combination of lower ballistic coefficient and
The corresponding total heat loads (blue curve) are significantly lower than those for higher-β,
systems, despite the longer time of flight. This is Total heat load does
actually increase when shallow flight angles are used for a , but an optimum design could be achieved by
balancing the increase in Q (and hence TPS mass) and the
out boundary for a out in this paper is defined
as the situation where the vehicle returns to the entry ntinuing its descent towards the limit of the flight path angle that
out for a given ballistic coefficient. This will be in a later section. Aerocapture
Low ballistic coefficient entry system options
rigid aeroshell likely will much lower than 200
low ballistic coefficient for a er the payload mass has to be
reduced. One can for rigid aeroshells this cannot be
vehicle diameter limits radiative heat flux the entry mass is
without new lightweight TPS Thus, for this study, low ballistic
coefficient entry systems are synonymous with after-launch
may employ two types of deployed rigid systems; or
, also known as Inflatable . Mechanically deployed
of a flexible skin Figure 2) or some
bearing skin after launch. Inflatable deployables can have systems where pressurized
ucture. Note that the torus is an integral shape for most inflatable structures. Research has been conducted on many different configurations of these
shows some of these rigid aeroshell is a component of the
overall entry structure for some of these configurations. On-, rigid aeroshells has not been
(a) Stowed for launch
Figure 2. Notional example of mechanical
entry systems. (Initial design seen in Ref.
concept pictures from Bryan Yount and ADEPT team
(a) Trailing torus (b)
(c) Clamped torus
Figure 3. Notional examples of
entry systems. (Adapted from
3. MASS SIZING
One of the main motivations for lower ballistic coefficient vehicles with shallower entry flight path angles is the reduction in the structural and TPS mass possible from being in a more benign deceleration and heat flux region. This reduction could then be translated to more mass for scientific payload. However, it is expected that there will be some scalability concerns for deployable systems. Rigid aeroshells are expected to outperform deployables at certain sizes of entry vehicles and this study exploresizing issues concerning shallow-γ, low
Areal density comparison
Rigid aeroshells and deployables compared with each other using a parameter known asareal density that is a ratio of the mass of the vehic
(b) Deployed for entry
mechanical deployable
seen in Ref. [7], above
concept pictures from Bryan Yount and ADEPT team)
Trailing torus (b) Trailing ballute
(d) Stacked tori
of inflatable deployable
from [8] and [9])
MASS SIZING
One of the main motivations for lower ballistic coefficient vehicles with shallower entry flight path angles is the reduction in the structural and TPS mass possible from being in a more benign deceleration and heat flux region.
e translated to more mass for entific payload. However, it is expected that there will be
some scalability concerns for deployable systems. Rigid aeroshells are expected to outperform deployables at certain sizes of entry vehicles and this study explores the mass
γ, low-β vehicles.
of various sizes can be compared with each other using a parameter known as the
that is a ratio of the mass of the vehicle to the

4
wetted area (Swetted). Specifically, the comparison is for the aeroshell areal density (Eq. 1), where the total “aeroshell” mass (maeroshell) is a combination of the structure and TPS masses. The difference between this “aeroshell” mass and the total entry system mass is defined as the “payload” mass, which can consist of scientific instruments, power equipment and the descent apparatus, such as parachutes, mortar deployment devices etc. An entry system that uses less structural and TPS mass will have a lower aeroshell mass and hence a smaller aeroshell areal density for a given payload size.
wetted
TPSstructure
wetted
aeroshellaeroshellareal
S
mm
S
m +==,ρ (1)
The comparison between areal densities of various entry systems is shown in Figure 4. The rigid aeroshell used is a 45 deg. sphere-cone and the deployables are 70 deg. sphere-cones. The 45 deg. sphere-cone is the only rigid aeroshell shape flown by the U.S. at Venus, while the 70 deg. sphere-cone model is the current shape being considered for the deployables due to payload capability and stability purpose. The rigid aeroshell structure and TPS mass calculations are done using historical relationships ([11]-[14]), the mechanical deployable masses are calculated using first-order engineering sizing tools [13] and the IAD mass sizing is done for a stacked tori concept and based on the approach presented in Ref. [15]. This IAD sizing approach was used in the two recent NASA Entry, Descent and Landing-System Analysis (EDL-SA) Mars mission studies [16]-[17]. The rigid aeroshell mass sizing stops at 3.5 m to avoid extrapolation from historical data, while the deployable mass sizing begins from 4 m. Rigid aeroshells appear to be mass-efficient for small size vehicles (looking at Figure 5) and already have flight heritage; however, when the size of the vehicle needs to increase, rigid aeroshells cannot be used due to the launch vehicle fairing diameter limit and hence the deployables can be very effective substitutes.
Figure 4. Aeroshell areal density comparison between
rigid aeroshells and deployable entry vehicles of various
sizes. Vehicle entry at γ = -9 deg. and V = 11.5 km/s at
200 km altitude on Venus.
The trends in the figure show that the aeroshell areal densities are lower for the deployables when compared to the rigid aeroshells at larger diameters. The areal density trends for the deployables at lower diameters are harder to estimate and may show higher areal densities than rigid aeroshells. However, since aeroshell areal density is the effective mass of the aeroshell per wetted area, the lower effective mass of a deployable frees up mass for the “payload,” a fraction of which includes the science payload at larger diameter vehicles. It should be noted that since the tools used to generate the data for the deployables are not at very high fidelity, there remains some uncertainty in the estimated mass values. Also, the figure is not meant for comparison between the different types of deployables. Fabrication of IADs and mechanical deployables with smaller diameters and low dynamic pressures is challenging due to the material availability with relevant minimum thicknesses. Thus, there are too many uncertainties in the current modeling to make effective comparisons between the two types of deployables.
Payload mass fraction comparison
It is not surprising that the areal densities of the deployables were lower than the rigid aeroshell, since there was a large difference in ballistic coefficients between the two types of vehicles and the areal density formulation is similar to the definition of β. Additionally, there is also a large disparity in the entry and payload masses of the rigid aeroshell and the two deployables. Thus, a more even comparison of the payload capabilities of the rigid aeroshells and deployables can be done using payload mass fractions (ratio of payload mass to entry mass). Figure 5 shows this comparison.
Figure 5. Payload mass fraction comparison between
rigid aeroshells and deployable entry vehicles of various
sizes. Vehicle entry at γ = -9 deg. and V = 11.5 km/s at
200 km altitude on Venus.
The payload mass fractions for the rigid aeroshell remain more or less constant, while the mass fractions of the deployables change with size. At larger vehicle diameters, the deployables seem to have high payload mass fractions.
5
As expected, the advantage of deployables magnifies with increases in their wetted areas.
It might appear from Figure 5 that a high ballistic coefficient is desired for deployables due to a larger payload mass fraction. However, higher-β systems, for a given diameter and entry γ, have higher entry masses, peak heat fluxes and total heat loads. The entry mass specifically is a huge problem because although one gets higher mass fraction efficiency with a high-β system, the entry mass might become too exorbitant for Earth launch vehicle capabilities. Additionally, the higher deceleration loadings might also be undesirable for certain scientific payloads.
Although the payload mass fractions for the rigid aeroshells are ~0.6, this includes mass of the descent stage and other protective mass so that the actual mass fraction for science components will be much lower. Rigid aeroshells fly at a higher ballistic coefficients and steeper flight path angles and will have higher peak decelerations; thus, part of the “payload” mass will have to be used for structure to protect the actual science payload from these high decelerations. Pioneer Venus Large Probe’s (PVLP) science payload mass fraction was only ~9% [1]. Since shallow-γ, low-β systems will have lower peak decelerations, it is expected a smaller portion of the “payload” mass will be used to protect the actual cargo.
4. TRAJECTORY CHALLENGES
Although shallow-γ, low-β entries reduce deceleration and heat flux loadings, these entries also introduce some complications into the trajectories, such as possibility of skip-out or larger dispersions in trajectory footprint. This section explores these trajectory-related issues intrinsic to shallow-γ, low-β entry systems.
Skip-out
As seen Figure 1, flying at shallow-γ leaves open the possibility that the entry system could skip-out of the atmosphere if there are deviations from the nominal trajectory. Thus, when planning for a targeted shallow flight path angle, a margin has to be applied to avoid the possibility of the vehicle skipping-out. Skip-out in this case is defined as the situation when the vehicle returns to the entry interface (assumed to be 200 km altitude for Venus) after initially entering the atmosphere. The skip-out margin has to account for deviations from the nominal trajectory for various reasons. Mainly, the perturbations can be due to the atmospheric variations and interplanetary trajectory delivery errors. Science, mission and communication requirements could also limit the entry flight path angle that is allowed.
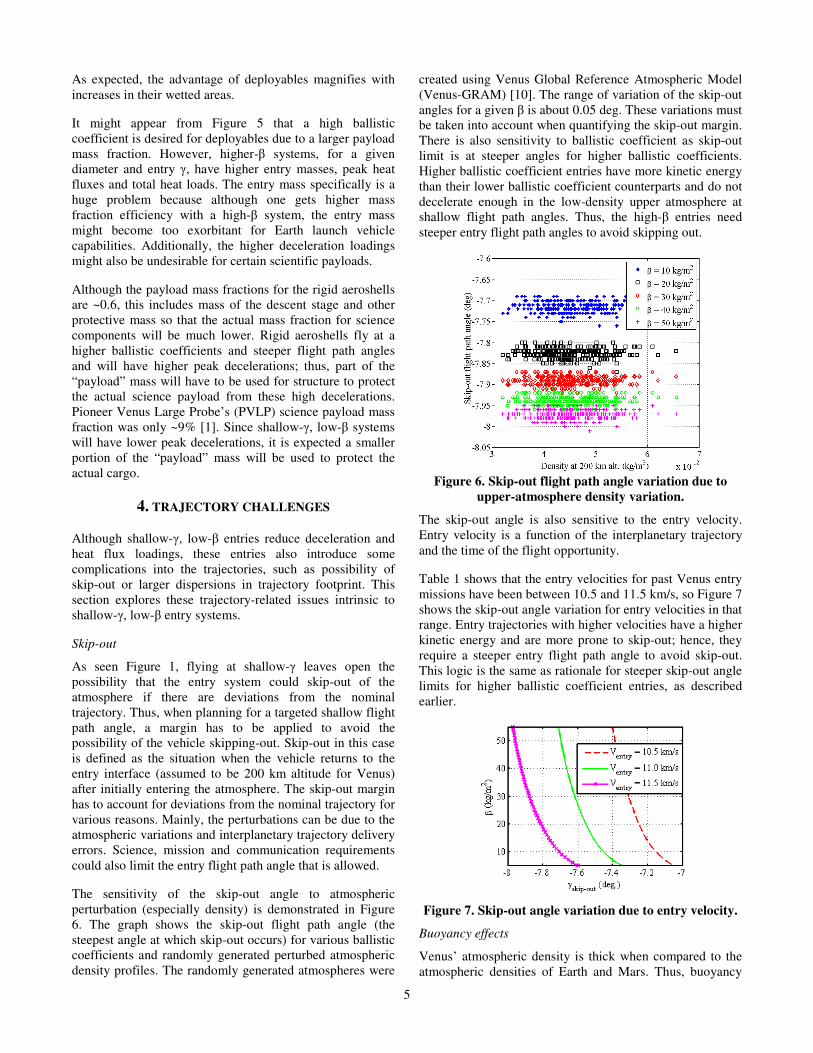
The sensitivity of the skip-out angle to atmospheric perturbation (especially density) is demonstrated in Figure 6. The graph shows the skip-out flight path angle (the steepest angle at which skip-out occurs) for various ballistic coefficients and randomly generated perturbed atmospheric density profiles. The randomly generated atmospheres were
created using Venus Global Reference Atmospheric Model (Venus-GRAM) [10]. The range of variation of the skip-out angles for a given β is about 0.05 deg. These variations must be taken into account when quantifying the skip-out margin. There is also sensitivity to ballistic coefficient as skip-out limit is at steeper angles for higher ballistic coefficients. Higher ballistic coefficient entries have more kinetic energy than their lower ballistic coefficient counterparts and do not decelerate enough in the low-density upper atmosphere at shallow flight path angles. Thus, the high-β entries need steeper entry flight path angles to avoid skipping out.
Figure 6. Skip-out flight path angle variation due to
upper-atmosphere density variation.
The skip-out angle is also sensitive to the entry velocity. Entry velocity is a function of the interplanetary trajectory and the time of the flight opportunity.
Table 1 shows that the entry velocities for past Venus entry missions have been between 10.5 and 11.5 km/s, so Figure 7 shows the skip-out angle variation for entry velocities in that range. Entry trajectories with higher velocities have a higher kinetic energy and are more prone to skip-out; hence, they require a steeper entry flight path angle to avoid skip-out. This logic is the same as rationale for steeper skip-out angle limits for higher ballistic coefficient entries, as described earlier.
Figure 7. Skip-out angle variation due to entry velocity.
Buoyancy effects
Venus’ atmospheric density is thick when compared to the atmospheric densities of Earth and Mars. Thus, buoyancy

6
force could potentially have an effect on the trajectories of entry systems, especially configurations with large volumes such as low ballistic coefficient entry systems. However, upon comparing the buoyancy force to the gravitational force (Figure 8), it can be seen that buoyancy force is not an important contributor during the entry trajectory in the upper atmosphere. Buoyancy effects might be important in the design of descent and landing systems that operate below 50 km, but these effects are negligible when compared to gravity for regions where entry systems will be operated (i.e. altitudes greater than 50 km).
Figure 8. Buoyancy force to gravitational force ratio as a
function of altitude. Entry body is a 70 deg. sphere-cone.
Loading and footprint considerations
The primary benefit of shallow-γ, low-β entry vehicles at Venus is the reduced deceleration loading relative to the
steep-γ, high-β design paradigm. A potentially negative aspect of entering the atmosphere at a shallow flight path angle is reduced landing accuracy due to the propagation of atmospheric and aerodynamic uncertainties over a longer flight path. This section compares the deceleration profile
and mid-atmosphere footprint of a nominal shallow-γ, low-β
entry with that of a steep-γ, high-β entry similar to the PVLP. To shed light on this trade, a Monte Carlo trajectory analysis using the Program to Optimize Simulated Trajectories II (POSTII) is conducted per the nominal
parameters and 3σ dispersions in Table 2.
The entry vehicle will most likely deploy descent and landing phases when subsonic conditions are reached. Since this paper compares the performance of different types of entry vehicles, the “footprint” analysis is conducted when Mach 0.8 is reached by the perturbed trajectories. Flight path data below Mach 0.8 performed by the descent and landing stages has not been considered in this study. Results
below compare the steep-γ, high-β (PVLP) and shallow-γ, low-β trajectory profiles (Figure 9) and sensed acceleration profiles (Figure 10).
Table 2. Parameters and assumptions for Monte Carlo trajectory analysis of a nominal shallow-γ, low-β entry vehicle
and a steep-γ, high-β entry vehicle (PVLP-like).
Parameter Nominal Value:
Shallow-γ, low-β
cases
Nominal Value:
PVLP cases ±3σσσσ uncertainty for
perturbed parameters
(normal distribution)
Note
βhypersonic 25 kg/m2 188 kg/m2 -- β uncertainty comes from drag uncertainty
Entry Mass 2000 kg 316 kg -- Perfect knowledge of entry mass assumed for this study
Atmosphere Interface Altitude
(hentry) 200 km --
Chosen definition of entry interface
Geometry (CD vs. Mach)
70º Sphere-conei 45º Sphere-coneii 5% of Nominal (M ≥ 5)
15% of Nominal (M < 5)
iMars Pathfinder data iiPioneer Venus data
Reference Area 50.3 m2 iii 1.58 m2 iv -- iii8.0 m diameter iv1.43 m diameter
Longitude at hentry 85.0º East v 1.5º
vEntry occurs 29 July 2022, 5:08 AM UTC; Not actual PVLP entry condition. Uncertainty values from Ref. [18]
Latitude at hentry -29.2º North 1.5º See notev above.
Velocity at hentry 11.253 km/s 0.015 km/s See notev above.
Velocity Vector Azimuth at hentry 178º (clockwise from North) -- See notev above.
γ at hentry -9.00º -32.4º 0.75º Based on estimates for typical Venus interplanetary trajectories
Atmosphere 2000 randomly generated density, temperature, and wind profiles from Venus-GRAM
Region of entry system operations

7
Figure 9. Dispersed trajectories (2000 cases) for PVLP
and shallow-γ, low-β.
Figure 10. Deceleration loadings for PVLP and shallow-
γ, low-β (2000 cases each).
The trajectory profiles show that the PVLP entry conditions cause the vehicle to dig deeper into the atmosphere and decelerate at a lower altitude (denser atmosphere). In
contrast, the shallow-γ, low-β vehicle begins decelerating about 15 km higher than the PVLP cases. Beginning deceleration at higher altitude extends the loading pulse over a longer period of time and reduces the instantaneous sensed acceleration substantially. The worst-case PVLP trajectory experienced 314 g’s of deceleration compared to
65 g’s for the worst-case shallow-γ, low-β vehicle. While
this improved loading environment is still severe, the low-β, shallow-γ entry vehicle design provides for a comparatively more benign design environment for the scientific payload than the traditional Venus entry vehicle design paradigm.
Landing accuracy at Venus is driven by the planet’s extreme winds. Equatorial and mid-latitude wind speeds can exceed
100 m/s above 60 km and gradually decrease to a calm breeze at the surface. Randomly generated wind profiles from Venus-GRAM [10] used in this trajectory analysis are shown in Figure 11. Note that subsonic flight is achieved near 70 km altitude for both cases. This implies that the magnitude and direction of the atmosphere-relative velocity vector is driven almost entirely by winds below this altitude and winds will be a dominant factor in landing dispersions. Additionally, most of the winds appear to move more East to West than North to South. So, final landing dispersions are expected to be more perturbed in the longitudinal direction by the winds.
Figure 11. Wind profiles at the entry location randomly
generated with Venus-GRAM.
Although the final landing dispersion for Venus will be very much affected by winds and the descent/landing vehicle configuration, it is informative to see whether the choice of a shallow-γ, low-β vehicle for the entry phase adversely affects the timing of the EDL stages when compared to PVLP-type trajectories. The entry system’s effect on the EDL trajectory can be studied at descent stage deployment location, which in this case is when Mach 0.8 is reached.
The coordinates of the entry vehicle when it has decelerated
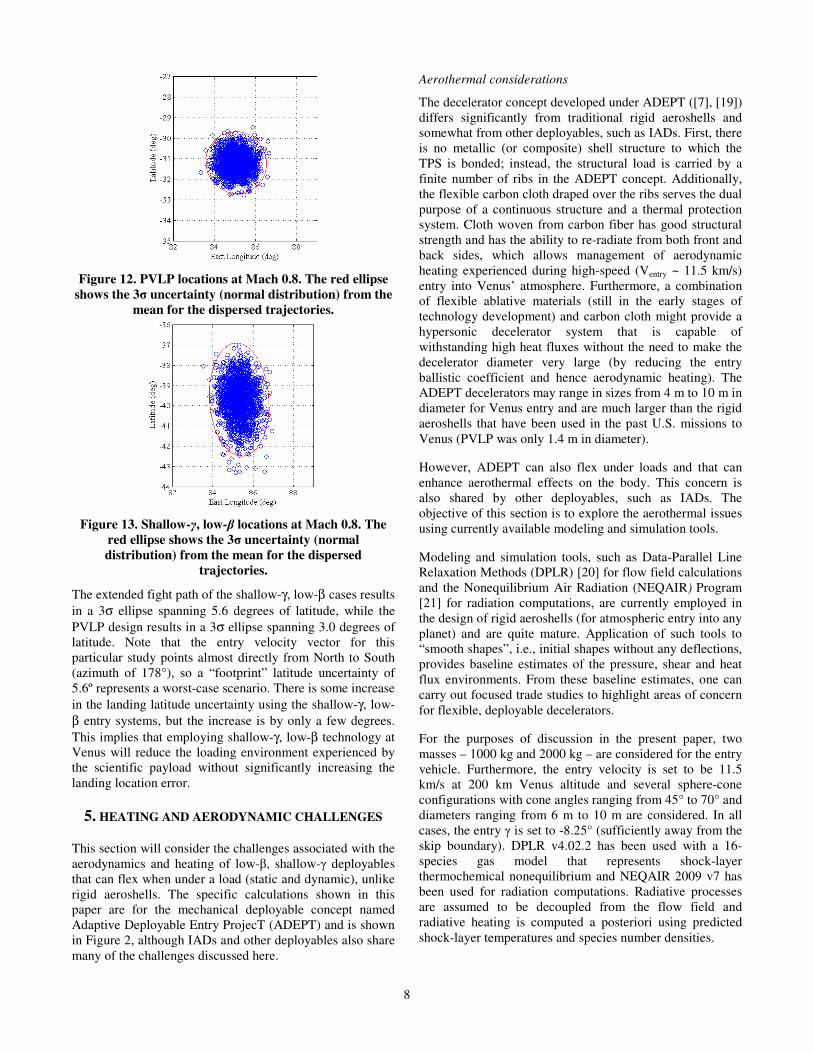
to Mach 0.8 for the PVLP cases and the shallow-γ, low-β cases are shown in Figure 12 and Figure 13, respectively. Note that these trajectories have been propagated until the vehicle reaches Mach 0.8, so these trajectories did not end at the same altitude. However, all of them reached Mach 0.8 in
the 60-80 km range. The 3σ-uncertainty ellipse is computed from the 2000 cases and is overlaid in red. The size and shape of this ellipse is driven by the propagation of atmospheric and aerodynamic uncertainties above 70 km. Recall that below 70km the motion of the entry vehicle is determined by wind, which mostly blow along lines of latitudes. As such, the longitude dispersions of 3.0º seen for both entry vehicle paradigms will be increased by the wind velocity uncertainties in the lower atmosphere.
8
Figure 12. PVLP locations at Mach 0.8. The red ellipse
shows the 3σ uncertainty (normal distribution) from the
mean for the dispersed trajectories.
Figure 13. Shallow-γ, low-β locations at Mach 0.8. The
red ellipse shows the 3σ uncertainty (normal
distribution) from the mean for the dispersed
trajectories.
The extended fight path of the shallow-γ, low-β cases results
in a 3σ ellipse spanning 5.6 degrees of latitude, while the
PVLP design results in a 3σ ellipse spanning 3.0 degrees of latitude. Note that the entry velocity vector for this particular study points almost directly from North to South (azimuth of 178°), so a “footprint” latitude uncertainty of 5.6º represents a worst-case scenario. There is some increase
in the landing latitude uncertainty using the shallow-γ, low-
β entry systems, but the increase is by only a few degrees.
This implies that employing shallow-γ, low-β technology at Venus will reduce the loading environment experienced by the scientific payload without significantly increasing the landing location error.
5. HEATING AND AERODYNAMIC CHALLENGES
This section will consider the challenges associated with the aerodynamics and heating of low-β, shallow-γ deployables that can flex when under a load (static and dynamic), unlike rigid aeroshells. The specific calculations shown in this paper are for the mechanical deployable concept named Adaptive Deployable Entry ProjecT (ADEPT) and is shown in Figure 2, although IADs and other deployables also share many of the challenges discussed here.
Aerothermal considerations
The decelerator concept developed under ADEPT ([7], [19]) differs significantly from traditional rigid aeroshells and somewhat from other deployables, such as IADs. First, there is no metallic (or composite) shell structure to which the TPS is bonded; instead, the structural load is carried by a finite number of ribs in the ADEPT concept. Additionally, the flexible carbon cloth draped over the ribs serves the dual purpose of a continuous structure and a thermal protection system. Cloth woven from carbon fiber has good structural strength and has the ability to re-radiate from both front and back sides, which allows management of aerodynamic heating experienced during high-speed (Ventry ~ 11.5 km/s) entry into Venus’ atmosphere. Furthermore, a combination of flexible ablative materials (still in the early stages of technology development) and carbon cloth might provide a hypersonic decelerator system that is capable of withstanding high heat fluxes without the need to make the decelerator diameter very large (by reducing the entry ballistic coefficient and hence aerodynamic heating). The ADEPT decelerators may range in sizes from 4 m to 10 m in diameter for Venus entry and are much larger than the rigid aeroshells that have been used in the past U.S. missions to Venus (PVLP was only 1.4 m in diameter).
However, ADEPT can also flex under loads and that can enhance aerothermal effects on the body. This concern is also shared by other deployables, such as IADs. The objective of this section is to explore the aerothermal issues using currently available modeling and simulation tools.
Modeling and simulation tools, such as Data-Parallel Line Relaxation Methods (DPLR) [20] for flow field calculations and the Nonequilibrium Air Radiation (NEQAIR) Program [21] for radiation computations, are currently employed in the design of rigid aeroshells (for atmospheric entry into any planet) and are quite mature. Application of such tools to “smooth shapes”, i.e., initial shapes without any deflections, provides baseline estimates of the pressure, shear and heat flux environments. From these baseline estimates, one can carry out focused trade studies to highlight areas of concern for flexible, deployable decelerators.
For the purposes of discussion in the present paper, two masses – 1000 kg and 2000 kg – are considered for the entry vehicle. Furthermore, the entry velocity is set to be 11.5 km/s at 200 km Venus altitude and several sphere-cone configurations with cone angles ranging from 45° to 70° and diameters ranging from 6 m to 10 m are considered. In all cases, the entry γ is set to -8.25° (sufficiently away from the skip boundary). DPLR v4.02.2 has been used with a 16-species gas model that represents shock-layer thermochemical nonequilibrium and NEQAIR 2009 v7 has been used for radiation computations. Radiative processes are assumed to be decoupled from the flow field and radiative heating is computed a posteriori using predicted shock-layer temperatures and species number densities.

9
The entry vehicles have low ballistic coefficients, so the vehicle should slow down rapidly in the upper atmosphere where the density is low. Due to small freestream densities, the expected heating on the smooth configurations will be small. Figure 14 shows centerline distributions of cold-wall (Tw = 400 K, fully catalytic) convective heat flux (at the peak total heating point on the trajectory) and pressure (at the peak dynamic pressure point on the trajectory) for two smooth, sphere-cone geometries (45° and 70°) for a 6 m diameter decelerator (mentry = 1000 kg). Figure 15 shows the same paramters when the decelerator has a 10 m diameter (mentry = 2000 kg). The larger diameter leads to a larger nose radius and hence lower peak heat flux.
(a) Cold-wall convective heat flux at peak total heating
(b) Surface pressure at peak dynamic pressure
Figure 14. Centerline distributions of cold-wall (Tw = 400
K) convective heat flux and pressure for 1000 kg, 6 m
diameter ADEPT geometries.
(a) Cold-wall convective heat flux at peak total heating
(b) Surface pressure at peak dynamic pressure
Figure 15. Centerline distributions of cold-wall (Tw = 400
K) convective heat flux and pressure for 2000 kg, 10 m
diameter ADEPT geometries.
A few points from the two figures (Figure 14 and Figure 15): (1) the cold-wall convective heat flux, even with consideration of a turbulent shear layers, does not exceed 200 W/cm2; and (2) the impact pressure does not exceed 0.14 atm. It should be noted that the magnitude of the convective heat flux on flanks of the sphere-cones are somewhat conservative. If the surface were to be treated as a hot wall, the heat flux would be reduced, and reduced even further if the surface were allowed to re-radiate from sides, front and back. The analysis thus far does not consider shock-layer radiation.
The next step is to develop configurations that are closer to those envisaged for flight. Figure 16 shows a conceptual 12-rib, 8 m diameter decelerator geometry enclosed within the defining surface (translucent cyan-colored surface) of a 70° sphere-cone. Unlike rigid aeroshells with a rigid, uniform surface, the deployables like ADEPT will have a flexible surface for the forebody, such as flexible carbon cloth that is
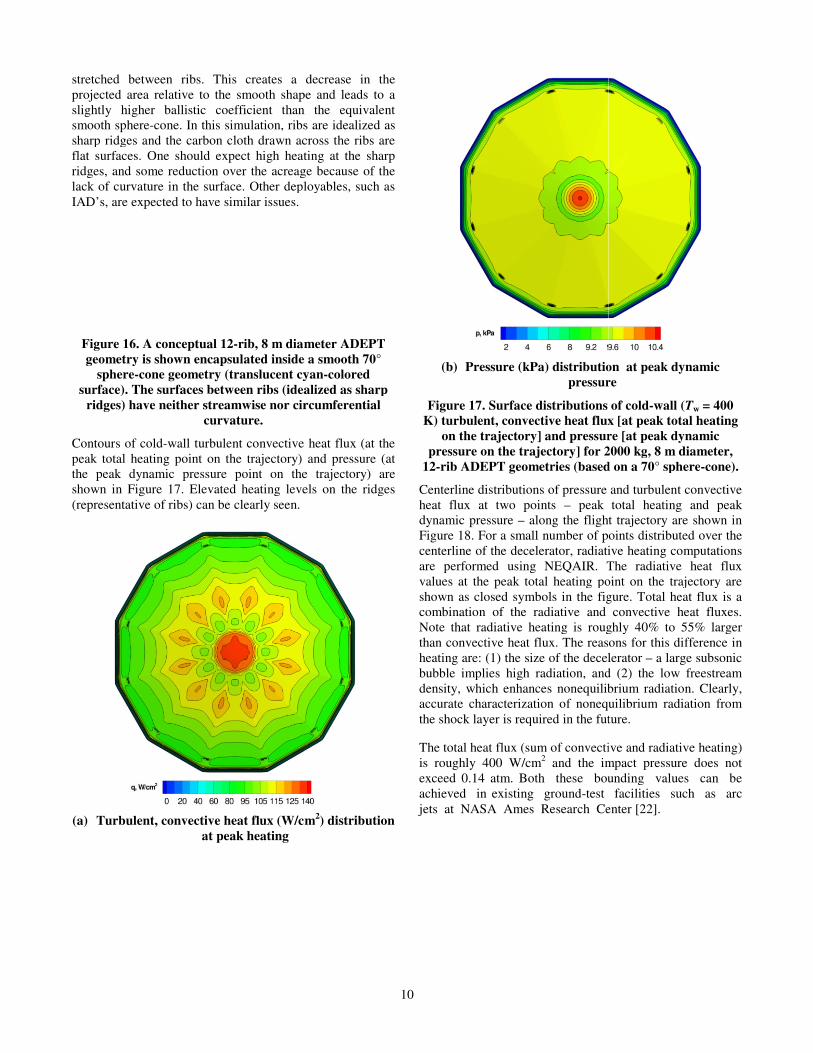
stretched between ribs. This creates a projected area relative to the smooth shapeslightly higher ballistic coefficient thansmooth sphere-cone. In this simulation, ribs are idealized as sharp ridges and the carbon cloth drawn across the ribs are flat surfaces. One should expect high heating at the sharp ridges, and some reduction over the acreage because of the lack of curvature in the surface. Other deployablesIAD’s, are expected to have similar issues.
Figure 16. A conceptual 12-rib, 8 m diameter ADEPT
geometry is shown encapsulated inside a smooth 70°
sphere-cone geometry (translucent cyan
surface). The surfaces between ribs (idealized as sharp
ridges) have neither streamwise nor circumferential
curvature.
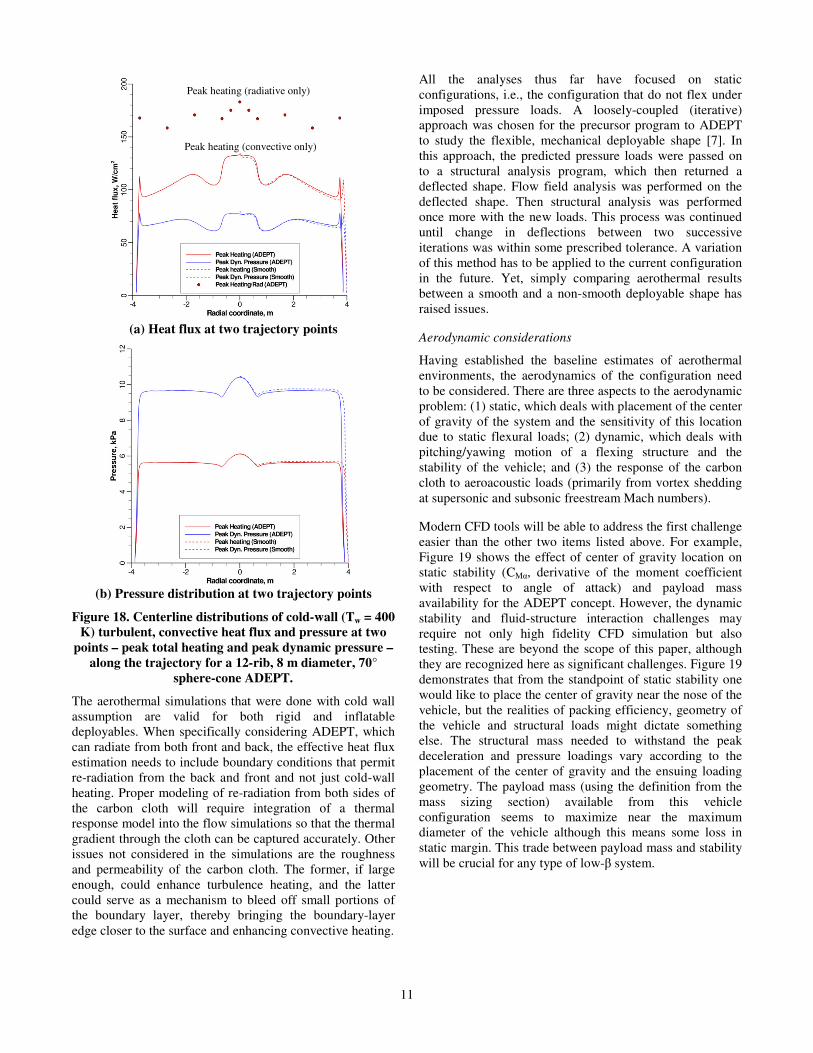
Contours of cold-wall turbulent convective heat flux (at the peak total heating point on the trajectory) and pressure (the peak dynamic pressure point on the trajectory) are shown in Figure 17. Elevated heating levels on the ridges (representative of ribs) can be clearly seen.
(a) Turbulent, convective heat flux (W/cm
at peak heating
10
decrease in the relative to the smooth shape and leads to a
n the equivalent ibs are idealized as
sharp ridges and the carbon cloth drawn across the ribs are flat surfaces. One should expect high heating at the sharp ridges, and some reduction over the acreage because of the
ther deployables, such as
rib, 8 m diameter ADEPT
geometry is shown encapsulated inside a smooth 70°
cent cyan-colored
The surfaces between ribs (idealized as sharp
ridges) have neither streamwise nor circumferential
wall turbulent convective heat flux (at the peak total heating point on the trajectory) and pressure (at the peak dynamic pressure point on the trajectory) are
. Elevated heating levels on the ridges
(W/cm
2) distribution
(b) Pressure (kPa) distribution
pressure
Figure 17. Surface distributions of
K) turbulent, convective heat flux
on the trajectory] and pressure
pressure on the trajectory] for 2000 kg
12-rib ADEPT geometries (based on a 70° sphere
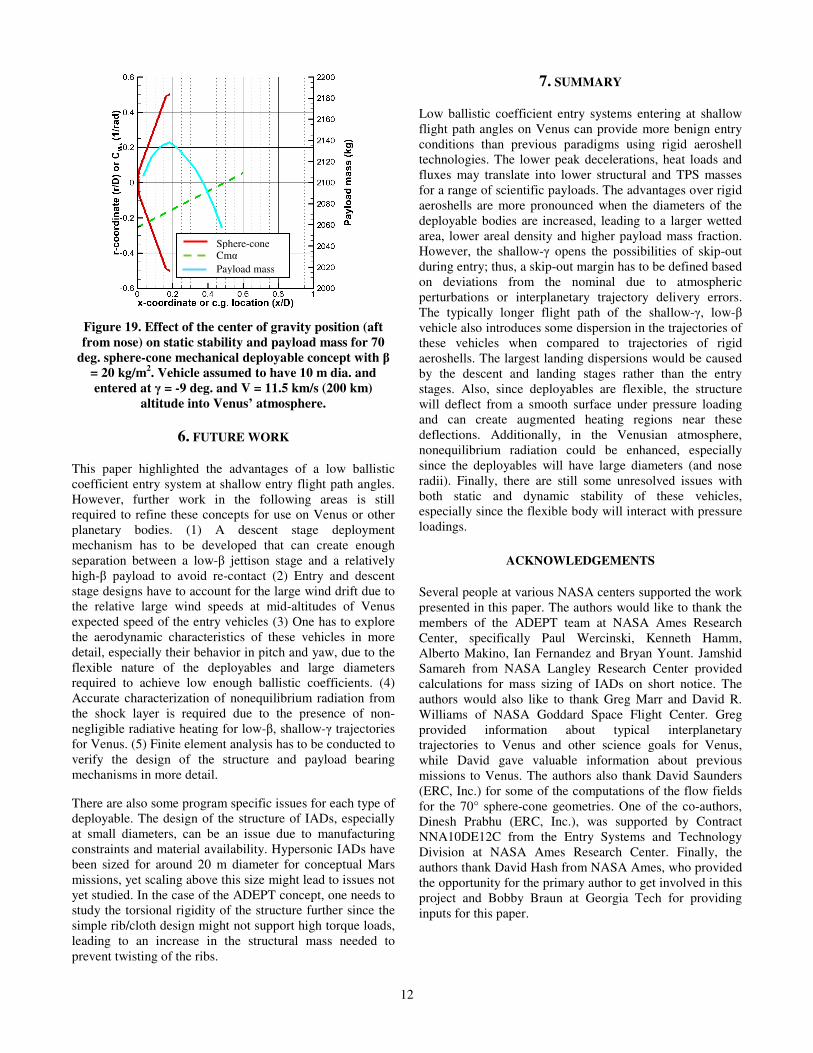
Centerline distributions of pressure and turbulent convective heat flux at two points – peak total heating and peak dynamic pressure – along the flight trajectory are shown in Figure 18. For a small number of points distributed over the centerline of the decelerator, radiative heating computations are performed using NEQAIR. The radiative heat flux values at the peak total heating point on the trajectory are shown as closed symbols in the figure. Total heat flux is a combination of the radiative and convective heat fluxes. Note that radiative heating is roughly 40% to 55% larger than convective heat flux. The reasons fheating are: (1) the size of the decelerator bubble implies high radiation, and (2) the low freestream density, which enhances nonequilibrium radiation. Clearly, accurate characterization of nonequilibriumthe shock layer is required in the future.
The total heat flux (sum of convective and radiative heating) is roughly 400 W/cm2 and the impact pressure does not exceed 0.14 atm. Both these bounding values can be achieved in existing ground-test jets at NASA Ames Research Center
distribution at peak dynamic
pressure
distributions of cold-wall (Tw = 400
heat flux [at peak total heating
pressure [at peak dynamic
2000 kg, 8 m diameter,
based on a 70° sphere-cone).
Centerline distributions of pressure and turbulent convective peak total heating and peak
the flight trajectory are shown in . For a small number of points distributed over the
centerline of the decelerator, radiative heating computations are performed using NEQAIR. The radiative heat flux
total heating point on the trajectory are shown as closed symbols in the figure. Total heat flux is a combination of the radiative and convective heat fluxes. Note that radiative heating is roughly 40% to 55% larger than convective heat flux. The reasons for this difference in heating are: (1) the size of the decelerator – a large subsonic bubble implies high radiation, and (2) the low freestream density, which enhances nonequilibrium radiation. Clearly,
nonequilibrium radiation from the shock layer is required in the future.
The total heat flux (sum of convective and radiative heating) and the impact pressure does not
exceed 0.14 atm. Both these bounding values can be facilities such as arc
Research Center [22].
11
(a) Heat flux at two trajectory points
(b) Pressure distribution at two trajectory points
Figure 18. Centerline distributions of cold-wall (Tw = 400
K) turbulent, convective heat flux and pressure at two
points – peak total heating and peak dynamic pressure –
along the trajectory for a 12-rib, 8 m diameter, 70°
sphere-cone ADEPT.
The aerothermal simulations that were done with cold wall assumption are valid for both rigid and inflatable deployables. When specifically considering ADEPT, which can radiate from both front and back, the effective heat flux estimation needs to include boundary conditions that permit re-radiation from the back and front and not just cold-wall heating. Proper modeling of re-radiation from both sides of the carbon cloth will require integration of a thermal response model into the flow simulations so that the thermal gradient through the cloth can be captured accurately. Other issues not considered in the simulations are the roughness and permeability of the carbon cloth. The former, if large enough, could enhance turbulence heating, and the latter could serve as a mechanism to bleed off small portions of the boundary layer, thereby bringing the boundary-layer edge closer to the surface and enhancing convective heating.
All the analyses thus far have focused on static configurations, i.e., the configuration that do not flex under imposed pressure loads. A loosely-coupled (iterative) approach was chosen for the precursor program to ADEPT to study the flexible, mechanical deployable shape [7]. In this approach, the predicted pressure loads were passed on to a structural analysis program, which then returned a deflected shape. Flow field analysis was performed on the deflected shape. Then structural analysis was performed once more with the new loads. This process was continued until change in deflections between two successive iterations was within some prescribed tolerance. A variation of this method has to be applied to the current configuration in the future. Yet, simply comparing aerothermal results between a smooth and a non-smooth deployable shape has raised issues.
Aerodynamic considerations
Having established the baseline estimates of aerothermal environments, the aerodynamics of the configuration need to be considered. There are three aspects to the aerodynamic problem: (1) static, which deals with placement of the center of gravity of the system and the sensitivity of this location due to static flexural loads; (2) dynamic, which deals with pitching/yawing motion of a flexing structure and the stability of the vehicle; and (3) the response of the carbon cloth to aeroacoustic loads (primarily from vortex shedding at supersonic and subsonic freestream Mach numbers).
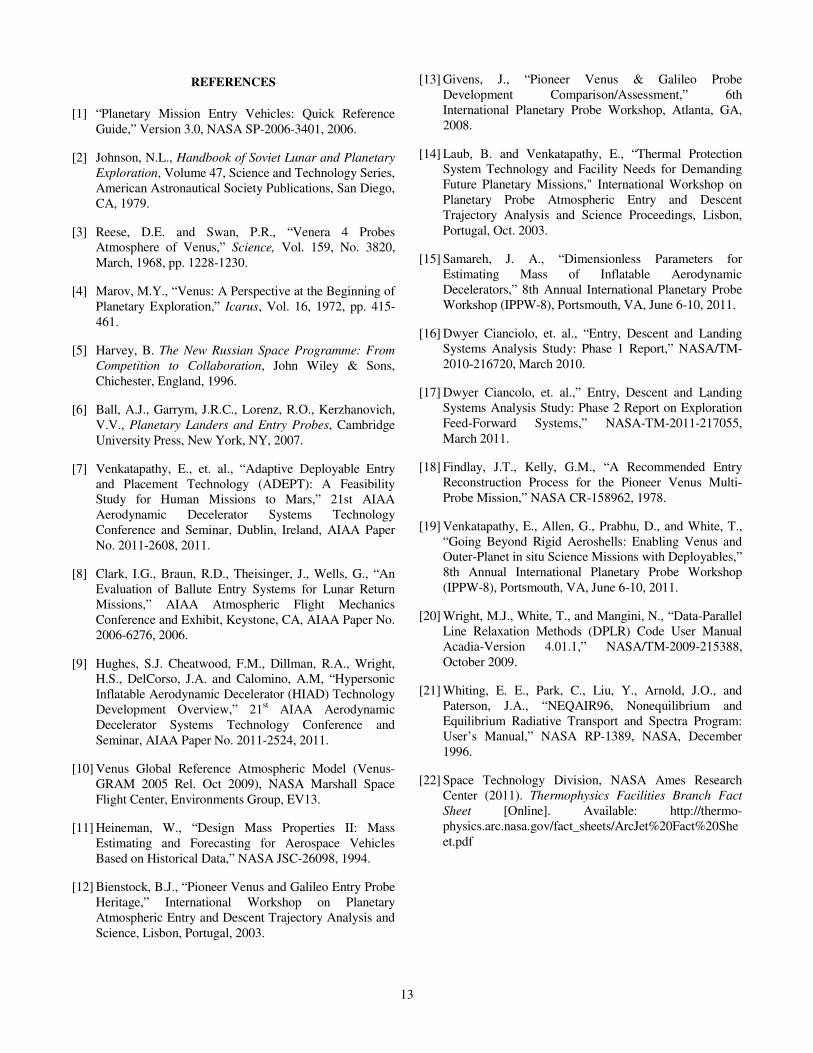
Modern CFD tools will be able to address the first challenge easier than the other two items listed above. For example, Figure 19 shows the effect of center of gravity location on static stability (CMα, derivative of the moment coefficient with respect to angle of attack) and payload mass availability for the ADEPT concept. However, the dynamic stability and fluid-structure interaction challenges may require not only high fidelity CFD simulation but also testing. These are beyond the scope of this paper, although they are recognized here as significant challenges. Figure 19 demonstrates that from the standpoint of static stability one would like to place the center of gravity near the nose of the vehicle, but the realities of packing efficiency, geometry of the vehicle and structural loads might dictate something else. The structural mass needed to withstand the peak deceleration and pressure loadings vary according to the placement of the center of gravity and the ensuing loading geometry. The payload mass (using the definition from the mass sizing section) available from this vehicle configuration seems to maximize near the maximum diameter of the vehicle although this means some loss in static margin. This trade between payload mass and stability will be crucial for any type of low-β system.
Peak heating (radiative only)
Peak heating (convective only)
12
Figure 19. Effect of the center of gravity position (aft
from nose) on static stability and payload mass for 70
deg. sphere-cone mechanical deployable concept with β
= 20 kg/m2. Vehicle assumed to have 10 m dia. and
entered at γ = -9 deg. and V = 11.5 km/s (200 km)
altitude into Venus’ atmosphere.
6. FUTURE WORK
This paper highlighted the advantages of a low ballistic coefficient entry system at shallow entry flight path angles. However, further work in the following areas is still required to refine these concepts for use on Venus or other planetary bodies. (1) A descent stage deployment mechanism has to be developed that can create enough separation between a low-β jettison stage and a relatively high-β payload to avoid re-contact (2) Entry and descent stage designs have to account for the large wind drift due to the relative large wind speeds at mid-altitudes of Venus expected speed of the entry vehicles (3) One has to explore the aerodynamic characteristics of these vehicles in more detail, especially their behavior in pitch and yaw, due to the flexible nature of the deployables and large diameters required to achieve low enough ballistic coefficients. (4) Accurate characterization of nonequilibrium radiation from the shock layer is required due to the presence of non-negligible radiative heating for low-β, shallow-γ trajectories for Venus. (5) Finite element analysis has to be conducted to verify the design of the structure and payload bearing mechanisms in more detail.
There are also some program specific issues for each type of deployable. The design of the structure of IADs, especially at small diameters, can be an issue due to manufacturing constraints and material availability. Hypersonic IADs have been sized for around 20 m diameter for conceptual Mars missions, yet scaling above this size might lead to issues not yet studied. In the case of the ADEPT concept, one needs to study the torsional rigidity of the structure further since the simple rib/cloth design might not support high torque loads, leading to an increase in the structural mass needed to prevent twisting of the ribs.
7. SUMMARY
Low ballistic coefficient entry systems entering at shallow flight path angles on Venus can provide more benign entry conditions than previous paradigms using rigid aeroshell technologies. The lower peak decelerations, heat loads and fluxes may translate into lower structural and TPS masses for a range of scientific payloads. The advantages over rigid aeroshells are more pronounced when the diameters of the deployable bodies are increased, leading to a larger wetted area, lower areal density and higher payload mass fraction. However, the shallow-γ opens the possibilities of skip-out during entry; thus, a skip-out margin has to be defined based on deviations from the nominal due to atmospheric perturbations or interplanetary trajectory delivery errors. The typically longer flight path of the shallow-γ, low-β vehicle also introduces some dispersion in the trajectories of these vehicles when compared to trajectories of rigid aeroshells. The largest landing dispersions would be caused by the descent and landing stages rather than the entry stages. Also, since deployables are flexible, the structure will deflect from a smooth surface under pressure loading and can create augmented heating regions near these deflections. Additionally, in the Venusian atmosphere, nonequilibrium radiation could be enhanced, especially since the deployables will have large diameters (and nose radii). Finally, there are still some unresolved issues with both static and dynamic stability of these vehicles, especially since the flexible body will interact with pressure loadings.
ACKNOWLEDGEMENTS
Several people at various NASA centers supported the work presented in this paper. The authors would like to thank the members of the ADEPT team at NASA Ames Research Center, specifically Paul Wercinski, Kenneth Hamm, Alberto Makino, Ian Fernandez and Bryan Yount. Jamshid Samareh from NASA Langley Research Center provided calculations for mass sizing of IADs on short notice. The authors would also like to thank Greg Marr and David R. Williams of NASA Goddard Space Flight Center. Greg provided information about typical interplanetary trajectories to Venus and other science goals for Venus, while David gave valuable information about previous missions to Venus. The authors also thank David Saunders (ERC, Inc.) for some of the computations of the flow fields for the 70° sphere-cone geometries. One of the co-authors, Dinesh Prabhu (ERC, Inc.), was supported by Contract NNA10DE12C from the Entry Systems and Technology Division at NASA Ames Research Center. Finally, the authors thank David Hash from NASA Ames, who provided the opportunity for the primary author to get involved in this project and Bobby Braun at Georgia Tech for providing inputs for this paper.
Sphere-cone
Payload mass
Cmα
13
REFERENCES
[1] “Planetary Mission Entry Vehicles: Quick Reference Guide,” Version 3.0, NASA SP-2006-3401, 2006.
[2] Johnson, N.L., Handbook of Soviet Lunar and Planetary
Exploration, Volume 47, Science and Technology Series, American Astronautical Society Publications, San Diego, CA, 1979.
[3] Reese, D.E. and Swan, P.R., “Venera 4 Probes Atmosphere of Venus,” Science, Vol. 159, No. 3820, March, 1968, pp. 1228-1230.
[4] Marov, M.Y., “Venus: A Perspective at the Beginning of Planetary Exploration,” Icarus, Vol. 16, 1972, pp. 415-461.
[5] Harvey, B. The New Russian Space Programme: From
Competition to Collaboration, John Wiley & Sons, Chichester, England, 1996.
[6] Ball, A.J., Garrym, J.R.C., Lorenz, R.O., Kerzhanovich, V.V., Planetary Landers and Entry Probes, Cambridge University Press, New York, NY, 2007.
[7] Venkatapathy, E., et. al., “Adaptive Deployable Entry and Placement Technology (ADEPT): A Feasibility Study for Human Missions to Mars,” 21st AIAA Aerodynamic Decelerator Systems Technology Conference and Seminar, Dublin, Ireland, AIAA Paper No. 2011-2608, 2011.
[8] Clark, I.G., Braun, R.D., Theisinger, J., Wells, G., “An Evaluation of Ballute Entry Systems for Lunar Return Missions,” AIAA Atmospheric Flight Mechanics Conference and Exhibit, Keystone, CA, AIAA Paper No. 2006-6276, 2006.
[9] Hughes, S.J. Cheatwood, F.M., Dillman, R.A., Wright, H.S., DelCorso, J.A. and Calomino, A.M, “Hypersonic Inflatable Aerodynamic Decelerator (HIAD) Technology Development Overview,” 21st AIAA Aerodynamic Decelerator Systems Technology Conference and Seminar, AIAA Paper No. 2011-2524, 2011.
[10] Venus Global Reference Atmospheric Model (Venus-GRAM 2005 Rel. Oct 2009), NASA Marshall Space Flight Center, Environments Group, EV13.
[11] Heineman, W., “Design Mass Properties II: Mass Estimating and Forecasting for Aerospace Vehicles Based on Historical Data,” NASA JSC-26098, 1994.
[12] Bienstock, B.J., “Pioneer Venus and Galileo Entry Probe Heritage,” International Workshop on Planetary Atmospheric Entry and Descent Trajectory Analysis and Science, Lisbon, Portugal, 2003.
[13] Givens, J., “Pioneer Venus & Galileo Probe Development Comparison/Assessment,” 6th International Planetary Probe Workshop, Atlanta, GA, 2008.
[14] Laub, B. and Venkatapathy, E., “Thermal Protection System Technology and Facility Needs for Demanding Future Planetary Missions," International Workshop on Planetary Probe Atmospheric Entry and Descent Trajectory Analysis and Science Proceedings, Lisbon, Portugal, Oct. 2003.
[15] Samareh, J. A., “Dimensionless Parameters for Estimating Mass of Inflatable Aerodynamic Decelerators,” 8th Annual International Planetary Probe Workshop (IPPW-8), Portsmouth, VA, June 6-10, 2011.
[16] Dwyer Cianciolo, et. al., “Entry, Descent and Landing Systems Analysis Study: Phase 1 Report,” NASA/TM-2010-216720, March 2010.
[17] Dwyer Ciancolo, et. al.,” Entry, Descent and Landing Systems Analysis Study: Phase 2 Report on Exploration Feed-Forward Systems,” NASA-TM-2011-217055, March 2011.
[18] Findlay, J.T., Kelly, G.M., “A Recommended Entry Reconstruction Process for the Pioneer Venus Multi-Probe Mission,” NASA CR-158962, 1978.
[19] Venkatapathy, E., Allen, G., Prabhu, D., and White, T., “Going Beyond Rigid Aeroshells: Enabling Venus and Outer-Planet in situ Science Missions with Deployables,” 8th Annual International Planetary Probe Workshop (IPPW-8), Portsmouth, VA, June 6-10, 2011.
[20] Wright, M.J., White, T., and Mangini, N., “Data-Parallel Line Relaxation Methods (DPLR) Code User Manual Acadia-Version 4.01.1,” NASA/TM-2009-215388, October 2009.
[21] Whiting, E. E., Park, C., Liu, Y., Arnold, J.O., and Paterson, J.A., “NEQAIR96, Nonequilibrium and Equilibrium Radiative Transport and Spectra Program: User’s Manual,” NASA RP-1389, NASA, December 1996.
[22] Space Technology Division, NASA Ames Research Center (2011). Thermophysics Facilities Branch Fact
Sheet [Online]. Available: http://thermo-physics.arc.nasa.gov/fact_sheets/ArcJet%20Fact%20Sheet.pdf
14
BIOGRAPHIES
Soumyo Dutta is a graduate research
assistant at the Georgia Institute of
Technology. He has interned at the
NASA Jet Propulsion Laboratory,
Langley Research Center, Ames
Research Center and Charles S.
Draper Laboratory. He received a
B.S. in Mechanical Engineering from
the Univ. of Tennessee and a M.S. in Aerospace
Engineering from Georgia Tech and is currently pursuing
his Ph.D. His research interest is in the area of
parameter estimation for EDL vehicles, especially
reconstructing trajectory, atmosphere and aerodynamic
properties of entry vehicles from on-board flight sensors.
He is advised by Dr. Robert Braun.
Brandon Smith is an aerospace
engineer in the Entry Systems and
Technology Division of NASA Ames
Research Center. His current work
involves design of deployable
atmospheric entry vehicles and
developmental flight instrumentation
for the Orion Flight Test One
heatshield. He received a B.S. and
M.S. in Aerospace Engineering from Georgia Tech.
Dinesh Prabhu is a Senior
Research Scientist with ERC, Inc.,
an onsite contractor at NASA Ames
Research Center. He received his
B.Tech. in Aeronautical Engineering
from the Indian Institute of
Technology at Madras, India, and
his Ph.D. in Aerospace Engineering
from the Iowa State University at Ames, Iowa. His
interests are in modeling and simulation of high-
temperature hypersonic flow fields, and in
aerothermodynamic design of entry vehicles.
Ethiraj Venkatapathy is currently
the Chief Technologist for the
Entry Systems and Technology
Division at NASA Ames Research
Center. He received his B.Tech. in
Aeronautical Engineering from the
Indian Institute of Technology
Madras, India, and his Ph.D. in
Aerospace Engineering from the Iowa State University at
Ames, Iowa. He is currently leading the technology
development efforts, as the PI for the Conformable and
Flexible Thermal Protection System (CFA-TPS), the
mechanically deployable semi-rigid ADEPT project and
Woven Thermal Protection System (WTPS) project.