misinvoicing analysis in asean-china free trade aggrement .... mahjusekananda_xxi_1_18.pdf ·...
TRANSCRIPT
European Research Studies Journal Volume XXI, Issue 1, 2018
pp. 187-205
Misinvoicing Analysis in ASEAN-China Free Trade
Aggrement (ACFTA)
Mahjus Ekananda1
Abstract:
This paper specifically examines the Smuggling that occurred between Indonesia and the
ACFTA member countries can be seen from the import-export trade gap.
Smuggling occurs because the attempt to avoid tariffs, resulting in the manipulation of
incoming documents, both in terms of quantity and price of imported goods. The policy
change tariff rates on ACFTA cooperation and increase financial penalties affecting
allegedly smuggling.
This study uses a fixed effect panel data regression to analyze the policy change. The results
obtained are: 1. The reduction of smuggling after the application of policy to reduce tariff
rates on ACFTA cooperation, and 2. A decrease in smuggling after the implementation of the
policy of increasing the maximum financial penalties.
Keyword: Smuggling, Tariff Rates, Financial Pinalties.
JEL Code: F14, H26, K42.
1Lecturer and Researcher, Faculty of Economy and Bussines, University of Indonesia, E-
mail: [email protected]
Misinvoicing Analysis in ASEAN-China Free Trade Aggrement (ACFTA)
188
1. Introduction
According to Buehn-Eichler (2010), misinvoicing is an indicator that there is a
smuggling activity in trade between states. This study analyzes the trade relations
between Indonesia and China and six selected ASEAN countries. The ASEAN
countries are Thailand, Singapore, Malaysia, Vietnam, Brunei and
Philippines. These countries were selected, since they have highest six largest
trading interactions with Indonesia in terms of imports (BPS, 2015). If we see the
import value each year, total import of Indonesia is higher than the six selected
ASEAN countries2. The greater the import value of a country indicates that the trade
interaction between importing countries with other countries is running well,
because mutual need from the economic side. The data used are annual data
obtained from BPS, National Bureau of Statistics of China, World Integrated Trade
Solutions and The Observatory of Economic Complexity from 2000-2014.
Nitsch (2009) states that smuggling occurs through two lines. The first line is
smuggling that occurs by entering imported goods through lines that are not
supervised by customs officers. For example, smuggling occurs in border areas. This
method has a great risk, because in carrying out its activities smugglers must avoid
guarding water police posts and it is usually done at night. Usually illegal goods
such as drugs, illegal weapons and human trafficking are entered in this way. Nitsch
(2009) calls this as black-ship smuggling.
The second line is to hide the value of import by manipulating the document
(manifesto) entry. The document records the characteristics of the goods such as the
weight, quality and quantity of imports. This manipulation of records makes the
difference between what is recorded in the document (manifesto) and what happens
in reality. Nitsch (2009) defines this as a camouflage misinvoicing. This line is
certainly through the legal channels listed in the Customs, therefore the differences
in data that occurs certainly caused by camouflage misinvoicing. According to
Nitsch (2009) this method is relatively more expensive but less risky when
compared with black-ship smuggling. It is because, through this way usually the role
of Customs supervisor is needed to bribe officers of the Pak Lily. This study
analyzes the misinvoicing that occurs in the second line, arguing that the second
track recorded in statistical data of BPS and statistical data of each country, namely
China and six selected ASEAN countries. Surely, it is clear that the first line is not
listed as an incoming or outgoing export import. The data analyzed are data from
2000-2014 with BPS sources, China Bureau of Statistics, World Integrated Trade
Solutions and Observatory of Economic Complexity.
Misinvoicing that occurred between Indonesia and China and some ASEAN
countries from 2000-2012 fluctuated. It can be seen in Figure 1.

M. Ekananda
189
Figure 1. Value of Misinvoicing Indonesia with China, Thailand, Malaysia, Vietnam
and Brunei.
Source: BPS (2015), National Bureau of Statistics of China (2015), and World Integrated
Trade Solution (2015).
If we see the coal imports between Indonesia and China from 2011-2013, there is
always an average gap of $ 2,326.5 million USD. In 2011, Indonesia exported coal
amounted to $ 7,568.9 million USD, while China only received $ 5,081.1 million
USD. In other commodities such as copper ore they are also misinvoicing. In 2008
Indonesia exported copper ore to China $ 27.8 million USD but the importing figure
by China was only $ 25.5 million USD. This trade gap continues to increase to the
highest level in 2013 at $ 74.4 million USD (BPS, 2016 and Observatory of
Economic Complexity, 2016). These figures show that there is a trade problem
between Indonesia and China.
Rice exports from Vietnam in 2010 had a difference of $ 36.31 million USD of the
total rice imported by Indonesia. Similarly, in 2011 that amounted to $ 88.66 million
USD. This is due in 2011 Vietnam surplus rice production so that the price of
Vietnamese rice is cheaper than the domestic rice. However, this difference
decreased to $ 7.28 million USD in 2012 (Table 1).
Table 1. Gap of Export-Import Trade between Indonesia Rice with Vietnam
(2009-2013, million USD)
Recorded Value 2009 2010 2011 2012 2013
Vietnam exports to Indonesia 7.38 250 957 511 91.6
Indonesia imports from Vietnam 7.28 213.68 868.34 518.28 89.26
Gap 0.098 36.31 88.66 7.28 2,33
Source: BPS (2015) and Observatory of Economics Complexity (2015), processed.

Misinvoicing Analysis in ASEAN-China Free Trade Aggrement (ACFTA)
190
Misinvoicing does not only happen in ACFTA cooperation but also in other
countries. For example, in the countries of Sub-Saharan Africa misinvoicing values
occur each year to a great extend (Table 2).
Table 2. Misinvoicing Trade In Five Countries of Sub-Saharan Africa
(2002-2011, million USD).
Country Misinvoicing Exports Misinvoicing Imports
Under-Invoicing Over-Invoicing Under-Invoicing Over-Invoicing
Ghana 568 -270 -464 221
Kenya 1029 0 -438 42
Mozambique 140 -79 -247 119
Tanzania 0 -1034 -11 829
Uganda 26 -46 0 831
Source: Baker et al. (2014).
Misinvoicing plays a big role in terms of illegal goods transactions in the world. The
Global Financial Integrity's (GFI) 2013 report calculates that developing countries
averagely lose $542 billion dollars annually over the past 10 years due to illegal
trade. Some 80 percent of that value occurs because of misinvoicing. The
government cannot receive income from the transaction. African countries lost
between $597 billion to $1.4 trillion out of the continent (1980-2009).
According to Baker (2014) misinvoicing is done by manipulating incoming
documents, either in terms of price, quantity or quality being imported or
exported. Baker (2014) and Buehn-Eichler (2010) stated that misinvoicing is an
indication of smuggling. They stated there was a significant relationship between
misinvoicing with incentives for smuggling. This is not only an economic problem,
but also a moral hazard issue; therefore, this economic phenomenon is interesting to
examine (Nechaev and Antipina, 2016).
According to Buehn-Eichler (2010), Nitsch (2009) and Buehn-Eichler (2010),
misinvoicing was created for economic motives. As an illustration, if the imported
goods entering a country are not recorded, then the entrepreneur (exporter) may gain
advantage from the black market, because it is eluded from taxes and import
duties. For example,17 percent of tax revenue on import duty is not payable in the
United States (Slemrod and Yatzhaki, 2000).
Misinvoicing analysis between Indonesia and China and ASEAN member countries
over the past ten years shows that there are indications of smuggling of Chinese
goods to Indonesia, as well as from ASEAN countries to Indonesia. Smuggled goods
managed by the Directorate General (DG) of Customs and Excise tends to increase
from year to year. According to Customs data (2014), in the period of January to
May 2014 the successful prosecution was 1,748 cases with a total value of Rp 34.25
billion. This amount is smaller when compared to the same period in 2013 with the
M. Ekananda
191
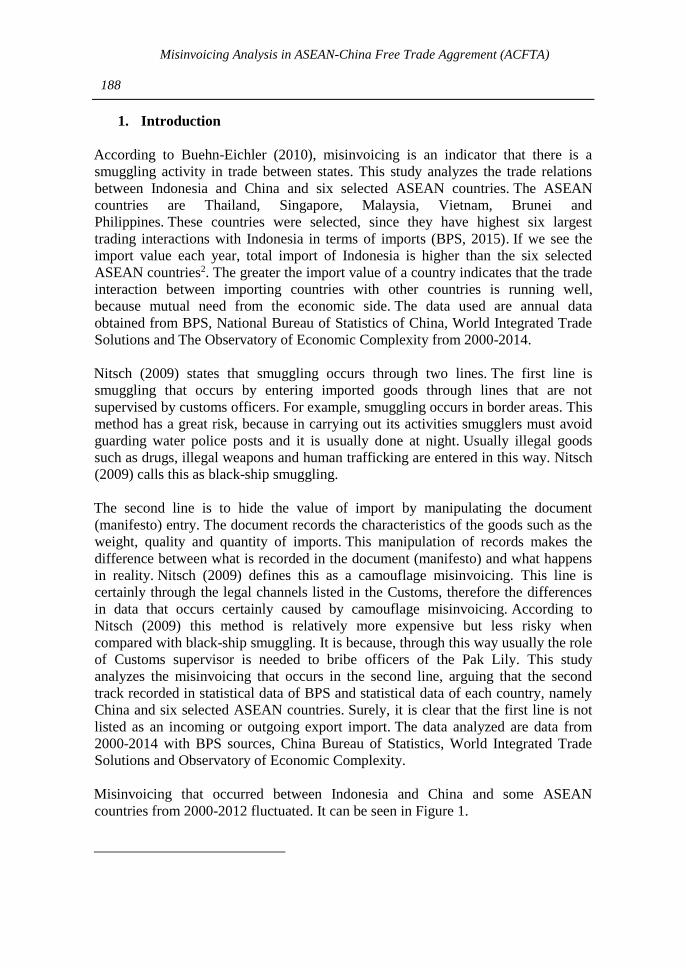
number of 2,021 cases with a value of Rp 175.49 billion. Table 3 shows the export-
import gap between China and Indonesia from 2009-2012 occurred in large
numbers.
Table 3. Value Gap of China's exports to Indonesia (million USD).
Year China Export Indonesia Import Gap
2009 14720.53 14002.17 718.36
2010 21953.57 20422.22 1,529.35
2011 29.217,24 26212.18 3.005.05
2012 34283.37 29387.07 4.896,30
Source: BPS (2015) and National Bureau of Statistics of China (2015).
At the commodity level, for example the export-import trade of coal between China
and Indonesia also ecountered a trade gap. This is described in Table 4.
Table 4. Value Gap Trading Export-Import Coal China and Indonesia (2009-2013,
million USD).
Value Recorded 2009 2010 2011 2012 2013
Indonesia Export to China 2071,7 4.391.8 7568,9 7305.5 6894
China Import from Indonesia 1772,7 3663,6 5318.1 5081.8 4490.9
Gap 298.97 728.16 2250 2223,6 2403
Source: BPS (2015) and Observatory of Economics Complexity (2015), processed.
Misinvoicing between Indonesia and China and some ASEAN countries indicates
there is a problem in Indonesian trade and the control of Indonesian imports from
those countries. The supervision was carried out by the Customs and Excise
Officers. Fundamentally, misinvoicing occurs with the agreement between the seller
(exporter) and the buyer (importer) in the transaction (Baker 2014). Both parties do
so in order to avoid import duty tax. Therefore, the level of corruption between the
exporting country and the importer allegedly has effect on misinvoicing.
Misinvoicing may be an additional benefit for exporters if it passes the Customs
Officer's checks, as it does not pay import duties. In his research, Fung et al. (2011)
and Murphy (2011) state that there is a link between misinvoicing and corrupt acts.
The Indonesian Corruption Survey report issued by Transparency International in
2015 indicates the potential for corruption in Customs and Excise continues to
increase from 2014. This indicates that the Customs and Excise Directorate General
is vulnerable to corruption, as it always interacts with local and international
businesspeople. Global Financial Integrity examines the potential state revenue that
lost in trading of Sub-Saharan African countries from 2002-2011. It found that
Ghana lost $ 386 million, Kenya lost $ 435 million, Mozambique $ 187 million, and
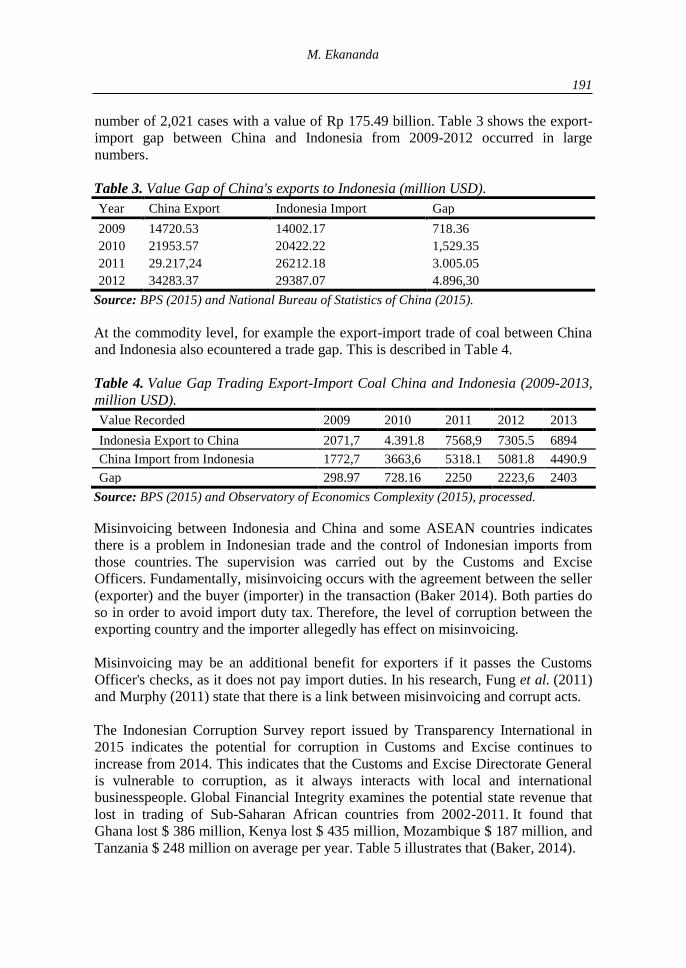
Tanzania $ 248 million on average per year. Table 5 illustrates that (Baker, 2014).
Misinvoicing Analysis in ASEAN-China Free Trade Aggrement (ACFTA)
192
Table 5. Mean Loss of Revenue Sub-Saharan Africa Due Misinvoicing (2002-2011)
million US.
Country Average
State
Revenue
Mean Loss of State Income Due to
Misinvoicing
Percentage of
Loss
Ghana 3.494 386 11%
Kenya 5.242 435 8.3%
Mozambique 1.793 187 10.4%
Tanzania 3.339 248 7.4%
Source: Global Finance Integrity, 2014.
Changes to the Law on Customs in 2006, which dealt with maximum fines sanctions
on smuggling, should reduce smuggling activities. Whereas the change in the
maximum penalty is charged significantly, from Rp. 500,000,000 to
Rp. 5,000,000,000 after 2006. Based on the study of Buehn-Eichler (2010), and
Fisman-Wei (2004), the increased penalty sanctions should be inversely proportional
to smuggling activities. However, the reality from year to year misinvoicing is still
happening which indicate the existence of smuggling. This is interesting to examine,
because there must be another reason why this is still happening.
Based on the above exposure, then the question about the condition is
raised. Therefore, it is necessary to formulate the problem to limit the discussion in
this research with a question of the problem as follows: Is the change of import duty
tax, the maximum fine sanction and the level of corruption affecting misinvoicing
change in ACFTA trade cooperation?
2. Research on Misinvoicing
There are two common approaches to analyze misinvoicing. The first approach is to
analyze the effects of misinvoicing (smuggling/illegal trade). Nitsch (2009) states
that smuggling is an activity aimed to avoid taxes and import duties and has
hypothesized that smuggling (illegal trade) may increase or may not improve
welfare (Suryanto and Thalassinos, 2017).
The second approach is to find the determinant of misinvoicing. Buehn-Eichler
(2010) state that misinvoicing occurs in order to avoid incoming taxes. Buehn-
Eichler (2010), Fishman-Wei (2004) and Buehn -Eichler (2010), state that tax is a
significant determinant in influencing misinvoicing as an effort to avoid taxes. They
claim that the greater the tax duty per GDP the higher the increase in smuggling
(misinvoicing).
Farzanegan (2008), and Buehn-Eichler (2010), in their studies concluded that fine
sanctions negatively affect smuggling activities which is indicated by
misinvoicing. Fisman and Wei (2004) in a following research in 2009 found that
M. Ekananda
193
smuggling is closely related to corruption in a country. They analyze smuggling
relationships with corruption in the trade in antiques and cultural art objects. Murphy
(2011) and Suryanto (2016) used the Control of Corruption index as the dependent
variable to analyze misinvoicing. Murphy explicitly proposed the hypothesis that
there is a significant relationship between the level of corruption of a country and
the difference in the listing of exports. Murphy's study (2011) suggests that trade
openness is significant against misinvoicing. Same result has been made from a
research conducted by Buehn-Eichler (2010), which states that the trade openness
has a significant positive effect on import-misinvoicing.
3. Literature Review
Buehn-Eichler (2010) analyzed the optimal profit value of misinvoicing on export-
import trade between the United States and its 86 trading partners. Buehn-Eichler
stated that domestic traders when they import goods from abroad at an amount of M
they consider the domestic traders doing misinvoicing amounted to SM, so that the
value recorded by the authorities is M – SM. There are two possibilities in terms of
the record, the first is that underinvoice import SM> 0, so that the value of imports
recorded by the authorities is smaller than the actual import. The second is
overinvoice import SM< 0, so that the value of imports recorded are larger than the
actual value. The importers‘ decision to misinvoicing depends on the income they
earn from this activity. The next step is to determine what the optimal value of SM is
to get the highest revenue. They pay attention to determinants of misinvoicing, such
as taxes, fines and exchange rates. Therefore, the optimal value of misinvoicing is
the absolute value of |SM|. The expacted benefits from import-misinvoicing E(πM) is
as follows:
E(πM) = (1-tinc)[R(M) – (1+tM)epd (M-SM)] – (1+v) epd SM – prob (|SM|, H) (1)
with the ∂ provisoprob /∂ SM >0, (∂ prob)2 /(∂ SM) 2 >0 and ∂ prob /∂ H>0
where tinc is a notation for income taxes of imports, R(M) is revenue from imports,
tM is the import tax, e is the official exchange rate in units of US dollars, pd is the
price index of domestic and v is the black-market premium or gap between the
official exchange rate and the exchange rate on the black market.
The cost of import-misinvoicing increases against H, i.e. the risk of detected
authorized officer and F the fine sanction if misinvoicing activity is detected.
Importers earn revenues as R(M), while misinvoicing recorded after paying import
tax which is (1+tM)epd (M-SM). After importers pay income tax on the import of the
revenue recorded the amount is (1-tinc)[R(M) – (1+tM)epd (M-SM)].
In the case of import underinvoicing, SM> 0, the importer pays the value of imports
that are not listed with the unofficial exchange rate, so that the amount paid is (1+v)
epd SM. In the case of import overinvoicing SM< 0, the value of imports recorded a
Misinvoicing Analysis in ASEAN-China Free Trade Aggrement (ACFTA)
194
greater than imports in fact, that prepared a new equation to analyze the income
derived from misinvoicing imports as follows:
E(πM)=(1-tinc)[R(M)-(1+tM)epdM]+[(1-tinc)(1+tM)-(1+v)]epdSM- prob(|SM|, H) (2)
The import underinvoicing is optimal if SM> 0 ;(1-tinc) (1+tM) - (1+v) > 0.
Therefore, it can be concluded that the optimal advantage is obtained by the importer
by doing underinvoicing in the case of high income taxes and high import
taxes. Import overinvoicing optimal iwhen SM< 0; (1-tinc) (1+tM) - (1+v) < 0, or if
the importer gains optimal tax, low income and low import taxes.
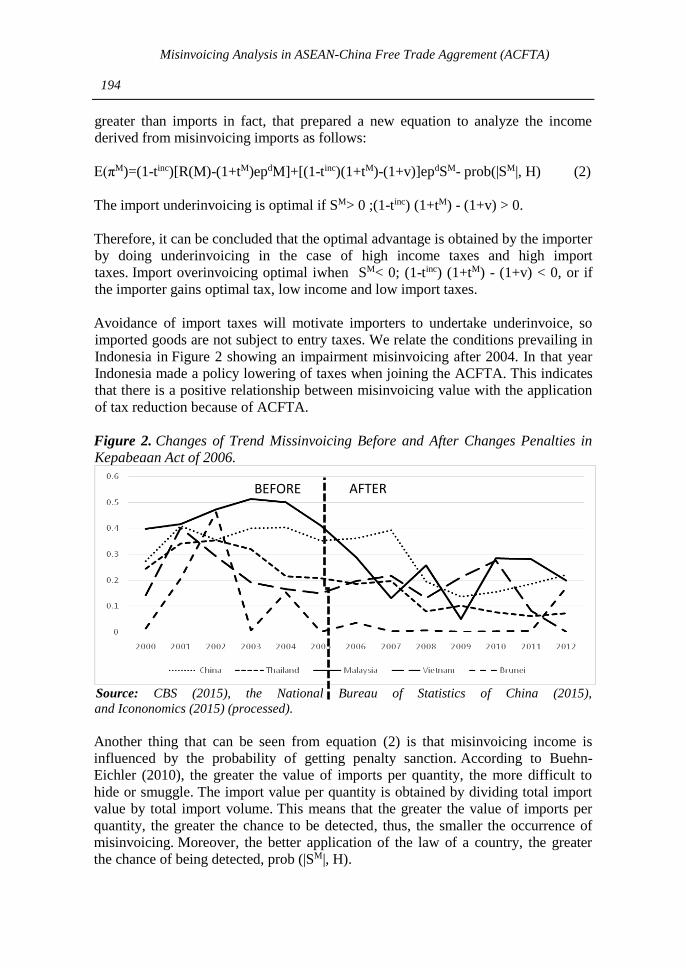
Avoidance of import taxes will motivate importers to undertake underinvoice, so
imported goods are not subject to entry taxes. We relate the conditions prevailing in
Indonesia in Figure 2 showing an impairment misinvoicing after 2004. In that year
Indonesia made a policy lowering of taxes when joining the ACFTA. This indicates
that there is a positive relationship between misinvoicing value with the application
of tax reduction because of ACFTA.
Figure 2. Changes of Trend Missinvoicing Before and After Changes Penalties in
Kepabeaan Act of 2006.
Source: CBS (2015), the National Bureau of Statistics of China (2015),
and Icononomics (2015) (processed).
Another thing that can be seen from equation (2) is that misinvoicing income is
influenced by the probability of getting penalty sanction. According to Buehn-
Eichler (2010), the greater the value of imports per quantity, the more difficult to
hide or smuggle. The import value per quantity is obtained by dividing total import
value by total import volume. This means that the greater the value of imports per
quantity, the greater the chance to be detected, thus, the smaller the occurrence of
misinvoicing. Moreover, the better application of the law of a country, the greater
the chance of being detected, prob (|SM|, H).
BEFORE AFTER

M. Ekananda
195
On the same side equation 2 indicates that F can be a deduction of financial penalties
income from smuggling activities (misinvoicing). If misinvoicing activities are
subject to fines sanction then surely the income of misinvoicing activities will
decrease.
4. Model Selection Strategy
The graphical presentation of misinvoicing between Indonesia and China, Malaysia,
Thailand, Vietnam, and Brunei shows the heterogeneity and fluctuations in each
year in Figure 2. Likewise, with the graphical presentation of Indonesia's trade data
gaps with these countries in Figure 3.
Figure 3. Gap Indonesia Trade Import from Countries ACFTA.
Source: National Bureau of Statistics of China (2015), and World Integrated Trade Solution
(2015) (processed).
Figure 3 shows that the specific characteristics (heterogeneous) which affects the
position of the trade gap each year. Therefore, panel data analysis is suitable for use
in this study. Figure 2 shows the pattern of misinvoicing and how it changed after
the tax reduction demonstrating the special characteristics that can be treated with
panel data analysis.
In panel data analysis, there are three types of models. The common effect model,
the fixed effect model and the random effect model. To select one of the three types
of models it is necessary to do some testing. The first test is Wald's test to determine
whether or not individual effects exist. The test is performed by comparing the value
of R2 of the common effect model with the fixed effect model. Then the Lagrangean
Multiplier (LM) test to see if the common effect model is better than the random
effect model. Third is the Hausmann test to test whether the fixed effect model or
the random effect model is better to be used. The selection of the final model will be
further elaborated in the section of the panel data model selection.
Misinvoicing Analysis in ASEAN-China Free Trade Aggrement (ACFTA)
196
5. Estimation Strategy
Buehn (1981) states that misinvoicing is an indicator of smuggling. The main
purpose of exporters to do smuggling is to avoid customs taxes. However, it should
be noted that smuggling activities are closely related to the size of the sanctions and
the level of corruption of the export destination countries (Fisman-Wei, 2004 and
Murphy, 2011). This study takes the focus of import duty tax changes before and
after ACFTA cooperation on misinvoicing. Therefore, a basic thought is developed
to analyze the response of determinants of misinvoicing in addition to changes in
import duty rates.
The model designed in this study is schemed to answer the questions in the
formulation of the problem. This model refers to the research of Murphy (2011),
Ekananda (2016) and Alano (1984). Empirical models used in this study are as
follows:
(3)
Where is the misinvoicing value as a ratio between the value of the trade gap
( ) with the value of imports of country i in t year in million USD , ACFTAt is
a dummy ACFTA taking the value of 1 during the period 2004-2014 and 0 in the
period 2000-2003, is the index Control of Corruption in country i in t year, Fit
is a maximum log fined for the activities of smuggling imports of country i in t year
in USD, ijt is the value of average importing country i from country j in t year in
million USD, TO ijt is the value of trade openness of country i in t year, t is year
2000-2014, i is notation for country of Indonesia, j is notation for member country of
ACFTA. These countries are China, Singapore, Thailand, Malaysia, Philippines,
Vietnam and Brunei.
The panel data model has three different approaches, based on the presence or
absence of multiple effects on the independent variables. The panel data model
includes:
1. The least squares approximation (pooled least square/common effect);
2. The fixed effect approach;
3. The random effect approach (Baltagi, 2001).
Therefore, to select one of the three panel data estimation approaches, a series of
tests is required. The tests are Wald Test, Hausman test and LM test.
6. Operational data and sources
The data used in this study is a panel data set which is a cross-sectional data set of
seven member countries of ACFTA (China, Singapore, Thailand, Malaysia,
Philippines, Vietnam and Brunei Darussalam) and time series data in the form of
annual data from 2000 to 2014 from BPS and international data source agencies.
M. Ekananda
197
The variable of misinvoicing ( ) is formed by a gradual process. First, it is
necessary to calculate the trade difference to determine the value of
misinvoicing. The value is derived from the difference between the value of
Indonesian imports ( ) from j country, with the export value of j country to
Indonesia ( ). The value of this difference is selected in the same year from
2000-2014. All export and import values are in USD units. The j countries are
China, Malaysia, Singapore, Thailand, Philippines, Brunei and Vietnam. Import data
is the data of Indonesian imports recorded in BPS, while the export data of selected
ACFTA member countries are recorded in international statistical institutions as well
as their respective statistics agencies. Therefore, the misinvoicing value is the
import-misinvoicing value. This approach refers to Fisman-Wei (2009), Farzanegan
(2008), Ekananda (2017) and Murphy (2011).
(4)
Absolute value is used to know as the value of trade difference only, without need to
know whether the difference happened because of over-invoicing or under-
invoicing. (Kar and Cartwright-Smith, 2008). The value of exports recorded with
FOB (Free on Board) means that the value of exports recorded excluding shipping
costs, while the value of imports recorded as CIF (Cost, Insurance, Freight) means
the cost of cargo, the insurance and the the value of imports. It is assumed that 10
percent of the value of the real imports are fees and insurance3. Equation 4 is
converted into equation 5 as follows:
(5)
Where is the trade difference between Indonesia and j country in million
USD, is the value of j country export to Indonesia in t year, is the value of
Indonesia's import from j country in t year, i is the notation for Indonesian state, j is
the notation for selected ACFTA member countries.
After that, we calculate by dividing the difference in trade with import value
M IJT of Indonesia in the same year. This value shows a picture of how much trade
difference is between Indonesia as an importing country with selected ACFTA
member countries, as exporting countries, to the total value of Indonesian
imports. Here is the equation:
(6)
3This method is refer to the literature of Morgentern (1950), McDonald (1985), Kar &
Cartwright-Smith (2008) and Farzanegan (2008).
Misinvoicing Analysis in ASEAN-China Free Trade Aggrement (ACFTA)
198
The Control of Corruption used is corruption from importing countries, namely
Indonesia‘s (CoCit) and the control of corruption elected from ACFTA member
countries. The control of corruption indicator has a range value of -2.5 to 2.5. This
range means that a value of -2.5 means very corrupted and a value of 2.5 means not
correpted.
To facilitate the interpretation of results from data processing, CoCit data needs to be
transformed. The smallest value of CoCit is -2.5 changed to 0 by adding the largest
value of CoCit, so the highest value becomes 5. Thus, the range of CoCit values that
have been transformed is between 0 - 5. The maximum penalty of Indonesia will be
converted to Dollar (USD) units calculated by the following formula:
(7)
where Fit is the Indonesia maximum fine sanctions, in t year, F1 is the Indonesia
maximum fine sanctions in the period of 2000-2005, F2 is the maximum fine
sanctions in Indonesia in the period from 2006 to 2014, et is the exchange rate in t
year (Rp/USD). After getting maximum fine sanction with USD unit then
transformed data into logarithm. Therefore, a maximum penalty sanction variable
( ) is arranged in which states change the nominal value of the maximum penalty
sanction (USD) to analyze its relationship to misinvoicing in 2000-2014. Average
import value ( ) is calculated by the formula:
(8)
where, is the import average of i country from j country in t year, is the
value of imports of country i from j country in t year, is the volume of
imports of country i from j country in t year, i is the notation for the state of
Indonesia, j is a notation for selected ACFTA country.
Trade of openness ( ) is used as a control variable that states the ratio of total
trade between countries with GDP-PPP. The calculation of trade openness is as
follows:
(9)
where, Xit is a total export value of Indonesia in year t, Mit is Indonesia's total import
value in t year, GDPit is Indonesia's gross domestic product in t year. The selected
countries are members of ACFTA and have interaction of import-export trade with
Indonesia. These countries are selected because they have the highest export value to
Indonesia among other ACFTA members (2000-2012).

M. Ekananda
199
The study uses these variables with the basic problem formulation that has been
discussed in the previous section. In addition, these variables are derived from
references of previous studies. The data used are annual data, as used by Buehn-
Eichler (2010), Nitsch (2009), Thusby et al. (1991), Murphy (2011) and Oskoee-
Goswami (2003).
7. Analysis of Results and Discussion
This section will explain the results obtained from data processing with the
regression model that has been determined before. The process is to estimate the
model using fixed effect data panel model and the weighted seemingly unrelated
regression (SUR). Through the estimation method we will conduct an interpretation
of variable coefficients and significance to explain the relationship with the
dependent variable. Then the estimation results are compared with the actual
conditions that occurred in ACFTA trade cooperation.
Table 6. Result of Empirical Misinvoicing Regression Model Misinvoicing.
Variables (1) (2) (3)
Lag dummy ACFTA -0.072998**
(0.033155)
-
0.094444***
(0.030801)
-0.09153***
(0.034126)
Lag maximum penalty sanctions -0.115872***
(0.022861)
-0.065934*
(0.036493)
-0.079057*
(0.041326)
Control of corruption Indonesia -0.427095***
(0.092979)
-
0.282372***
(0.084416)
-0.285486**
(0.095163)
Control of corruption of the exporting
country - -
0.129124**
(0.053018)
Average import value of Indonesia -
-
-
0.067691***
(0.019251)
-0.066381***
(0.019626)
Trade openness -
-
0.004461
(0.002917)
0.002624
(0.003367)
Individual effects
China 0.010568 0.031285 0.116294
Thailand -0.187554 -0.18557 -0.132921
Malaysia 0.005206 -0.012 -0.024321
Singapore 0.602856 0.598995 0.327366
Vietnamese -0.197051 -0.22221 -0.123472
Philippines 0.028745 0.081123 0.178147
Brunei -0.262769 -0.29162 -0.341093
Adj. R2 0.784108 0.825264 0.805597
Fstat 37.31950 *** 39.64196 *** 32.07956 ***
*** p <0.01 ** p <0.05 * p <0.1.
Misinvoicing Analysis in ASEAN-China Free Trade Aggrement (ACFTA)
200
The estimation results showed the sign of coefficient of each variable in accordance
with the research hypothesis. Variable change of a decreased import duty tax shows
a negative sign (minus). Likewise, with the variable increase of the maximum
penalty sanction and the corruption variables in Indonesia, these two variables
indicate the sign of variables in accordance with the research hypothesis. Control
variables such as the value of the average import and trade openness trade also show
the variable mark according to the research hypothesis. Table 6 shows the results of
an empirical model misinvoicing regression.
7.1 Misinvoicing Analysis by Model I
The regression results have adjusted R2 value of 78 per cent meaning that the study
variables explained 78 percent of the variance of misinvoicing. In this first model
analysis, the researcher wanted to show the relation of the ependent variable owned
by Indonesia only in the terms of policy or special characteristic of Indonesia,
towards misinvoicing. The variables of the tax policy change (dummy ACFTA) and
the maximum penalty change (F) are Indonesian variables in terms of policy change,
while the corruption variable (CoCit) is a special characteristic variable owned by
Indonesia. This is the first regression coefficient observation.
It can be stated that there is a decrease of misinvoicing of 0.072998 after the policy
of tax reduction is implemented in 2004-2014. This is compared before the tax
reduction policy was implemented in 2000-2003. By increasing the maximum
penalty of one percent it will lower the import misinvoicing value by 0.115872.
Based on the results of the regression models revealed that the increase in the
control of corruption will decrease import misinvoicing.
Testing hypotheses indicate that internal factors of Indonesian state that researchers
make misinvoicing is proven to be a statistically significant effect on misinvoicing
based on the results obtained by data processing of individual effects of each country
against misinvoicing. These individual effects indicated by the intercept of each
country stating that there are unobserved variables that has not been commonly
described by the panel data. The intercept of each country also showed a trend of a
country against misinvoicing. From the observed results of the regression models,
misinvoicing caused by the interaction of trade between Indonesia and Singapore is
relatively higher than with the other six member states in ACFTA. The magnitute of
this misinvoicing between Indonesia and Singapore is followed by the
corresponding values between Indonesia and the Philippines, China and Malaysia.
7.2 Misinvoicing Analysis by Model II
Two states that misinvoicing is not only influenced by internal factors, for exmple
the Indonesian state, but also they have been influenced by external factors, namely,
the interaction of trade in the form of an average value of imports and trade
M. Ekananda
201
openness4. Both of these determinants added in order to enhance the interpretation of
the results. The hypothesis testing showed that external factors also affect
misinvoicing. This is shown by F value which showed that all independent variables
significantly influence misinvoicing. The regression results have an adjusted R2 0.82
which means that the study variables explained 82 percent of the variance of
misinvoicing. In other words, the remaining 18 percent variation of misinvoicing is
explained by unobserved factors.
Tests on ACFTA’s dummy coefficient regression show a negative sign, which
means that there is a decrease of 0.094444 after the lowering of taxes in the period
2004-2014. This is compared to prior to the entry tax reduction policy and of course
the same level of penalties, corruption, average import and trade openness. Test of
regression coefficients with maximum penalty showed a negative sign with a trust
level of 90 percent. This means an increase of one per cent of the maximum
financial penalties will reduce Indonesia’s imports misinvoicing by 0.065934 with
ACFTA member countries. The testing of the regression coefficient control of
corruption in Indonesia (CoCit) showed a negative sign beeing significant at the 99
percent confidence level. Based on the results of the regression model II, it is stated
that the increase in the control of corruption will decrease import misinvoicing. The
testing of the average value of imports coefficient showed a negative sign beeing
significant at 99 percent significance level. This means that the bigger the average
value of imports, the less the misinvoicing of Indonesian imports value with selected
ACFTA member countries. The test of trade openness coefficient showed positive
signs in accordance with the theories and the research hypothesis. However, the
coefficient of trade openness has 87 percent confidence level, a statistically
significant effect on imports‘ misinvoicing between Indonesia and ACFTA member
countries.
7.3 Misinvoicing Analysis by Model III
In the third model, the researchers add a new independent variable for the control of
corruption in ACFTA member countries elected as the exporting country. It
indicates the corrupting influence of the exporting country towards import
misinvoicing that occurred between Indonesia and the exporting country.
Overall, this model can be considered good, the reason is indicated by F statistic
which showed that all independent variables significantly influence misinvoicing.
The regression results have an adjusted R2 value of 0.83 indicating that 83 percent
the study variables explained the variation of misinvoicing. In other words the
remaining 17 percent variation in misinvoicing is explained by unobserved factors.
The control of corruption value in selected ACFTA members is not significant. This
4Internal Factor: decrease in import duty tax policy, rise in maximum fine sanction policy
and enhancement control of corruption Indonesia.
Misinvoicing Analysis in ASEAN-China Free Trade Aggrement (ACFTA)
202
shows that the improvement in the control of corruption did not record the exporter
decision to do misinvoicing.
Based on the results above it can be stated that there is a decrease of 0.09153
misinvoicing after the lowering of tax policies implemented in 2004-2014. This is
compared with the prior policy of tax reduction implemented in 2000-2003.
Other results of the regression models are stated that the increase in the maximum
penalty of one percent will lower the import misinvoicing by 0.079057. The results
revealed that the increase in the control of corruption will decrease import
misinvoicing. The testing of the coefficient control of corruption of selected ACFTA
member countries showed positive statistically significant signs.
The testing of the coefficient of the average value of imports showed a negative
statistically significant sign at 99 percent confidence level. This means that the
larger the average value of imports the less the misinvoicing in Indonesian imports
with selected ACFTA member countries. An increase in import value by an average
of 1 rupiah, the misinvoicing will be declined by 0.066381 rupiah.
7.4 Misinvoicing Analysis by all Models I, II, III
After obtained the results of misinvoicing by all the empirical models used, then the
question can be answered quite well regarding the problem formulation in this study.
Based on the regression results it has been proven that misinvoicing significantly
affect imports. In accordance with the theory and previous researches, the results of
the regressions state that the smaller the entry fee charged to imports, the lower the
level of misinvoicing. As shown in Figure 1 after 2005 the trend of imports‘
misinvoicing between Indonesia and ACFTA member countries has decreased.
Therefore, the results of this study are supported by what is happening in reality and
because of the very high fine sanctions imposed in 2007. This supports the results of
the regressions stating that the reduction in misinvoicing has been influenced by the
increase in the maximum financial penalties. These results are also consistent with
the theory and previous researches.
The control of corruption in Indonesia has also become an important determinant in
influencing misinvoicing. In accordance with the results of this study, control of
corruption in Indonesia has a negative impact on misinvoicing imports. This
indicates that performance has been improved on the part of Indonesian import entry
document examiner. It also shows the tax faud that allegedly occurred at the customs
has decreased, thus decreasing the chances of importers to manipulate data entry
documents.
On the other hand the control of corruption in exporting ACFTA member states, did
not show a significant effect so far. This is due to the value of control of corruption
M. Ekananda
203
because did not record the fraudulent activities of exporters, but only the record
variable in customs and the official corruption level in the country. It could be the
value of exports that occurred in the origin country to be in compliance with the
export document and not from the import side where it is possible to manipulate the
incoming document.
The analysis of the individual effects of each country shows that misinvoicing
imports resulting from trade between Indonesia and Singapore are relatively higher
than misinvoicing between Indonesia and other ACFTA member countries. This is
captured by the slope value of the individual effects of each country and it is
unobserved in this study. It means that this value is derived from another
independent variable that was not included. Allegedly, geological proximity of
Singapore to Indonesia and the weak supervision by customs officers make imports‘
misinvoicing between Indonesia and Singapore relatively larger than with the other
ACFTA member states.
8. Conclusions and Recommendations
Misinvoicing in tarde is described in a good, significant and consistent way in all
models used in this study. It can be seen from the value of counted F statistic and the
adjusted R2 . Independent variables used in this study are the following:
a) ACFTA dummy variable, the variable that shows the decrease in taxes after
ACFTA cooperation;
b) Maximum penalty variable, the variable that shows the change in the
maximum penalties for smuggling;
c) Control of corruption variable, the variable that reflects improvement of
control in corruption both in importing and exporting countries;
d) Average import value variable, the variable that shows the probability of
undetected misinvoicing officer or not;
e) Trade of openness, the variable that shows the import-export trade openness.
ACFTA dummy variables were able to explain the relationship with misinvoicing in
a proper, significant and consistent way in every empirical model. This variable
indicates that there is a decrease in misinvoicing after one year of application of the
government to reduce tax rates on ACFTA cooperation (2004-2014).
Maximum penalty variable is able to explain its relationship to misinvoicing in a
proper, significant and consistent way in every empirical model. This variable
indicates that increased penalties in the previous two years can reduce imports‘
misinvoicing in Indonesia with ACFTA member countries.
Indonesian control of corruption variable is able to explain its relation against
misinvoiving in imports in a proper, significant and consistent way. This variable
indicates that Indonesian corruption measure has been improved in the previous year
having a negative impact on misinvoicing imports in the period of 2000-2014.

Misinvoicing Analysis in ASEAN-China Free Trade Aggrement (ACFTA)
204
In selected ACFTA member states the control of corruption variable is unable to
explain the relationship of the imports‘ misinvoicing in a proper and significant way.
The average Indonesia‘s value of imports variable was able to explain its
relationship with misinvoiving in a proper, significant and consistent way in Models
II and III. This variable indicates that the average value of imports of Indonesia has
a negative impact in misinvoicing in the period of 2000-2014.
Indonesian trade openness variable is capable in explaining its relation against
misinvoiving in a proper, significant and consistent way in Model III. This variable
indicates that Indonesia's trade openness positively affects the misinvoicing of
imports in the period 2000-2014.
Misinvoicing imports between Indonesia and Singapore are relatively larger than
misinvoicing Indonesian imports with other member states in ACFTA. It is caused
by unobserved variables not included in this study.
References:
Andvig, J.C., Fjeldstad, H.O., Amundsen, I., Sissener T. and Søreide, T. 2000. Research on
Corruption: A Policy Oriented Survey, mimeo.
Arndt, C. and Oman, C. 2006. Uses and Abuses of Governance Indicators. OECD
Development Centre Studies.
Baker, B. 2014. Hiding in Plain Sight: Trade and Impact of Revenue Loss Ghana, Kenya,
Mozambique, Tanzania and Uganda, 2002-2011. Global Finance Integrity.
Baltagi, B.H. 2001. Econometrics Analysis of Panel Data. Second Edition, Chester England:
John Wiley & Sons, Ltd.
Beja, E. 2008. Estimating Trade Misinvoicing from China: 2000-2005. China and World
Economy 16(2), 82-92.
Buehn, A. and Eichler, S. 2010. Trade Misinvoicing: The Dark Side of World Trade. Journal
of the World Economy.
Buehn, A. and Eichler, S. 2006. Uncovering Smuggling: Worldwide Evidence for Four
Types of Trade Misinvoicing. Journal of Dresden University of Technology,
Germany.
Ekananda, M. 2016. Econometric Analysis. Data Panel. 2nd Ed. Mitra Wacana Media,
Jakarta.
Ekananda, M. 2017. Analysis of the Macroeconomic Impact towards the NPL National
Banking in Indonesia: The Study of Macro-Economic Shock Using Vector
Autoregression Models. European Research Studies Journal, 20(3A).
Farzanegan, M.R. 2008. Illegal Trade in the Iranian Economy: Evidence from a Structural
Model. CESifo Working Paper No. 2397, Munich, CESifo.
Fisman, R. and Wei S.J. 2004. Tax Rates and Tax Evasion. Journal of Political Economy,
112, 471–496.
Fung, HG., Yau, J. and Zhang, G. 2011. Reported Trade Figure Discrepancies, Regulatory
Arbitrage and Road-Tripping: Evidence the China-Hong Kong Trade Data. Journal of
International Business Studies, 42(1), 152-176.

M. Ekananda
205
Kar, D. and LeBlanc, B. 2013. Illicit Financial Flows from the Philippines: A Study in
Dynamic Simulation 1960-2011. Washington, DC., Global Financial Integrity.
Kaufmann, D., Kraay, A. and Mastruzzi, M. 2003. Governance Matters III: Governance
Indicators for 1996–2002. World Bank Policy Research Working Paper 3106.
Kaufmann, D., Kraay, A. and Mastruzzi, M. 2009. Governance Matters VIII: Aggregate and
Individual Governance Indicators 1996–2008. World Bank Policy Research Working
Paper 4978.
Knack, S. and Azfar, O. 2003. Trade Intensity, Country Size and Corruption. Economics of
Governance, 4, 1-18.
Michael, J.A. Murphy, M.A. 2011. El Orto Hueco Comercial : Corruption and the
Misreporting of Exports in Latin American Economies. Thesis, Georgetown
University.
Nechaev, A., Antipina, O. 2016. Analysis of the Impact of Taxation of Business Entities on
the Innovative Development of the Country. European Research Studies
Journal, 19(1), 71-83.
Nitsch, V. 2009. Trade Mispricing and Illicit Flow. The Dynamics of Illicit Flow from
Developing Countries. Washington, D.C., World Bank Group.
Oladeji, Olaniyi, M. 2010. Perception of Smuggling Among the Yoruba People of Oke-Ogun
of South Western Nigeria. Internet Journal of Crimanology.
Oskooee, M.B. and Goswami, G.G. 2003. Smuggling as another Cause of Failure of the PPP.
Journal of Economic Development, 28.
Slemrod, Joel, B. and Shlomo, Y. 2000. Tax Avoidance, Evasion, and
Administration.Working Paper no.7473, Cambridge, Mass., NBER.
Suryanto, T. 2016. Audit Delay and Its Implication for Fraudulent Financial Reporting: A
Study of Companies Listed in the Indonesian Stock Exchange. European Research
Studies Journal, 19(1), 18-31.
Suryanto, T., Thalassinos, I.E. 2017. Cultural Ethics and Consequences in Whistle-Blowing
among Professional Accountants: An Empirical Analysis. Journal of Applied
Economic Sciences, 6(52), 1725-1731.
Yalta, A.Y. and Demir, I. 2010. The Extent of Trade Misinvoicing in Turkey: Did Post-1990
Policies Matter? MIPRA Paper No. 30186, Hacettep University, Bilkent University.