mishin, evgeny and watkins, brenton and lehtinen,...
TRANSCRIPT

Mishin, Evgeny and Watkins, Brenton and Lehtinen, Nikolai and
Eliasson, Bengt and Pedersen, Todd and Grach, Savely (2016) Artificial
ionospheric layers driven by high-frequency radiowaves : an
assessment. Journal of Geophysical Research: Space Physics, 121 (4).
3497–3524. ISSN 2169-9402 , http://dx.doi.org/10.1002/2015JA021823
This version is available at https://strathprints.strath.ac.uk/55790/
Strathprints is designed to allow users to access the research output of the University of
Strathclyde. Unless otherwise explicitly stated on the manuscript, Copyright © and Moral Rights
for the papers on this site are retained by the individual authors and/or other copyright owners.
Please check the manuscript for details of any other licences that may have been applied. You
may not engage in further distribution of the material for any profitmaking activities or any
commercial gain. You may freely distribute both the url (https://strathprints.strath.ac.uk/) and the
content of this paper for research or private study, educational, or not-for-profit purposes without
prior permission or charge.
Any correspondence concerning this service should be sent to the Strathprints administrator:
The Strathprints institutional repository (https://strathprints.strath.ac.uk) is a digital archive of University of Strathclyde research
outputs. It has been developed to disseminate open access research outputs, expose data about those outputs, and enable the
management and persistent access to Strathclyde's intellectual output.

Journal of Geophysical Research: Space Physics
Artificial ionospheric layers driven by high-frequency
radiowaves: An assessment
Evgeny Mishin1, Brenton Watkins2, Nikolai Lehtinen3, Bengt Eliasson4,
Todd Pedersen1, and Savely Grach5
1Space Vehicles Directorate, Air Force Research Laboratory, Kirtland AFB, NewMexico, USA, 2Physics Department,University of Alaska Fairbanks, Fairbanks, Alaska, USA, 3Birkeland Centre for Space Science, University of Bergen,Bergen, Norway, 4Physics Department, Strathclyde University, Glasgow, UK, 5Department of Radiophysics, LobachevskyState University of Nizhny Novgorod, Nizhny Novgorod, Russia
Abstract High-power ordinary mode radio waves produce artificial ionization in the F region ionosphereat the European Incoherent Scatter (Tromsø, Norway) and High Frequency Active Auroral Research Program(Gakona, Alaska, USA) facilities. We have summarized the features of the excited plasma turbulence anddescending layers of freshly ionized (“artificial”) plasma. The concept of an ionizing wavefront createdby accelerated suprathermal electrons appears to be in accordance with the data. The strong Langmuirturbulence (SLT) regime is revealed by the specific spectral features of incoherent radar backscatter andstimulated electromagnetic emissions. Theory predicts that the SLT acceleration is facilitated in the presenceof photoelectrons. This agrees with the intensified artificial plasma production and the greater speedsof descent but weaker incoherent radar backscatter in the sunlit ionosphere. Numerical investigation ofpropagation of O-mode waves and the development of SLT and descending layers have been performed.The greater extent of the SLT region at the magnetic zenith than that at vertical appears to make magneticzenith injections more efficient for electron acceleration and descending layers. At high powers, anomalousabsorption is suppressed, leading to the Langmuir and upper hybrid processes during the whole heateron period. The data suggest that parametric upper hybrid interactions mitigate anomalous absorption atheating frequencies far from electron gyroharmonics and also generate SLT in the upper hybrid layer. Thepersistence of artificial plasma at the terminal altitude depends on how close the heating frequency is to thelocal gyroharmonic.
1. Introduction
Coupling of high-power high-frequency (HF) pump electromagnetic waves with the ionosphere is mediatedby HF-excited plasma turbulence. Its usual manifestations for HF pump waves of ordinary (O) polarizationare enhanced plasma and ion lines in the incoherent scatter radar (ISR) spectra [e.g., Stubbe et al., 1992;Cheung et al., 2001], elevated electron temperature Te [e.g., Rietveld et al., 2003; Blagoveshchenskaya et al.,2005], enhanced radioaurora, i.e., HF radar coherent backscatter off enhanced field-aligned irregularities(FAI) �n∥ [e.g., Robinson, 1989; Senior et al., 2004], secondary or stimulated electromagnetic emissions (SEE)[e.g., Thidé et al., 1982; Stubbe et al., 1984; Leyser, 2001] due to coupling of electrostatic HF waves withlow-frequency (LF) counterparts and FAI, and enhanced optical emissions (artificial aurora) [e.g., Bernhardtet al., 1989; Kosch et al., 2000, 2004; Pedersen et al., 2003]. Optical emissions with the excitation energies2–18 eV [e.g., Gustavsson et al., 2002, 2006; Mutiso et al., 2008] indicate accelerated suprathermal elec-trons [Carlson et al., 1982]. It is also worth noting HF-induced ion upflows and density ducts in the topsideionosphere [e.g., Rietveld et al., 2003;Milikh et al., 2010; Kosch et al., 2010].
Matching the pump frequency f0 to the plasma frequency fpe ≈ 9√ne kHz and the upper hybrid (UH)
resonance, fuhr =√
f 2pe + f 2cedefines the plasma resonance (O-mode reflection) point at altitude h0 and UH
resonance at huh ≈ h0 − ln�2ce
�20
, respectively [e.g., Gurevich, 2007]. Here ne is the plasma density in cubic cen-
timeters, fce = 2.8 ⋅ B0 MHz is the electron cyclotron (gyro) frequency, B0 is the geomagnetic field in G, andln = ||d ln ne∕dh||
−1 is the density scale height. The dispersion relation of HF electrostatic waves in weaklymagnetized (�pe ≫ �ce) plasma
�k ≈ �pe
[1 + (3∕2) k2r2
D+(�2ce∕2�2
pe
)sin2 �
](1)
RESEARCH ARTICLE10.1002/2015JA021823
Key Points:
• Observations of HF-driven plasmaturbulence and descending layers aresummarized
• Concept of an ionizing wavefront dueto accelerated electrons is consistentwith the observations
• At high HF powers Langmuir andupper hybrid processes coexist
Correspondence to:
E. Mishin,[email protected]
Citation:
Mishin, E., B. Watkins, N. Lehtinen,B. Eliasson, T. Pedersen, and S. Grach(2016), Artificial ionospheric layersdriven by high-frequency radiowaves:An assessment, J. Geophys.Res. Space Physics, 121,doi:10.1002/2015JA021823.
Received 18 AUG 2015
Accepted 27 FEB 2015
Accepted article online 3 MAR 2016
©2016. American Geophysical Union.All Rights Reserved.
MISHIN ET AL. ARTIFICIAL PLASMA LAYERS 1
Journal of Geophysical Research: Space Physics 10.1002/2015JA021823
gives Langmuir (L) waves at sin2 � = k2⟂∕k2 → 0 and UHwaves at � → �∕2. Here rD is the Debye radius (∼1 cm
in the F region), sin2 � = k2⟂∕k2, and k is the wave number. Henceforth, “Lo” denotes oblique (or magnetized
Langmuir) waves with 0 < � < �∕2. Another HF branch ≈⟂ B0 is the electron Bernstein (EB) mode, �eb(k),with ��eb∕�k⟂ < 0.
Langmuir waves are parametrically coupled with the O-mode pump via low-frequency (Ω ≪ �0) densityfluctuations (such as ion sound (S) waves, Ω = Ωs ≈ kcs) or forced, Ω
2 < 0, modulations (ion quasimodes).The former (three-wave) process, O → L + S, is parametric decay (PDO
L), while the latter is called mod-
ulational instability (MI), also known as oscillating two-stream instability (OTSI) [e.g., Galeev et al., 1977;Fejer, 1979; Shapiro and Shevchenko, 1984; DuBois et al., 1993; Robinson, 1997]. Here cs =
√�Te∕mi is the ion
sound speed,mi is the ion mass, and � = 1 + 3Ti∕Te at �ce≪�pe. Note that at Te ≤ 3Ti , ion sound waves areheavily damped (ImΩ ∼ Ωs), so PDO
Ldevelops in the so-called induced scattering regime. The PDO
L-excited
red-shifted (�k < �0) waves are usually described in terms of weak turbulence (WT), while those inthe MI regime constitute strong (cavitating) Langmuir turbulence (SLT). Each regime has distinct spectralcharacteristics, notably the WT “decay lines” and the SLT “caviton continuum” and “free mode” [e.g., DuBoisetal., 1993]. Their growth times �L are in theorder of a fewmilliseconds.Most important for the artificial plasmaproduction is the SLT acceleration of suprathermal (tail) electrons at energies � ≥ �min≫Te (see equation (9)).
UH/EBwaves can be excited via decay PDOUH∕EB
,O → UH∕EB+LH, and OTSIOUH,O → UH+�n∥ [e.g., Istomin and
Leyser, 1995; Kuo, 2015, and references therein]. Here “LH” designates low-frequency waves near the lowerhybrid resonance �lhr ≈�1∕2�ce, where � = me∕mi is the mass ratio ≈3 ⋅ 10−5 in the F region. Another inde-pendent source is conversion of the pump wave on FAI, O + �n∥ → UH. Trapping UH waves inside striations,i.e., FAI with depleted plasma density �nst < 0, leads to enhanced ohmic heating in the tenuous regions. As aresult, the pressure disbalance forces plasma out. This positive feedback loop leads to the thermal paramet-ric instability (TPI) [e.g., Vaskov and Gurevich, 1977; Grach et al., 1981], with the growth time �st of the orderof seconds.
Scattering of an O-mode pump off striations into UH waves and slow extraordinary waves, known as theZ-mode, leads to (anomalous) absorption of the pump energy en route to h0 [e.g., Stubbe et al., 1994; Gurevichet al., 1996; Eliasson and Papadopoulos, 2015], which inhibits PDO
Land MI in a few seconds. It has become a
rule of thumb that Langmuir turbulence plays no role in persistent (≫ �st) HF-induced phenomena, unlessf0 is in the forbidden band, ||f0 − sfce
|| ≤ flhr, where OTSIOUH, PD
OUH∕EB
, and TPI are inhibited [e.g.,Mjølhus, 1993;Stubbe, 1996].
HF beams pointed vertically propagate along the ionosphere density gradient∇n0(h). This is favorable for thePDO
L∕MI development, as the frequency mismatch
�0(h) = �0∕�pe(h) − 1 ≈ (h0 − h)∕2ln (2)
vanishes at h0. The same is also true for incidence angles �0 within the Spitze cone �0 < �s = arcsin(√fce
fce+f0sin�
)[e.g.,Mjølhus, 1990]. Here � ≈ 14.5∘ at HAARP and 12∘at EISCAT [e.g.,Macmillan et al., 2003]
is the conjugate of themagnetic dip angle, and in the Northern Hemisphere (downward Bo) the angles �0 arepositive to the south of vertical. Near �0 = �s and−�s,O-modewaves are converted to Z-modewavesmovingupward and downward, respectively [e.g.,Mjølhus, 1990]. Thus, the regions near to the Spitze angle �s and itscounterpart −�s are called the upward and downward radio windows, respectively.
For injections outside the Spitze cone, theO-mode refractionheighthr(�0)decreaseswith �0, so the frequencymismatch �0(hr) increases, seemingly hampering the PDO
L∕MI development. However, low duty cycle (heater
on period< �st) experiments reveal plasma and ion line ISR backscatter with the SLT signatures developing atthe magnetic zenith (MZ) in ∼10 ms and with greater intensities than those from vertical [Isham et al., 1999;Oyama and Watkins, 2007]. Further experiments with extended (≫ �st) injections also show the dominanceof MZ [Kosch et al., 2000; Pedersen et al., 2003; Rietveld et al., 2003]. This is called the magnetic zenith effect,although due to the finite width of the HF beam, it is uncertain that the true maximum is along B0.
At high effective radiated powers, ERPs (P0 = transmitter output× antenna gain), the regions of enhanced ionline (IL) backscatter from the EISCAT UHF radar, artificial aurora, and SEE descend by 15–20 km from the initialinteraction altitude [Kosch et al., 2004; Dhillon and Robinson, 2005; Ashrafi et al., 2007; Borisova et al., 2014].In addition to the HAARP modular UHF incoherent scatter radar (MUIR) and optical imagers, Pedersen et al.
[2009, 2010, 2011] used the HAARP ionosonde to reveal that descending layers (hereafter, DL) are patches
MISHIN ET AL. ARTIFICIAL PLASMA LAYERS 2

Journal of Geophysical Research: Space Physics 10.1002/2015JA021823
of newly ionized plasma. Sergeev et al. [2013] explored DL using concurrent measurements of SEE, reflectedprobing signals, and MUIR plasma line (PL) backscatter during frequency-stepping experiments around 4fce.The DL-associated optical emissions at ≈732 nm and 427.8 nm (the blue line) indicate electron accelerationabove the ionization energies �ion [Pedersen et al., 2010; Hysell et al., 2014]. These results concern pencil-likeradio beams. Conical (or twisted) beam transmissions at MZwith f0 near sfce(hr) (s = 2− 6) potentially sustainartificial ionization patches formultiple hours (P. Bernhardt et al., Large ionospheric disturbances produced bytheHAARPHF Facility, submitted to Radio Science, 2016). Henceforth, we focus on theDLduring transmissionsof usual (pencil) radio beams.
The MZ effect and DL formation have not yet been fully understood. Gurevich et al. [2002] argued thatself-focusing of the pump beam on striations and associated anomalous absorption define the MZ effect.However, the predicteddependence on f0 disagreeswith the observations. By the same token, in the daytime/twilight experiments [Pedersen et al., 2011; Sergeev et al., 2013] DL startedwell before striations could develop.In the Pedersen et al. [2010, 2011] experiments, DL emerge at P0 ≥ PDL ≈ 400MW for f0 < 2fce and 2fce − fuhr ≤5–20 kHz, when TPI is inhibited [Mishin et al., 2005a]. Thus, theDL formation has been explained in terms of anionizing wavefront created by the SLT-accelerated electrons [Mishin and Pedersen, 2011; Eliasson et al., 2012,2015]. However, the DL in Sergeev et al.’s [2013] experiments were observed only for f0 > 4fce, consistent withGustavsson et al.’s [2006] observations of stronger 427.8 nm emissions at f0 > 4fce. These observations sug-gest that some unknown interplay between Langmuir and UH processes is critical for the creation of artificialionospheric plasmas.
This paper seeks to extend understanding of this top priority problem through an assessment of the EISCATand HAARP HF-heating experiments (section 2) and numerical modeling (section 3), as well as expanding onthe theory of HF-excited Langmuir turbulence and related effects (Appendix A). Discussion of the observa-tions in terms of the theoretical/modeling results is given in section 4. Overall, we infer the salient DL features:(i1) appearance only for HF beam pointings at MZ in some experiments but (i1*) for all pointings at andbetween vertical and MZ in the others, (i2) broad IL/PL layers and (i2*) an asymmetry between upshiftedand downshifted ion lines, (i3) the SLT persistence along with DL, (i4) appearance for various HF frequenciesnot limited to the gyroresonance frequencies, (i5) greater speeds at greater HF beam powers, (i6) decreasingspeeds after passing the gyroresonance, i.e., at f0 < sfce(hgr), (i7) coexistence of UH and Langmuir processesandmitigation of anomalous absorption, (i8) greater descent speeds correspond toweaker PL/IL signals fromMUIR, and (i9) more efficient production in the sunlit ionosphere. The listed items will be connected with thepertinent observations in section 2 and discussed in section 4.
2. Observations of Descending Layers
Descending radar echoes and the green line (557.7 nm, the excitation threshold �gl ≈ 4.2 eV) optical emis-sions from heating experiments at EISCAT have been observed earlier [Djuth et al., 1994; Kosch et al., 2004;Dhillon and Robinson, 2005; Ashrafi et al., 2007], but the first identification of descending layers with artificiallyproduced plasma was in the Pedersen et al. [2010] experiments at HAARP.
2.1. Descending Layers of Ion Line Backscatter for f0 ∼ 5fceDhillon and Robinson [2005] studied IL backscatter excited by 7.1MHz (≥5.2f
ce(hr))O-modewaves at P0 = 600
and 900 MW, with a half-power (−3 dB) beam width Δ�b ≈ 7∘ and 6∘, respectively. The pump beam with theduty cycle 2min on/2min offwas pointed solely field aligned (intoMZ) on 25 September 2002, whereas on 26September it alternatedbetweenvertical (V) andMZ. The EISCATUHF incoherent scatter radar at fr ≈ 930MHz(Δ�b ≈ 0.5∘) was observing (Bragg) backscatter at the resonant wavelength �r = 2�∕kr = c∕2fr ≈ 16 cm fromfive pointing directions in the magnetic meridian plane with a 5 s time resolution and 1.5 km range gates.These directions are MZ, MZ+6 (≈Spitze), MZ+12 (≈V), MZ-6 (6∘ south to MZ), and MZ-12 (12∘ south to MZ).Also, the CUTLASS SuperDARN radar (fr = 16–19.5MHz) located≈1000 km south of the heater was observing14–18 m FAI with a 1 s resolution and 15 km range gates.
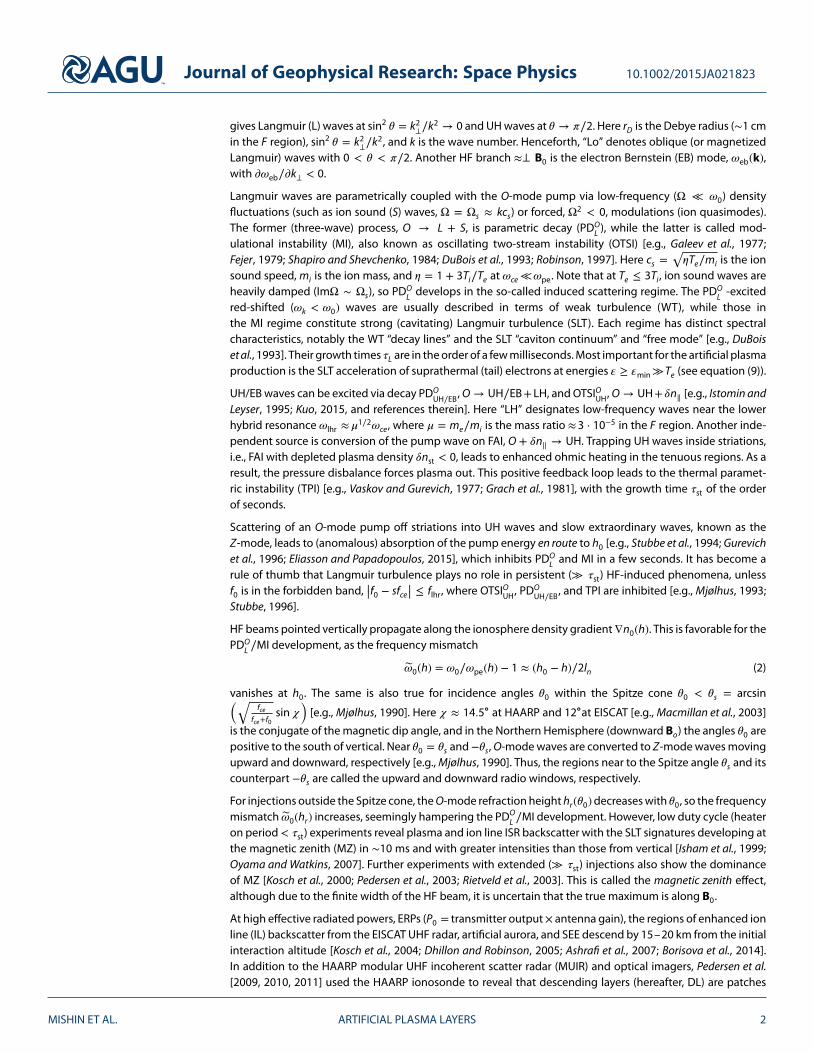
Figure 1 is representative of the UHF IL backscatter from V, MZ, andMZ-6 for vertical andMZ injections during12:34–13:06 UT on 26 September 2002. Overall, there are no effects in MZ-12 and only a few weak returnsin MZ+6. For vertical injections, the enhancements in V and MZ are seen only in the first 5 s data dump andthus called overshoots. Henceforth, the term “overshoot” designates the transient response of the excitedwaves over a few seconds and less. For MZ injections,∼20 dB overshoots at MZ turn into descending layers ofIL backscatter ≈10 dB less (list items i1 and i4). Hereafter, for brevity, the notation “list items” will be omitted.
MISHIN ET AL. ARTIFICIAL PLASMA LAYERS 3
Journal of Geophysical Research: Space Physics 10.1002/2015JA021823
Figure 1. Ion line backscatter amplitudes from the EISCAT UHF radar on 26September 2002 for (left) vertical and (right) MZ heater pointings. Threerows correspond to three UHF pointing directions: V, MZ, and MZ-6. Thealtitude versus the time is shown, and the colors give the backscatteramplitudes in log scale. Adapted from Dhillon and Robinson [2005].
The IL backscatter layers startdescending from ≈220–225 km ata speed dhre∕dt = vre ≈ 250 m/s andstop in ≈1 min at h∗re ≈ 206 km. Here-after, the subscript “re” designates ILor PL radar echoes, while h∗
xxmeans
the terminal altitude of a descend-ing feature xx. The large altitudinalspread (i2), �hre∼10 km, indicates thepresence of small-scale irregulari-ties. The IL layers last at the terminush∗re until the heater is turned off (i3).There appear also persistent layers(�h ∼ 5–7 km) in MZ-6 that do notdescend for both vertical and MZinjections. The intensity of the CUT-LASS radar coherent backscatter washighest for the area excited by thecentral part of the heater beam (<2range gates). Backscatter powersof 10–20 dB at MZ were consider-ably lower than typically observed30–50 dB (i7).
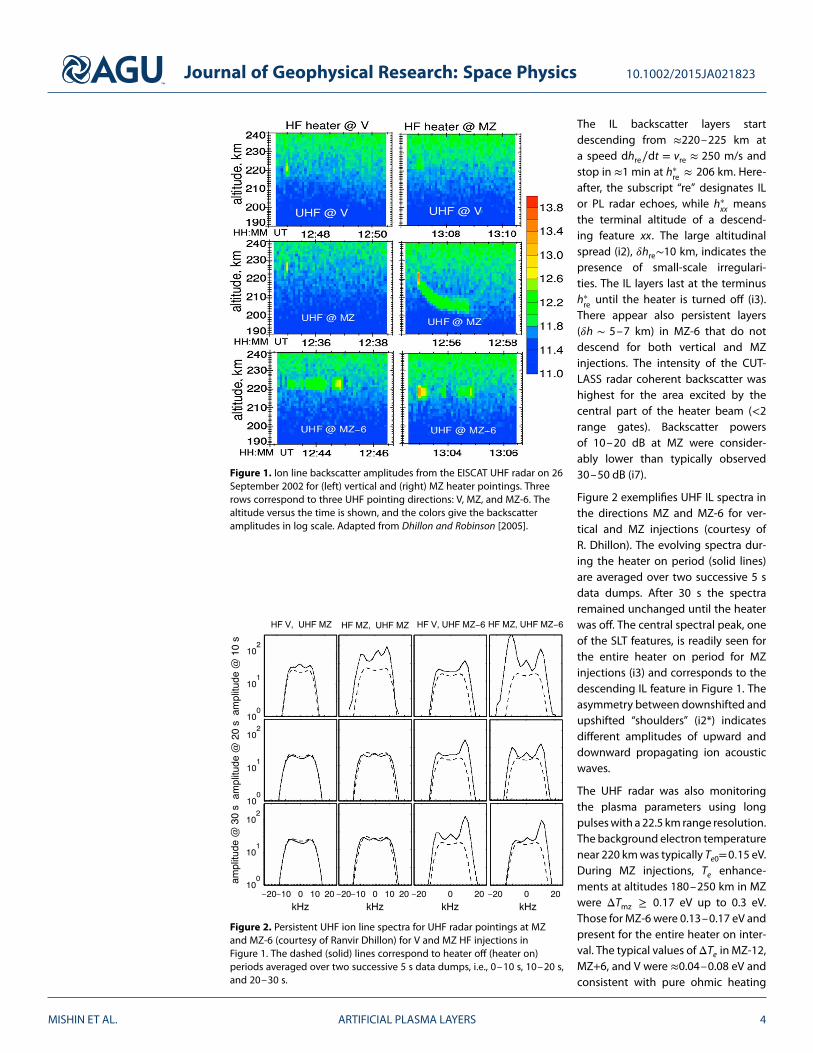
Figure 2 exemplifies UHF IL spectra inthe directions MZ and MZ-6 for ver-tical and MZ injections (courtesy ofR. Dhillon). The evolving spectra dur-ing the heater on period (solid lines)are averaged over two successive 5 sdata dumps. After 30 s the spectraremained unchanged until the heaterwas off. The central spectral peak, oneof the SLT features, is readily seen forthe entire heater on period for MZinjections (i3) and corresponds to thedescending IL feature in Figure 1. Theasymmetry between downshifted andupshifted “shoulders” (i2*) indicatesdifferent amplitudes of upward anddownward propagating ion acousticwaves.
Figure 2. Persistent UHF ion line spectra for UHF radar pointings at MZand MZ-6 (courtesy of Ranvir Dhillon) for V and MZ HF injections inFigure 1. The dashed (solid) lines correspond to heater off (heater on)periods averaged over two successive 5 s data dumps, i.e., 0–10 s, 10–20 s,and 20–30 s.
The UHF radar was also monitoringthe plasma parameters using longpulseswith a 22.5 km range resolution.The background electron temperaturenear 220 kmwas typically Te0=0.15 eV.During MZ injections, Te enhance-ments at altitudes 180–250 km in MZwere ΔTmz ≥ 0.17 eV up to 0.3 eV.Those for MZ-6 were 0.13–0.17 eV andpresent for the entire heater on inter-val. The typical values ofΔTe in MZ-12,MZ+6, and V were ≈0.04–0.08 eV andconsistent with pure ohmic heating
MISHIN ET AL. ARTIFICIAL PLASMA LAYERS 4
Journal of Geophysical Research: Space Physics 10.1002/2015JA021823
[cf.Gustavsson et al., 2010]. For vertical heating,ΔTe inMZ-12 andMZ+6were in general lower and not as clearas those for MZ heating, while in MZ-6 the temperature rose to ∼0.45 eV.
Note that the actual values of Te in non-Maxwellian turbulent plasmas can differ from the quoted onesdue to the distorted IL spectral shape, particularly at MZ-6. At any rate, non-Maxwellian tails of acceleratedelectrons (see equation (9)) make virtually no contribution to the mean energy (the temperature). The latteris still defined by the (heated) bulk electron distribution at � < �min, which remains close to a Maxwellian[e.g., Mishin et al., 2000]. In turn, the location of the spectral peaks is still defined by the ion sound fre-quency fs = ±krcs∕2� [e.g., Rosenbluth and Rostoker, 1962]. Their shift outward from the unperturbed valuesfs0 = ±krcs0∕2� (Figure 2) clearly indicates plasma heating. As the peak amplitudes are affected by the ionsound turbulence [e.g., Volokitin andMishin, 1995], using the peaks-to-valley ratio to determine the ratio Te∕Tiis precluded.With Te0 =
3
2Ti0, calculating fs− fs0 yieldsΔTmz ∼ 0.2 eV andΔTmz−6 ∼ 0.2–0.4 eV, consistentwith
the quoted values.
Contrary to the overshoot behavior at vertical in Figure 1, the Djuth et al. [1994] daytime experiments atEISCAT, with ln = 40–45 km for P0 ≈ 1.1 GW (Δ�b ≈ 4∘) and �0 = 0∘–5∘S, show persistent descending IL/PLlayers (i1*). In particular, a ≈20 dB, ≈2 s PL overshoot at 6.77 MHz (1 s integration time) was centered near210 km, with an altitudinal spread of ≈750 m. It was sandwiched between layers (�h ≈ 500m) of echoes of∼10 dB amplitudes. The overshoot turned into a ∼1 km thick layer of ∼10 dB echoes (i2). Djuth et al. [1994]noted that cloud-like structures in the range-time-intensity plot indicate random small-scale irregularities.After the layer descended by ∼3.5 km in 25 s, it has weakened and become more structured while retreatingupward by ∼1 km in ∼30 s. This behavior was routinely observed whenever ≥2 min off periods preceded HFturn on at P0 > 500MW. The PL/IL spectra, especially the IL central peak, indicate a steady descent of the SLTregion (i3). Note that 6.77 MHz was within a few kilohertz of 5fce at 200–210 km. Djuth et al. [1994] noted thatthe PL layers start descending at 25% of full power, with the speed increasing at the 50% and 100% powersteps (i5).
2.2. Descending Features for f0 Around 4fceFigure 3 is representative of the Ashrafi et al. [2007] results on 12 November 2001 at EISCAT when the heatertransmittedO-modewaves at 5.423MHz and P0 = 550MW. The F2 peak plasma frequency (foF2) was≥ 8MHzbefore 17:10 UT, gradually declining to ≈6 MHz at 17:40 UT. The pump beam (Δ�b ≈ 7∘) was centered at9∘south (S) of vertical and had a 2 min on/off cycle until 16:55 UT. Then, it was scanned in 3∘ steps between3∘north (N, “-”) and 15∘S of vertical with a 3 min cycle (2/1 min on/off). Data come from concurrent measure-ments of the red (630 nm, �red ≈ 2 eV) and green line emissions at two separate sites, UHF radar ion linebackscatter with a 5.4 km range resolution and 5 s integration time and SEE with a 14 s integration time and300 Hz frequency resolution. The UHF radar ( Δ�b ≈ 0.5∘) was sweeping in 3∘ steps from 3∘ to 15∘S of verti-cal in a north-south meridian scan during 15:08–16:55 UT and MZ pointed later on. Black dashes in Figure 3(bottom) indicate the pump-on periods, and the upper (lower) labels mark the radar (pump) zenith angles.
Shown in Figure 3 (top) are the consecutive SEE spectra with added 10 dB offsets for the heating cyclestarting at 16:17 UT. They contain downshifted, Δf = f − f0 < 0, and upshifted, Δf > 0, features. Ashrafiet al. [2007] discussed the downshifted maximum (DM) and broad upshifted maximum (BUM) that indi-cate UH processes [e.g., Leyser, 2001]. In particular, the DM and BUM (at f0 > sfce) are understood in termsof three- and four-wave interactions of UH and LH waves, respectively. We note also the persistent narrowcontinuum (NC) at Δf >−(5–7) kHz, which indicates the SLT development (i3) near the plasma resonance[e.g., Thidé et al., 2005].
As it follows from Figure 3, the BUMpeak frequency decreaseswith time at the rate rf ≈ 0.2 kHz/s.Grach et al.’s[2008] empirical relation for the BUM peak frequency
fbum = 2f0 − sfce + �f , (�f ≈ 10 − 15 kHz) (3)
suggests that fce(hbum) increases with time, i.e., the BUM generation altitude hbum descends. This spectral fea-ture is hereafter called the BUMD (“descending”). Using the IGRF model, the descent speed is calculated asvbum ≈ rf
(4dfce∕dh
)−1≈ 90m/s.
Figure 3 (bottom) shows altitude-time plots of raw IL backscatter power for several consecutive HF pumpcycles. Ashrafi et al. [2007] calculated the matching altitudes hgr (sfce(hgr) = f0), huh, h0, and hbum using the
MISHIN ET AL. ARTIFICIAL PLASMA LAYERS 5

Journal of Geophysical Research: Space Physics 10.1002/2015JA021823
Figure 3. EISCAT experiments on 12November 2001 at 5.423 MHz. (top) Consecutive SEE spectra from16:17 to 16:18:21 UTwith added 10 dB offsets. The red line indicates the peak BUMD frequency. (bottom) Raw ion line backscatter power inlog scale from the UHF radar during the first (left) and second (right) halves of the experiment with the green line opticalheight triangulation results (black asterisks) and hbum (blue asterisks) superimposed. The pump-on periods are indicatedby black dashes. The upper (lower) labels mark the UHF radar (HF pump) zenith angles. The blue solid (dashed) and darksolid lines indicate h0 (huh) and the gyroresonance hgr ≈ 215 km, respectively. Color codes for the IL raw power in logscale are given at the right. Adapted from Ashrafi et al. [2007].
ionosonde data and IGRF model. The heights of the brightest part of the red/green line emissions were tri-angulated with the average uncertainty of 4–5 km. The green line heights hgl(t) were available only after16:21 UT. The variation of the nominal heights h0 and huh in the background ionosphere is likely caused by apassing atmospheric wave.
Overall, with the pump beam centered at 9∘S, enhanced IL echoes in MZ and 9∘S radar positions persist dur-ing the on period, while only 10–15 s overshoots are seen for 6∘and 15∘S. The BUMD feature as in Figure 3(top) remains throughout. Although Doppler spectra were unavailable, the persistent NC suggests that theenhanced IL echoes come from the descending SLT region (i3 and i7). With the HF beam scanning and theradar pointing in MZ after 16:57 UT, similar overshoots in MZ appear for HF beam zenith angles of −3∘ to6∘S, as opposed to strong persistent signals for 9∘ and 12 ∘S. Clear and consistent BUMD was seen only near17:20UT at 3∘ and 6∘S just above hgr. Descendinggreen line emissions are observed at all injection angles (i1*)except −3∘S. On average, layers of persistent IL echoes spread over �hre ∼ 3 km (i2) and descend at a speedvre ∼ 120–150 m/s until the heater is turned off. The terminal heights h∗re and h∗
glare below hgr for injections
in MZ, V, and 3∘S (i4); the differences barely exceed the uncertainty range of ∼4–5 km though.
We next discuss the Sergeev et al. [2013] frequency-stepping experiment on 28 March 2011, 1500–1600 AST(AST = UT-9). The HF beam was pointed at vertical during the first 30 min and at MZ thereafter.Three observational siteswere located approximately along themagneticmeridian to the south of theHAARPfacility at distances ≈11 (A), 83 (B), and 113 (C) km. Sites A and B were practically under the heating regionduring injections at vertical andMZ, respectively. The SEE spectra and diagnostic HF radio reflections are verysimilar at each site, thus indicating broad stimulated radiation and scattering patterns.
O-mode waves were injected at full power (P0 ≈ 1.8 GW, Δ�b ≈ 7∘) and f0 from 5.73 to 5.88 MHz, steppingby +30 kHz every 5 min; foF2 was ≈6.5 → 6.2 MHz. Each 5 min interval comprises three pumping periods
MISHIN ET AL. ARTIFICIAL PLASMA LAYERS 6
Journal of Geophysical Research: Space Physics 10.1002/2015JA021823
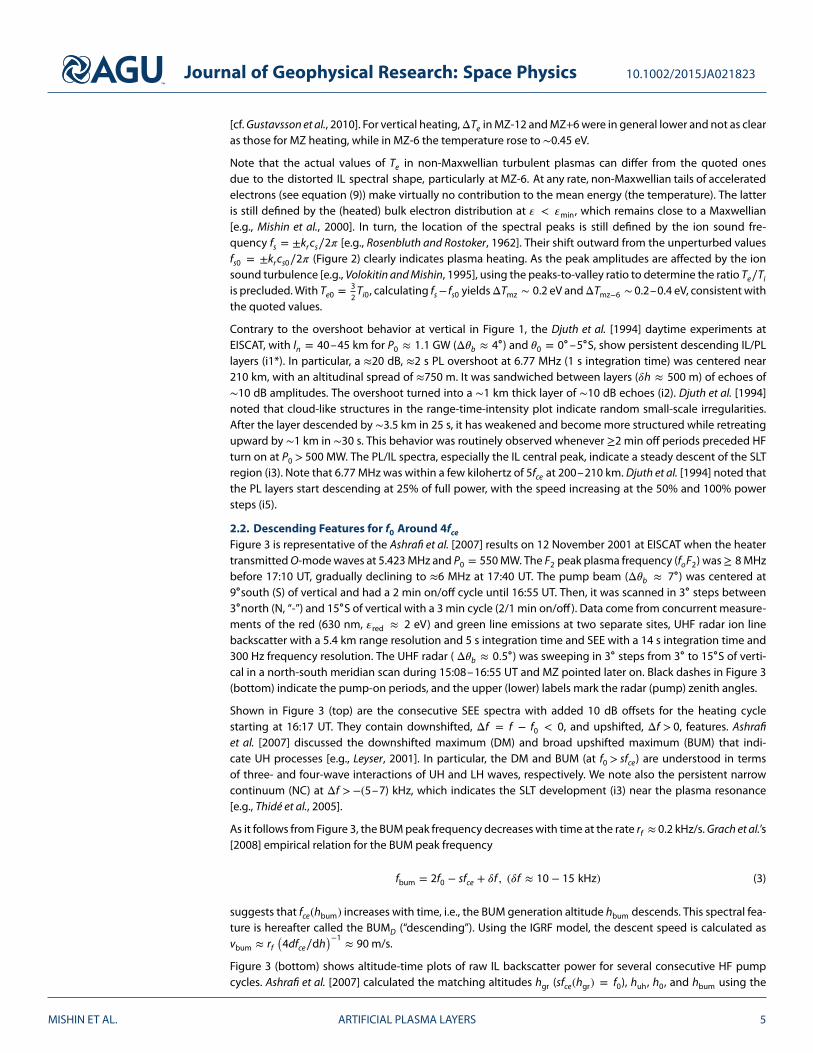
Figure 4. Frequency-stepping experiment at HAARP on 28 March 2011:MZ injections during period 2 at (left column) 5.82, (middle column) 5.85,and (right column) 5.88 MHz. (first to third rows) SEE frequency-timespectrograms over the full range (−50 to 150 kHz), virtual heights ofscattered diagnostic pulses, and relative power of MUIR plasma line echoesversus altitude. The arrow shows an overshoot at the onset of period 2.The origin of the time and frequency axes is at the start of period 2 andthe pump frequency f0, respectively. Color codes show the intensities indecibel. Dotted and dashed lines indicate the SEE and virtual heightfeatures, respectively (see text). Adapted from Sergeev et al. [2013].
followed by 30 s off. Periods 1 and 3consist of low duty pulses, 20/980 mson/off, for a total of 30 and 180 s,respectively. A quasi-continuousperiod 2 comprises 160 ms pulsesseparated by 40 ms pauses, for a totalof 1 min, with the mean P0 ≈ 1.44 GW.Diagnostic pulses of 0.1 ms were alsotransmitted in the middle of eachpause with the same power and fre-quency as the pump. During the lastthree 5 min steps at f0 = 5.82, 5.85,and 5.88 MHz, MUIR (fr = 446 MHz,�r ≈ 33 cm, and Δ�b ≈ 8.6∘) wasmeasuring magnetic field-aligned PLechoes with 600 m and 10 ms rangeand time resolution, respectively.
Persistent descending signaturesduring period 2 appear only for MZinjections (i1) for all frequenciesexcept 5.73 MHz (< 4fce). Figure 4presents the results from site Bfor f0 = 5.82–5.88 MHz with thePL measurements from MUIR. SEEfrequency-time spectrograms have afrequency (time) resolution of 200 Hz(0.2 s). Figure 4 (top row) displaysthe full range spectrograms featuringthe BUMS (“stationary”), BUMD, and
2BUMD centered at f Sbum
, fDbum
(t), and ≈2fDbum
(t), respectively. The BUMD frequency drifts with time towardf0 until the frequency offset with f0 becomes 10–15 kHz (cf., equation (3)) at the terminal time t∗
bum. The
frequency drift rate rf is between 1.2 and 1.4 kHz/s for all f0 and independent on the BUMD amplitude,while t∗
bumincreases with f0 from ≈5 at 5.76 MHz to 40 s at 5.85 MHz and at 5.88 MHz exceed 1 min. The
speed of descent, vbum ≈ rf(4dfce∕dh
)−1, is ≈450–520 m/s. The increase of the overall descent with f0 is
Δh∗bum
=vbum ⋅ t∗bum
≈2→ 20 km at f0 = 5.76 → 5.85MHz and greater than 30 km at 5.88 MHz. Note that the2BUMD drifts toward the BUMS until they “merge.”
Virtual (reflection) heights of diagnostic pulses (Figure 4, second row) have the quasi-stationary and descend-ing signatures. The former is due to scattering from the bottomside F region (the “BF layer”). As for the lowduty periods 1 and 3, the BF layer is initially centered at h0
bf≈ 325, 340, and 360 km at 5.82, 5.85, and 5.88MHz,
respectively. The increase in h0bfis related to the rise of the F layer, consistentwith PL overshoots during period
1 at altitudes h0re ≈ 203 km at 5.82 MHz and 213 km at 5.88 MHz [Sergeev et al., 2013, Figure 4]. After about30 s, the BF layer widens and shifts downward by 20–30 km. Descending virtual height layers are dubbed“DVH layers.” They are centered at hdvh(t), appear just after the onset of period 2, and stop at t∗
dvh≈ t∗
bum+
(5–10) s, i.e., well below h∗bum
(i4). Near the terminus h∗dvh
, the DVH signals at 5.82 and 5.85 MHz intensifyuntil the end of period 2. Their broad scattering pattern and cloud-like structure suggest scattering off ran-domly distributed small-scale irregularities. This is consistent with the disappearance of the DVH layer andthe recovery of the BF to that of period 1 in just a few seconds after the end of period 2 [Sergeev et al., 2013,Figure 3].
Shown next are height-time plots of the PL intensity integrated for 0.5 s. The arrow points to a∼2 s overshootat 5.85MHz at the same altitude h0re ≈ 206 km (hre = range ⋅cos(14.5∘)) as for 20ms pulses of period 1 [Sergeevet al., 2013, Figure 4]. The persistent PL signals descend at vre ≈ 500–600 m/s. The PL amplitude decreaseswith f0, suggesting weaker amplitudes of the detectable 33 cm Langmuir waves, while the descent speedincreases (i8). At 5.82 MHz, the enhanced PL signal remains until the end of period 2 at h∗re ≈ 175 km, wellbelow hgr ≈ 182 km and f0 outside the forbidden band (i4).
MISHIN ET AL. ARTIFICIAL PLASMA LAYERS 7

Journal of Geophysical Research: Space Physics 10.1002/2015JA021823
Figure 5. SEE frequency-time spectrograms for vertical and MZ injections during period 2 in Figure 4, zoomed aroundf0 = 5.82, 5.85, and 5.88 MHZ. Color codes show the intensities in decibel. The NC and DM features are designated.
Figure 5 shows the bright band around f0 in Figure 4 zoomed to distinguish the SLT signature (NC) from theUHsignature (DM) [cf.Grach et al., 2015, Figure 6]. We note the apparent distinction in the NC andDMbehavior atMZ and vertical. The NC spectral width �fnc at vertical contracts in∼15 s so that the NC power (∝ �fnc) exhibitsthe overshoot behavior. The NC power at MZ ismuch stronger. The NCwidth �fnc gradually approaches to the∼1 kHz band at≈ t∗
dvhfor 5.82 and 5.85 MHz, while persisting for the entire period 2 for 5.88 MHz (i7). The DM
features appear similar at vertical andMZ, thus suggesting theprincipal role of theNC (SLT) for thedescendingfeatures in Figure 4 (i3).
Figure 6 presents field-aligned upshifted PL echoes from MUIR during frequency stepping near 4fce on 10March 2013 at HAARP. The critical frequency foF2 was≈7.2MHz indicating steady daytime conditions.Owavesat frequencies stepping by 20 kHz from 5.74 to 5.88 MHz were injected into MZ at P0 ≈ 1.8 GW (Δ�b ≈7∘),with a 2 min cycle (1 min on/off). The PL overshoot heights (arrows) are well above hgr (horizontal lines) atall frequencies except 5.74 MHz. At 5.76–5.88 MHz, persistent signals with an altitudinal spread of ∼2–3 km(i2) start after about 0.1–0.2 s at∼(5–10) km below∼1 s overshoots and descend as heating time progresses.
Figure 6. Plasma line backscatter power from MUIR at f0 stepping by20 kHz from 5.74 to 5.88 MHz at HAARP, 10 March 2013. Solid horizontaland dashed oblique lines indicate the gyroresonance hgr and the descentrates, respectively. Arrows show initial overshoots. Colors give thebackscatter intensity in decibel.
When hre(t) passes through hgr,the radar signals are significantlyenhanced, while the descent speedslows down (i6 and i8). Note also thatthe PL amplitudes at ≥5.84 MHz arequiteweak, similar to Figure 4. Concur-rent SEE observations (P. Bernhardt,personal communication, 2015) showthe BUMD spectrum similar to Figure 4(i3 and i7).
2.3. Descending Layers of Ion Line
Backscatter for f0 Around 3fceFigure 7a shows ion line backscat-ter power from MUIR for 20%, 50%,and 100% of full power P0 ≈1.1 GW(Δ�b ≈ 12∘) during 30 s MZ injectionsat 4.5MHz (>3fce) on 6November 2010at HAARP. Overshoots typically last for
MISHIN ET AL. ARTIFICIAL PLASMA LAYERS 8

Journal of Geophysical Research: Space Physics 10.1002/2015JA021823
Figure 7. (a) HAARP, 6 November 2010: Ion line backscatter power fromMUIR for MZ injections at 4.5 MHz, with ERPs ranging from 20% to 100% of1.1 GW. (b) HAARP, 1 May 2012: Doppler ion line spectra during thepersistent heating phase at full HF power for f0 = 4.5, 4.25, and 4.052 MHzat MZ that correspond to (c) altitude-time plots of raw IL backscatterpower. Colors give the backscatter intensity in decibel.
about 0.2 s near hmz, ascending prob-ably due to natural ionospheric vari-ations such as an atmospheric waveand/or small residual density changesfrom previous HF on cycles. Appar-ently, at least 220 MW ERP is requiredto produce persistent descending fea-tures during daytime [cf. Djuth et al.,1994]. It is evident that higher HFpowers result in more rapid descent(vre≈400 m/s at 100%) and lower ter-minal altitudes (i5) Surprisingly, thereare two distinct broad (i2) layers of ILechoes closely following each other.The upper layer contains only thepositive Doppler-shifted spectral peak(i2*). The weaker, negative Dopplerlayer is well below the PDO
Lmatching
height. Note that the IL amplitude inthe upper layer at full power is weaker,while the speed is greater than that at50% (i8).
Shown in Figures 7b and 7c areion line power spectra observed inMZ on 1 May 2012 for HF frequen-cies above (4.5 MHz) and below(4.25 and 4.052 MHz), 3fce (i4).Altitude-frequency Doppler spectra inFigure 7b are obtained in the middle
of the corresponding altitude-time backscatter power plots in Figure 7c (averaged for 0.5 s). Strong broadsignals at positive Doppler and much weaker signals at negative Doppler are seen at different altitudes for4.5 MHz (i2*). For 4.25 and 4.052 MHz, the usual two decay peaks with Doppler shifts about ±5 kHz at thesame altitude and a zero-Doppler central (SLT) peak are seen (i3). Persistent weak signals for 4.5 MHz withan altitudinal spread of ≈ 3 km (i2) descend at a greater speed than stronger signals for 4.25 MHz (i8). Notethat the overshoot spectra at 4.5 MHz (not shown) comprise Doppler signals that are “randomly scattered”around zero Doppler (about ±2 kHz), one of the signatures of SLT cavitons, until 30–40 ms. The following10 ms frames display mainly a “stable” configuration with signals confined to decay ion acoustic frequencies±4–5 kHz.
2.4. Descending Layers for f0 Near 2fceFigure 8 exemplifies the DL development during Pedersen et al.’s [2010, 2011] experiments at f0 near 2fce,with injections of O-mode waves at full power P0 ≈ 440 MW (Δ�b ≈ 18∘). On 17 March 2009, the HF beamat 2.85 MHz was pointed in MZ with a 4 min on/off cycle during 05:05–05:21 UT and then continuously. Inaddition to 557.7/427.8 nm (green/blue line) systems at the site, a remote (∼160 km/N) 557.7 nm imager waslooking over HAARP. The 19 November 2009 experiment started with 1 min transmission at f0 = 2.85 MHzthen stepped up by 5 kHz, dwelling on each frequency for 36 s to reach 2.95 MHz after 12 min. As a result,the gyroresonance height hgr(f0(t)) (blue stepwise lines) decreased from h0gr ≈ 230 km to h∗gr ≈ 150 km. TheHAARP ionosonde acquired 10 s ionograms every 60 s inMarch and 10 s in November to determinematchingaltitudes huh(t) (green lines), h0(t) (red), and h2,3(t) for fpe = 2 and 3 MHz (black).
The matching heights and hgr(t) on 19 November 2009 are shown for MZ and vertical injections. The MUIRbackscatter power from MZ (dark grey) is overlaid. In the overdense ionosphere (frame a), h0 and huh are ini-tially below hgr (2fce − fuhr ≈ 60 kHz). A ∼2 km thick layer of IL echoes (i2) remains just below h0 ≈ 190 kmuntil 2fce(t) approaches fuhr + (10–15) kHz and the broad IL layer starts descending. During descent, theIL backscatter layer always remains above huh(t) with 2fce(t) − fuhr(t) ≈ (10–15) kHz. Near the terminush∗0 ≈ 140 km, the IL echoes intensify and last until the transmitter turns off. The same pattern is observed on
MISHIN ET AL. ARTIFICIAL PLASMA LAYERS 9

Journal of Geophysical Research: Space Physics 10.1002/2015JA021823
Figure 8. HAARP experiments near 2fce on 19 November (top) and 17 March 2009 (bottom): True height profiles for HFpointing at (a) MZ and (b) vertical, with the gyroresonance hgr(t) (in blue), the terminator height (the thick dashed line),and the MUIR ion line backscatter power from MZ (dark grey) overlaid; (c) altitude-time plot of 557.7 nm emissions froma remote imager during MZ injections with the MUIR ion line backscatter power (in yellow) superimposed (the whitedashed line indicates hgr); and (d) true height profiles inverted from the 05:26 UT ionogram. Adapted from Pedersen
et al. [2010, 2011] and Mishin and Pedersen [2011].
14 November, when the background ionosphere became underdense (foF2 < f0) after≈ 5min in the heating.
However, the plasma frequency within the DL (f (DL)pe ) reaches f0. The layer near h∗0 ≈ 150 km with f ∗uhr
≈ 2f ∗ce
persists for 2 min and decays after the solar terminator crossing, i.e., after the sunlit-to-dark transition and
absence of photoionization of neutral gas near the terminus (i9).
For the initially underdense ionosphere (frame b), fuhr is already close to 2fce at the very beginning. Although
foF2 declines from 2.70 to 2.55MHz between 02:25 and 02:45 UT, the contours start descending almost imme-
diately. The DL becomes overdense (f (DL)pe > f0) much of the time after 02:32 UT, with fuhr(t) ≈ 2fce(t) − 15 kHz
on average. Unlike HF pointing inMZ,MUIR does not detect any IL echoes within the first 5min until 02:32 UT.
The signals are very weak from all pointing directions (no vertical beamwas used) and nonexistent inMZ. The
strongest radar signal from 3∘S appears when f(DL)pe reaches f0. The layer retreats in altitude and disappears
following the terminator crossing (i9).
On March 17, strong emissions during 05:13–05:17 UT appear as a diffuse glow and in ∼1 min gather into
a slowly descending spot-within-ring bull’s-eye. The green and blue line emissions at the site develop in
concert. This indicates enhanced ionization by ≥18.75 eV electrons during descent. Ionograms also show a
secondary bottomside layer gradually descending at ∼200 m/s, with h∗uh
approaching 200 km. As the cen-
tral spot descends below hgr to ≈180 km, it turns into a collection of bright field-aligned filaments (a few
kilometers in diameter and 10–20 km alongB0) with intensity increased by a factor of 6. The average speed of
descent also increases to vgl ≈300m/s. At ≈160 km the descent slows and ends at h∗gl≈ 150 km, with the DL
plasma frequency above f0. Here field-aligned IL echoes, invisible during the fast descent, intensify between
h∗0 and h∗uh
(i8).
MISHIN ET AL. ARTIFICIAL PLASMA LAYERS 10

Journal of Geophysical Research: Space Physics 10.1002/2015JA021823
Near h∗gl, the central bright emissions are quenched, whereas an empty ring near 200 km (the bottomside
layer) remains inplace. The samepattern is realizedduringa continuousonperiodbeginningat 05:21UT in the
underdense ionosphere. The emissions at h∗glare quenched themselves several times, initiating the process
over again from higher altitudes until the UH resonance ceases. We note that the HAARP experiments with
MZ injections at 4.1 and 4.2 MHz (<3fce) on 2 September 2011 (not shown) also show this pattern. Namely,
after ≈20–25 s of heating the descending PL echoes at ∼215 km almost double its speed up to ≈350 m/s
and stop near h∗re ∼195 km. Then, the layer is quenched a few times and initiated over again until the end of
the transmission.
Overall, the 2fce experiments show that the IL backscatter is persistent for f0 < 2fce and intensifies at2fce−fuhr ≈
5–20 kHz, when the DL formation is also facilitated. Unfortunately, neither spectral IL data nor coherent radar
backscatter data were available at that time to specify the LT regime and FAI at high powers. Some important
clues can be deduced from low-power (P0 ≈10 MW, Δ�b ≈32∘) HAARP experiments exploring a frequency
pass through 2fce in a decaying ionosphere [Djuth et al., 2005; Kosch et al., 2005, 2007a].
On 4 February 2005, the pump beam at 2.85 MHz was pointed in MZ with a 1 min on/off cycle during
03:00–04:45 UT [Kosch et al., 2007a, Figure 1]. Emissions at 630.0 and 557.7 nm increase near the gyrores-
onance h0 ≈hgr [cf. Mishin et al., 2005a], but little change is seen after the double resonance crossing at
≈03:45 UT. However, the Kodiak SuperDARN radar backscatter enhancements at �r ≈ 19 m increased from
10–15 dB to 20–25 dB after the crossing. In fact, this transition starts when huh exceeds hgr by ≈5 km and
f0 − 2fce(huh)> ≈ 6 kHz, i.e., out of the forbidden band. The crossing particularly affected field-aligned PL
backscatter measured by MUIR with range and time resolution of 1.5 km and 10 ms, respectively. Namely,
persistent backscatter before the crossing changed to ≤ 2 s overshoots thereafter. Broad SLT peaks with the
purely growing mode at f0 and the WT decay and first cascade lines in persistent PL spectra [Oyama et al.,
2006, Figure 3] indicate the coexistence of the WT and SLT regimes (see Appendix A).
On 20 March 2004, the pump beam was pointed in MZ with 4 min (2/2 min on/off) and 10 min (8/2 min
on/off) cycles during 06:00–07:00 UT when f0 = 2.75 MHz was less than 2fce [Djuth et al., 2005, Figure 1].
Enhanced 630.0, 557.7, and 777.4 nm emissions indicate accelerated electrons at �≥10.7 eV. Djuth et al.
[2005] noted only the DM and 2DM SEE spectral peaks. However, the narrow continuum at Δf >−(3–5) kHz,
alike that in Figure 3, is also clearly seen in their Figure 4. Quite similar NC features have been revealed in
the SEE data taken during the March 2011 experiment exploring DL near 2fce at HAARP (M. Kosch, personal
communication, 2016).
Recent high-power 2fce heating experiments atHAARP show that theDL formation is typically observedwith a
broad SEE peak downshifted from the pumpby≈ 0.3–0.5 kHz [Bernhardt et al., 2013]. Samimi et al. [2013] have
shown that for f0 < 2fce and Te ≥ 3Ti the ion acoustic parametric decay (IAPD) instability, UH∕EB → UH′∕EB′+
IA [Huang and Kuo, 1995], develops in the UH layer with a broad growth rate centered at f0− (0.3–0.5) kHz
and thus termed the peak the IAPD structure or simply IAPD. It has a number of similarities with the so-called
downshifted peak revealed and thoroughly explored at EISCAT for f0∕fce ≥ 3 [Leyser, 2001].Mahmoudian et al.
[2013] observed such peak during high-power 3fce heating at HAARP.
In summary, descending layers appear at various frequencies and injection angles but in some experiments
only at MZ (i1,i1*, and i4). Greater HF powers correspond to greater DL speeds but weaker MUIR signals
(i5 and i8). The descent slows down after passing the gyroresonance altitude hgr, but MUIR signals increase
(i6 and i8). The field-aligned IL/PL backscatter persists in, and out of, the forbidden band, ||f0 − sfce|| ≤ flhr,
around the gyroresonance (i7). In addition to standard SLT/WT features, the IL/PL layers have a notable asym-
metry between upshifted and downshifted ion lines and large spread in altitude (i2, i2*, and i3). The DL
production is facilitated in the sunlit ionosphere (i9).
3. Modeling of HF-Driven Langmuir Turbulence
Mjølhus et al. [2003] presented a comprehensive review of early works on HF-driven Langmuir turbulence at
P0< PDL, including some results for oblique incidence. Eliasson et al. [2012, 2015] performed simulations
of Langmuir turbulence and DL in the high-power regime. Before presenting typical nonlinear features at
P0 > PDL, we describe (linear) propagation of O-mode waves at various incidence angles.
MISHIN ET AL. ARTIFICIAL PLASMA LAYERS 11

Journal of Geophysical Research: Space Physics 10.1002/2015JA021823
Figure 9. Full wave 1-D modeling of O-mode waves for different injectionangles and frequencies: (top) Δhmz = hmz − h0 (solid lines) andΔhuh = huh − h0 (dashed) at f0 = 6.5–7.1 MHz at EISCAT (thin blue) andHAARP (thick black). (middle) The normalized swelling factor near hr atHAARP as a function of incidence angle Γ(�0)∕Γ0 at f0∕fce = s (s = 2, 3, 4).(bottom) The altitude-incidence angle distribution of the electricfield amplitude normalized to Ein at HAARP for 2.85 MHz. MZ, V, and theupward (around the Spitze angle �s) and downward (around −�s) radiowindows are indicated. Color codes for the intensity in decibel are given atthe right.
3.1. O-Mode Propagation
Assuming the absence of absorptionalong the path from the ground givesthe free space field at an altitude h
Efs[V∕m] ≈ 5.5√P0[MW]∕h[km] (4)
Within the Spitze cone, the ratiobetween the first Airy maximumEA at hA ≈ h0 − l0 and Efs givesthe swelling factor Υ0 = EA∕Efs ≈
(2�∕ sin�)2∕3(f0ln∕c)1∕6. Here l0 ≈
(c2ln sin2 �∕�2
0)1∕3 is the scale
length of the Airy function,Ai(
(h − h0
)∕l0), and c is the speed
of light [e.g., Mjølhus, 1990]. For inci-dence angles �0 >�s, as noted byMjølhus et al. [2003], one shouldconsider the caustic rather thanthe turning point hr . Nonetheless,Ai(
(h − hr
)∕l�), with the scale length
l�(�0), is still a good representation forthe swelling pattern.
To trace an O-mode wave up to itsturning point, we use Lehtinen and
Inan’s [2008] full wave algorithm forcold plasma. One-dimensional (1-D)simulations start with the fixed freespace field Ein = Efs(hin) at hin =
80 km and the horizontal componentof the wave vector kx = −
�0
csin �0 =
const (an infinite beam). The x axis isaligned with the magnetic meridianand pointed to the north. The down-
ward geomagnetic field is tilted south at an angle � = 14.5∘ at HAARP and 12∘ at EISCAT. We do not attemptto model each of the aforesaid experiments rather focusing on generalO-mode characteristics near the turn-ing point. The magnitude B0 is assumed constant such that fce =1.425 MHz. The plasma density profiles atHAARP are taken from the IRI model [Bilitza et al., 2011] on March 2009 at 01:00 AST for f0 ≤ 5.7MHz (night-time). These, for example, give h0 ≈ 229 and 279 km and the density scale heights ln(h0) ≈ 23 and 42 km atf0 = 2.85 and 5.7 MHz, respectively. To trace 6.5→7.1 MHz waves, we use Gaussian F region altitude profileswith ln ≈ 45 km at EISCAT and 50 km at HAARP, giving h0(f0) ≈ 280 → 289 km. The electron-neutral collisionrate is taken from Vuthaluru et al. [2002] (the total electron collision frequency �e ≈ 3 ⋅ 102 s−1 at ∼200 km).
Figure 9 synopsizes the simulation results. Figure 9 (top) shows the height difference Δhmz=hmz − h0 andΔhuh = huh − h0 for f0 stepping by 0.1 MHz from 6.5 to 7.1 MHz at EISCAT and HAARP. As anticipated, theheight difference hmz − huh decreases with f0. In this particular case, the UH layer is above hmz at f0 > 6.8MHz(≈4.8fce) at HAARP, while at EISCAT it is still below hmz by ≈0.4 km at 6.8 MHz and 0.2 km at 7.1 MHz.Shown next is the normalized swelling factor Υ�∕Υ0 at HAARP for f0 = 2.85 (2fce), 4.275 (3fce), and 5.7(4fce) MHz as a function of �0. It drops at Spitze and approaches the unmagnetized limit sin2∕3 �mz ≈ 0.39[cf. Mjølhus et al., 2003, Figure 12]. As the free space field near the turning point is Efs ≈ Ein ⋅ hin∕hr , the“standard” swelling factorΥ0 = EA∕Efs is equal toΥin ⋅ hr∕hin.
Shown in Figure 9 (bottom) is the altitude versus incidence angle log-distribution of the normalized elec-tric field, i.e., 20⋅ log10(E∕Ein), at HAARP for 2.85 MHz. This plot depicts the salient characteristics of theO-mode field near the turning point. The swelling pattern is well approximated by Υ�(�0)Ai(
(h − hr
)∕l�)
for all incidence angles. We note that the scale length l� increases with �0 so that l�(�) ≡ lmz is nearly twice as
MISHIN ET AL. ARTIFICIAL PLASMA LAYERS 12
Journal of Geophysical Research: Space Physics 10.1002/2015JA021823
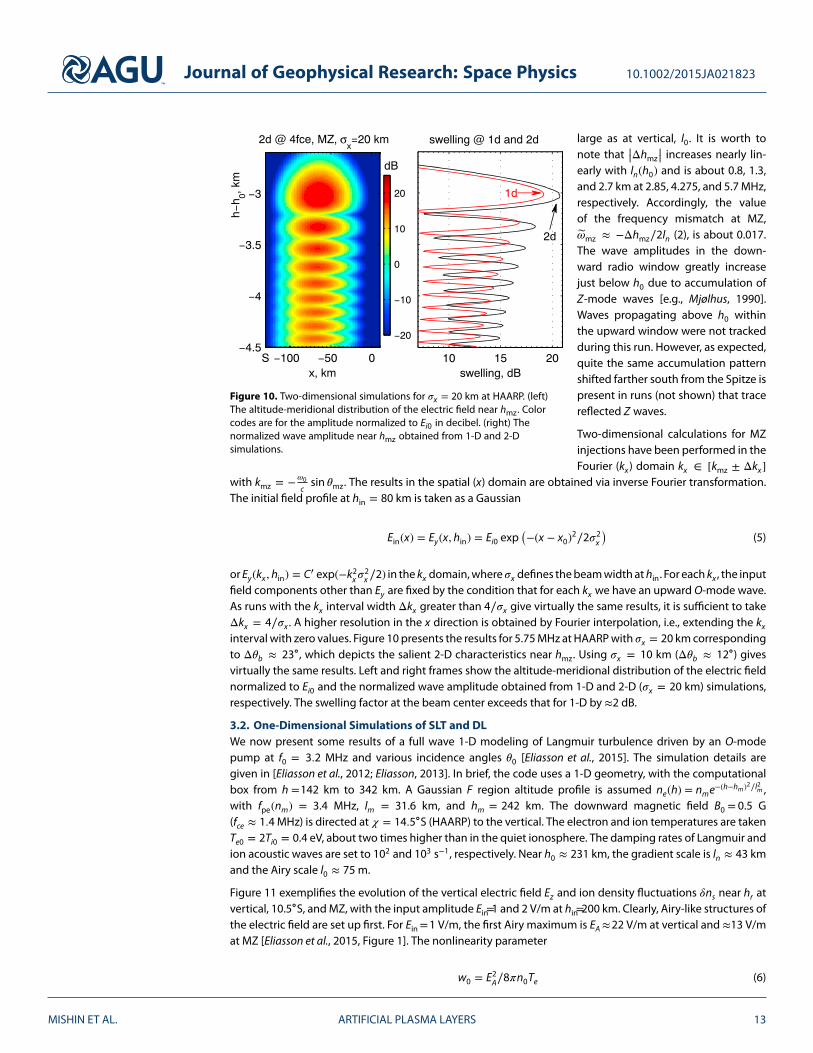
Figure 10. Two-dimensional simulations for �x = 20 km at HAARP. (left)The altitude-meridional distribution of the electric field near hmz. Colorcodes are for the amplitude normalized to Ei0 in decibel. (right) Thenormalized wave amplitude near hmz obtained from 1-D and 2-Dsimulations.
large as at vertical, l0. It is worth tonote that ||Δhmz
|| increases nearly lin-early with ln(h0) and is about 0.8, 1.3,and 2.7 km at 2.85, 4.275, and 5.7MHz,respectively. Accordingly, the valueof the frequency mismatch at MZ,�mz ≈ −Δhmz∕2ln (2), is about 0.017.The wave amplitudes in the down-ward radio window greatly increasejust below h0 due to accumulation ofZ-mode waves [e.g., Mjølhus, 1990].Waves propagating above h0 withinthe upward window were not trackedduring this run. However, as expected,quite the same accumulation patternshifted farther south from the Spitze ispresent in runs (not shown) that tracereflected Z waves.
Two-dimensional calculations for MZinjections have been performed in theFourier (kx) domain kx ∈ [kmz ± Δkx]
with kmz = −�0
csin �mz. The results in the spatial (x) domain are obtained via inverse Fourier transformation.
The initial field profile at hin = 80 km is taken as a Gaussian
Ein(x) = Ey(x, hin) = Ei0 exp(−(x − x0)
2∕2�2x
)(5)
or Ey(kx , hin) = C′ exp(−k2x�2x∕2) in the kx domain,where�x defines thebeamwidthathin. For each kx , the input
field components other than Ey are fixed by the condition that for each kx we have an upward O-mode wave.As runs with the kx interval width Δkx greater than 4∕�x give virtually the same results, it is sufficient to takeΔkx = 4∕�x . A higher resolution in the x direction is obtained by Fourier interpolation, i.e., extending the kxinterval with zero values. Figure 10 presents the results for 5.75MHz at HAARPwith �x = 20 km correspondingto Δ�b ≈ 23∘, which depicts the salient 2-D characteristics near hmz. Using �x = 10 km (Δ�b ≈ 12∘) givesvirtually the same results. Left and right frames show the altitude-meridional distribution of the electric fieldnormalized to Ei0 and the normalized wave amplitude obtained from 1-D and 2-D (�x = 20 km) simulations,respectively. The swelling factor at the beam center exceeds that for 1-D by ≈2 dB.
3.2. One-Dimensional Simulations of SLT and DL
We now present some results of a full wave 1-D modeling of Langmuir turbulence driven by an O-modepump at f0 = 3.2 MHz and various incidence angles �0 [Eliasson et al., 2015]. The simulation details aregiven in [Eliasson et al., 2012; Eliasson, 2013]. In brief, the code uses a 1-D geometry, with the computationalbox from h =142 km to 342 km. A Gaussian F region altitude profile is assumed ne(h) = nme
−(h−hm)2∕l2m ,with fpe(nm) = 3.4 MHz, lm = 31.6 km, and hm = 242 km. The downward magnetic field B0 = 0.5 G(fce ≈ 1.4MHz) is directed at � = 14.5∘S (HAARP) to the vertical. The electron and ion temperatures are takenTe0 = 2Ti0 = 0.4 eV, about two times higher than in the quiet ionosphere. The damping rates of Langmuir andion acoustic waves are set to 102 and 103 s−1, respectively. Near h0 ≈ 231 km, the gradient scale is ln ≈ 43 kmand the Airy scale l0 ≈ 75m.
Figure 11 exemplifies the evolution of the vertical electric field Ez and ion density fluctuations �ns near hr atvertical, 10.5∘S, andMZ, with the input amplitude Ein=1 and 2 V/m at hin=200 km. Clearly, Airy-like structures ofthe electric field are set up first. For Ein=1 V/m, the first Airy maximum is EA≈22 V/m at vertical and ≈13 V/mat MZ [Eliasson et al., 2015, Figure 1]. The nonlinearity parameter
w0 = E2A∕8�n0Te (6)
MISHIN ET AL. ARTIFICIAL PLASMA LAYERS 13

Journal of Geophysical Research: Space Physics 10.1002/2015JA021823
Figure 11. Results of 1-D simulations of SLT at HAARP: Time versus altitude color-coded plots of (left column)log10(|Ez[V/m]|) and (right column) log10(|�ns[m−3]|) at vertical, 10.5∘S, and MZ for the input amplitude Ein = 1 and2 V/m, as indicated in plots. Adapted from Eliasson et al. [2015].
is ≈0.26 at vertical and 0.09 at MZ and �mz ≈ 0.016 (Δhmz ≈ −1.4 km). In about 1–1.5 ms this structure
within the first few maxima starts breaking into small-scale turbulence. In saturation, solitary wave packets
in the SLT region are trapped in density cavitons (Figure 11, right column) of widths la ∼ (10 − 20) rD spaced
apart by ∼50rD. It is seen that the SLT region is sandwiched between the WT regions with turbulent electric
fields but without density cavitons. Another notable common feature revealed in full wave modeling is the
emergence of Z-mode waves around h0, concurrent with the cavitating turbulence [cf. Eliasson, 2008].
The SLT development at vertical (within Spitze �s ≈ 7.7∘) follows a certain pattern. That is, saturation is fol-
lowed by a gradual downward shift of the turbulent layer. The r.m.s. (root-mean-squared) amplitude �Esat of
the saturated turbulent electric fields is smaller than that for the initial stage (the SLT overshoot). The initial
stage at 10.5∘S andMZ appears the same as at vertical, except for the difference consistentwith the frequency
mismatch �0(h) (2). However, at later times the SLT layer at 10.5∘S expands in both directions. Ultimately, its
upper boundary reaches h0, while the lower boundary overlaps with the second peak, so the SLT altitudinal
extent is lLT ∼ 5l0. At MZ, the SLT layer remains near the first peak for Ein = 1 V/m while for 2 V/m lLT increases
with time up to ∼(3–5)l0.
The fast time downward shift and the appearance of Z-mode waves can be understood in terms of Brillouin
scatter (O+�nk→O′) andO+�nk→Z conversion due to scattering off short-scale cavitons and ion oscillations
(e.g., equation (A10)). When SLT develops in lower Airy maxima, the pump energy is scattered en route to h0,
MISHIN ET AL. ARTIFICIAL PLASMA LAYERS 14

Journal of Geophysical Research: Space Physics 10.1002/2015JA021823
Figure 12. Modeling of the accelerated population and descending layersat HAARP: (top) Turbulent electric fields Ez and the TDF, Ft(�) = Ft(u)du∕d�,calculated for MZ injections with Ein = 1 and 2 V/m and Te = 0.4 eV.(bottom) Time versus altitude plots of the plasma density in cubiccentimeters at V and 10.5∘S calculated for various Ein and Te indicated inframes. Adapted from Eliasson et al. [2012, 2015].
thereby inhibiting SLT at hA. Overall,it appears that scattering off cavitonsis less harmful for the SLT develop-ment at 10.5∘S and MZ, where theSLT region gradually expands withtime. At 10.5∘S, Brillouin scatter seemscapable of making O-mode wavesclose to the Spitze cone to produceSLT near h0.
While crossing an individual caviton ofthe size la ∼ k−1
a, electrons can gain or
lose energy, depending on the phaseof the trapped oscillations. Fast elec-trons, whose passage time is shorterthan �−1
pe , i.e., v∥ = u>�pe∕ka, experi-ence a localized quasi-stationary fieldand acquire or lose energy ∼e |E| la.Here u =
√2�∕me is the parallel (∥ B0)
velocity. For an isotropic electrondistribution, the first-order energygains are averaged out, thus leaving
the net gain Δ� ∝|||Ek∥=�k∕u
|||2. Due
to a random distribution of cavitiesin space, electrons will experience arandom walk (diffusion) in velocityspace and form a non-Maxwellianhigh-energy tail. This process canbe modeled [Eliasson et al., 2012,2015] by a Fokker-Planck equation forthe averaged 1-D (tail) distribution(TDF) Ft(u)
ddt
Ft =�2pe
men0
�
�u
W�k∕u
u
�Ft�u
≡ �
�uD(u)
�Ft�u
(7)
∫ Wkdk = ∫z0+lLT
z0
dz ||E2z|| ∕4�lLT (8)
Here d∕dt = �∕�t+u�∕�z,Wk is the spectral energy normalized by the integral (8), and k is the wave number.
Figure 12 [cf. Eliasson et al., 2012, Figure 8] shows turbulent electric fields Ez and the TDF, Ft(�) = Ft(u)du∕d�,calculated for MZ injections at Ein = 1 and 2 V/m (cf., Figure 11). Overall, the main part of Ft(�) at �max ≥ � ≥�min can be fitted by a power law (Ct = const)
Ft(�) ≈ Ct ⋅ �−b (9)
The TDF (9) agrees with the prior results [Galeev et al., 1983; Wang et al., 1997], yet b depends on Ein and Te[Eliasson et al., 2012, Table 1]. This is understood as follows. The particle flux into the tail is defined byD(umin)
�Ft
�u
|||umin
in the right-hand side of equation (7). In turn, the tail density nt ≈ Ct ⋅ �1−bmin∕(b − 1) is mainly
defined by the matching condition, Ft(umin) = FM(umin, Te) (the ambient Maxwellian distribution). The maxi-mumenergy �max depends also on the transit time �a∼ lLT∕umax. Overall, at each incidence angle the simulatedspectral widthΔk, �Esat, and lLT increase with Ein. These factors and the input value of Te lead to considerabledifferences in the TDF and DL. In particular, the TDF at 3.5∘ and 10.5∘S is more enhanced than that at verti-cal due to greater SLT extents lLT. The TDF at MZ for Ein = 2 V/m is close to that at vertical for Ein = 1.5 V/m[Eliasson et al., 2012, Figure 8, 2015, Figure 10].
MISHIN ET AL. ARTIFICIAL PLASMA LAYERS 15

Journal of Geophysical Research: Space Physics 10.1002/2015JA021823
TheDLdevelopment is definedby the input values Ein, Te, and�0 [Eliassonetal., 2012, 2015]. Shown inFigure12are theDL calculated at vertical and 10.5∘Swith the TDF for Ein = 1–1.5 V/mand Te = 0.4–0.6 eV. As discussedin Appendix A, the critical parameter for DL is the density of the ionizing (�> �ion) electrons n
iont. It follows
from the simulations that �iont
≡ niont∕nc should exceed �dl
t≈ (2 − 6) ⋅ 10−4 for DL to descend from ≈220 km
to h∗D≈ 180–150 km [Eliasson et al., 2012, Figure 12]. In particular, �dl
t≈ 6 ⋅ 10−4 is obtained for Te = 0.4 eV
and Ein = 1.5 V/m at vertical [Eliasson et al., 2012, Table 1]. For a Gaussian (2-D) HF beam, a ∼2 dB additionalswelling factor at MZ (Figure 10) should reduce Ein to E
(2d)in ≈ 1 V/m.
A few remarks are in order (see Appendix A). Although atw0 ≪ �2ce∕�2
pe themodulational instability is excitedin a narrow cone around B0, |�| ≪ 1, pancake-shaped cavitons (equation (A7)) are not described by the 1-Dapproximation. In general, either the pumping for the 1-D turbulence or/and Te should be greater than thatfor≥ 2-D in order to achieve the same TDF. Another deficiency is that the TDF is kept unchanged throughoutthe descent, presuming the same conditions for acceleration. And finally, the presence of photoelectrons sig-nificantly enhances the SLT acceleration (see Appendix A), thereby relaxing the dependence on Te. Therefore,one should exercise caution comparing the 1-D SLT simulations against data.
4. Discussion
The “pure” SLT scenario of the DL formation [Mishin and Pedersen, 2011; Eliasson et al., 2012, 2015] implies thatin the course of descent the pumpwave suffers little absorption en route to hD. The latter seems contradictoryto the concept of anomalous absorption related to the TPI in theUH layer [e.g.,Gurevich et al., 1996], especiallywhen the SLT features coincide with DM and BUMD, i.e., the well-known UH signatures. We first argue that theoverall data set shows that strong Langmuir turbulence is the principal cause of the DL formation. Then, theSLT persistence, consequent to mitigation of anomalous absorption, Langmuir processes in the UH layer, andthe DL evolution at the terminal altitude are discussed.
4.1. SLT and Descending Layers
For completeness, we outline the SLT features for P0 ≥ PDL or p0 = P0∕PDL ≥ 1. For vertical injections at HAARPat h0 = 220 km, f0 = 3 → 7 MHz or 10−5nc ≈ 1 → 5.4 cm−3, and ln = 40 km, we get the swelling factorΥ0 ≈ 28 → 32 and p
−1∕20 EA ≥ 0.5Υ0 ≥ 14 → 16 V/m, thus giving w0∕p0 ≈ 0.1 → 0.03 for Te = 0.3 eV (see
equations (4) and (6)). Taking p0(f0) = 1 at 3 MHz and 3 at 7 MHz yields w0 ≈ 0.1. The swelling coefficient Υ�
at MZ for a 2-D beam is≈ 0.8Υ0. At any rate,w0 exceeds the frequencymismatch (equation (2)) �A ≈ l0∕2ln ∼10−3 and �mz ≈ 0.017 at vertical and MZ, respectively. Thus, the initial development of plasma turbulence inthe first few Airy maxima at MZ and vertical should be nearly the same (cf., Figure 11). As w0 ≫ wsst ∼ 10−3
(equation (A9)), the turbulence develops in the superstrong (SST) regime and, furthermore, like in isotropicplasmas atw0 >�2
ce∕�2
0. The latter is easily satisfied for f0∕fce ∼4–5. Therefore, the SLT acceleration is expectedto be more efficient than in the 1-D approximation (Figure 12).
First, we argue that the DL formation is not tied to the BUMD mechanism, which operates at h> h∗bum > hgr
(see equation (3)) and has the minimum excitation threshold Ebum ≈ 0.3 V/m at fbum ≈ f0 + 3flhr [Huang andKuo, 1994;Hussein et al., 1998]. Note that the free space field Efs (4) exceeds Ebum at h ∼ 220 km for p0 > 0.4, i.e.,well below the applied powers. The independence of the DL speed on the BUMD intensity (Figure 4) and thecontinuous descent after passing h∗
bum(Figures 3–6) show that the BUMD mechanism is minor for DL. At the
same time, the SLT development in the descending region (i3) is indicated by the persistent central IL peak(Figure 2) andNC (Figures 3 and 5). The descent follows theNCpower, whereas theDM features appear similaratMZ (with DL) and at vertical (without DL). Furthermore, the descending features andDM follow the onset ofheating too rapidly for significant striations to develop, thereby excluding the TPI-related heating. The sameis true for the descending PL/IL echoes (Figures 6 and 7). Thus, it appears conclusive to relate DL to the SLTdevelopment.
The observation that DL appear in the sunlit ionosphere at ≈PDL∕2 (see Figure 7a and Djuth et al. [1994]) andthat the sunlit-to-dark transition quenches the persistentDL at the terminus (Figure 8) indicatesmore efficientionization (acceleration)whenphotoelectrons are present (i9). This is the consequenceof the SLT acceleration,which is enhanced in thepresenceof theambient suprathermalpopulation (photoelectrons) [e.g.,Mishinetal.,2004]. Another consequence is that the DL speed vD anticorrelates with the MUIR signal amplitude (Figures 4and 6–8) during daytime (i8). Note that the resonance electron energy for 33 cm waves detected by MUIRis �r ≈ me�
2pe∕2k
2r≈ 9 eV at f0 = 6 MHz and ≈6 eV at 4.5 MHz. Actually, as the wave absorption by the tail
electrons increases, collapse can be arrested at greater scales than 1∕kr , i.e., at �(s)
min >�r . In other words,
MISHIN ET AL. ARTIFICIAL PLASMA LAYERS 16
Journal of Geophysical Research: Space Physics 10.1002/2015JA021823
while the density of the ionizing (�> �ion) electrons niont
and hence vD (see equation (A13) and Eliasson et al.,2012, Figure 12) increases, the detectable wave energy reduces. At the same time, the persistent NC (Figure 5)reveals the waves with k < kr , undetectable by MUIR. This is consistent with the gap between the initial over-shoots and the persistent PL/IL signals (Figures 4, 6, and 7a), which is of the order of the ionization length ofaccelerated electrons [seeMishin and Pedersen, 2011, Figure 2).
The energyflux in the short scales increasesdue to conversionof long-scalewaveson short-scale density oscil-lations (equation (A10)). The presence of such oscillations is indicated by the large altitudinal spread of theIL/PL layers (i2) and the cloud-like structureof theDVH layers (Figure 4). In theheatedplasma (Te ∼0.3–0.4 eV),short-scale oscillations can be produced by “burned out” cavities in the SLT region [e.g., Galeev et al., 1977]and the heat flux-driven instability (see Appendix A). The latter easily develops at altitudes ∼200 km where
the mean free path of heated electrons �T is ∼2–3 km and lT =|||∇∥ ln Te
|||−1≤ 100 km [cf. Dhillon and
Robinson, 2005, Figures 5 and 6]. As discussed in Appendix A, this instability leads to the asymmetry (i2*)between downshifted and upshifted shoulders in the IL spectrum (Figure 2).
4.2. Mitigation of Anomalous Absorption and Parametric UH Interactions
Eliasson et al.’s [2015] Figure 11 shows the SLT-driven DL for a broad range of incidence angles, in agreementwith some of the data (i1*). Indeed, for f0 ∼ 2fce (Figure 8), DL appear both at MZ and at vertical. For f0 ∼ 5fceand f0 ∼ 4fce, the descending (SLT) features have been observed within the Spitze cone [Djuth et al., 1994]and from vertical to MZ (Figure 3), respectively. However, Figures 1 and 2 and Figures 4 and 5 show DL only atMZ (i1) and overshoots at vertical for nearly the same frequencies. We consider anomalous absorption (TPI)as the main factor demarcating the overshoot and persistent behavior.
In particular, anomalous absorption is inhibited in the Djuth et al. [1994] experiments, as f0 = 6.77 MHz iswithin the forbidden band, i.e., f0 − 5fce < flhr. Similarly, the TPI development is suppressed for f0 ≤ 2fce[Mishin et al., 2005a]. Indeed, UH waves exist only for f0 > 2fce. EB modes in the region fuhr ≤ 2fce at k∥ →
0 are not trapped by striations and hence do not contribute to TPI. For small k∥ ≪ r−1ce
(rce is the thermalelectron gyroradius), trapping is limited to waves with relatively small k
⟂<≈ 5k∥ [e.g., Grach, 1979; Hysell and
Nossa, 2009]. Such oblique waves are unable to attain short transverse wavelengths; thereby, deep striationsnecessary for strong absorption are not formed. This conjecture agreeswith persistent PL signals at fuhr ≤ 2fce,i.e., before the double resonance crossing, and overshoots and increased (by 10–15 dB) Kodiak radar echoesthereafter [Kosch et al., 2007a].
In turn, the DL at MZ and their absence at vertical in Figure 1 can be explained using Figure 9 (top). It giveshmz − huh ≈ 230 m (≈ 3lmz) at MZ for 7.1 MHz, i.e., the SLT and UH layers overlap. Apparently, scattering ofthe pump and excited UHwaves off short-scale cavitons and ion oscillations (equation (A10)) keeps down theO → UH coupling and related striations at MZ. However, their development at vertical, where Δhuh ≈ 46l0and �0(huh) ≫ w0(huh), appears unharmed, in agreement with the increase in the CUTLASS radar backscatterby ∼10–20 dB [Dhillon and Robinson, 2005].
Such reasoning, however, fails for the DL in Figures 3–7, where huh is well below hmz and the descent startsand proceeds seemingly regardless of the value of f0 − sfce (i4). Thus, we include parametric interactions ofthe pump-excited (primary) UH waves such as IAPD [Huang and Kuo, 1995; Samimi et al., 2013], parametricdecay PDUH∕Lo
Lo, i.e., UH∕Lo → Lo′ + LH [Zhou et al., 1994; Kuo, 2003], and the OTSIUHLo , i.e., UH∕Lo → Lo′ + �n∥
[Kuo et al., 1997]. Such processes rapidly develop at and between vertical andMZ and limit the TPI (striations)development and hence anomalous absorption. This is consistent with the SEE data (Figure 5) showing theUH-LH signature, the DM, rapidly developing and persisting at vertical and MZ (i7).
It is relevant to note that induced scattering of LH waves [e.g., Galinsky et al., 2011] can result in accumulationof the LH energy near�lhr and subsequent LH collapse, creating elongated density (LH) cavitons [e.g.,Musher
et al., 1978; Shapiro and Shevchenko, 1984]. Kosch et al. [2007a] interpreted the DM [Djuth et al., 2005, Figure 4]andweak backscatter from the Kodiak radar at f0 < 2fce by conversion of the parametrically excited UHwavesand scattering of the radar beam on LH cavitons, respectively.
The DL development only at MZ (i1) in Figure 4 requires additional arguments. Actually, Eliasson et al. [2015]have found that the most favorable incidence angles for DL are 3.5∘S and 10.5∘S even though the (1-D)swelling factor for 10.5∘S is smaller. For real 3-D beams, 3.5∘S and vertical are within the half-power beamwidth, as are 10.5∘S and MZ. For a 2-D beam, the swelling factor near MZ increases (Figure 10) to becomeabout the same as at 3.5∘S. Thus, the large scale length lLT ∝ lmz appears to make HF beam pointings in MZ
MISHIN ET AL. ARTIFICIAL PLASMA LAYERS 17

Journal of Geophysical Research: Space Physics 10.1002/2015JA021823
more efficient for the SLT development and hence DL. This is consistent with the greater NC power atMZ than
that at vertical (Figure 5), alike the aforesaid MZ effect at low powers.
4.3. Langmuir Turbulence in the UH Layer
So far, the SLT development is implied near the turning point hr , i.e., at and between h0 and hmz. However, SLT
can alsodevelop in theUH layer even at lowpowers [Mishinetal., 2004]. First, theOTSIUHLo [Kuoetal., 1997] of the
primary UHwaves with the r.m.s. amplitude∼0.1–0.3 V/m excites oblique short-scale Langmuir waves. These
are transferred into long scales via parametric interactions, e.g., induced scattering on ions. The resultingwave
condensate is subjected to the modulational instability leading to the SLT regime, albeit weaker than near
hr in the overdense ionosphere (see Appendix A). This mechanism was instrumental in explaining airglow in
the underdense ionosphere at MZ at low powers [Mishin et al., 2005b]. As the OTSIUHLo is facilitated at f0 > sfce(s ≥ 3), the contribution of the SLT acceleration in the UH layer is to be greater above the gyroresonance than
below. This helps to explain the emergence of DL [Sergeev et al., 2013], faster descent speeds in Figure 6, and
intensification of 427.8 nm emissions [Gustavsson et al., 2006] at f0 > 4fce.
Similarly, Samimi et al.’s [2014] numerical simulations at fuhr < 2fce and Te ≥ 3Ti show that the IAPD instability
in the UH layer is associated with caviton collapse and concomitant electron acceleration along B0, i.e., in line
with the SLT processes. This agrees with the DL development in Figure 8b that starts almost immediately in
the underdense ionosphere, where themodulational instability is prohibited until theDL becomes overdense
(f (DL)pe ≥ f0). Note also that cyclotron acceleration [e.g., Dimant et al., 1992; Kuo, 2015, Figure 1] can contribute
to the DL formation at small ||2fce − f0||, as with intensified optical emissions at h0 → hgr for low powers [Mishin
et al., 2005a; Kosch et al., 2007a].
It seems natural to explain the presence of two descending ion line layers at f0 = 4.5MHz (Figure 7a) by the
concurrent excitation of SLT near hmz and huh. Indeed, the height difference hmz − huh ≈ 4 km (at the scale
height ln = 50 km) is close to the observed one at 20% and 50% of full power and at the beginning of descent
at full power. The weaker signal in the lower layer is consistent with the weaker SLT energy in the UH layer
[Mishin et al., 2004]. Let us assume that two temperature profiles, with peaks near hmz and huh, overlap in such
a way that the temperature peak is formed between the layers. Then, the asymmetry in the Doppler-shifted
spectra in each layer canbeunderstood in termsof propagationof short-scale, k> kr , ion acousticwaves along
∇∥Te. Though in this case the heat flux instability is not necessary, it can also contribute to the asymmetry.
4.4. Quenching and Persistence at the Terminus
Mishin and Pedersen [2011] suggested the thermal self-focusing instability near the plasma resonance to be
the cause of kilometer-scale bright filaments in the March 2009 experiment, as Kosch et al. [2007b] for low
powers. According to theory [e.g., Guzdar et al., 1998], kilometer-scale filaments grow initially and in ∼10 s
break into smaller-scale sizes (tens to hundreds of meters). During descent, the plasma resonance at hDdescends by several kilometers in ∼10 s, thereby precluding breaking into small scales. However, in the per-
sistent layer at the terminus h∗Dsmall-scale irregularities can fully develop for f0 well under 2fce(h
∗D) and scatter
the HF beam, thereby quenching the SLT-related ionization and thus the DL. As soon as the layer decays and
irregularities fade out, the artificial plasma canbe created again, resembling the quenching and reappearance
of the DL in Figure 8c. On the other hand, the instability is suppressed when f0 − sfce tends to zero [e.g.,
Mjølhus, 1993; Starodubtsev et al., 2007, Figure 6], in agreement with the DL’s persistence at h∗Din November
2009 (Figures 8a and 8b).
A remark is in order. Even though our main object, the DL, is not related to the persistent IL layers near h0at MZ-6 for MZ and vertical injections (Figure 1), this phenomenon is significant enough to be discussed. We
suggest that such layers are related to Z-mode waves that are efficiently generated by resonant scattering
of the pump wave off cavitons in the SLT regions, such as in Figure 11, and also off FAI or LH cavitons near
huh [Mishin et al., 2001]. After reflection on the topside, the Z-mode reaches the height of transformation into
Langmuir waves slightly below h0 and farther south to MZ [cf. Gelinas et al., 2003, Figure 12]. As the Z → L
(linear) conversionprocess is also very efficient, the SLTdevelopment in this layer is expected [e.g.,Mishinetal.,
2001]. The high wave energy, such as around the downward radio window in Figure 9, makes the elevated
Te observed at MZ-6 [Dhillon and Robinson, 2005] not surprising. Then, the heat flux instability in the heated
plasma provides an explanation of the asymmetric IL spectra at MZ-6 (Figure 2).
MISHIN ET AL. ARTIFICIAL PLASMA LAYERS 18

Journal of Geophysical Research: Space Physics 10.1002/2015JA021823
5. Conclusion
The salient features of HF-driven plasma turbulence and descending layers of freshly ionized plasma inhigh-power heating experiments have been summarized. The overall data relate DL to the development ofstrongLangmuir turbulence,which is revealedby the specific spectral features of incoherent radar backscatterand stimulated electromagnetic emissions. We have performed numerical investigation of (linear) propa-gation of O-mode waves for 1-D and 2-D HF radio beams at various incidence angles, along with the SLTdevelopment and DL formation in the 1-D approximation. The swelling factor of a 2-D beam exceeds that ofa 1-D beam by about 2 dB, while the characteristic scale length of the swelling pattern at MZ is about twicethat at vertical. The greater extent of the SLT region near MZ than that at vertical appears to make HF beampointings in MZ more efficient for electron acceleration and DL. The presence of the ambient suprathermal(photo)electron population facilitates the SLT acceleration. The consequences of the photoelectrons in thesunlit ionosphere are the decreased DL formation threshold, the greater DL speeds at weaker MUIR signalsand stronger NC powers, the gap between the overshoot and persistent PL/IL signals, and the decay of thepersistent DL at the terminus after sunlit-to-dark transition.
The data suggest that the SLT persistence near the plasma resonance during descent is the consequence ofmitigation of anomalous absorption in theUH layer. In particular, parametric UH interactionsmitigate anoma-lous absorption for heating frequencies outside the forbidden band and also generate Langmuir turbulencein the UH layer. The presence of the second SLT region is consistent with two layers of the MUIR ion linebackscatter at f0 > 3fce, as are the emergence of DL, faster descent speeds, and intensification of 427.8 nmemissions at f0 > 4fce. The DL persistence at the terminal altitude depends on how close the heating fre-quency is to the local gyroharmonic. The large altitudinal spreadof the IL/PL layers and the cloud-like structureof the DVH layers indicate the presence of short-scale density oscillations. These can be produced in theheated plasma by burned out collapsing cavities and the heat flux-driven instability. The latter leads to theasymmetry between downshifted and upshifted shoulders in the IL spectra and limits the field-aligned heatconductivity.
Overall, the concept of an ionizing wavefront created by accelerated suprathermal electrons agrees withthe data. More careful studies, both experimental and numerical, are needed in order to detail the pro-cesses involved. Future modeling at various pump frequencies should include parametric interactions in theupper hybrid layer, scattering of the radio beam off cavitons, thermal self-focusing and heat flux instabilityeffects, and the resulting SLT acceleration in the plasma resonance and upper hybrid layers in a self-consistentmanner.
Appendix A: Langmuir Turbulence and Related Effects
We present a heuristic description of plasma turbulence driven by pump waves of the amplitude A0 and fre-quency�0 ≈ �pe ≫ �ce near the plasma resonance h0. It is based on the Zakharov equations describing slowprocesses after “filtering out” the fast (HF) variations [e.g., Zakharov, 1984]. So the Langmuir field is presentedvia potentials� = Re(Ψ(r, t)e−i�pet) andEl=−∇�, with slowly varying ( d
dtln |Ψ| ∼ Ω ≪ �pe) amplitudesΨ and
Al = −∇Ψ. The pump wave near h0 is polarized mainly along B0, i.e.,|||E∥
|||≫||E⟂||. Then, the ponderomotive
force is almost the same as in isotropic plasma, Fp = −∇WΣ∕2ne, accurate to ||E2⟂|| ∕|||E
2∥
|||. Here WΣ is theenergydensityof the total, pumpandelectrostatic, HFwavefield. Its quantitativemeasure is thedimensionlessparameter of nonlinearitywΣ = WΣ∕n0Te . Another key parameter is the frequencymismatch �0 (2), since twoHF oscillations with frequencies �0 ≈ �1 exert the ponderomotive force at the beat frequencyΩ = �0 − �1.
For p0 = P0∕PDL ≥ 1, we get from equation (4) the pump amplitude A0 = EA(�0) = 0.5Υ�
√p0 at h0 = 220 km.
Taking f0 = 3 MHz (nc ≈ 105 cm−3), Te0 = 0.2 eV, ln = 40 km, and � = 14∘ gives at vertical l0 ≈ 75 m,EA ≈ 12
√p0 V/m, andw0 = E2
A∕8�n0Te ≈ 0.2p0. In the jth Airy peakwithin the Spitze, the frequencymismatch
is �Aj = �A ⋅ (h0 − hj)∕l0, where �A = �0(hA) ≈ l0∕2ln ∼ 10−3, while w0j ≈ ajw0 (aj ≈ 0.36 → 0.16 athj∕l0 ≈ 10 → 40). For w0 ≫ �A, the frequency mismatch can be disregarded, at least in the first few Airymaxima.
With the magnetic correction, the first Zakharov equation becomes [e.g., Shapiro and Shevchenko, 1984]
(i�
�t+
32�per
2DΔ)ΔΨ −
�2ce
2�peΔ
⟂Ψ =
�pe
2∇(�NsA
)(A1)
MISHIN ET AL. ARTIFICIAL PLASMA LAYERS 19
Journal of Geophysical Research: Space Physics 10.1002/2015JA021823
whereΔ is Laplacian and A = Al + A0. As ions are unmagnetized, the second Zakharov equation for the slow(Ω ≪ �pe) density variation �Ns = �ni∕n0 remains
(�2
�t2− c2
sΔ
)�Ns =
116�n0mi
Δ |A|2 (A2)
We disregard collisional and convective damping, assuming w0 ≫ max(4�e∕�pe, 2∕kln, �), where k is theexcited wave number.
Since�0∕c < k∗ =√�∕3de, the dipole approximation (a uniformoscillating field) canbeused even at oblique
incidence. At w0 ≫ �2ce∕�2
pe, the magnetic effect can be neglected. In the opposite limit, the modulational
instability (MI) develops in a narrow cone |�| ≤ �pe
�ce
√w0 ≪1 around B0. The MI is inherently tied to the ten-
dency of Langmuir plasmons to accumulate inside density depletions �Ns <0 (hereafter, cavities). It developswhen the excess of the HF pressure inside a cavity exceeds the thermal pressure disbalance �pe = n0Te�Ns or
w0 >wth = 3k2r2D
(A3)
As the HF pressure forces plasma out of a cavity, it deepens further and “attracts” yet more plasmons, therebycreating a positive feedback loop. In the supersonic, w0 > 3�, regime, the growth rate maximizes at kmrD ≈
�1∕6(w0∕3)1∕3 and then reaches a plateau
Γmi(k) ≈ �pe(�w0∕3)1∕2 (A4)
The plateau at km < k ≤ kth ≈ r−1D
√w0∕3 dominates the phase volume of the pump-excited (primary)
Langmuir plasmons.
At ||�Ns||> 3k2r2
D, plasmons are trapped so that intense localized wave packets are formed. Cavities with
trapped Langmuir oscillations are termed Langmuir cavitons or simply cavitons. Their evolution can bedescribedusing the following simple arguments [e.g., Sagdeev, 1979]. Undamped, undriven (A0 = 0) Zakharovequations conserve the total number of plasmons in cavitons
≈ ∫ dr ||E2|| ∕8��l = const (A5)
As ||�Ns|| ≪1, the integral (A5) yields ||E2|| ∝ l−d , where d =1, 2, 3 is the dimension of cavitons of the size
l. The wavelengths of the trapped plasmons are also of the order of l, i.e., k ∼ 1∕l. As k ∝ ||�Ns||1∕2 (trap-
ping), one has l ∝ ||�Ns||−1∕2, indicating that a deepening cavity narrows (collapses) as time progresses. Since
||�pe|| ∝ ||�Ns|| ∝ l−2 and ||E2|| ∝ l−d , the thermal pressure will ultimately balance the HF pressure for D =1,
thus forming one-dimensional cavitons. In two (three) dimensions, the speed of collapse persists (accelerates)with time.
In the supersonic regime, the right-hand side of equation (A2) is Δ |E|2 ∼l−2 |E|2 ∝ ||�Ns|| |E|
2, while the left-hand side becomes �2∕�t2 ∼
(t∞ − t
)−2∼ �−2, with � = t∞ − t and the time of collapse t∞. These give a
self-similar solution |E| ∝ �−1 and ||�Ns|| ∝ l−2 ∝ �−4∕d . It is valid also in the presence of external pumping,
because the trapped plasmons become uncoupled from the pump in the course of collapse. The phase veloc-ities of plasmons in collapsing cavitons decrease as∼ �pel(t) ∝ �2∕d . At some “absorption” size, l ≤ la ∼ k−1
a∼
(3−5)rD (< 10 cm), plasmons are absorbedbyelectrons (thewaveenergy “burnout”) due to Landauand transittime damping.While the HF pressure in the caviton drops and collapse is arrested, a small group of suprather-mal electrons gain energy. At Te ∼ Ti , an empty cavity ||�Na
|| ∼ k2ar2Drelaxes within ∼
(kacs
)−1∼ (3–5)/�pi ∼
(5–9)102∕�0. At Te > 4Ti, short-scale ion sound waves at Ωs ∼ kacs, radiated by burned out cavities, tend toaccumulate [Galeev et al., 1977].
The system ultimately reaches a dynamic equilibrium between the long-scale pumping and short-scaletransfer by collapsing wave packets into the absorption interval k> ka [e.g., Galeev et al., 1977]. Here someplasmons are localized in randomly distributed cavitons at different stages of collapse, while others are free.The energy is pumped into cavitons in the long-scale source region, kL ≤ r−1
D
√wL∕3, with the energy density
WL comprising the MI-excited long-scale waves. The energy balance equation in the source region is
dWL∕dt = �efW0 − Γmi(WL)Wcav (A6)
MISHIN ET AL. ARTIFICIAL PLASMA LAYERS 20

Journal of Geophysical Research: Space Physics 10.1002/2015JA021823
HereWcav is the fraction of the energy in collapsing cavitons, �ef = �ef�pewL is the effective dissipation rateof the pump energy, with a numerical coefficient �ef ∼ 1∕3. Since �ef >Γmi, the saturated level of turbulentelectric fields is smaller than during the initial stage (the SLT overshoot).
Between the source and absorption (ka ≫ kL) regions lies the inertial interval, through which the energy istransported by collapsing cavitons. The spectrum in the inertial interval can be found assuming that the spec-tral energyflowW
(in)k
dk∕dt is preserved. Substituting k(t) ∝ �−2∕d gives apower lawspectrumW(in)k
∝ 1∕k1+d∕2
and the total energy of short-scale waves at the absorption boundaryWa ≈ Wcav(kL∕ka)d∕2. In particular, for
Wcav ∼ WL from equation (A6) one getswL ≈ 3�−1�2efw0 ≫ w0.
Since slow (Ω ∼ Γmi ≪ �ce) electronmotion is magnetized, the cavitons at ||�Ns|| ≪ �2
ce∕�2
pe are pancake-like,with the dimensions [e.g., Shapiro and Shevchenko, 1984]
l∥ ∼ k−1∥
∼ rD||�Ns
||−1∕2
∼ l⟂
�pe
�ce
||�Ns||1∕2 (A7)
obtainedbybalancing the secondand third terms in the left-hand sideof equation (A1) andusing the trappingcondition ||�Ns
|| ∼ k2∥r2D∼ r2
Dl−2∥. The variation of the electric field in cavitons in the supersonic regime remains
|E| ∝ �−1, and the self-similar solution is l2∥∝ l
⟂∝ ||�Ns
||−1
∝ � . The initial dimensions of pancake-shaped cavi-tons are defined by equation (A7) with ||�Ns
|| ∼ wL. Though the number of plasmons in collapsing “pancakes”decreases
= ∫ dr⟂dr∥ ||E
2|| ∕8��l ∝√� (A8)
the radiated energy density is greater than 3r2D∕l2
∥. So new cavitons of smaller scales emerge and collapse,
thereby preserving the total energy flow toward the absorption region, k∥ ≥ ka ≫ kL ∼ r−1D
√wL. The density
variation ||�Ns|| in collapsing cavitons can reach �2
ce∕�2
pe at l−1∥
≪ ka. Then, symmetric (l⟂∼ l∥) cavitons with
Wsym ∼ WL
�pe
�ce
√wL ≪ WL continue to collapse, preserving trapped plasmons until the energy burnout. The
corollary to the above is that the 1-D description of SLT is deficient for weakly magnetized plasma, especiallyat large pump powers. In particular, much greater pumping is required in 1-D to achieve the same short-scalewave energy (the acceleration rate).
The above SLT scenario works for wL < 3k2ar2D∼ 10−2 or w0 < wsst ≈ 0.1
√3� ∼ 10−3. Otherwise, MI develops
in the whole region from the pump to absorption so that in a steady state collapse plays a minor role and theenergy flux through the inertial interval is reduced. In this superstrong regime, the energy balance becomes
�efW0 = 2∑
kΓL(k)Wk atw0 >wsst ≈ 0.1
√3� (A9)
with �ef∼�pe�1∕3(wL∕3)
2∕3 >Γmi and the Landaudamping rateΓL(k) [ShapiroandShevchenko, 1984]. Anotherlimitation concerns the role of small-scale, q ≫ kL, density irregularities, �Ns(r) =
∑q Re(�Nq exp(iq z)). As a
result of conversion, LkL + �Ns → L′q, long-scale plasmons are transferred into the short scales. Thereby, the
amount of the collapsing energy can be significantly smaller than that without small-scale irregularities.
For wideband random phase irregularities, |�Nq| < 3q2r2D, the conversion rate Γc is readily derived by
averaging equation (A1) over the scale ∼ 2�∕kL ≫ 2�∕q
Γc ≈∑
q�l(q)
⟨|�N|2
⟩q
36q4r4D
(A10)
to an accuracy of Γc ≪ �l(q) < 3�peq2r2
D[e.g., Mishin and Schlegel, 1994]. Here �l(k) is the total (collisional
+ Landau) damping rate and⟨|�N|2
⟩q=
∑q
⟨�Nq�N
∗q
⟩is the phase-averaged spectral energy. Applying a
similar procedure to the electromagnetic version of equation (A1) [e.g., Shapiro and Shevchenko, 1984], witheither FAI near huh [Mishin et al., 2001] or SLT cavitons near hr [Eliasson, 2008] in the right-hand side, one candescribe resonant scatter of electromagnetic waves into oblique Z- and O-mode waves.
At MZ, the swelling coefficient is smaller than Υ0 by a factor of ≈2 in 1-D and ≈1.25 in 2-D simulations(Figure 10). This does not inhibit the instability even at p0 ≪ 1, as long as equation (A3) is satisfied. However,it was so far implied that w0 > �0. As follows from simulations (e.g., Figure 9), the value of �mz ≈ −Δhmz∕2lnis of the order of 0.017 (≫ �A). This affects the instability development at smaller w0. For small mismatches
MISHIN ET AL. ARTIFICIAL PLASMA LAYERS 21

Journal of Geophysical Research: Space Physics 10.1002/2015JA021823
√��0 ≪ w0 < �0 and �k ≈ �pe
(3
2k2r2
D− �0
)>0 (Ω2 < 0), the growth rate reaches maximum Γsm ≈
�pe
(��0w0∕8
)1∕3at km ≈ r−1
D
√2�0∕3. In theMI region at 2�k∕�pe ≤ w0, with the greatest phase volume, the
growth rate is Γmk ≈ �pe�1∕2kde ≤ Γmi (equation (A4)). Here the development of turbulence is similar to that
for �0 = 0, though the short-scale wave energy is lesser [e.g., Shapiro and Shevchenko, 1984].
For√��0 >w0, the pump-driven modulational instability is inhibited, while PDO
L(or induced scattering at
Te ∼ Ti) generates red-shifted plasmons at k ∼ kp ∼ r−1D
√�0. The waves in the resonance zone of the spectral
width �k∗ ≈ 2�1∕2∕3de grow at the rate Γind ≈ �pew0∕8 ≫ �e∕2 until at �ind ∼ 10∕Γind they become unstable.In saturation, their pumping Γind(W0) is balanced by their decay≈ Γind(W1), withW1 = ∫
�k∗dkWk . Therefore,
their r.m.s. amplitude �E1 ≡ A1 reaches≈ A0. This process repeats itself in each further step, so theWT cascadespectrumconsists of consecutive red-shiftedpeaks of the amplitudes≈ A0 andwidths∼ �k∗. Thewaveenergyis evenly distributed (Wk ≈ W0∕�k∗) over theWT spectrumwith the total energy densityWind ≈ W0
√�0∕� ≫
W0. Ultimately, plasmons converge in the region, k ≤ kc ≈ r−1Dw0∕2�
1∕2 ≪ kp, with the energy densityWc ≈
W0kc∕�k∗ ≈ 3k2cr2DnTe. The plasmon condensate is subject toMI, so theWT and SLT regimes coexist. Forw0 >�,
the supersonic MI (equation (A4)) leads to the energy outflow in collapsing cavities∼ Γmi(Wc)Wcav. Balancingby the energy influx due to induced scattering, ≈ 2ΓindW0, givesWcav ≈ W0 ≪ Wc.
Whatever their source, the short-scale plasmons are absorbed by a small group of plasma electrons that forma non-Maxwellian high-energy tail Ft(u). It is found from equation (7), with �∕�z = 0 andWk determined fromthe energy balance in the absorption interval
dWk
dt+
ddk
Wk
dkdt
= Γa(k)Wk (A11)
where k(t) ∼ �−2 and Γa(k) is the absorption rate.
A steady state solution of equations (7) and (A11) is a power law function, Ft(�) = Ct ⋅�−b at �max ≥ � ≥ �min ≫
Te . Numericalmodeling of 1-D electron acceleration in aMaxwellian (F0 = FM) plasma yields b ≈1.5, �(M)
min∕Te ≈
10–20 and the tail density nt = �tne ≈ 10−3−4ne [Galeev et al., 1983;Wanget al., 1997]. The value of nt ismainlydefined by the matching condition, Ft(�min) = F0(�min). In the presence of the ambient (“seed”) suprathermalpopulation (e.g., photoelectrons), with Fs(�
(M)
min) ≫ FM(�(M)
min), the absorption rate increases so that collapse isarrested at greater scales than in a Maxwellian plasma. As a result, the minimum energy of the tail electrons�(s)
min greatly exceeds �(M)
min and nt significantly increases [Mishin and Telegin, 1986]. The obvious corollary is thatmany more energetic electrons are accelerated during daytime than would be at night [Mishin et al., 2004].Thus, far, neither numerical SLT simulations include the ambient suprathermal population.
Eliasson et al.’s [2015] simulations show the SLT-driven DL at different incidence angles (see Figure 12).Mishin
andPedersen [2011] estimated theDL speed vD using the fact that accelerated electronsmove along themag-netic field to form a stretched “tongue” of newly ionized plasma. Let lion and �ion be the ∥ B0 extent of theionization region downward and the time for the plasma at hD(t) − lion to reach nc, respectively. Here nc isdefined by the resonance condition fpe(nc) = f0. Assuming that the ionization rate qion ≈ nion
t⋅ �ion greatly
exceeds recombination and diffusion losses gives
�ion ∼
(1 −
lion
ln
)(�iont
�ion)−1
∼ 0.8(�iont
�ion)−1
(A12)
Hereniont
= �iont
nc ≈ Ct ⋅�1−bion ∕(b−1) and �ion ≈ 2⋅10−8
([N2] +
1
2[O]
)s−1 is themean ionization frequency, i.e.,
�ion = ∫ �ion(�)Ft(v)d3v, at �ion ≪ �max. As the ratio �il(�) = �il∕�e is small, the accelerated electrons undergo
fast isotropization, yielding lion ∼ v�1∕2il
∕�ion. Here the frequency of inelastic collisions �il(�) is∼ (1–2)�ion(�) at102 >�∕�ion >1. At altitudes well below the initial resonance h0, the ambient density is low, nc ≫ n0, and thespeed of descent vD ∼ lion�
−1ion becomes
vD ∼ �iont
�ion ⋅ v�1∕2il
∕�ion ∼ �iont
⋅ v�1∕2il
(A13)
As �1∕2il
v ∼ 106 m/s, we get the value of vD ∼ 102 m/s for �iont
∼ 10−4. Note that vD contains no directdependence on the neutral density Nn and hence predicts vD ∼ const, providing that �ion
t≈ const along
the path.
MISHIN ET AL. ARTIFICIAL PLASMA LAYERS 22
Journal of Geophysical Research: Space Physics 10.1002/2015JA021823
Let the ionizing front be initially created at some altitude h0D. Then, the seed suprathermal population at lower
altitudes will bemaintained by degrading earlier accelerated electrons, thereby supporting a self-similar pro-cess [Mishin and Pedersen, 2011]. As soon as the latter is broken, descent slows down and finally stops evenfor the same input. Apparently, as the scale length in the front decreases, lD
n∼ lion ∼ N−1
n, the SLT extent lLT
and the electron transit time (∼ lLT∕umax) decrease as ∼ N−1∕3n , thereby limiting �max and thus nion
t. Further,
adding inelastic losses StFt(�) ≈ −�il(�)Ft(�) in the right-hand side of equation (7) puts additional boundson �max at hD < 160 km [Mishin and Pedersen, 2011]. That is, when �il(�max) exceeds the acceleration ratemD(umax)∕8��max, the increase of �max stops [Volokitin and Mishin, 1979]. Another factor is that a stretched(∥ B0) tongue of the DL plasma affects the pump propagation [cf. Gurevich et al., 2002]. Apparently, this effectincreases at low altitudes where n0(hD) ≪ nc and the O-mode index of refraction is mainly defined by theDL plasma.
Thus, far, the plasma temperature is implied unchanged, which holds for time scales much shorter than theelectron heating time �T ∼0.1–1 s. The perturbed electron temperature, Te = Te0 + ΔTe, is derived from theheat balance
32n0
�
�tΔTe ≈ �eWΣ − �e�ilΔTe − ∇∥qT (A14)
qT ≈ 6neTevTeKT sign( − ∇∥Te) (A15)
Here �eWΣ is the collisional (ohmic) heating rate, qT is the electron heat flux, KT = �T|||∇∥ ln Te
||| = �T∕lT is theKnudsen number, and �T = vTe∕�e. It is implied that KT ≪ 1 and �e ≈ �ei . The coefficient of inelastic losses at220 km, �il(Te) ≈ (0.3–1)⋅10−3–10−2−1.5 ⋅10−2 at Te ≈ (0.15–0.22)− 0.38–0.43 eV, is calculated usingMajeed
and Strickland [1997] tabulations. The thermal conduction balances �eWΣ at KT = Kc = (wΣ∕6)1∕2. At KT < Kc,
equation (A14) yields ΔTe = ΔT∞ ∼ 2WΣ∕3n0�il(T∞) or T∞ ∼0.35 eV at Te0 = 0.2 eV and WΣ∕n0Te0 ∼ 10−2.The steady state is achieved at KT = K∞ ∼ Kc(T∞).
If T∞ exceeds ∼4Ti ≈ 0.3–0.4 eV and KT > 2�1∕2, the heat flux-driven instability can develop in the heatedregion [e.g., Forslund, 1970; Mishin, 1974]. For �T ≥ 1 km, this condition is satisfied for lT ∼ 100 km. Farbeyond the threshold, the saturated ion sound spectrum is close toWs
k∝ Ws ln(1∕kde) ⋅ k
−3 at kis ≤ k ≤ r−1D
(the Kadomtsev-Petviashvili spectrum) [e.g., Kadomtsev, 1965]. Here the energy density Ws ∼ 10−2−3n0Te,with the spectral maximum at kis and a lower frequency cutoff at kmin ∼ (0.05− 0.1)∕rD (see details and refer-ences inMishin and Fiala [1995]). As far as the kis value is concerned, it varies from ∼ (0.2–0.3)/rD to ∼ 0.6∕rDin different experiments and simulations where an energetic ion tail is formed.When the ion tail is absent, thespectrummaximizes just above the low-frequency cutoff and the waves are mainly field aligned.
The ion tail occurs at low ion-neutral collisions such as in the F region. In this case, waves at k < 0.6∕rD arehighly oblique (angles � up to ∼ �∕2), while those at k ≥ 0.6∕rD turn to be more field aligned. While wavespropagate along∇∥Te, i.e., downward above, and upward below, the temperature peak, their wave numbersdecrease andmay becomedetectable byUHF radars. Apparently, greater values of KT at higher altitudes favorthe instability above the Te peak and thereby theupshifted shoulder in the excited ILDoppler spectra. Anotherimportant outcome of this instability is that the heat flux in turbulent plasma is reduced to qturb = �turbneTevTewith �turb in the range≈ 7.5�1∕2 to≈ �1∕4 [Mishin, 1974; Bychenkov et al., 1988], thus severely limiting the heattransport at KT ≫ 2�1∕2.
Notation
B0 the ambient magnetic fieldBF layer the region of scattering from the bottomside F region
BUM broad upshifted maximumDM downshifted maximumDL descending layersDP the downshifted (SEE) peak
DVH descending virtual height of reflectionEA the first Airy peak amplitude
Ebum the threshold amplitude for the BUM generationEfs the free space field
MISHIN ET AL. ARTIFICIAL PLASMA LAYERS 23
Journal of Geophysical Research: Space Physics 10.1002/2015JA021823
Ein the input amplitude of the pump wave (section 3)EB electron Bernstein wavesFAI field-aligned irregularitiesFM the Maxwellian distribution
F0 = FM + Fs the total ambient electron distributionFs the distribution of ambient suprathermal electrons (e.g., photoelectrons)
Ft(u) the accelerated tail distribution function (TDF)Ct the const in the power law approximation (equation (9))
IAPD ion acoustic parametric decay UH∕EB → UH′∕EB′ + IAIL and PL ion and plasma lines
Knudsen number KT = �T|||∇∥ ln Te
||| = �T∕lTL and UH Langmuir and upper hybrid wavesLH and S lower hybrid and ion sound (ion acoustic IA) waves
Lo oblique (magnetized) Langmuir wavesMI modulational instability
MUIR the (HAARP) modular UHF incoherent scatter radarNC narrow continuum
OTSI oscillating two-stream instabilityOTSIuhLo oscillating two-stream instability of the UH pump UH → UH → Lo + �n∥PDO
Lparametric decay O → L + S
PDOuh∕eb
parametric decay O → UH∕EB + LH
PDuh∕Luh∕L
parametric decay UH∕Lo → UH′∕Lo′ + LHP0 effective radiated power (ERP)
PDL ≈ 400MW the threshold ERP for descending layers at 2fcePrimary waves waves excited by the pump wave
SEE stimulated electromagnetic emissionsSLT strong Langmuir turbulenceSST superstrong (Langmuir) turbulence (equation (A9))
Striations FAI with depleted plasma density �nst < 0TPI thermal parametric instabilityWT weak turbulenceWk the wave spectral energy densityf(DL)pe the plasma frequency within the DLho the reflection (plasma resonance) height at verticalhA the first Airy maximum altitudehD the descending layer altitudehgl the altitude of the region of green line emissionshgr the gyroresonance matching height, sfce(hgr) = f0hmz the turning points at the magnetic zenith (MZ)huh the upper hybrid resonance heightΔhuh = huh − h0 andΔhmz = hmz − h0hre the altitude of the region of IL/PL radar echoesh∗Dthe DL terminal altitude
h0xx
the start altitude of the descending feature xx (re, bum,gl, etc)h∗xx
the terminal altitude of the descending feature xxl0 the scale length of the Airy (swelling) pattern at verticall� the scale length of the swelling pattern at oblique incidence
lmz the scale length of the swelling pattern at MZlLT the altitudinal extent of the SLT regionln the density scale heightlT the electron temperature scale heightnc the critical plasma density defined by the resonance condition fpe(nc) = f0
niont
the density of the ionizing (�> �ion) electrons p0 = P0∕PDLrD the Debye radiusvD the speed of descentvxx the speed of the descending feature xx
MISHIN ET AL. ARTIFICIAL PLASMA LAYERS 24
Journal of Geophysical Research: Space Physics 10.1002/2015JA021823
w the dimensionless parameter of nonlinearityw0 the pump wave nonlinearity parameterwth the modulational instability threshold (equation (A3))Γmi the modulational instability growth rate (equation (A4))Γc the conversion rate (equation (A10))Ω the frequency of slow oscillations
�iont
the relative density of ionizing (�> �ion) electrons�dlt
the threshold value of �iont
for DLΔ�b a half-power (−3 dB) width of the pump or radar beam�ion the ionization energy
�min (�max) the minimum (maximum) energy of the accelerated electron distribution�0 incidence angles of the pump wave�s the Spitze angle�r the resonant (Bragg scatter) wavelength�T the mean free path of thermal electrons� the electron-to-ion mass ratio�il the frequency of inelastic collisions
�ion the ionization frequency�st the growth time of striations�0 the frequency mismatch between the pump and plasma frequencies
�A and �mz the frequency mismatch at hA and hmz, respectively
References
Ashrafi, M., M. Kosch, K. Kaila, and B. Isham (2007), Spatiotemporal evolution of radio wave pump-induced ionospheric phenomena nearthe fourth electron gyroharmonic, J. Geophys. Res., 112, A05314, doi:10.1029/2006JA011938.
Bernhardt, P., C. Tepley, and L. Duncan (1989), Airglow enhancements associated with plasma cavities formed during ionospheric heatingexperiments, J. Geophys. Res., 94, 9071–9092.
Bernhardt, P., et al. (2013), Artificial interactions in the high latitude ionosphere, paper presented at RF Ionospheric Interactions Workshop,Arecibo, Puerto Rico.
Bilitza, D., L. McKinnell, B. Reinisch, and T. Fuller-Rowell (2011), The international reference ionosphere (IRI) today and in the future, J. Geod.,85, 909–920, doi:10.1007/s00190-010-0427-x.
Blagoveshchenskaya, N., T. Borisova, V. Kornienko, B. Thide, M. Rietveld, M. Kosch, and T. Bösinger (2005), Phenomena in theionosphere-magnetosphere system induced by injection of powerful HF radio waves into nightside auroral ionosphere, Ann. Geophys.,23, 87–100.
Borisova, T., N. Blagoveshchenskaya, A. Kalishin, M. Kosch, A. Senior, M. Rietveld, T. Yeoman, and I. Hagström (2014), Phenomena in thehigh-latitude ionospheric region induced by a HF heater wave at frequencies near the fourth electron gyroharmonic, Radiophys.Quantum Electron., 57, 1–19.
Bychenkov, V., V. Silin, and S. Uryupin (1988), Ion-acoustic turbulence and anomalous transport, Phys. Rep., 164, 119–215.Carlson, H., V. Wickwar, and G. Mantas (1982), Observations of fluxes of suprathermal electrons accelerated by HF excited Langmuir
instabilities, J. Atmos. Terr. Phys., 12, 1089–1100.Cheung, P., M. Sulzer, D. DuBois, and D. Russell (2001), High-power high-frequency-induced Langmuir turbulence in the smooth ionosphere
at Arecibo. II. Low duty cycle, altitude-resolved observations, Phys. Plasmas, 8, 802–812.Dhillon, R. S., and T. R. Robinson (2005), Observations of time dependence and aspect sensitivity of regions of enhanced UHF backscatter
associated with RF heating, Ann. Geophys., 23, 75–85.Dimant, Y., A. Gurevich, and K. Zybin (1992), Acceleration of electrons under the action of intense radio-waves near electron cyclotron
harmonics, J. Atmos. Terr. Phys., 54, 425–436.Djuth, F., P. Stubbe, M. Sulzer, H. Kohl, M. Rietveld, and J. Elder (1994), Altitude characteristics of plasma turbulence excited with the Tromsø
superheater, J. Geophys. Res., 99, 333–339.Djuth, F., T. Pedersen, E. Gerken, P. Bernhardt, C. Selcher, W. Bristow, and M. Kosch (2005), Ionospheric modification at twice the electron
cyclotron frequency, Phys. Rev. Lett., 94, 125001, doi:10.1103/PhysRevLett.94.125001.DuBois, D. F., A. H. H. A. Rose, and D. Russell (1993), Space and time distribution of HF excited Langmuir turbulence in the ionosphere:
Comparison of theory and experiment, J. Geophys. Res., 98, 17,543–17,567.Eliasson, B. (2008), Full-scale simulation study of the generation of topside ionospheric turbulence using a generalized Zakharov model,
Geophys. Res. Lett., 35, L11104, doi:10.1029/2008GL033866.Eliasson, B. (2013), Full-scale simulations of ionospheric Langmuir turbulence, Mod. Phys. Lett. B, 27(8), 1330005,
doi:10.1142/S0217984913300056.Eliasson, B., and K. Papadopoulos (2015), Numerical study of anomalous absorption of O mode waves on magnetic field-aligned striations,
Geophys. Res. Lett., 42, 2603–2611, doi:10.1002/2015GL063751.Eliasson, B., X. Shao, G. Milikh, E. V. Mishin, and K. Papadopoulos (2012), Numerical modeling of artificial ionospheric layers driven by
high-power HF-heating, J. Geophys. Res., 117, A10321, doi:10.1029/2012JA018105.Eliasson, B., G. Milikh, X. Shao, E. Mishin, and K. Papadopoulos (2015), Incidence angle dependence of Langmuir turbulence and artificial
ionospheric layers driven by high-power HF-heating, J. Plasma Phys., 81, 415810201, doi:10.1017/S0022377814000968.Fejer, J. (1979), Ionospheric modification and parametric instabilities, Rev. Geophys., 17, 135–153, doi:10.1029/2012JA018105.Forslund, D. (1970), Instabilities associated with heat conduction in the solar wind and their consequences, J. Geophys. Res., 75, 17–28,
doi:10.1029/JA075i001p00017.
Acknowledgments
E.M. and T.P. were supportedby Air Force Office of ScientificResearch. B.E. was supported by theEngineering and Physical SciencesResearch Council (EPSRC), UK, grantEP/M009386/1. Support for B.W. wasprovided by DARPA-DSO under con-tract HR0011-09-C-0099 and by ONRunder grant N00014-03-1-0165. S.G(section 2.2) was supported by RussianScientific Foundation project14-12-00706. NL was supported bythe European Research Council underthe Program FP7/2007-2013)/ERCgrant agreement 320839 and theResearch Council of Norway undercontracts 208028/F50, 216872/F50and 223252/F50 (CoE). We thankRanvir Dhillon for providing the EISCATUHF radar ion line spectra and thereviewers for valuable comments.Experimental and simulation data sup-porting Figures 6–7 and Figures 9–10can be requested from B. Watkins(e-mail: [email protected]) andE. Mishin (e-mail: [email protected]), respectively.
MISHIN ET AL. ARTIFICIAL PLASMA LAYERS 25
Journal of Geophysical Research: Space Physics 10.1002/2015JA021823
Galeev, A., R. Sagdeev, V. Shapiro, and V. Shevchenko (1977), Langmuir turbulence and dissipation of high-frequency energy, Sov. Phys. JETP,46, 711–719.
Galeev, A., R. Sagdeev, V. Shapiro, and V. Shevehenko (1983), Beam plasma discharge and suprathermal electron tails, in Active Experiments
in Space (Symposium at Alpbach, Austria), ESA SP-195, Paris, Eur. Space Agency Spec. Publ., pp. 151–155.Galinsky, V., V. Shevchenko, E. Mishin, and M. Starks (2011), Numerical modeling of 3D weak turbulence driven by high-power VLF pump
waves in the topside ionosphere, Geophys. Res. Lett., 38, L16105, doi:10.1029/2011GL048441.Gelinas, L., M. Kelley, M. Sulzer, E. Mishin, and M. Starks (2003), In situ observations during an HF heating experiment at Arecibo: Evidence
for Z-mode and electron cyclotron harmonic effects, J. Geophys. Res., 108(A10), 1382, doi:10.1029/2003JA009922.Grach, S. (1979), Thermal parametric instability in ionospheric plasma at frequencies close to�He and 2�He , Radiophys. Quantum Electron.,
22, 357–361.Grach, S., N. Mityakov, V. Rapoport, and V. Trakhtengertz (1981), Thermal parametric turbulence in a plasma, Physica D, 2, 102–106.Grach, S., S. Sergeev, V. Yashnov, and V. Kotov (2008), Spectra of stimulated electromagnetic emission of the ionosphere during pump
frequency sweeping near gyroharmonics. II. Discussion of the results, Radiophys. Quantum Electron., 51, 499–514.Grach, S., E. Sergeev, E. Mishin, A. Shindin, and M. McCarrick (2015), Intermediate downshifted maximum of stimulated electromagnetic
emission at high-power HF heating: A new twist on an old problem, J. Geophys. Res. Space Physics, 120, 666–674,doi:10.1002/2014JA020423.
Gurevich, A. (2007), Nonlinear effects in the ionosphere, Phys. Usp., 50, 1091–1121, doi:10.1070/PU2007v050n11ABEH006212.Gurevich, A., A. Lukyanov, and K. Zybin (1996), Anomalous absorption of powerful radio waves on the striations developed during
ionospheric modification, Phys. Lett. A, 211, 363–372.Gurevich, A., K. Zybin, H. Carlson, and T. Pedersen (2002), Magnetic zenith effect in ionospheric modifications, Phys. Lett. A, 305, 264–274.Gustavsson, B., B. Brändström, A. Steen, T. Sergienko, T. Leyser, M. Rietveld, T. Aso, and M. Erjii (2002), Nearly simultaneous images of
HF-pump enhanced airglow at 6300 Å and 5577 Å, Geophys. Res. Lett., 29(24), 2220, doi:10.1029/2002GL015350.Gustavsson, B., T. Leyser, M. Kosch, M. Rietveld, Å. Steen, B. Brändström, and T. Aso (2006), Electron gyroharmonic effects
in ionization and electron acceleration during high-frequency pumping in the ionosphere, Phys. Rev. Lett., 97, 195002,doi:10.1103/PhysRevLett.97.195002.
Gustavsson, B., M. Rietveld, N. Ivchenko, and M. Kosch (2010), Rise and fall of electron temperatures: Ohmic heating of ionospheric electronsfrom underdense HF radio wave pumping, J. Geophys. Res., 115, A12332, doi:10.1029/2010JA015873.
Guzdar, P., P. Chaturvedi, K. Papadopoulos, and S. Ossakow (1998), The thermal self-focussing instability near the critical surface in thehigh-latitude ionosphere, J. Geophys. Res., 103, 2231–2237.
Huang, J., and S. Kuo (1994), A theoretical model for the broad upshifted maximum in the stimulated electromagnetic emission spectrum,J. Geophys. Res., 99, 19,569–19,576.
Huang, J., and S. P. Kuo (1995), A generation mechanism for the downshifted peak in stimulated electromagnetic emission spectrum,J. Geophys. Res., 100, 21,433–21,438, doi:10.1029/95JA02302.
Hussein, A., W. Scales, and J. Huang (1998), Theoretical and simulation studies of broad up-shifted sideband generation in ionosphericstimulated radiation, Geophys. Res. Lett., 25, 955–958.
Hysell, D., and E. Nossa (2009), Artificial E-region field-aligned plasma irregularities generated at pump frequencies near the second electrongyroharmonic, Ann. Geophys., 27, 2711–2720.
Hysell, D., R. Miceli, E. Kendall, N. Schlatter, R. Varney, B. Watkins, T. Pedersen, P. Bernhardt, and J. Huba (2014), Heater-induced ionizationinferred from spectrometric airglow measurements, J. Geophys. Res. Space Physics, 119, 2038–2045, doi:10.1002/2013JA019663.
Isham, B., T. Hagfors, E. Mishin, M. Rietveld, C. LaHoz, W. Kofman, and T. Leyser (1999), A search for the location of the HF excitation ofenhanced ion acoustic and Langmuir waves with EISCAT and the Tromsø heater, Radiophys. Quantum Electron., 42, 607–618.
Istomin, Y., and T. Leyser (1995), Parametric decay of an electromagnetic wave near electron cyclotron harmonics, Phys. Plasmas, 2,2084–2097.
Kadomtsev, B. (1965), Plasma Turbulence, Academic, San Diego, Calif.Kosch, M., T. Rietveld, T. Hagfors, and T. Leyser (2000), High-latitude HF-induced airglow displaced equatorwards of the pump beam,
Geophys. Res. Lett., 27, 2817–2820, doi:10.1029/2000GL003754.Kosch, M., M. Rietveld, A. Senior, I. McCrea, A. Kavanagh, B. Isham, and F. Honary (2004), Novel artificial optical annular structures in the high
latitude ionosphere, Geophys. Res. Lett., 31, L12805, doi:10.1029/2004GL019713.Kosch, M., T. Pedersen, J. Hughes, R. Marshall, E. Gerken, A. Senior, D. Sentman, M. McCarrick, and F. Djuth (2005), Artificial optical emissions
at HAARP for pump frequencies near the third and second gyroharmonic, Ann. Geophys., 23, 1585–1592.Kosch, M., T. Pedersen, E. Mishin, S. Oyama, J. Hughes, A. Senior, B. Watkins, and B. Bristow (2007a), Coordinated optical and radar
observations of ionospheric pumping for a frequency pass through the second electron gyroharmonic at HAARP, J. Geophys. Res.,112, A06325, doi:10.1029/2006JA012146.
Kosch, M., T. Pedersen, E. Mishin, M. Starks, E. Gerken-Kendall, D. Sentman, S. Oyama, and B. Watkins (2007b), Temporal evolution of pumpbeam self-focusing at the high-frequency active auroral research program, J. Geophys. Res., 112, A08304, doi:10.1029/2007JA012264.
Kosch, M., Y. Ogawa, M. Rietveld, S. Nozawa, and R. Fujii (2010), An analysis of pump-induced artificial ionospheric ion upwelling at EISCAT,J. Geophys. Res., 115, A12317, doi:10.1029/2010JA015854.
Kuo, S. (2003), Parametric excitation of lower hybrid waves by electron plasma waves, Phys. Lett. A, 307, 244–248.Kuo, S. (2015), Ionospheric modifications in high frequency heating experiments, Phys. Plasmas, 22, 012901, doi:10.1063/1.4905519.Kuo, S., M. Lee, and P. Kossey (1997), Excitation of oscillating two-stream instability by upper hybrid pump in ionospheric heating
experiments at Tromsø, Geophys. Res. Lett., 24, 2969–2972.Lehtinen, N., and U. Inan (2008), Radiation of ELF/VLF waves by harmonically varying currents into a stratified ionosphere with application
to radiation by a modulated electrojet, J. Geophys. Res., 113, A06301, doi:10.1029/2007JA012911.Leyser, T. B. (2001), Stimulated electromagnetic emissions by high-frequency electromagnetic pumping of the ionospheric plasma, Space
Sci. Rev., 98, 223–328, doi:10.1023/A:1013875603938.Macmillan, S., et al. (2003), The 9th-generation international geomagnetic reference field, Geophys. J. Int., 155, 1051–1056,
doi:10.1111/j.1365-246X.2003.02102.x.Mahmoudian, A., W. Scales, P. Bernhardt, A. Samimi, E. Kendall, J. Ruohoniemi, B. Isham, O. Vega-Cancel, and M. Bordikar (2013), Ion
gyro-harmonic structuring in the stimulated radiation spectrum and optical emissions during electron gyro-harmonic heating,J. Geophys. Res. Space Physics, 118, 1270–1287, doi:10.1002/jgra.50167.
Majeed, T., and D. J. Strickland (1997), New survey of electron impact cross sections for photoelectron and auroral electron energy losscalculations, J. Phys. Chem. Ref. Data, 26, 335–349.
MISHIN ET AL. ARTIFICIAL PLASMA LAYERS 26
Journal of Geophysical Research: Space Physics 10.1002/2015JA021823
Milikh, G., E. Mishin, I. Galkin, A. Vartanyan, C. Roth, and B. Reinisch (2010), Ion outflows and artificial ducts in the topside ionosphere atHAARP, Geophys. Res. Lett., 37, L18102, doi:10.1029/2010GL044636.
Mishin, E. (1974), Heat transport in the solar wind, Astrophys. Space Sci., 27, 367–382.Mishin, E., and V. Fiala (1995), Radiation of whistlers by the ion-acoustic turbulence in the ionosphere, J.Geophys. Res., 100, 19,695–19,700.Mishin, E., and T. Pedersen (2011), Ionizing wave via high-power HF acceleration, Geophys. Res. Lett., 38, L01105, doi:10.1029/2010GL046045.Mishin, E., and K. Schlegel (1994), On incoherent-scatter plasma lines in aurora, J. Geophys. Res., 99, 11,391–11,399.Mishin, E., and V. Telegin (1986), Spectrum of suprathermal electrons in the auroral plasma, Sov. J. Plasma Phys., 12, 509–511.Mishin, E., H. Carlson, and T. Hagfors (2000), On the electron distribution function in the F region and airglow enhancements during HF
modification experiments, Geophys. Res. Lett., 27, 2857–2860.Mishin, E., T. Hagfors, and B. Isham (2001), A generation mechanism for topside enhanced incoherent backscatter during high frequency
modification experiments in Tromsø, Geophys. Res. Lett., 28, 479–482.Mishin, E., W. Burke, and T. Pedersen (2004), On the onset of HF-induced airglow at magnetic zenith, J. Geophys. Res., 109, A02305,
doi:10.1029/2003JA010205.Mishin, E., M. Kosch, T. Pedersen, and W. Burke (2005a), HF-induced airglow at magnetic zenith: Coexistence of the thermal and parametric
instabilities near electron gyroharmonics, Geophys. Res. Lett., 32, L23106, doi:10.1029/2005GL023864.Mishin, E., W. Burke, and T. Pedersen (2005b), HF-induced airglow at magnetic zenith: Theoretical considerations, Ann. Geophys., 23, 47–53.Mjølhus, E. (1990), On linear conversion in a magnetized plasma, Radio Sci., 25, 1321–1339.Mjølhus, E. (1993), On the small scale striation effect in ionospheric radio modification experiments near harmonics of the electron gyro
frequency, J. Atmos. Terr. Phys., 55, 907–918.Mjølhus, E., E. Helmersen, and D. DuBois (2003), Geometric aspects of HF driven Langmuir turbulence in the ionosphere, Nonlinear Processes
Geophys., 10, 151–177.Musher, S. L., A. M. Rubenchik, and B. I. Sturman (1978), Collective effects associated with lower hybrid heating of plasma, Plasma Phys., 20,
1131–1150.Mutiso, C., J. Hughes, G. Sivjee, T. Pedersen, B. Gustavsson, and M. Kosch (2008), Previously unreported optical emissions generated during
ionospheric heating, Geophys. Res. Lett., 35, L14103, doi:10.1029/2008GL034563.Oyama, S., B. Watkins, F. Djuth, M. Kosch, P. Bernhardt, and C. Heinselman (2006), Persistent enhancement of the HF pump-induced plasma
line measured with a UHF diagnostic radar at HAARP, J. Geophys. Res., 111, A06309, doi:10.1029/2005JA011363.Oyama, S., and B. Watkins (2007), Aspect angle dependency of the HF modification measured with MUIR at HAARP, Eos Trans. AGU, 88(52),
Fall Meet. Suppl., Abstract SA11A–0294.Pedersen, T., M. McCarrick, E. Gerken, C. Selcher, D. Sentman, H. Carlson, and A. Gurevich (2003), Magnetic zenith enhancement of HF
radio-induced airglow production at HAARP, Geophys. Res. Lett., 30(4), 1169–1172, doi:10.1029/2002GL016096.Pedersen, T., B. Gustavsson, E. Mishin, E. MacKenzie, H. C. Carlson, M. Starks, and T. Mills (2009), Optical ring formation and ionization
production in high-power HF heating experiments at HAARP, Geophys. Res. Lett., 36, L18107, doi:10.1029/2009GL040047.Pedersen, T., B. Gustavsson, E. Mishin, E. Kendall, T. Mills, H. C. Carlson, and A. L. Snyder (2010), Creation of artificial ionospheric layers using
high-power HF waves, Geophys. Res. Lett., 37, L02106, doi:10.1029/2009GL041895.Pedersen, T., M. McCarrick, B. Reinisch, B. Watkins, R. Hamel, V. Paznukhov (2011), Production of artificial ionospheric layers by frequency
sweeping near the 2nd gyroharmonic, Ann. Geophys., 29, 47–47, doi:10.5194/angeo-29-47-2011.Rietveld, M., M. Kosch, N. Blagoveshchenskaya, V. Kornienko, T. Leyser, and T. Yeoman (2003), Ionospheric electron heating, optical
emissions and striations induced by powerful HF radio waves at high latitudes: Aspect angle dependence, J. Geophys. Res.,108(A4), 1141, doi:10.1029/2002JA009543.
Robinson, T. (1989), The heating of the high latitude ionosphere by high-power radio waves, Phys. Rep., 179, 79–209.Robinson, P. (1997), Nonlinear wave collapse and strong turbulence, Rev. Mod. Phys., 69, 507–573.Rosenbluth, M., and N. Rostoker (1962), Scattering of electromagnetic waves by a nonequilibrium plasma, Phys. Fluids, 5, 776–788.Sagdeev, R. (1979), The 1976 Oppenheimer lectures: Critical problems in plasma astrophysics, Rev. Mod. Phys., 51, 1–20.Samimi, A., W. A. Scales, P. A. Bernhardt, S. J. Briczinski, and M. J. McCarrick (2013), Ion gyroharmonic structures in stimulated radiation
during second electron gyroharmonic heating: 1. Theory, J. Geophys. Res. Space Physics, 118, 502–514, doi:10.1029/2012JA018146.Samimi, A., W. A. Scales, P. A. Bernhardt, S. J. Briczinski, and M. J. McCarrick (2014), Ion gyroharmonic structures in stimulated radiation
during second electron gyroharmonic heating: 2. Simulations, J. Geophys. Res. Space Physics, 119, 462–478, doi:10.1002/2013JA019341.Senior, A., N. D. Borisov, M. J. Kosch, T. K. Yeoman, F. Honary, and M. T. Rietveld (2004), Multi-frequency HF radar measurements of artificial
F-region field-aligned irregularities, Ann. Geophys., 22, 3503–3511.Sergeev, E., S. Grach, A. Shindin, E. Mishin, P. Bernhardt, S. Briczinski, B. Isham, M. Broughton, J. LaBelle, and B. Watkins (2013), Artificial
ionospheric layers during pump frequency stepping near the 4th gyroharmonic at HAARP, Phys. Rev. Lett., 110, 065002.Shapiro, V., and V. Shevchenko (1984), Strong turbulence of plasma oscillations, in Basic Plasma Physics, vol. 2, edited by A. Galeev and
R. Sudan, pp. 123–182, New York, North-Holland.Starodubtsev, M., V. Nazarov, and A. Kostrov (2007), Laboratory study of nonlinear trapping of magnetized Langmuir waves inside a density
depletion, Phys. Rev. Lett., 98, 195001, doi:10.1103/PhysRevLett.98.195001.Stubbe, P., H. Kohl, and M. T. Rietveld (1992), Langmuir turbulence and ionospheric modification, J. Geophys. Res., 97, 6285–6297.Stubbe, P., A. J. Stocker, F. Honary, T. R. Robinson, and T. B. Jones (1994), Stimulated electromagnetic emissions (SEE) and anomalous HF
wave absorption near electron gyroharmonics, J. Geophys. Res., 99, 6233–6246.Stubbe, P., H. Kopka, B. Thidé, and H. Derblom (1984), Stimulated electromagnetic emission: A new technique to study the parametric decay
instability in the ionosphere, J. Geophys. Res., 89, 7523–7536.Stubbe, P. (1996), Review of ionospheric modification experiments at Tromsø, J. Atmos. Terr. Phys., 58, 349–368.Thidé, B., H. Kopka, and P. Stubbe (1982), Observations of stimulated scattering of a strong high frequency radio wave in the ionosphere,
Phys. Rev. Lett., 49, 1561–1564, doi:10.1103/PhysRevLett.49.1561.Thidé, B., E. N. Sergeev, S. M. Grach, T. B. Leyser, and T. D. Carozzi (2005), Competition between Langmuir and upper-hybrid turbulence in a
high-frequency-pumped ionosphere, Phys. Rev. Lett., 95, 255002, doi:10.1103/PhysRevLett.95.255002.Vaskov, V., and A. Gurevich (1977), Resonance instability of small-scale plasma perturbations, Sov. Phys. JETP, 46, 487–494.Volokitin, A., and E. Mishin (1979), Relaxation of an electron beam in a plasma with infrequent collisions, Sov. J. Plasma Phys, 5, 654–656.Volokitin, A., and E. Mishin (1995), Theory of incoherent scattering in a weakly turbulent ionospheric plasma, Radiophys. Quantum Electron.,
38, 359–363, doi:10.1007/BF01037768.Vuthaluru, R., R. A. Vincent, D. A. Holdsworth, and I. M. Reid (2002), Collision frequencies in the D-region, J. Atmos. Sol. Terr. Phys., 64,
2043–2054, doi:10.1016/S1364-6826(02)00220-1.
MISHIN ET AL. ARTIFICIAL PLASMA LAYERS 27

Journal of Geophysical Research: Space Physics 10.1002/2015JA021823
Wang, J., D. Newman, and M. Goldman (1997), Vlasov simulations of electron heating by Langmuir turbulence near the critical altitude inthe radiation-modified ionosphere, J. Atmos. Sol. Terr. Phys., 59, 2461–2474, doi:10.1016/S1364-6826(96)00140-X.
Zakharov, V. (1984), Collapse and self-focusing of Langmuir waves, in Basic Plasma Physics, vol. 2, edited by A. Galeev and R. Sudan,pp. 81–121, North-Holland, New York.
Zhou, H. L., J. Huang, and S. P. Kuo (1994), Cascading of the upper hybrid/electron Bernstein wave in ionospheric heating experiments,Phys. Plasmas, 1, 3044–3052.
MISHIN ET AL. ARTIFICIAL PLASMA LAYERS 28