mis titles - مقاله erp , مقاله bpm , مقاله ...abedinionline.com/docs/concept...
TRANSCRIPT

mis titlesLook for these other popular course technology
Management Information
Systems, Sixth Edition
by Effy Oz
ISBN 13: 978-1-4239-0178-5 ISBN 10: 1-4239-0178-9
Information Technology Project
Management, Fifth Edition
by Kathy Schwalbe
ISBN 13: 978-1-4239-0145-7 ISBN 10: 1-4239-0145-2
View our entire collection of products online at www.course.com/mis.
Introduction to Project
Management, Second Edition
by Kathy Schwalbe
ISBN 13: 978-1-4239-0220-1 ISBN 10: 1-4239-0220-3
Information Technology in Theory
by Pelin Aksoy and Laura DeNardis
ISBN 13: 978-1-4239-0140-2 ISBN 10: 1-4239-0140-1
Problem-Solving Cases with
Microsoft Access and Excel,
Sixth Edition
by Joseph Brady and Ellen Monk
ISBN 13: 978-1-4239-0213-3 ISBN 10: 1-4239-0213-0
Database Systems: Design,
Implementation, and
Management, Eighth Edition
by Peter Rob and Carlos Coronel
ISBN 13: 978-1-4239-0201-0 ISBN 10: 1-4239-0201-7
C O N C E P T S I N E N T E R P R I S E
R E S O U R C E P L A N N I N G
Third Edition

This page intentionally left blank
C O N C E P T S I N E N T E R P R I S E
R E S O U R C E P L A N N I N G
Third Edition
Ellen F. MonkUniversity of Delaware
Bret J. WagnerWestern Michigan University
Australia • Brazil • Japan • Korea • Mexico • Singapore • Spain • United Kingdom • United States

Concepts in Enterprise Resource Planning,
Third Edition
by Ellen F. Monk and Bret J. Wagner
VP/Editorial Director: Jack W. Calhoun
Editor-in-Chief: Alex von Rosenberg
Senior Acquisitions Editor: CharlesMcCormick, Jr.
Product Manager: Tricia Coia, Kate Hennessy
Development Editor: Amanda Brodkin
Content Project Manager: Aimee Poirier
Manufacturing Coordinator: Justin Palmeiro
Marketing Manager: Bryant Chrzan
Editorial Assistant: Bryn Lathrop
Cover Designer: Laura Rickenbach
Cover Photo® 2007 JupiterimagesCorporation
Compositor: GEX Publishing Services
® 2009 Course Technology Cengage Learning
ALL RIGHTS RESERVED. No part of this work covered by the copyrighthereon may be reproduced, transmitted, stored, or used in any form or byany means graphic, electronic, or mechanical, including but not limited tophotocopying, recording, scanning, digitizing, taping, Web distribution,information networks, or information storage and retrieval systems, exceptas permitted under Section 107 or 108 of the 1976 United States CopyrightAct, without the prior written permission of the publisher.
For product information and technology assistance, contact us atCengage Learning Academic Resource Center, 1-800-423-0563
For permission to use material from this text or product,submit all requests online at www.cengage.com/permissions
Further permission questions can be emailed [email protected]
ISBN-13: 978-1-4239-0179-2ISBN-10: 1-4239-0179-7
Course Technology Cengage Learning
25 Thomson PlaceBoston, Massachusetts, 02210USA
Cengage Learning products are represented in Canada by NelsonEducation, Ltd.
For your lifelong learning solutions, visit course.cengage.com
Visit our corporate website at www.cengage.com
SAP is a registered trademark.
Printed in the United States of America
1 2 3 4 5 6 7 8 9 TW 12 11 10 09 08

In memory of our colleague Majdi Najm. His support and friendship are sorely missed.

This page intentionally left blank
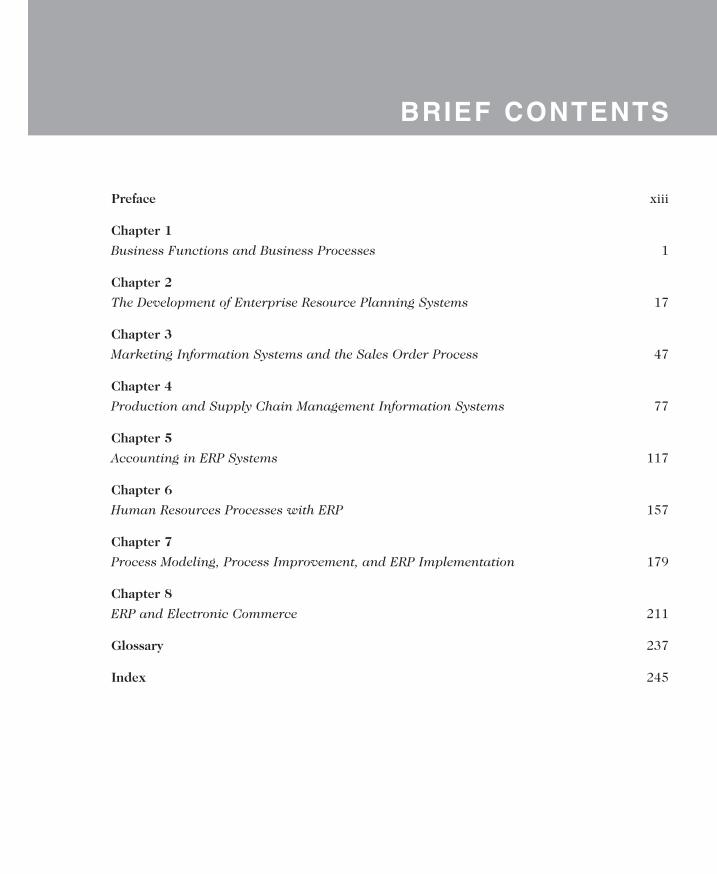
BRIEF CONTENTS
zzzPreface xiii
Chapter 1
Business Functions and Business Processes 1
Chapter 2
The Development of Enterprise Resource Planning Systems 17
Chapter 3
Marketing Information Systems and the Sales Order Process 47
Chapter 4
Production and Supply Chain Management Information Systems 77
Chapter 5
Accounting in ERP Systems 117
Chapter 6
Human Resources Processes with ERP 157
Chapter 7
Process Modeling, Process Improvement, and ERP Implementation 179
Chapter 8
ERP and Electronic Commerce 211
Glossary 237
Index 245

This page intentionally left blank

TABLE OF CONTENTS
Preface xiii
Chapter 1 Business Functions and Business Processes 1Functional Areas and Business Processes 2
Functional Areas of Operation 2Business Processes 3
Functional Areas and Business Processes of a Very Small Business 6Marketing and Sales 6Supply Chain Management 7Accounting and Finance 7Human Resources 8
Functional Area Information Systems 8Marketing and Sales 8Supply Chain Management 9Accounting and Finance 11Human Resources 13
Chapter Summary 15Key Terms 15Exercises 15For Further Study and Research 16
Chapter 2 The Development of Enterprise Resource Planning Systems 17The Evolution of Information Systems 18
Computer Hardware and Software Development 19Early Attempts to Share Resources 20The Manufacturing Roots of ERP 20Management’s Impetus to Adopt ERP 21
ERP Software Emerges: SAP and R/3 23SAP Begins Developing Software Modules 24SAP R/3 24New Directions in ERP 25SAP ERP Software Implementation 29
ERP for Midsized Companies 32Responses of the Software to the Changing Market 32
Choosing Consultants and Vendors 33The Significance and Benefits of ERP Software and Systems 33Questions About ERP 34
How Much Does an ERP System Cost? 34Should Every Business Buy an ERP Package? 34Is ERP Software Inflexible? 35What Return Can a Company Expect from Its ERP Investment? 35How Long Does It Take to See a Return on an ERP Investment? 36Why Do Some Companies Have More Success with ERP Than Others? 37
The Continuing Evolution of ERP 39Additional Capabilities Within ERP 41The Internet 41

Chapter Summary 43Key Terms 43Exercises 44For Further Study and Research 44
Chapter 3 Marketing Information Systems and the Sales Order Process 47Overview of Fitter Snacker 48Problems with Fitter Snacker’s Sales Process 49
Sales Quotations and Orders 50Order Filling 51Accounting and Invoicing 53Payment and Returns 53
Sales and Distribution in ERP 54Pre-Sales Activities 54Sales Order Processing 54Inventory Sourcing 55Delivery 55Billing 55Payment 55
A Standard Order in SAP ERP 56Taking an Order in SAP ERP 56Discount Pricing in SAP ERP 62Integration of Sales and Accounting 64
Customer Relationship Management 65Core CRM Activities 66SAP’s CRM Software 66The Benefits of CRM 71
Chapter Summary 73Key Terms 73Exercises 74For Further Study and Research 75
Chapter 4 Production and Supply Chain Management Information Systems 77Production Overview 78
Fitter Snacker’s Manufacturing Process 79Fitter Snacker’s Production Problems 80
The Production Planning Process 82The SAP ERP Approach to Production Planning 83Sales Forecasting 84Sales and Operations Planning 85Demand Management 95Materials Requirements Planning (MRP) 96Materials Requirements Planning in SAP ERP 100Detailed Scheduling 104Providing Production Data to Accounting 105
ERP and Suppliers 107The Traditional Supply Chain 108The Measures of Success 110
Chapter Summary 114Key Terms 114Exercises 114For Further Study and Research 115
x Concepts in Enterprise Resource Planning, Third Edition

Chapter 5 Accounting in ERP Systems 117Accounting Activities 118
Using ERP for Accounting Information 121Operational Decision-Making Problem: Credit Management 122
Industrial Credit Management 122Fitter Snacker’s Credit Management Procedures 124Credit Management in SAP ERP 124
Product Profitability Analysis 127Inconsistent Recordkeeping 127Inaccurate Inventory Costing Systems 128Companies with Subsidiaries 133
Management Reporting with ERP Systems 136Document Flow for Customer Service 136Built-In Management-Reporting and Analysis Tools 137
The Enron Collapse 138Outcome of the Enron Scandal 140Key Features of the Sarbanes-Oxley Act 140
Implications of the Sarbanes-Oxley Act for ERP Systems 141Archiving 142User Authorizations 144Tolerance Groups 145Financial Transparency 146
Chapter Summary 149Key Terms 149Exercises 150For Further Study and Research 154
Chapter 6 Human Resources Processes with ERP 157Problems with Fitter Snacker’s Human Resources Processes 159
Recruiting Process 159The Interviewing and Hiring Process 160Human Resources Duties After Hiring 162
Human Resources with ERP Software 165Advanced SAP ERP Human Resources Features 170
Time Management 170Payroll 170Travel Management 171Training and Development 172
Additional Human Resources Features of SAP ERP 174Mobile Time Management 174Management of Family and Medical Leave 174Domestic Partner Handling 174Administration of Long-Term Incentives 175Personnel Cost Planning 175Management and Payroll for Global Employees 175Management by Objectives 175
Chapter Summary 176Key Terms 176Exercises 176For Further Study and Research 177
Table of Contents xi

Chapter 7 Process Modeling, Process Improvement, and ERP Implementation 179Process Modeling 180
Flowcharting Process Models 180Fitter Snacker Expense Report Process 181Extensions of Process Mapping 183Event Process Chain (EPC) Diagrams 184
Process Improvement 192Evaluating Process Improvement 193
ERP Workflow Tools 195Implementing ERP Systems 198
ERP System Costs and Benefits 200Implementation and Change Management 201
Implementation Tools 201System Landscape Concept 204
Chapter Summary 206Key Terms 206Exercises 206For Further Study and Research 210
Chapter 8 ERP and Electronic Commerce 211Electronic Commerce Background 212
Business-to-Business E-Commerce 212E-Commerce and ERP 215
Fitter Snacker and E-Commerce 216Using ERP Through an Application Service Provider 217
Application Service Providers 217NetWeaver 224
NetWeaver Tools and Capabilities 224NetWeaver at Work for Fitter Snacker 227
Duet 228Accessing ERP Systems Over the Internet 228XML 228Radio Frequency Identification Technology 230Chapter Summary 233Key Terms 233Exercises 234For Further Study and Research 234
Glossary 237
Index 245
xii Concepts in Enterprise Resource Planning, Third Edition

PREFACE
This is a book about Enterprise Resource Planning (ERP) systems; it’s also about how a businessworks and how information systems fit into business operations. More specifically, it’s about look-ing at the processes that make up a business enterprise and seeing how ERP software can improvethe performance of these business processes. ERP software is complicated and expensive. Unless acompany uses it to become more efficient and effective in delivering goods and services to its cus-tomers, the ERP system will only be a drain on company resources.
Prior to writing this book, our experience revealed that undergraduate business students don’talways understand how businesses operate, and advanced undergraduate students and even manyMBA students do not truly grasp the problems inherent in unintegrated systems. These studentsalso do not comprehend business processes and how different functional areas must worktogether to achieve company goals. As a result, students do not understand how an informationsystem should help business managers make decisions.
Consequently, we set out to write a book that does the following:
● Describes basic business functional areas and explains how they are related.
● Illustrates how unintegrated information systems fail to support business functionsand business processes that cut across functional area boundaries.
● Demonstrates how integrated information systems can help a company prosper byimproving business processes and by providing business managers with accurate,consistent, and current data.
We have found that our focus on business processes has been well received.
The Approach of This BookA key feature of our book is the use of the fictitious Fitter Snacker Company, a manufacturer ofnutritious snack bars, as an illustrative example throughout the book. We show how Fitter Snack-er’s somewhat primitive and unintegrated information systems cause operational problems. Weintentionally made the systems’ problems easy to understand, so the student could readily com-prehend them. Potential solutions for solving integration problems are illustrated using SAP’s ERPsoftware.
The third edition of Concepts in Enterprise Resource Management reflects the current stateof the ERP software market, while adding updated examples of how companies are using inte-grated systems to solve business problems and achieve greater success. The book has eightchapters:
● Chapter 1 explains the purposes for, and information systems requirements of, mainbusiness functional areas—Marketing and Sales, Supply Chain Management, Account-ing and Finance, and Human Resources. This chapter also describes how a businessprocess cuts across the activities within business functional areas and why managersneed to think about making business processes work.
● Chapter 2 provides a short history of business computing and thedevelopments that led to today’s ERP systems. Chapter 2 concludes with anoverview of ERP issues and an introduction to the SAP ERP software.
● Chapter 3 describes the Marketing and Sales functional area, and it highlightsthe problems that arise with unintegrated information systems. To make con-cepts easy to understand, the Fitter Snacker running example is introduced.After explaining FS’s problems with its unintegrated systems, we show howERP can avoid these problems. SAP ERP screens are used to illustrate theconcepts. Because using ERP can naturally lead a company into ever-broadening integration, a discussion of customer-relationship management(CRM) concludes the chapter.
● Chapter 4 describes how ERP systems support Supply ChainManagement—the coordinated activities of all the organizations involved inconverting raw materials into consumer products on the retail shelf. As inChapter 3, the problems caused by Fitter Snacker’s unintegrated informationsystem are explored, followed by a discussion of how ERP software could helpsolve these problems.
● Chapter 5 describes Accounting and ERP systems. This chapter clearly distin-guishes between financial accounting (FI) and managerial accounting (CO)issues. Included is an overview of the Enron collapse and the resultingSarbanes-Oxley act along with the act’s impact on information systems, spe-cifically management controls and audit capabilities.
● Chapter 6 covers Human Resource Management. While the Human Resourcesoftware is the least integrated component of all ERP systems, it includesnumerous processes that are critical to a company’s success, including strate-gic issues like succession planning.
● Chapter 7 covers Process Modeling, Process Improvement, and ERPImplementation. The chapter first presents flowcharting basics using a mini-mum number of symbols, followed by the highly structured EPC processmodel. Implementation issues conclude the chapter. We believe that processimprovement, not large-scale implementation, should be the focus in an intro-ductory ERP course.
● Chapter 8 covers ERP and electronic commerce. Because this is a broad andrapidly changing area, we have chosen to provide this chapter as an introduc-tion, rather than an exhaustive treatment of the subjects. This chapter pro-vides an overview of topics such as electronic commerce and applicationservice providers, SAP NetWeaver, and the emerging technology of RFIDs.
xiv Concepts in Enterprise Resource Planning, Third Edition

How Can You Use This Book?This third edition continues our goal of keeping the text at an introductory level. The bookcan be used in a number of ways:
● The book, or selected chapters, could be used for a three-week ERP treatmentin undergraduate Management Information Systems, Accounting InformationSystems, or Operations Management courses.
● Similarly, the book or selected chapters could be used in MBA courses, such asfoundation Information Systems or Operations Management courses. Althoughthe concepts presented here are basic, the astute instructor can build on themwith more sophisticated material to challenge the advanced MBA student.Many of the exercises in the book require research for their solution, and theMBA student could do these in some depth.
● The book could serve as an introductory text in a course devoted wholly toERP. It would provide the student with a basis in how ERP systems help com-panies to integrate different business functions. The instructor might useChapter 8 as the starting point for teaching the higher-level strategic implica-tions of ERP and related topics. The instructor can pursue these and relatedtopics using his or her own resources, such as case studies and currentarticles.
● Because of the focus on fundamental business issues and business processes,the book can also be used in a sophomore-level Introduction to Businesscourse.
Except for a computer literacy course, we assume no particular educational or busi-ness background. Chapters 1 and 2 lay out most of the needed business and computinggroundwork, and the rest of the chapters build on that base.
Features of This TextTo bring ERP concepts to life (and down to earth!) this book uses sales, manufacturing,purchasing, human resources, and accounting examples for the Fitter Snacker company.Thus, the student can see problems, not just at an abstract level, but within the context ofa company’s operations. We believe that this approach makes business problems and therole ERP can play in solving them easier to understand.
The book’s exercises have the student analyze aspects of Fitter Snacker’s informationsystems in various ways. The exercises vary in their difficulty; some can be solved in astraightforward way, and others require some research. Not all exercises need to beassigned. This gives the instructor flexibility in choosing which concepts to emphasize andhow to assess students’ knowledge. Some exercises explore FS’s problems, and some askthe student to go beyond what is taught in the book and to research a subject. A solutionmight require the student to generate a spreadsheet, perform calculations, documenthigher-level reasoning, present the results of research in writing, or participate in a debate.
The book includes an additional element designed to bring ERP concepts to life:Another Look features, which are short, detailed case studies that focus on problems facedby real-world companies. Some of these cases include interviews with information systemsmanagers who share their experiences with ERP.
Preface xv
We have illustrated ERP concepts and applications by showing how SAP ERP wouldhandle the problems discussed in the book. Screen shots of key SAP ERP tools are shownthroughout to illustrate ERP concepts. Many of the book’s exercises ask the student tothink about how a problem would be addressed using ERP software.
Instructor MaterialsThe following supplemental materials are available when this book is used in a classroomsetting. All of the teaching tools available with this book are provided to the instructor on asingle CD-ROM. Most can also be found online at www.course.com. Instructor materials arepassword-protected.
● Electronic Instructor’s Manual—The Instructor’s Manual assists in class prepa-ration by providing suggestions and strategies for teaching the text, chapteroutlines, technical notes, quick quizzes, discussion topics, and key terms.
● Solutions—Answers to end-of-chapter questions and exercises are provided.
● Sample syllabi—The sample syllabi and course outlines are provided as a foun-dation to begin planning and organizing your course.
● ExamView Test Bank—ExamView allows instructors to create and administerprinted, computer (LAN-based), and Internet exams. The Test Bank includeshundreds of questions that correspond to the topics covered in this text,enabling students to generate detailed study guides that include page refer-ences for further review. The computer-based and Internet testing componentsallow students to take exams at their computers, and also save the instructortime by grading each exam automatically. The Test Bank is also available inBlackboard and WebCT versions posted online at www.course.com.
● PowerPoint Presentations—Microsoft PowerPoint slides for each chapter areincluded as a teaching aid for classroom presentation, to make available to stu-dents on the network for chapter review, or to be printed for classroomdistribution. Instructors can add their own slides for additional topics theyintroduce to the class.
● Distance learning—Course Technology is proud to present online test banks inWebCT and Blackboard to provide the most complete and dynamic learningexperience possible. Instructors are encouraged to make the most of thecourse, both online and offline. For more information on how to access theonline test bank, contact your local Course Technology sales representative.
● Figure Files—Figure and table files from each chapter are provided for youruse in the classroom.
● Hands-on SAP exercises—Exercises are available for member institutionsthrough the SAP University Alliance. These exercises use a database that wasbuilt for the fictitious Fitter Snacker company.
xvi Concepts in Enterprise Resource Planning, Third Edition

A C K N O W L E D G M E N T S
Our thanks go out to our development editor, Amanda Brodkin, who learned how to work withauthors who occasionally use too much jargon and have trouble meeting deadlines, and pro-vided the critical eye that we needed to make our writing into what we imagined it was. Weare grateful for the support and guidance of the entire MIS team at Course Technology, par-ticularly managing editor Tricia Coia and production editor Aimee Poirier. We would not havebeen able to continue on our journey to understand ERP systems without the continued sup-port of SAP America through its University Alliance program. We appreciate the efforts ofAmelia Maurizio, Heather Czech Matthews and Doug Peebles. We also thank our reviewersSam Gill; San Francisco State University and Cindy Joy Marselis, Temple University, forinsightful comments that pointed to needed improvements. In addition, we thank our inter-viewees, Maureen Sullivan, Linda Somers, Ellen Lepine, John Wheeler, and Pat Ryan with hiscolleagues from DuPont, as well as Phil Straniero and Don Scott, for their time and frankness.And finally, we thank our students, whose honesty and desire to learn have inspired us.
Preface xvii

This page intentionally left blank

C H A P T E R 1BUSINESS FUNCTIONSAND BUSINESSPROCESSES
L E A R N I N G O B J E C T I V E S
After completing this chapter, you will be able to:
● Name the main functional areas of operation used in business.
● Differentiate a business process from a business function.
● Identify the kinds of data that each main functional area produces.
● Identify the kinds of data that each main functional area needs.
● Define integrated information systems and explain why they areimportant.
I N T R O D U C T I O N
Enterprise Resource Planning (ERP) programs are core software used by companies to coordinate
information in every area of the business. ERP (pronounced “E-R-P”) programs help to manage company-
wide business processes, using a common database and shared management reporting tools. A
business process is a collection of activities that takes one or more kinds of input and creates an output,
such as a report or forecast, that is of value to the customer. ERP software supports the efficient operation
of business processes by integrating throughout a business tasks related to sales, marketing, manufac-
turing, logistics, accounting, and staffing. In later chapters, you will learn how successful businesspeople
use ERP programs to improve how work is done within a company. This chapter provides a background
for learning about ERP software.
F U N C T I O N A L A R E A S A N D B U S I N E S SP R O C E S S E S
To understand ERP, you must first understand how a business works. Let’s begin by lookingat a business’s areas of operation. These areas, called functional areas of operation, arebroad categories of business activities.
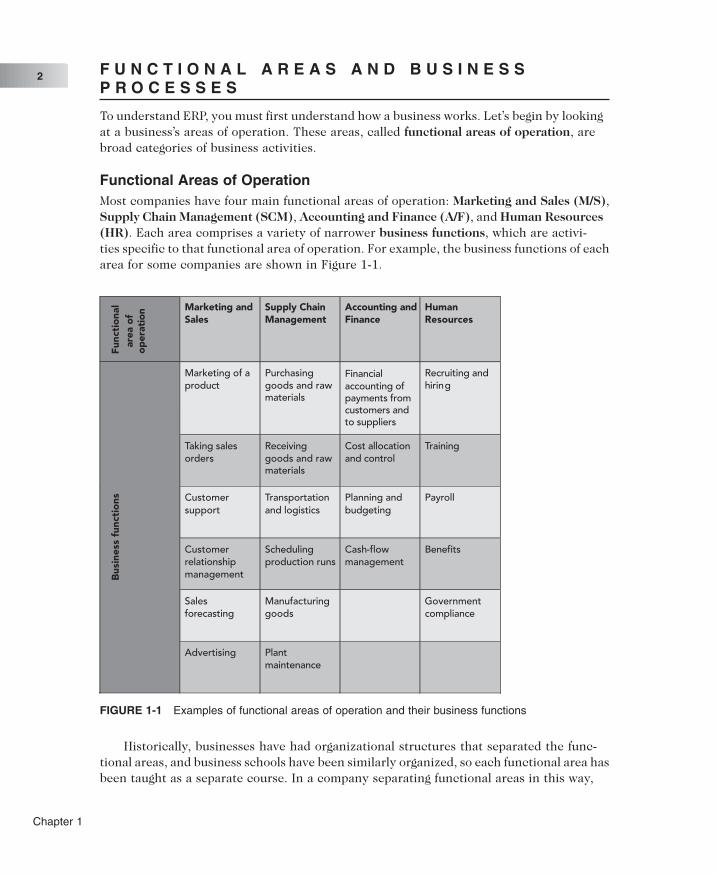
Functional Areas of OperationMost companies have four main functional areas of operation: Marketing and Sales (M/S),Supply Chain Management (SCM), Accounting and Finance (A/F), and Human Resources(HR). Each area comprises a variety of narrower business functions, which are activi-ties specific to that functional area of operation. For example, the business functions of eacharea for some companies are shown in Figure 1-1.
Historically, businesses have had organizational structures that separated the func-tional areas, and business schools have been similarly organized, so each functional area hasbeen taught as a separate course. In a company separating functional areas in this way,
Func
tio
nal
area
of
op
erat
ion Marketing and
SalesSupply ChainManagement
Accounting andFinance
HumanResources
Marketing of aproduct
Purchasinggoods and rawmaterials
Financialaccounting ofpayments fromcustomers andto suppliers
Recruiting andhiring
Taking salesorders
Receivinggoods and rawmaterials
Cost allocationand control
Training
Customersupport
Transportationand logistics
Planning andbudgeting
Payroll
Customerrelationshipmanagement
Schedulingproduction runs
Cash-flowmanagement
Benefits
Salesforecasting
Manufacturinggoods
Governmentcompliance
Bus
ines
sfu
ncti
ons
Advertising Plantmaintenance
FIGURE 1-1 Examples of functional areas of operation and their business functions
Chapter 1
2
Marketing and Sales might be completely isolated from Supply Chain Management, even thoughM/S sells what SCM procures and produces. Thus, you might conclude that what happens inone functional area is not closely related to what happens in others. As you will learn in thischapter, however, functional areas are interdependent, each requiring data from the others.The better a company can integrate the activities of each functional area, the more success-ful it will be in today’s highly competitive environment. Integration also contributes toimprovements in communication and workflow. Each area’s information system depends ondata from those of other functional areas. An information system (IS) includes the comput-ers, people, procedures, and software that store, organize, and deliver information. This chap-ter illustrates the need for information sharing between functional areas and the effects on thebusiness if this information is not integrated. You will also see examples of typical businessprocesses and how these processes routinely cross functional areas.
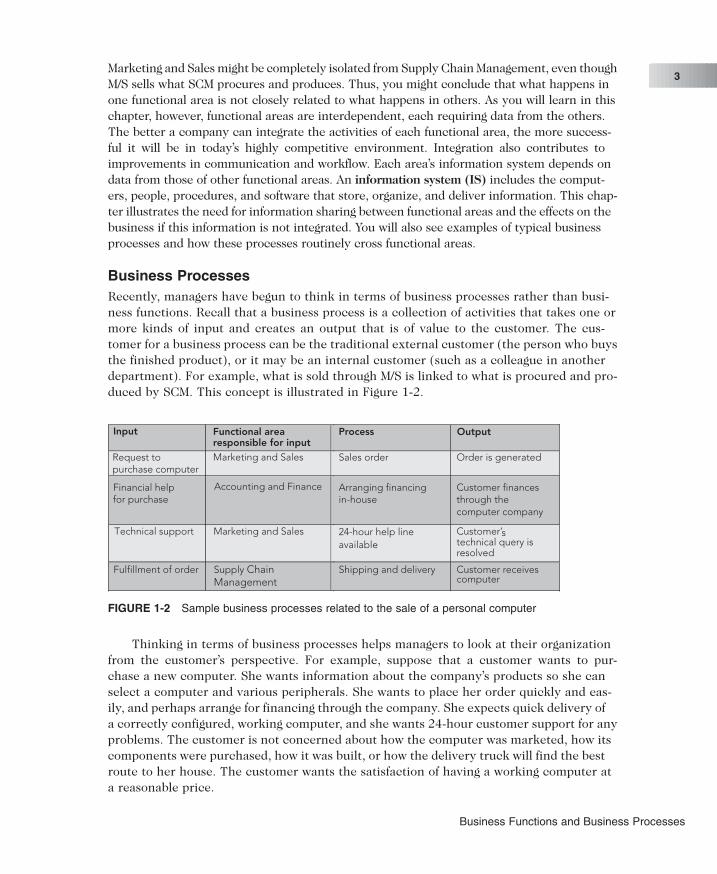
Business ProcessesRecently, managers have begun to think in terms of business processes rather than busi-ness functions. Recall that a business process is a collection of activities that takes one ormore kinds of input and creates an output that is of value to the customer. The cus-tomer for a business process can be the traditional external customer (the person who buysthe finished product), or it may be an internal customer (such as a colleague in anotherdepartment). For example, what is sold through M/S is linked to what is procured and pro-duced by SCM. This concept is illustrated in Figure 1-2.
Thinking in terms of business processes helps managers to look at their organizationfrom the customer’s perspective. For example, suppose that a customer wants to pur-chase a new computer. She wants information about the company’s products so she canselect a computer and various peripherals. She wants to place her order quickly and eas-ily, and perhaps arrange for financing through the company. She expects quick delivery ofa correctly configured, working computer, and she wants 24-hour customer support for anyproblems. The customer is not concerned about how the computer was marketed, how itscomponents were purchased, how it was built, or how the delivery truck will find the bestroute to her house. The customer wants the satisfaction of having a working computer ata reasonable price.
FIGURE 1-2 Sample business processes related to the sale of a personal computer
Business Functions and Business Processes
3

Businesses must always consider the customer’s viewpoint in any transaction. What is thedifference between a business function and a business process from the customer’s point ofview? Suppose the customer’s computer is damaged during shipment. Because only one func-tional area is involved in accepting the damaged item, receipt of the return is a business func-tion and is handled by the customer relationship management function of Marketing and Sales.Because several functional areas are involved in repair and return of the computer, the han-dling of the repair is a business process. Thus, the customer is dealing with many of the com-pany’s functional areas in her process of buying and obtaining a computer.
A successful customer interaction is one in which the customer (either internal orexternal) is not required to interact with each business function involved in the process.Successful business managers view their business operations from the perspective of asatisfied customer.
For the computer company to provide customer satisfaction, it must make sure thatits functional areas of operation are integrated. For example, computer technology changesrapidly, and the hardware the computer company sells changes frequently. In order to pro-vide customers with accurate information, people performing the sales function musthave up-to-date information about computer configurations; otherwise, a customer mightorder a computer that the company’s manufacturing plant no longer produces. People per-forming the manufacturing function need to get the details of a customer’s computer con-figuration quickly and accurately from the employees performing the sales function, so theright computer can be manufactured and shipped on time to the customer. If the cus-tomer is financing the computer through the computer company, then people perform-ing the sales order function must gather information about the customer and process itquickly, so financing can be approved in time to support shipping the computer.
Sharing data effectively and efficiently between and within functional areas leads tomore efficient business processes. Information systems can be designed so that functionalareas share data. These systems are called integrated information systems. Workingthrough this textbook will help you understand the benefits of integrated information sys-tems and the problems that can occur when information systems are not integrated. Fig-ure 1-3 illustrates the process view of business operations.
Customer Order Process
Sale
sFu
ncti
on
Acc
oun
ting
Func
tio
n
Pur
chas
ing
Func
tio
n
Pro
duc
tio
nFu
ncti
on
Log
isti
csFu
ncti
on
Material Order Process
FIGURE 1-3 A process view of business
Chapter 1
4

Businesses take inputs (resources) in the form of material, people, and equipment, andtransform these inputs into goods and services for customers. Managing these inputs andthe business processes effectively requires accurate and up-to-date information. Forexample, the sales function takes a customer’s order, and the production function sched-ules the manufacturing of the product. Logistics employees schedule and carry out the deliv-ery of the product. If raw materials are needed to make the product, production promptspurchasing to arrange for their purchase and delivery. In that case, logistics will receive thematerial, verify its condition to accounting so that the vendor can be paid, and deliver thegoods to production. Throughout, accounting keeps appropriate transaction records.
A N O T H E R L O O K
Integrated Information Systems
Integration of information is essential for company efficiency. Although people in organi-zations are often bombarded with too much information, it can still be challenging to getthe correct information to the department that needs it. The appliance giant WhirlpoolCorporation has faced just that challenge. Whirlpool is committed to Enterprise ResourcePlanning systems and in 2000 began a huge implementation of an SAP ERP system (youwill learn about SAP in Chapter 2).
Managing price increases is a particular challenge. With rising oil prices and increasedraw material costs, Whirlpool needs to be able to look at the business as a whole—in otherwords, globally. Its integrated SAP system helps it to do just that.
Whirlpool corporate vice president and chief information officer Esat Sezer explainsthat, regarding raw material price increases, “We had to have the capability to see prod-uct by product, category by category, country by country, day to day, the impact of mate-rial costs, logistics costs, and the impact into our (profit) margins.” With reference to thesupply chain, in particular, Whirlpool has updated and fixed an unintegrated system thatused to consist of spreadsheets and manual procedures. Now, with its integrated supplychain, demand from a trade partner or customer is integrated into production planning.“We can look into production plans and see if this item for this date in this quantity is forthis customer,” says Sezer.
Some of Whirlpool’s midsized trading partners could not connect directly toWhirlpool’s order entry system, and instead were ordering either by phone or fax, whichwas extremely inefficient. With the SAP integrated system, and a new online order sys-tem, these partners now can place orders over the Web. These improvements have trans-lated into a savings of 80 percent of the cost of taking the order.
continued
Business Functions and Business Processes
5

Many other large corporations have similar integration stories. The DuPontCorporation is committed to SAP for integrating business units. For example, DuPontFluorochemicals couldn’t do division-wide capacity planning, nor could its customers orderover the Web, until DuPont integrated its systems with one ERP system.
Other companies need to integrate information from acquisitions. For example, AirFrance is integrating its inventory and order systems after acquiring KLM.
When Colgate-Palmolive needed global reporting and global analysis along with moreaccurate and more timely cash positions, it looked to ERP systems to enable thosecapabilities.
Question:
1. Choose an industry in which you would enjoy working, and pick a company inthat industry. Assume this company is lacking an integrated information system.Write a memo to the CEO explaining the benefits of integrating the systems inthe company. Refer to the Functional Area Information Systems section of thechapter to help you compose this memo.
F U N C T I O N A L A R E A S A N D B U S I N E S SP R O C E S S E S O F A V E R Y S M A L L B U S I N E S S
As an introduction, we will look at the way business processes involve more than onefunctional area, using a very small business as an example—a fictitious lemonade stand thatyou own. We will examine the business processes of the lemonade stand and see why coor-dination of the functional areas helps achieve efficient and effective business processes.You will see the role that information plays in this coordination and how integration of theinformation system improves your business.
Even though one person can run a lemonade stand, the operation of the businessrequires a number of processes. Coordinating the activities within different functional areasrequires accurate and timely information.
Marketing and SalesThe functions of Marketing and Sales include developing products, determining pricing,promoting products to customers, and taking customers’ orders. M/S also helps to create asales forecast to ensure the successful operation of the lemonade stand.
For the most part, this is a cash business and does not require formal recordkeeping,but you still need to keep track of your customers so that you can send flyers or occa-sional thank you notes to repeat customers. Thus, your records must not only show theamount of sales, but also identify repeat customers.
Product development can be done informally in such a simple business; you gatherinformation about who buys which kind of lemonade and note what customers say abouteach product. You also analyze historical sales records to spot trends that are not obvious.Deciding whether to sell a product also depends on how much it costs to produce theproduct. For example, some customers might be asking for a sugar-free lemonade. To
Chapter 1
6

determine whether the new lemonade could be profitably produced and sold, you could ana-lyze data from SCM, including production information (such as mixing container size, timerequired to mix) and materials management data (cost of lemons and sweetener).
Even though you run a cash business, good repeat customers are allowed to chargepurchases—up to a point. Thus, your records must show how much each customer owes andhis or her available credit. It is very important that the data be available and accurate atthe time of a customer’s credit request. Since Accounting and Finance records must beaccessed as a part of the selling process, the accounting function has a critical role to playin the sales process.
Supply Chain ManagementThe functions within Supply Chain Management include making the lemonade(manufacturing/production) and buying raw materials (purchasing). Production is plannedso that, as much as possible, lemonade is available when needed, without excess produc-tion of lemonade that must be liquidated. This planning requires sales forecasts from theM/S functional area. Sales forecasts are analyses that attempt to predict the future sales ofa product. A forecast’s accuracy will be improved if it is based on historical sales figures (forexample, factors such as hot weather and nearby yard sales will impact the forecast). Thus,forecasts from M/S play an important role in the production planning process.
Production plans are also used to develop requirements for raw materials (bottledspring water, fresh lemons, artificial sweetener, and raw sugar) and packaging (cups, straws,and napkins). You must generate raw material and packaging orders from theserequirements. If the forecasts are accurate, you will not lose sales because of material short-ages, nor will you have excessive inventory that might spoil.
SCM and M/S must choose a recipe for each lemonade product sold. The standard recipeis a key input for deciding how much to order of each raw material, which is a purchas-ing function. Access to this recipe is also necessary for keeping good manufacturing records,allowing managers within the SCM functional area (working with those in A/F) to com-pare how much it actually costs to make a glass of lemonade, versus how much the recipeshould have cost.
Accounting and FinanceFunctions within Accounting and Finance include recording raw data about transactions(including sales), raw material purchases, payroll, and receipt of cash from customers. Rawdata are simply numbers collected from those operations, without any manipulation, cal-culation, or arrangement for presentation. Those data are then summarized in meaning-ful ways to determine the profitability of the lemonade stand and to support decisionmaking.
Note that data from Accounting and Finance are used by Marketing and Sales as wellas by Supply Chain Management. The sales records are an important component of thesales forecast, which is used in making staffing decisions and in production planning. Therecords from accounts receivable, which you use to determine whether to grant credit toa particular customer, are also used to monitor the overall credit-granting policy of the lem-onade stand. You want to be sure that you have enough cash on hand to purchase raw mate-rials, as well as to finance purchasing new equipment, such as a lemon juicer.
Business Functions and Business Processes
7
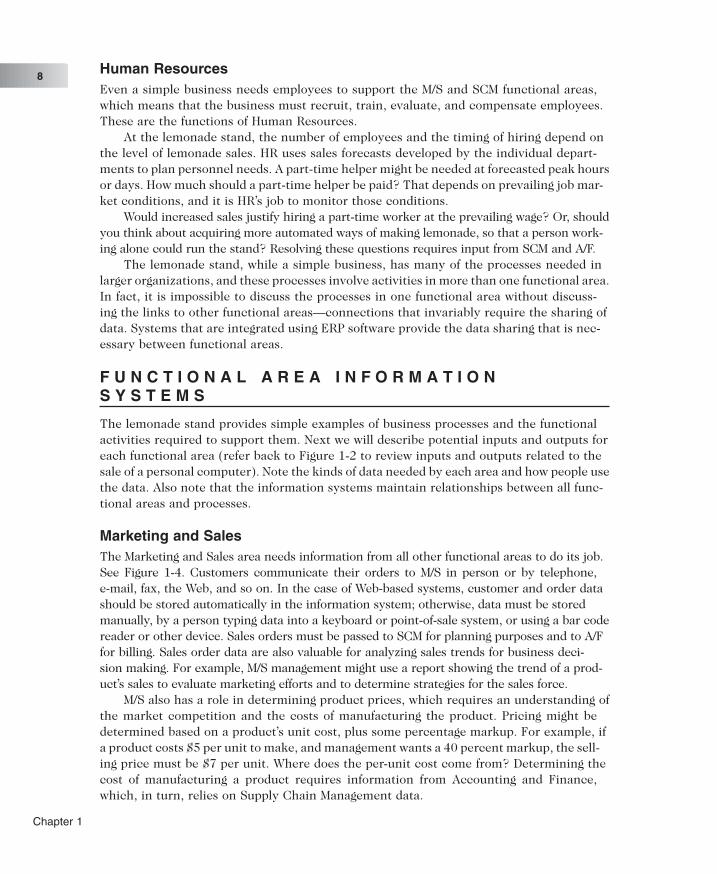
Human ResourcesEven a simple business needs employees to support the M/S and SCM functional areas,which means that the business must recruit, train, evaluate, and compensate employees.These are the functions of Human Resources.
At the lemonade stand, the number of employees and the timing of hiring depend onthe level of lemonade sales. HR uses sales forecasts developed by the individual depart-ments to plan personnel needs. A part-time helper might be needed at forecasted peak hoursor days. How much should a part-time helper be paid? That depends on prevailing job mar-ket conditions, and it is HR’s job to monitor those conditions.
Would increased sales justify hiring a part-time worker at the prevailing wage? Or, shouldyou think about acquiring more automated ways of making lemonade, so that a person work-ing alone could run the stand? Resolving these questions requires input from SCM and A/F.
The lemonade stand, while a simple business, has many of the processes needed inlarger organizations, and these processes involve activities in more than one functional area.In fact, it is impossible to discuss the processes in one functional area without discuss-ing the links to other functional areas—connections that invariably require the sharing ofdata. Systems that are integrated using ERP software provide the data sharing that is nec-essary between functional areas.
F U N C T I O N A L A R E A I N F O R M A T I O NS Y S T E M S
The lemonade stand provides simple examples of business processes and the functionalactivities required to support them. Next we will describe potential inputs and outputs foreach functional area (refer back to Figure 1-2 to review inputs and outputs related to thesale of a personal computer). Note the kinds of data needed by each area and how people usethe data. Also note that the information systems maintain relationships between all func-tional areas and processes.
Marketing and SalesThe Marketing and Sales area needs information from all other functional areas to do its job.See Figure 1-4. Customers communicate their orders to M/S in person or by telephone,e-mail, fax, the Web, and so on. In the case of Web-based systems, customer and order datashould be stored automatically in the information system; otherwise, data must be storedmanually, by a person typing data into a keyboard or point-of-sale system, or using a bar codereader or other device. Sales orders must be passed to SCM for planning purposes and to A/Ffor billing. Sales order data are also valuable for analyzing sales trends for business deci-sion making. For example, M/S management might use a report showing the trend of a prod-uct’s sales to evaluate marketing efforts and to determine strategies for the sales force.
M/S also has a role in determining product prices, which requires an understanding ofthe market competition and the costs of manufacturing the product. Pricing might bedetermined based on a product’s unit cost, plus some percentage markup. For example, ifa product costs $5 per unit to make, and management wants a 40 percent markup, the sell-ing price must be $7 per unit. Where does the per-unit cost come from? Determining thecost of manufacturing a product requires information from Accounting and Finance,which, in turn, relies on Supply Chain Management data.
Chapter 1
8
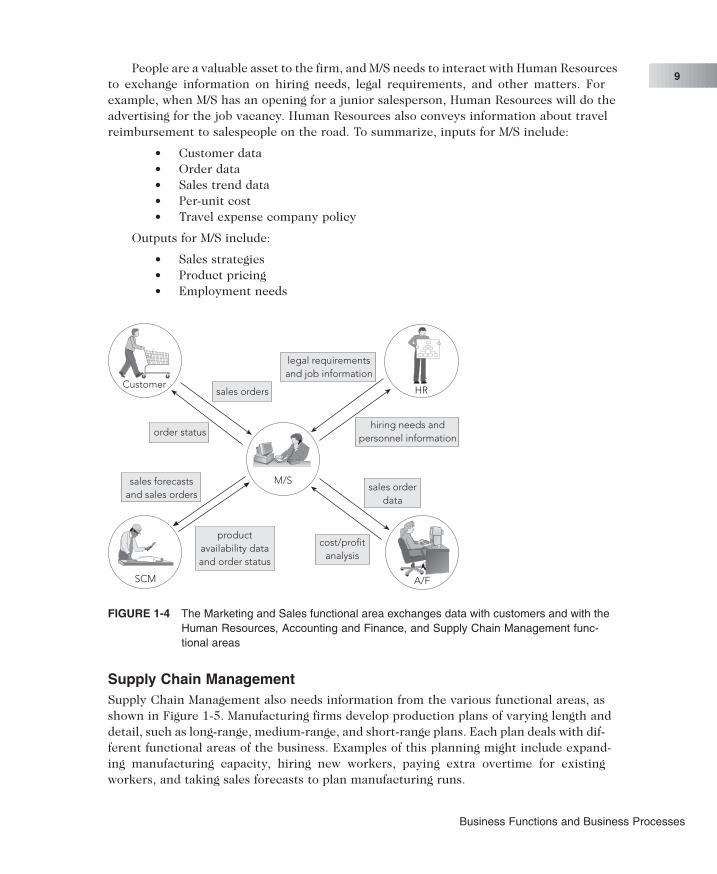
People are a valuable asset to the firm, and M/S needs to interact with Human Resourcesto exchange information on hiring needs, legal requirements, and other matters. Forexample, when M/S has an opening for a junior salesperson, Human Resources will do theadvertising for the job vacancy. Human Resources also conveys information about travelreimbursement to salespeople on the road. To summarize, inputs for M/S include:
● Customer data● Order data● Sales trend data● Per-unit cost● Travel expense company policy
Outputs for M/S include:
● Sales strategies● Product pricing● Employment needs
Supply Chain ManagementSupply Chain Management also needs information from the various functional areas, asshown in Figure 1-5. Manufacturing firms develop production plans of varying length anddetail, such as long-range, medium-range, and short-range plans. Each plan deals with dif-ferent functional areas of the business. Examples of this planning might include expand-ing manufacturing capacity, hiring new workers, paying extra overtime for existingworkers, and taking sales forecasts to plan manufacturing runs.
Customersales orders
M/S
A/FSCM
HR
order status
sales forecastsand sales orders
productavailability dataand order status
cost/profitanalysis
sales orderdata
hiring needs andpersonnel information
legal requirementsand job information
FIGURE 1-4 The Marketing and Sales functional area exchanges data with customers and with theHuman Resources, Accounting and Finance, and Supply Chain Management func-tional areas
Business Functions and Business Processes
9

Production plans are based on information about product sales (actual and projected)that comes from Marketing and Sales. The purchasing function bases its orders of rawmaterials on production plans, expected shipments, delivery lead times, and existing inven-tory levels. With accurate data about required production levels, raw material and pack-aging can be ordered as needed, and inventory levels can be kept low, saving money. On theother hand, if data are inaccurate or not current, manufacturing may run out of raw mate-rial or packaging; such a shortfall is called a stockout. Shortages of this type can shutdown production and cause the company to miss delivery dates. To avoid stockouts, man-agement might carry extra raw material and packaging, known as safety stock, which canresult in an overinvestment in inventory. If certain time-sensitive goods are held too long,they can spoil and will need to be destroyed, rather than sold for profit. The accuracy ofthe forecast determines the amount of safety stock that is required to reduce the risk of astockout to an acceptable level. The less accurate the forecast, the more safety stock isrequired. Accurate forecasting and production planning can reduce the need for extrainventory and manufacturing capacity.
Supply Chain Management records can provide the data needed by Accounting andFinance to determine how much of each resource (materials, labor, supplies, and over-head) was used to make completed products in inventory.
S
M/SA/F
SCM
HR
orders for rawmaterials and
packaging
productionplans, materials,
and inventory
sales data andmanufacturingcost analysis
hiring needs andpersonnel information
raw materialsavailability and
delivery
sales forecastsand sales
orders
productavailabilitydata and
order status
legal requirementsand job information
FIGURE 1-5 The Supply Chain Management functional area exchanges data with suppliers andwith the Human Resources, Marketing and Sales, and Accounting and Finance func-tional areas
Chapter 1
10
Supply Chain Management data can support the M/S function by providing informa-tion about what has been produced and shipped. For example, some computer manufactur-ers, such as Gateway, have automated systems that call customers to notify them that theircomputer order has been shipped. Shipping companies, such as UPS and FedEx, pro-vide shipment-tracking information on the Internet. By entering a tracking number, the cus-tomer can see each step of the shipping process by noting where the package’s bar code wasscanned. Thus, accurate and timely production information can support the sales pro-cess and increase customer satisfaction.
For long-range planning, management might want to see monthly reports showing salesand production figures. The data for such reports must come from the production andinventory data.
Supply Chain Management also interacts in some ways with Human Resources. SCMpasses hiring information to HR, and HR informs SCM of the company’s layoff and recallpolicy, which might pertain to workers in the plant.
To summarize, inputs for SCM include:
● Product sales data● Production plans● Inventory levels● Layoff and recall company policy
Outputs for SCM include:
● Raw material orders● Packaging orders● Resource expenditure data● Production and inventory reports● Hiring information
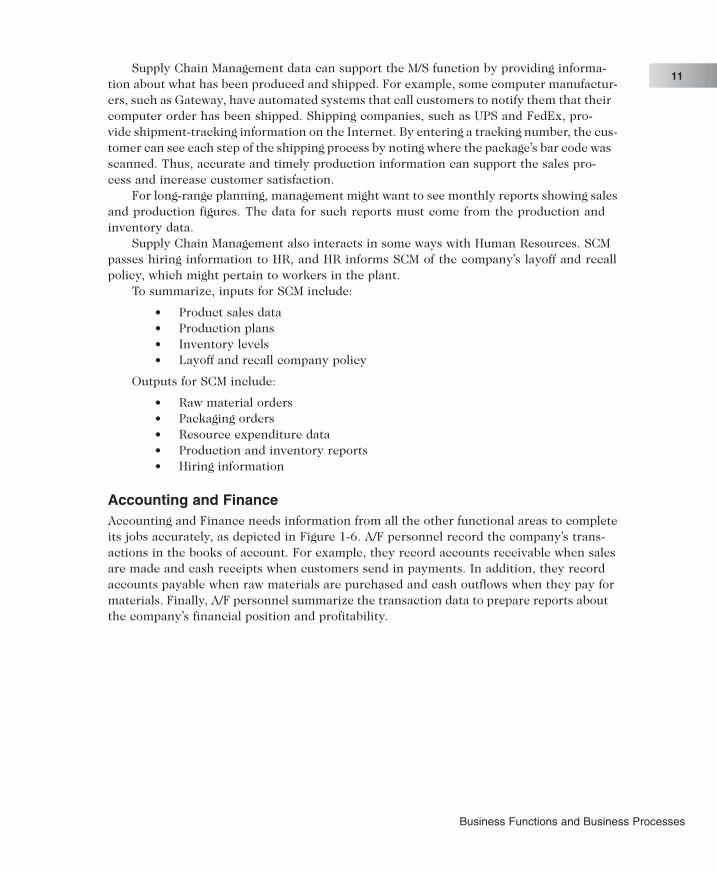
Accounting and FinanceAccounting and Finance needs information from all the other functional areas to completeits jobs accurately, as depicted in Figure 1-6. A/F personnel record the company’s trans-actions in the books of account. For example, they record accounts receivable when salesare made and cash receipts when customers send in payments. In addition, they recordaccounts payable when raw materials are purchased and cash outflows when they pay formaterials. Finally, A/F personnel summarize the transaction data to prepare reports aboutthe company’s financial position and profitability.
Business Functions and Business Processes
11
People in other functional areas provide data to A/F: M/S provides sales data, SCM pro-vides production and inventory data, and HR provides payroll and benefit expense data.The accuracy and timeliness of A/F data depend on the accuracy and timeliness of the datafrom the other functional areas.
M/S personnel require data from A/F to evaluate customer credit. If an order will cause thecustomer to exceed his or her credit limit, M/S should see that the customer’s accounts receiv-able balance (the amount owed to the company) is too high and hold new orders until thecustomer’s balance is lowered. If A/F is slow to record sales, the accounts receivable balanceswill be inaccurate, and M/S might approve credit for customers who have already exceededtheir credit limits and who might never pay off their accounts. If A/F does not record custom-ers’ payments promptly, the company could deny credit to customers who actually owe lessthan their credit limit, potentially damaging the company’s relationship with those customers.
To summarize, inputs for A/F include:
● Payments from customers● Accounts receivable data● Accounts payable data● Sales data● Production and inventory data● Payroll and expense data
Outputs for A/F include:
● Payments to suppliers● Financial reports● Customer credit data
Customer payments
M/S
A/F
SCM
HR
invoices andcredit memos
sales data andmanufacturingcost analysis
production plans,materials, andinventory data
cost/profitanalysis
sales orderdata
hiring needs andpersonnel information
legal requirementsand job information,payroll and benefit
expense data
FIGURE 1-6 The Accounting and Finance functional area exchanges data with customers and withthe Human Resources, Marketing and Sales, and Supply Chain Management func-tional areas
Chapter 1
12
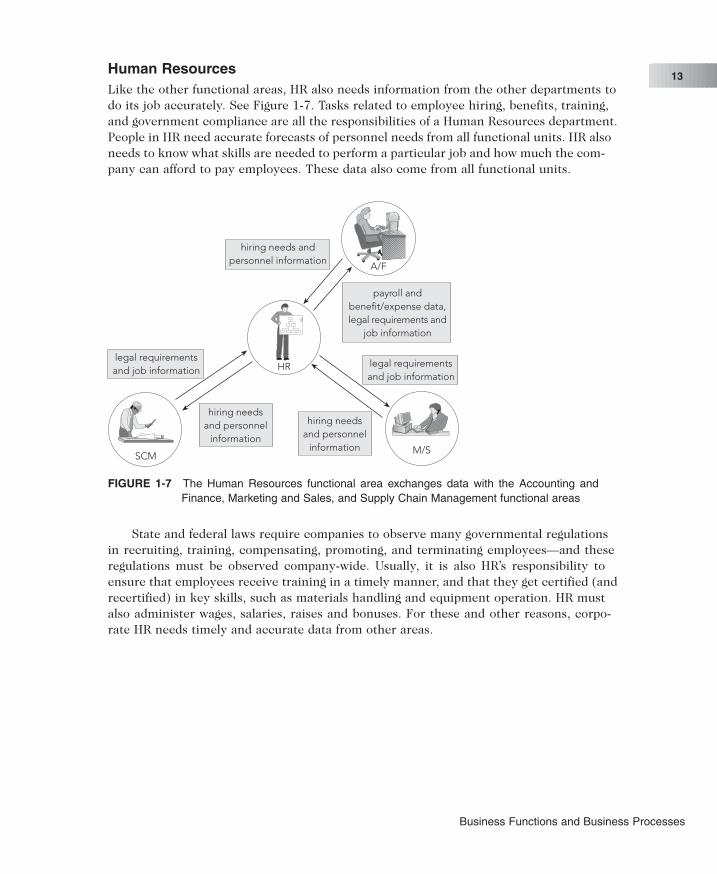
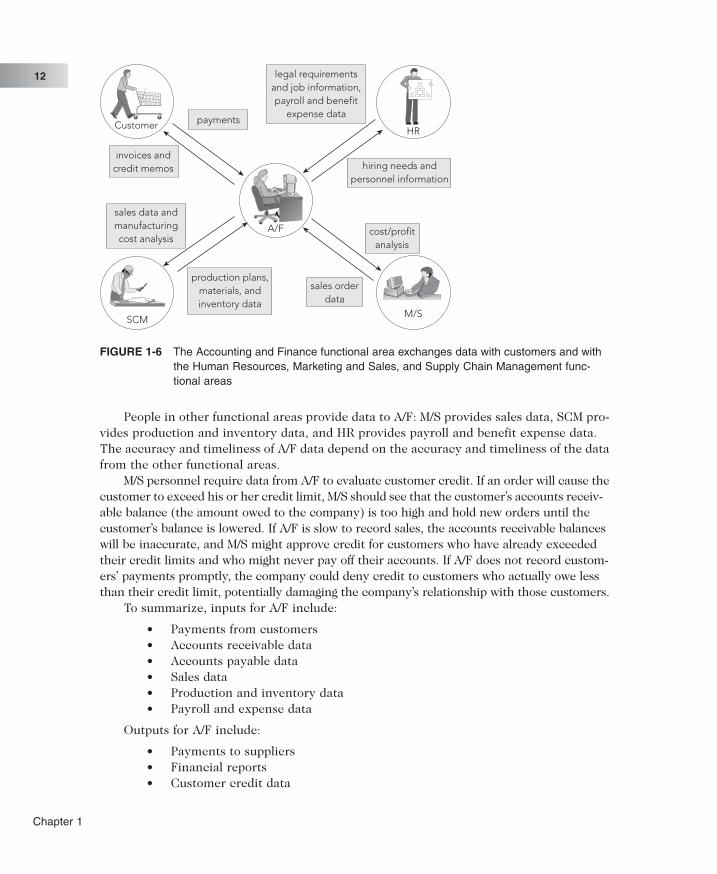
Human ResourcesLike the other functional areas, HR also needs information from the other departments todo its job accurately. See Figure 1-7. Tasks related to employee hiring, benefits, training,and government compliance are all the responsibilities of a Human Resources department.People in HR need accurate forecasts of personnel needs from all functional units. HR alsoneeds to know what skills are needed to perform a particular job and how much the com-pany can afford to pay employees. These data also come from all functional units.
State and federal laws require companies to observe many governmental regulationsin recruiting, training, compensating, promoting, and terminating employees—and theseregulations must be observed company-wide. Usually, it is also HR’s responsibility toensure that employees receive training in a timely manner, and that they get certified (andrecertified) in key skills, such as materials handling and equipment operation. HR mustalso administer wages, salaries, raises and bonuses. For these and other reasons, corpo-rate HR needs timely and accurate data from other areas.
M/S
A/F
SCM
HR
hiring needs andpersonnel information
legal requirementsand job information
hiring needsand personnel
information
hiring needsand personnel
information
legal requirementsand job information
payroll andbenefit/expense data,legal requirements and
job information
FIGURE 1-7 The Human Resources functional area exchanges data with the Accounting andFinance, Marketing and Sales, and Supply Chain Management functional areas
Business Functions and Business Processes
13

HR must create accurate and timely data for management use. For example, HR shouldmaintain a database of skills required to do particular jobs and the prevailing pay rates.When the company evaluates employees’ performance and compensation, analysis of thesedata can help to prevent the loss of valued employees because of low pay.
To summarize, inputs for HR include:
● Personnel forecasts● Skills data
Outputs for HR include:
● Regulation compliance● Employee training and certification● Skills database● Employee evaluation and compensation
As shown in Figures 1-4 through 1-7, a significant amount of data is maintained by andshared among the functional areas. The timeliness and accuracy of these data are criti-cal to each area’s success and to the company’s ability to make a profit and generate futuregrowth. ERP software allows all the functional areas to share a common database so thataccurate, real-time information is available. In the next chapter, we will trace the evolu-tion of data management systems that led to ERP.
Chapter 1
14

Chapter Summary
● Companies that make and sell products have business processes that involve thesebasic functional areas: Marketing and Sales, Supply Chain Management, Accounting andFinance, and Human Resources. They perform these functions:
● Marketing and Sales sets product prices, promotes products through advertising andmarketing, takes customer orders, supports customers, and creates sales forecasts.
● Supply Chain Management develops production plans, orders raw materials fromsuppliers, receives the raw material into the facility, manufactures products, main-tains facilities, and ships products to customers.
● Accounting and Finance performs financial accounting to provide summaries ofoperational data in managerial reports, and also is responsible for tasks such as con-trolling accounts, planning and budgeting, and cash-flow management.
● Human Resources recruits, hires, trains, and compensates employees, ensures com-pliance with government regulations, and oversees the evaluation of employees.
● A functional area is served by an information system. Information systems capture, pro-cess, and store data to provide information needed for decision making.
● Employees working in one functional area need data from employees in other func-tional areas. Ideally, functional area information systems should be integrated, so shareddata are accurate and timely.
● Today, business managers try to think in terms of business processes that integrate thefunctional areas, thus promoting efficiency and competitiveness. An important aspect ofthis integration is the need to share information between functions and functional areas.ERP software provides this capability by means of a single common database.
Key Terms
Accounting and Finance (A/F)
Business function
Business process
Enterprise Resource Planning (ERP)
Functional areas of operation
Human Resources (HR)
Information system (IS)
Integrated information system
Marketing and Sales (M/S)
Raw data
Safety stock
Sales forecast
Stockout
Supply Chain Management (SCM)
Exercises
1. Distinguish between a business function and a business process. Describe how a busi-ness process cuts across functional lines in an organization. Why do managers organizetheir teams in terms of business processes instead of functional departments? What ben-efits do you see from this new method of organization?
2. Reproduce Figure 1-1 for the lemonade stand business example. Add a one-sentencedescription for each function as it relates to the lemonade stand.
Business Functions and Business Processes
15
3. Assume you run an Internet business with a couple of friends from college. Your companysells tickets to concerts and sporting events. Describe all the flows of information betweenMarketing and Sales and Accounting and Finance.
4. Using the Internet, research your state’s regulations for waiters and waitresses, such as mini-mum age of employment.Why is it important that Human Resources communicate this infor-mation to the hiring department?
5. Think of the last time you bought a pair of shoes. How does the process of buying thoseshoes cut across the store’s various functional lines? What information from your receiptwould need to be available to the business functions? Which business functions would needthat information?
For Further Study and Research
Albright, Evan. “Whirlpool: Actionable Analytics.” SAP NetWeaver magazine 02, no. 03(Summer 2006).
Anthes, Gary H. “Case Study: Supply Chain Whirl.” Computerworld, September 6, 2005.http://www.computerworld.com.au/index.php/id;1550407298;fp;2;fpid;1239068928.
IBM Corporation. Case Study, Whirlpool: “Whirlpool’s B2B trading portal cuts per-order costssignificantly.” 2000. http://www-07.ibm.com/hk/e-business/case_studies/manufacturing/whirlpool.html.
Pang, Albert. IDC case study: “Air France Soars to New Heights with Upgraded my SAP ERPSystem: Meeting Its Commitment to Excellence.” July 2006. http://www.sap.com/solutions/business-suite/erp/pdf/CCS_Air_France.pdf.
SAP Business Community Webcast. 2005. http://www.sap.com/community/pub/events/2005_12_01_cp/index.epx.
Sullivan, Laurie. “ERPzilla,” Information Week, July 11, 2005.
Chapter 1
16
C H A P T E R 2THE DEVELOPMENT OFENTERPRISE RESOURCEPLANNING SYSTEMS
L E A R N I N G O B J E C T I V E S
After completing this chapter, you will be able to:
● Identify the factors that led to the development of Enterprise ResourcePlanning (ERP) systems.
● Describe the distinguishing modular characteristics of ERP software.
● Discuss the pros and cons of implementing an ERP system.
● Summarize ongoing developments in ERP.
I N T R O D U C T I O N
In today’s competitive business environment, companies try to provide customers with goods and
services faster and less expensively than their competition. How do they do that? Often, the key is to have
efficient, integrated information systems. Increasing the efficiency of information systems results in more
efficient management of business processes. When companies have efficient business processes, they
can be more competitive in the marketplace.
An Enterprise Resource Planning (ERP) system can help integrate a company’s operations by acting
as a company-wide computing environment that includes a database that is shared by all functional areas.
Such software can deliver consistent data across all business functions in real time. Real time refers to
data and processes that are always current.

This chapter will help you to understand how and why ERP systems came into being and what the
future might hold for business information systems. The chapter follows this sequence:
● Review of the evolution of information systems and related causes for the recent development
of ERP systems
● Discussion of the few ERP software vendors that dominate the market. The current industry
leader, German software maker SAP AG, and its industry-leading software product, SAP ERP,
are discussed as an example of an ERP system.
● Review of factors influencing a company’s decision on whether to purchase an ERP system
● Description of ERP’s benefits
● Overview of frequently asked questions related to ERP systems
● Discussion of the future of ERP software and its impact on the Internet and Web services
T H E E V O L U T I O N O F I N F O R M A T I O NS Y S T E M S
Until recently, most companies had unintegrated information systems that supported onlythe activities of individual business functional areas. Thus, a company would have a Mar-keting information system, a Production information system, and so on, each with its ownhardware, software, and methods of processing data and information. This configurationof information systems is known as silos because each department has its own stack, or silo,of information that is unconnected to the next silo. Silos are also known as stovepipes.
Such unintegrated systems might work well within individual functional areas, but toachieve its goals, a company must share data among all the functional areas. When a com-pany’s information systems are not integrated, costly inefficiencies can result. For example,suppose two functional areas have separate, unintegrated information systems. To sharedata, a clerk in one functional area needs to print out data from another functional area andthen type the information into her area’s information system. Not only does this data inputtake twice the time, it also significantly increases the chance for data entry errors. Alter-natively, the process might be automated by having one information system write data toa file to be read by another information system. This would reduce the probability oferrors, but it could only be done periodically (usually overnight or on a weekend), to mini-mize the disruption to normal business transactions. Because of the time lag in updatingthe system, the transferred data would rarely be up to date. In addition, data can be defineddifferently in different data systems, such as calling products by different part numbers in
Chapter 2
18
different systems. This variance can create further problems in timely and accurate infor-mation sharing between functional areas.
It seems obvious today that a business should have integrated software to manage allfunctional areas. An integrated ERP system, however, is an incredibly complex hard-ware and software system that was not feasible until the 1990s. Current ERP systemsevolved as a result of three things (1) the advancement of hardware and software tech-nology (computing power, memory, and communications) needed to support the system,(2) the development of a vision of integrated information systems, and (3) the reengineer-ing of companies to shift from a functional focus to a business process focus.
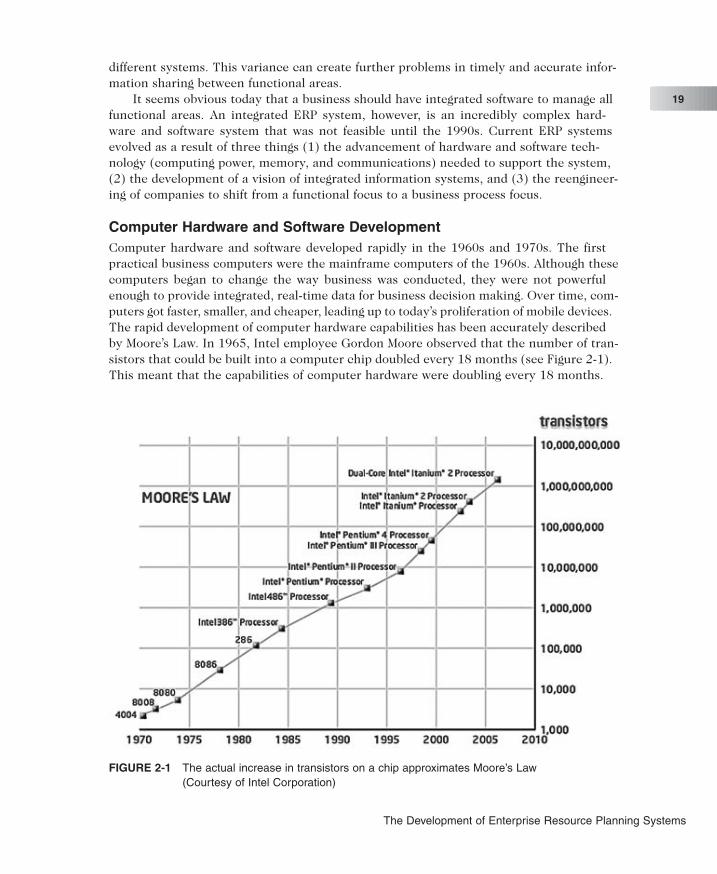
Computer Hardware and Software DevelopmentComputer hardware and software developed rapidly in the 1960s and 1970s. The firstpractical business computers were the mainframe computers of the 1960s. Although thesecomputers began to change the way business was conducted, they were not powerfulenough to provide integrated, real-time data for business decision making. Over time, com-puters got faster, smaller, and cheaper, leading up to today’s proliferation of mobile devices.The rapid development of computer hardware capabilities has been accurately describedby Moore’s Law. In 1965, Intel employee Gordon Moore observed that the number of tran-sistors that could be built into a computer chip doubled every 18 months (see Figure 2-1).This meant that the capabilities of computer hardware were doubling every 18 months.
FIGURE 2-1 The actual increase in transistors on a chip approximates Moore’s Law(Courtesy of Intel Corporation)
The Development of Enterprise Resource Planning Systems
19
During this time, computer software was also advancing to take advantage of theincreasing capabilities of computer hardware. In the 1970s, relational database software wasdeveloped, providing businesses with the ability to store, retrieve, and analyze large vol-umes of data. Spreadsheet software, a fundamental business tool today, became popular inthe 1980s. With spreadsheets, managers could perform complex business analyses with-out having to rely on a computer programmer to develop custom programs.
The computer hardware and software developments of the 1960s and 1970s paved theway for the development of ERP systems.
Early Attempts to Share ResourcesAs PCs gained popularity in business in the 1980s, managers became aware that importantbusiness information was being stored on individual PCs, but that there was no easy wayto share the information electronically. Users needed a way to share costly peripheral equip-ment (such as printers and hard disks, which in the early 1980s were fairly expensive) and,more importantly, data.
By the mid-1980s, telecommunications developments allowed users to share data andperipherals on local networks. Usually, these networks were groups of computers con-nected to one another within a single physical location. This meant that workers coulddownload data from a central computer to their desktop PCs and work with the data attheir desks.
This central computer–local computer arrangement is now called a client-serverarchitecture. Servers (central computers) became more powerful and less expensive andprovided scalability. Scalability means that when a piece of equipment’s capacity isexhausted, its capacity can be increased by adding new hardware. In the case of a client-server network, the ability to add servers makes the network scalable—thus extending thelife of the hardware investment.
By the end of the 1980s, much of the hardware needed to support the development ofERP systems was in place: fast computers, networked access, and advanced databasetechnology. Recall from Chapter 1 that ERP programs help to manage company-wide busi-ness processes using a common database. This common database holds a very largeamount of data. The technology to hold that data in an organized fashion, and to retrievedata easily, is the database management system, known as a DBMS. By the mid-1980s, theDBMS required to manage the development of complex ERP software existed. The final ele-ment required for the development of ERP software was understanding and acceptancefrom the business community. Businesspeople did not yet recognize the benefits of inte-grated information systems, nor were they willing to commit the resources to developERP software.
The Manufacturing Roots of ERPThe concept of an integrated information system took shape on the factory floor. Manu-facturing software developed during the 1960s and 1970s, evolving from simple inventory-tracking systems to material requirements planning (MRP) software. MRP softwareallowed a plant manager to plan production and raw materials requirements by workingbackward from the sales forecast, the prediction of future sales. Thus, the manager firstlooked at Marketing and Sales’ forecast of demand (what the customer wants), then looked
Chapter 2
20
at the production schedule needed to meet that demand, calculated the raw materialsneeded to meet production, and finally, projected raw materials purchase orders tosuppliers. For a company with many products, raw materials, and shared productionresources, this kind of projection was impossible without a computer to keep track of vari-ous inputs.
The basic functions of MRP could be handled by mainframe computers. Electronic datainterchange (EDI), the direct computer-to-computer exchange of standard business docu-ments, allowed companies to handle the purchasing process electronically, avoiding thecost and delays resulting from paper purchase order and invoice systems. The functionalarea now known as Supply Chain Management (SCM) began with the sharing of long-range production schedules between manufacturers and their suppliers.
Management’s Impetus to Adopt ERPThe hard economic times of the late 1980s and early 1990s caused many companies todownsize and reorganize. These company overhauls were a stimulus to ERP development.Companies needed to find some way to avoid the following kind of situation, which theyhad tolerated for a long time.
Imagine you are the CEO of Styling, a clothing manufacturing company. Styling isprofitable and is keeping pace with the competition, but your IS is unintegrated andinefficient (as are the systems of your competitors). You’ve learned to live with this kindof inefficiency: Your Marketing and Sales department creates a time-consuming papertrail for negotiating and making a sale. To schedule factory production, however,your Manufacturing manager needs accurate, timely information about actual andprojected sales orders from the M/S manager. Without such information, theManufacturing manager must guess which products to produce—and how many ofthem to produce. To keep goods moving through the production line, the manager oftendoes guess. Sometimes the guess overestimates demand for some garments, andsometimes it underestimates demand.
Overproduction of a certain garment might mean your company is stuck withgarments for which there is no market, or you might face a diminishing market due tostyle changes or seasonal demand. When you store the garments, waiting for a buyer, youincur warehouse expense. On the other hand, underproduction of a certain garmentmight result in garments not being ready for delivery when a salesperson promised,leading to unhappy customers and canceled orders. If you try to catch up on orders, you’llhave to pay factory workers overtime, or resort to the extra expense of rapid-deliveryshipments.
The Development of Enterprise Resource Planning Systems
21

The management of large companies decided they could no longer afford the type ofinefficiencies illustrated by the Styling example—inefficiencies caused by the functionalmodel of business organization. This model, illustrated in Figure 2-2, had deep roots inU.S. business, starting with the General Motors organizational model developed by AlfredP. Sloan in the 1930s. The functional business model illustrates the concept of silos ofinformation, which limit the exchange of information between the lower operating levels.Instead, the exchange of information between operating groups is handled by top man-agement, which might not be knowledgeable about the functional area.
The functional model was very useful for decades, and was successful in the UnitedStates, where there was limited competition and where flexibility and rapid decision mak-ing were not requirements for success. In the quickly changing markets of the 1990s, how-ever, the functional model led to top-heavy and overstaffed organizations incapable ofreacting quickly to change. The time was right to view a business as a set of cross-functional processes, as illustrated in Figure 2-3. In this organizational model, the func-tional business model, with its separate silos of information, is gone. Now informationflows between the operating levels without top management’s involvement.
Top management
Mar
ketin
g
Sale
s
Man
ufac
turin
g
Log
istic
s
Fina
nce
& A
cco
untin
g
Info
rmat
ion
flow
Info
rmat
ion
flow
Info
rmat
ion
flow
Info
rmat
ion
flow
Info
rmat
ion
flow
Material & product flow
FIGURE 2-2 Information and material flows in a functional business model
Chapter 2
22
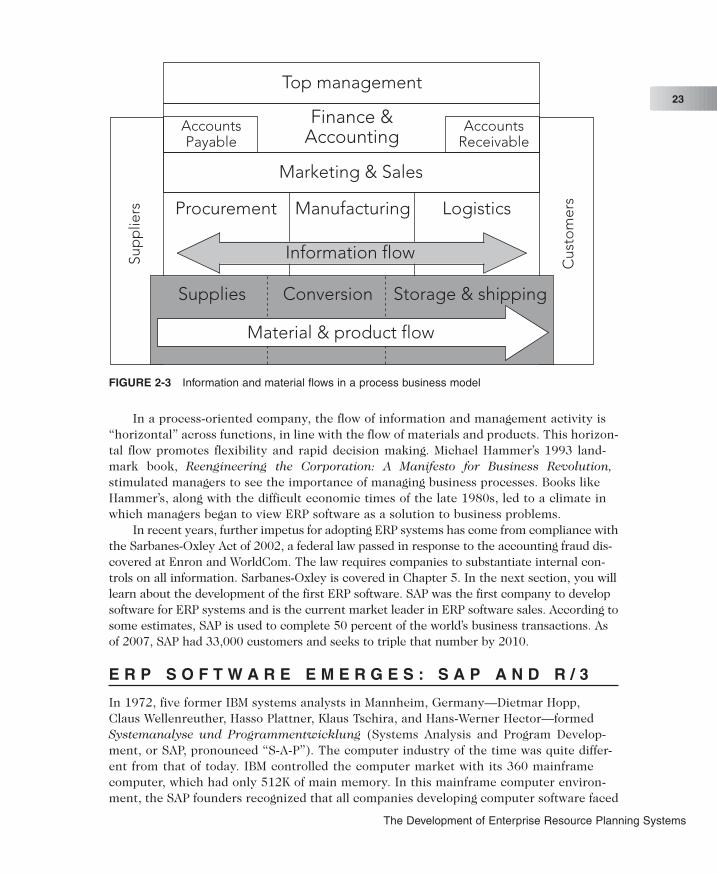
In a process-oriented company, the flow of information and management activity is“horizontal” across functions, in line with the flow of materials and products. This horizon-tal flow promotes flexibility and rapid decision making. Michael Hammer’s 1993 land-mark book, Reengineering the Corporation: A Manifesto for Business Revolution,stimulated managers to see the importance of managing business processes. Books likeHammer’s, along with the difficult economic times of the late 1980s, led to a climate inwhich managers began to view ERP software as a solution to business problems.
In recent years, further impetus for adopting ERP systems has come from compliance withthe Sarbanes-Oxley Act of 2002, a federal law passed in response to the accounting fraud dis-covered at Enron and WorldCom. The law requires companies to substantiate internal con-trols on all information. Sarbanes-Oxley is covered in Chapter 5. In the next section, you willlearn about the development of the first ERP software. SAP was the first company to developsoftware for ERP systems and is the current market leader in ERP software sales. According tosome estimates, SAP is used to complete 50 percent of the world’s business transactions. Asof 2007, SAP had 33,000 customers and seeks to triple that number by 2010.
E R P S O F T W A R E E M E R G E S : S A P A N D R / 3
In 1972, five former IBM systems analysts in Mannheim, Germany—Dietmar Hopp,Claus Wellenreuther, Hasso Plattner, Klaus Tschira, and Hans-Werner Hector—formedSystemanalyse und Programmentwicklung (Systems Analysis and Program Develop-ment, or SAP, pronounced “S-A-P”). The computer industry of the time was quite differ-ent from that of today. IBM controlled the computer market with its 360 mainframecomputer, which had only 512K of main memory. In this mainframe computer environ-ment, the SAP founders recognized that all companies developing computer software faced
Top management
Finance &Accounting
AccountsReceivable
Marketing & Sales
Procurement Manufacturing Logistics
Sup
plie
rs
Cus
tom
ers
Information flow
Supplies Conversion Storage & shipping
AccountsPayable
Material & product flow
FIGURE 2-3 Information and material flows in a process business model
The Development of Enterprise Resource Planning Systems
23
the same basic business problems, and each developed unique, but similar, solutions fortheir needs in payroll processing, accounting, materials management, and other func-tional areas of business. SAP’s goal was to develop a standard software product that couldbe configured to meet the needs of each company. SAP’s concept from the beginning was toset standards in information technology, according to founder Dietmar Hopp. In addi-tion, the founders wanted data available in real time, and they wanted users to work on acomputer screen, not with voluminous printed output. These goals were lofty and forward-looking for 1972, and it took almost 20 years to achieve them.
SAP Begins Developing Software ModulesBefore leaving IBM, Plattner and Hopp had worked on an order-processing system for theGerman chemical company ICI. The order-processing system was so successful that ICImanagers also wanted a materials and logistics management system—a system for han-dling the purchase, receiving, and storage of materials—that could be integrated into thenew order-processing system. In the course of their work for ICI, Plattner and Hopp hadalready developed the idea of modular software development. Software modules are indi-vidual programs that can be purchased, installed, and run separately, but that all extractdata from the common database. Instead of giving Plattner and Hopp the new ICI project,IBM made them traveling software experts, removing them from hands-on developmentduties. Plattner and Hopp approached Claus Wellenreuther, an expert in financialaccounting who had just left IBM, about forming their own company.
When Plattner, Hopp, and Wellenreuther established SAP on April 1, 1972, they couldnot afford to purchase their own computer. Their first contract, with ICI, to develop thefollow-on materials and logistics management system, included access to ICI’s mainframecomputer at night—a practice they repeated with other clients until they acquired theirfirst computer in 1980. At ICI, the SAP founders developed their first software package, vari-ously called System R, System RF (for real-time financial accounting), and R/1.
To keep up with the ongoing development of mainframe computer technology, in 1978SAP began developing a more integrated version of its software products, called the R/2system. In 1982, after four years of development, SAP released its R/2 mainframe ERP soft-ware package.
Sales grew rapidly in the 1980s, and SAP extended its software’s capabilities and expandedinto international markets. This was no small task, because the software had to be able toaccommodate different languages, currencies, accounting practices, and tax laws.
By 1988, SAP had established subsidiaries in numerous foreign countries, establisheda joint venture with consulting company Arthur Andersen, and sold its 1,000th system.SAP also became SAP AG, a publicly traded company.
SAP R/3In 1988, SAP realized the potential of client-server hardware architecture and begandevelopment of its R/3 system to take advantage of client-server technology. The first ver-sion of SAP R/3 was released in 1992. Each subsequent release of the SAP R/3 software con-tained new features and capabilities. The client-server architecture used by SAP allowed R/3to run on a variety of computer platforms, including UNIX and Windows NT. The SAP R/3system was also designed using an open architecture approach. In open architecture,
Chapter 2
24
third-party software companies are encouraged to develop add-on software products thatcan be integrated with existing software. The open architecture also makes it easy for com-panies to integrate their hardware products, such as bar code scanners, personal digitalassistants (PDAs), cell phones, and global information systems with the SAP system.
New Directions in ERPIn the late 1990s, the Year 2000, or Y2K, problem motivated many companies to move toERP systems. As it became clear that the date turnover from December 31, 1999 to Janu-ary 1, 2000 would wreak havoc on some information systems, companies searched for waysto consolidate data, and ERP systems provided one solution.
The Y2K problem originated from programming shortcuts made by programmers in thepreceding decades. With memory and storage space a small fraction of what it is today,early programmers developed software that used as few computer resources as possible. Tosave memory, programmers in the 1970s and 1980s typically wrote programs that onlyused two digits to identify a year. For example, if an invoice was posted on October 29, 1975,the programmer could just store the date as 10/29/75, rather than 10/29/1975. While thismay not seem like a big storage savings, with millions of transactions needing to bemanipulated, it adds up. These programmers never imagined that software written in the1970s would still be running major companies and financial institutions in 1999. These oldsystems were known as legacy systems. Many companies were faced with a choice: pay pro-grammers millions of dollars to correct the Y2K problem in their old, limitedsoftware—or invest in an ERP system that would not only solve the Y2K problem, but poten-tially provide better management of their business processes as well. Thus, the Y2K prob-lem led to a dramatic increase in business for ERP vendors in the late 1990s. However,the rapid growth of the 1990s was followed by an ERP slump starting in 1999. By 1999, com-panies were in the final stages of either an ERP implementation or modification of theirexisting software. Many companies that had not yet decided to move to a Y2K-compliantERP system waited until after the new millennium to upgrade their information systems.
By 2000, SAP AG had 22,000 employees in 50 countries and 10 million users at 30,000installations around the world. By that time, SAP had competition in the ERP market,namely from Oracle and PeopleSoft (PeopleSoft expanded its offerings through the acqui-sition of ERP software vendor JD Edwards in 2003). In late 2004, Oracle succeeded in itsbid to take over PeopleSoft.
PeopleSoft
PeopleSoft was founded by David Duffield, a former IBM employee who, like SAP’s founders,faced opposition from IBM for his ideas. PeopleSoft started with software for humanresources and payroll accounting, and achieved considerable success, even with compa-nies that already were using SAP for accounting and production. PeopleSoft’s successcaused SAP to make significant modifications to its Human Resources module. PeopleSoftstrengthened its offerings in the supply chain area with its acquisition of JD Edwards.Today, PeopleSoft, under Oracle, is a popular software choice for managing humanresources and financial activities at universities.
The Development of Enterprise Resource Planning Systems
25

Oracle
Oracle is SAP’s biggest competitor. Oracle began in 1977 as Software Development Labora-tories (SDL). Its founders, Larry Ellison, Bob Miner, and Ed Oates, won a contract from theCentral Intelligence Agency (CIA) to develop a system, called Oracle, to manage largevolumes of data and extract information quickly. Although the Oracle project was can-celed before a successful product was developed, the three founders of SDL saw the com-mercial potential of a relational database system. In 1979, SDL became RelationalSoftware, Inc. and released its first commercial database product. The company changed itsname again, to Oracle, and in 1986 released the client-server Oracle relational database.The company continued to improve its database product, and in 1988 released OracleFinancials, a set of financial applications. The financial applications suite of modulesincluded Oracle Financials, Oracle Supply Chain Management, Oracle Manufacturing,Oracle Project Systems, Oracle Human Resources, and Oracle Market Management.Oracle Financials was the beginning of what would become Oracle’s ERP product.
The concepts of an enterprise resource planning system are similar for large vendors,such as SAP and Oracle, and for the many smaller vendors of ERP software. Because ofSAP’s leadership in the ERP industry, this textbook focuses primarily on SAP’s ERP soft-ware products as an example of ERP. Keep in mind that most other ERP software ven-dors provide similar functionality, with some having strengths in certain areas.
SAP ERP
SAP ERP software (previous versions were known as R/3, and later, mySAP ERP) haschanged over the years due to product evolution and for marketing purposes. The latest ver-sions of ERP systems by SAP and other companies allow all business areas to access thesame database, as shown in Figure 2-4, eliminating redundant data and communicationslags. Perhaps most importantly, the system allows data to be entered once, and then usedthroughout the organization. In information systems, errors most frequently occur wherehuman beings interact with the system. ERP systems ensure that data are entered onlyonce, where they are most likely to be accurate. For example, with access to real-time stockdata, a salesperson taking an order can confirm the availability of the desired material.When the salesperson enters the sales order into the system, the order data are immedi-ately available to Production, so Manufacturing can update production plans, and Mate-rials Management can plan the delivery of the order. If the sales order data are enteredcorrectly by the salesperson, then SCM personnel are working with the same, correct data.The same sales data are also available to Accounting for preparing invoices.
Chapter 2
26

Earlier in this chapter, you learned how software modules work. Figure 2-5 on the nextpage shows the major functional modules in the current SAP ERP system, also known asSAP ECC 6.0 (Enterprise Central Component 6.0), and depicts how the modules provideintegration.
The basic functions of each of the modules are as follows:
● The Sales and Distribution (SD) module records sales orders and scheduleddeliveries. Information about the customer (pricing, how and where to shipproducts, how the customer is to be billed, and so on) is maintained andaccessed from this module.
● The Materials Management (MM) module manages the acquisition of rawmaterials from suppliers (purchasing) and the subsequent handling of rawmaterials inventory, from storage to work-in-progress goods to shipping of fin-ished goods to the customer.
● The Production Planning (PP) module maintains production information.Here production is planned and scheduled, and actual production activities arerecorded.
● The Quality Management (QM) module plans and records quality controlactivities, such as product inspections and material certifications.
HumanResources
Marketingand Sales
Accountingand Finance
Production andMaterials
Management
Central Data
FIGURE 2-4 Data flow within an integrated information system
The Development of Enterprise Resource Planning Systems
27

● The Plant Maintenance (PM) module manages maintenance resources andplanning for preventive maintenance of plant machinery, to minimize equip-ment breakdowns.
● The Asset Management (AM) module helps the company to manage fixed-asset purchases (plant and machinery) and related depreciation.
● The Human Resources (HR) module facilitates employee recruiting, hiring,and training. This module also includes payroll and benefits.
● The Project System (PS) module allows the planning for and control over newR&D, construction, and marketing projects. This module allows for costs tobe collected against a project, and it is frequently used to manage the imple-mentation of the SAP ERP system. PS manages build-to-order items, whichare low-volume, highly complex products such as ships and aircrafts.
Two financial modules, FI and CO, are shown in Figure 2-5 as encompassing the mod-ules described above. That is because nearly every activity in the company has an impacton the financial position of the company.
FIFinancial
Accounting
COControlling
Workflow PPProductionPlanning
SDSales &
Distribution
MMMaterials
Management
QMQuality
Management
PMPlant
Maintenance
HRHuman
Resources
AMAsset
Management
WF
PSProjectSystem
FIGURE 2-5 Modules within the SAP ERP integrated information systems environment(Courtesy of SAP AG)
Chapter 2
28
● The Financial Accounting (FI) module records transactions in the general led-ger accounts. This module generates financial statements for external report-ing purposes.
● The Controlling (CO) module serves internal management purposes, assign-ing manufacturing costs to products and to cost centers, so that the profitabil-ity of the company’s activities can be analyzed. The CO module supportsmanagerial decision making.
● The Workflow (WF) module is not a module that automates a specific busi-ness function. Rather, it is a set of tools that can be used to automate any ofthe activities in SAP ERP. It can perform task-flow analysis and prompt employ-ees (by e-mail) if they need to take action. Workflow is ideal for business pro-cesses that are not daily activities, but that occur frequently enough to beworth the effort to implement workflow, such as preparing customer invoices.
To summarize: ERP integrates business functional areas with one another. Before ERP,each functional area operated independently, using its own information systems and waysof recording transactions. ERP software also makes management reporting and decisionmaking faster and more uniform throughout an organization. In addition, ERP promotesthinking about corporate goals, as opposed to thinking only about the goals of a singledepartment or functional area. When top management is queried on the reasons for imple-menting ERP systems, the overriding answer is control. With the capability to see inte-grated data on their entire company’s operation, managers use ERP systems for the controlthey provide, allowing them to set those corporate goals correctly.
SAP ERP Software ImplementationA truly integrated information system entails integrating all functional areas, but for vari-ous reasons, not all companies that use SAP use all of the SAP ERP modules. For example,a company without factories wouldn’t choose the manufacturing-related modules. Anothercompany might consider its HR department’s operations to be so separate from its otheroperations that it would not integrate its HR functional area. Another company mightbelieve that its internally developed production and logistics software gives it a competi-tive advantage, and so it would implement the SAP ERP Financial Accounting and HumanResources modules, but integrate its internally developed production and logistics sys-tem into the SAP ERP system.
Generally, a company’s level of data integration is highest when the company uses onevendor to supply all of its modules. When a company uses modules from different ven-dors, additional software programming must be done to get the modules to work together.Frequently, companies integrate different systems using batch data transfer processes thatare performed periodically. In this case, the company no longer has accurate data avail-able in real-time across the enterprise. Thus, a company must be sure the decision to usemultiple vendors or to maintain a legacy system is based on sound business analysis, not ona resistance to change. Software upgrades of nonintegrated systems are made more prob-lematic because further work must be done to get software from different vendors tointeract. SAP’s NetWeaver development platform (discussed in Chapter 8) eases the inte-gration of SAP ERP with other software products.
The Development of Enterprise Resource Planning Systems
29

Any large software implementation is challenging—and ERP systems are no exception.There are countless examples of large implementations failing, and it’s easy to under-stand why. Many different departments are involved, as are many users of the system, pro-grammers, systems analysts, and other personnel. Without top management commitment,large projects are doomed to fail. More implementation issues are discussed in Chapter 7.
After a company chooses its major modules, it must make an incredibly large num-ber of decisions on how to configure the system. These configuration options allow the com-pany to customize the modules it has chosen to fit the company’s needs. For example, inthe FI module, a business might need to define limits on the dollar value of businesstransactions that an employee can process. This is an important consideration in minimiz-ing the risk of fraud and abuse.
Tolerance Groups
In configuring the SAP system, the company can define tolerance groups, which are specificranges that define these transaction limits. An example of a tolerance group is shown inFigure 2-6. As part of the configuration process, a company can define any number of toler-ance groups with a range of limits and can then assign employees to these tolerance groups.
While SAP has defined the tolerance group methodology as its method for placing limitson an employee, configuration allows the company the flexibility to further tailor thismethodology. Let’s assume an outdoor clothing company places an order in July for 1,000 skijackets. The company receives only 995 in the shipment from the manufacturer, which arrives
FIGURE 2-6 A customization example: tolerance groups to set transaction limits
Chapter 2
30
in September. This delivery, although it is short five ski jackets, is close enough to the origi-nal order that it is accepted as complete. The difference of the five ski jackets represents thetolerance. By defining the tolerance group to accept a variance of a small percentage of theshipment, the company has determined that it is not worth pursuing the five extra ski jackets.Tolerance could indicate a shortage, as in this example, or an overabundance in an order.Thus, an order of 1,005 ski jackets would also be within the tolerance. Tolerance groups shouldbe defined and documented, in part to deal with fraud issues. The clothing company shouldknow the reason for a short order: is it because the order is within the tolerance range, or is itbecause the workers on the loading dock stole five ski jackets?
Features of SAP ERP
Not only was SAP ERP the first software that could deliver real-time ERP integration, it hasother features worthy of note. Its most significant characteristics are usability by largecompanies, high cost, automation of data updates, and applicability of best practices, asdescribed below.
The original SAP R/3 system targeted very large companies. Prior to the developmentof ERP systems, it was assumed that these giants could never have integrated systemsbecause of the sheer amount of computing power required to integrate them. Increasedcomputing speeds, however, meant that large companies in a variety of industries,including manufacturing, gas and oil, airlines, and consulting, could have integrated infor-mation systems.
Acquiring an SAP ERP software system is very expensive. In addition to the cost of thesoftware, many companies find they must buy new hardware to accommodate such pow-erful programs. For a Fortune 500 company, software, hardware, and consulting costs caneasily exceed $100 million. Large companies can also spend $50 million to $100 millionon upgrades. Full implementation of all modules can take years. In fact, most companiesview ERP implementations as an ongoing process, not a one-off project. As implementa-tions are completed in one area of a company, other areas may begin an implementation orupgrade a previous implementation.
The modular design of SAP ERP is based on business processes, such as sales order han-dling, materials requirement handling, and employee recruiting. When data are enteredinto the system, data in all related files in the central database are automatically updated.No human input is required to make the changes.
Before the development of SAP ERP, IS people felt that software should be designed toreflect a business’s practices. Companies sought vendors to write software to fit their busi-ness processes. As SAP accumulated experience developing information systems, how-ever, the company began to develop models of how certain industries’ business processesshould be managed. Thus, SAP ERP’s design incorporates best practices, which meansthat SAP’s software designers choose the best, most efficient ways in which business pro-cesses should be handled. If a user’s business practices don’t follow one of the best prac-tices incorporated in the SAP ERP design, then the business must redesign its practices soit can use the software, sometimes fitting their business processes to the software’s bestpractices. Although some customization is possible during implementation, companies findthey must still change some of the ways they work to fit the software.
The Development of Enterprise Resource Planning Systems
31
E R P F O R M I D S I Z E D C O M P A N I E S
By 1998, most of the Fortune 500 companies had already installed ERP systems, so ERPvendors refocused their marketing efforts on midsized companies (those with fewer than1,000 employees). Midsized companies represented a ripe, profitable market. Forexample, midsized European companies have a total yearly budget of $50 billion for ITexpenditures. The American market is even larger. SAP anticipates its business from mid-sized companies to rise to 40–45 percent of new orders by 2010, up from 30 percent in2007. To appeal to this new market, SAP developed SAP All-in-One, a single package con-taining specific, preconfigured bundles of SAP ERP tailored for particular industries, suchas automotive, banking, chemicals, and oil and gas. Because it is tailored to specific indus-tries, SAP All-in-One can be installed more quickly than the standard ERP product.
At the time this book was published, SAP was working on the development of a newproduct, code-named “A1S.” A1S is based on the SAP NetWeaver platform, and provides asolution designed specifically for fast-growing midsized companies with limited ITresources.
Application hosting, in which a third-party company provides the hardware and soft-ware support, rather than an internal IS department, is also making ERP systems like SAPmore appealing to midsized companies.
SAP and Oracle also have some competition from smaller providers of ERP software.For example, Exact Software’s ERP package, called e-Synergy, has similar functionality tothe larger products, with seven modules: Human Resources, Document Managing, Finan-cials, Logistics, CRM (Customer Relationship Management), Procurement, and Project. Thecompany, headquartered in the Netherlands, targets small-to-midsized companies. Also, in2000, software giant Microsoft acquired Great Plains, a provider of ERP software. Thecompany’s ERP products, now called Microsoft Dynamics, are designed for the small busi-ness market and offer a line of different software solutions. SAP has responded by creat-ing SAP Business One, ERP systems for small business. It is interesting to note that whileSAP and Microsoft are competing for the small business ERP market, they are also col-laborating on other projects (see Chapter 8 for a discussion of the Duet product).
Responses of the Software to the Changing MarketIn the mid-1990s, many companies complained about the difficulty of implementing theSAP R/3 system. SAP faced a canceled implementation by Dell Computers, a lengthy imple-mentation at Owens Corning, and a lawsuit by the now-defunct FoxMeyer drug company.Cadbury experienced a surplus of chocolate bars at the start of 2006 in part due to atroubled ERP implementation. In response, SAP developed the Accelerated SAP (ASAP)implementation methodology, a framework for implementing systems, to ease the imple-mentation process. SAP has continued developing implementation methodology; the lat-est version, Solution Manager, is designed to greatly speed the implementation process.
SAP continues to extend the capabilities of SAP ERP with additional, separate prod-ucts that run on separate hardware and that extract data from the SAP ERP system. In manycases, these products provide more flexible and powerful versions of tools available in theSAP ERP system. The Business Warehouse (BW) product is an example of one suchsolution. Customers needing more capability and flexibility beyond the standard SD, PP,
Chapter 2
32
and FI modules can add BW. BW runs on a separate server and lets the user define uniquereporting and analysis methods and integrate information from other systems. The down-side of the BW product is that it represents another system for the user to purchase andimplement. BW is now being referred to as BI, or Business Intelligence. At the moment, thetwo acronyms are interchangeable with reference to SAP. McKesson Pharmaceutical runsBI to find any inventory adjustments quickly and remedy the problem. At McKesson,products have high prices, low profit margins, and a limited shelf life. The company’s BI sys-tem highlights problems immediately, not months after a product has expired.
The SAP ERP system provides some tools to manage customer interactions and ana-lyze the success of promotional campaigns, but SAP sells a separate program called Cus-tomer Relationship Management (CRM), which has extended customer servicecapabilities. SAP’s CRM product is designed to compete with CRM systems from competi-tors such as Siebel.
SAP addresses the issue of Internet-based data exchange with an integration platformcalled NetWeaver, which allows users to connect to SAP products through the Internet.
Like all technology, ERP software and related products are constantly changing. Thus,the challenge for a company is not only to evaluate an ERP vendor’s current product offer-ings, but also to assess its development strategies and product plans.
C H O O S I N G C O N S U L T A N T S A N D V E N D O R S
Because ERP software packages are so large and complex, one person can’t fully under-stand a single ERP system; it is also impossible for an individual to compare various systems.So, before choosing a software vendor, most companies study their needs and then hire anexternal team of software consultants to help choose the right software vendor(s) and thebest approach to implementing ERP. Working as a team with the customer, the consult-ants apply their expertise to selecting an ERP vendor (or vendors) that will best meettheir customer’s needs.
After selecting a vendor, the consultants recommend the modules that are best suitedto the company’s operations and the configurations within those modules that are mostappropriate. This preplanning should involve not only the consultants and a company’s ITdepartment, but the management of all functional business areas as well.
T H E S I G N I F I C A N C E A N D B E N E F I T S O F E R PS O F T W A R E A N D S Y S T E M S
The significance of ERP lies in its many benefits. Recall that integrated information sys-tems can lead to more efficient business processes that cost less than those in uninte-grated systems. In addition, ERP systems offer the following benefits:
● ERP allows easier global integration: Barriers of currency exchange rates, lan-guage, and culture can be bridged automatically, so data can be integratedacross international borders.
● ERP integrates people and data while eliminating the need to update and repairmany separate computer systems. For example, Boeing had 450 data systemsthat fed data into its production process. The company now has a single wayto record production data.
The Development of Enterprise Resource Planning Systems
33

● ERP allows management to manage operations, not just monitor them. Forexample, without ERP, getting an answer to “How are we doing?” requires get-ting data from each business unit and then analyzing that data for a compre-hensive, integrated picture. The ERP system already has all the data,allowing the manager to focus on improving processes. This focus enhancesmanagement of the company as a whole, and makes the organization moreadaptable when change is required.
An ERP system can dramatically reduce costs and improve operational efficiency. Forexample, Rohm and Haas, the $8 billion chemical company, claims to have doubled rev-enue per employee over the past six years through productivity improvements due to anSAP implemenation. These improvements can lead to lower costs and more satisifiedcustomers. Toyota anticipates savings of $7 million from its new ERP system, which allowsemployees to access their own human resource records and gives group leaders access toshop floor information on employees. Toyota is saving an additional $50,000 annuallyby providing access to HR software through a Web browser, meaning that the company doesnot have to install or support HR software on worker’s desktops.
Q U E S T I O N S A B O U T E R P
How Much Does an ERP System Cost?Cost of an ERP system includes several factors:
● The size of the ERP software, which corresponds to the size of the companyit serves
● The need for new hardware that is capable of running complex ERP software● Consultants’ and analysts’ fees● Time for implementation (which causes disruption of business)● Training (which costs both time and money)
A large company, one with well over 1,000 employees, will likely spend $50 million to$500 million for an ERP system with operations involving multiple countries, currencies,languages, and tax laws. Such an installation might cost as much as $30 million in soft-ware license fees, $200 million in consulting fees, additional millions to purchase newhardware, and even more millions to train managers and employees—and full implementa-tion of the new system might take four to six years.
A midsized company (one with fewer than 1,000 employees) might spend $10 millionto $20 million in total implementation costs and have its ERP system up and running inabout two years.
Should Every Business Buy an ERP Package?ERP packages imply, by their design, a certain way of doing business, and they require usersto follow that way of doing business. Some of a business’s operations, and some seg-ments of its operations, might not be a good match with the constraints inherent in ERP.Therefore, it is imperative for a business to analyze its own business strategy, organiza-tion, culture, and operation before choosing an ERP approach.
Chapter 2
34

An article in the Harvard Business Review provides examples that show the value ofplanning: “Applied Materials gave up on its system when it found itself overwhelmed by theorganization changes involved. Dow Chemical spent seven years and close to half a bil-lion dollars implementing a mainframe-based enterprise system; now it has decided tostart over again on a client-server version.” In another example, Kmart in 2002 wrote off$130 million because of a failed ERP supply chain project. At the time, Kmart was nothappy with its existing supply chain software, and it attempted to implement another prod-uct too quickly. In addition, the CIO left the company and new management wanted tomake some changes.
The giant U.S. retailer Wal-Mart has chosen not to purchase an ERP system, but to writeall its software in-house. Wal-Mart’s philosophy is that the global strategic business pro-cess drives the technology. IT personnel are encouraged to consider the merchandisingaspect of a process first and foremost, and then let the technology follow.
Sometimes, a company is not ready for ERP. In many cases, ERP implementation dif-ficulties result when management does not fully understand its current business pro-cesses and cannot make implementation decisions in a timely manner. An advantage of anERP system is that it can reduce costs by streamlining business processes. If a companyis not prepared to change its business processes to make them more efficient, then it willfind itself with a large bill for software and consulting fees, with no improvement in orga-nizational performance.
Is ERP Software Inflexible?Although many people claim that ERP systems, especially the SAP ERP system, are rigid,SAP ERP does offer numerous configuration options that help businesses customize thesoftware to fit their unique needs. In addition, programmers can write specific routines forspecial applications in SAP’s internal programming language, called Advanced BusinessApplication Programming (ABAP). The integration platform, NetWeaver, offers further flex-ibility in adding both SAP and non-SAP components to a company’s IT infrastructure.Companies should be careful about how much custom programming they include in theirimplementations, because they might re-create their existing information systems in anew software package, instead of gaining the benefits of improved, integrated businessprocesses. In its implementation of PeopleSoft, FedEx Corporation installed the sys-tems for financial and HR functions with little or no modification.
Once an ERP system is in place, trying to reconfigure it while retaining data integrityis expensive and time-consuming. That is why thorough pre-implementation planning isso important. It is much easier to customize an ERP program during system configurationand before any data have been stored.
What Return Can a Company Expect from Its ERP Investment?The financial benefits provided by an ERP system can be difficult to calculate becausesometimes ERP increases revenue and decreases expenses in intangible ways that are dif-ficult to measure. Also, some changes take place over such a long period of time that theyare difficult to track. Finally, the old information system may not be able to provide good
The Development of Enterprise Resource Planning Systems
35

data on the performance of the company before the ERP implementation, making compari-son difficult. Still, the return on an ERP investment can be measured and interpreted inmany ways:
● Because ERP eliminates redundant effort and duplicated data, it can generatesavings in operations expense. Because an ERP system can help produce goodsand services more quickly, more sales can be generated every month.
● In some instances, a company that doesn’t implement an ERP system mightbe forced out of business by competitors that have an ERP system—how doyou calculate the monetary advantage of remaining in business?
● A smoothly running ERP system can save a company’s personnel, suppliers,distributors, and customers much frustration—a benefit that is real, but diffi-cult to quantify.
● Because both cost savings and increased revenues occur over many years, itis difficult to put an exact dollar figure to the amount accrued from the origi-nal ERP investment.
● Because ERP implementations take time, there may be other business fac-tors affecting the company’s costs and profitability, making it difficult to iso-late the impact of the ERP system alone.
● ERP systems provide real-time data, allowing companies to improve externalcustomer communications. Better communication can improve customer rela-tionships and increase sales.
How Long Does It Take to See a Return on an ERP Investment?A return on investment (ROI) is an assessment of an investment project’s value, calculatedby dividing the value of the project’s benefits by the project’s cost. An ERP system’s ROI can bedifficult to calculate because of the many intangible costs and benefits previously mentioned.Some companies do not even try to make the calculation, on the grounds that the packageis as necessary as having electricity (which is not justified as an investment project). Compa-nies that do make the ROI calculation have seen widely varying results. Some ERP consult-ing firms refuse to do ERP implementations unless their client company performs an ROI.Peerstone Research reported on over 200 companies using SAP or Oracle ERP systems andfound that 38 percent of survey respondents do not do formal ROI evaluations.
In the Peerstone Research study, 63 percent of companies that did perform the calcu-lation reported a positive ROI for ERP. Manufacturing firms are more likely to see a posi-tive ROI than government or educational organizations. However, most companies felt thatnonfinancial goals were the reason behind their ERP installations. Seventy-one percentof those companies surveyed said that the goal behind the ERP installation wasimproved management vision. Although Nestlé USA has had problems with its ERPimplementation, it estimated a cost savings of $325 million, after spending six years andover $200 million on the implementation.
Toro, a wholesale lawnmower manufacturer, spent $25 million and four years to imple-ment an ERP system. At first, ROI was difficult for Toro to quantify. Then, the emer-gence of an expanded customer base of national retailers, such as Sears and Home Depot,made it easier to quantify benefits. For example, Toro was able to gain a yearly savings of$10 million in inventory reduction—the result of better production, warehousing, and dis-tribution methods.
Chapter 2
36
Why Do Some Companies Have More Success with ERP Than Others?Early ERP implementation reports indicated that only a low percentage of companiesexperienced a smooth rollout of their new ERP systems and immediately began receivingthe benefits they anticipated. You should put such reports into perspective. All kinds ofsoftware implementations can suffer from delays, cost overruns, and performance prob-lems, not just ERP projects. Such delays have been a major problem for the IS industrysince the early days of business computing. Nevertheless, it is worth thinking specificallyabout why ERP installation problems can occur.
You can find numerous cases of implementation woes in the news. W. L. Gore, themaker of GoreTex, had some problems implementing its PeopleSoft system for personnel,payroll, and benefits. The manufacturer sued PeopleSoft, Deloitte & Touche LLP, andDeloitte Consulting for incompetence. W. L. Gore blamed the consultants for not under-standing the system and leaving its Personnel department in a mess. PeopleSoft consult-ants were brought in to fix the problems, but the fix cost W. L. Gore additional hundreds ofthousands of dollars.
Hershey Foods (now The Hershey Company) had a rough rollout of its ERP system in1999, due to what experts say was the “Big Bang” approach to implementation, in whichhuge pieces of the system are implemented all at once. Companies rarely use this approachbecause it is so risky. Hershey lost a large share of the Halloween candy market that yeardue to ERP problems from this poor implementation. Hershey’s order-processing andshipping departments had glitches that were being fixed as late as September that year.
Usually, a bumpy rollout and low ROI are caused by people problems and misguidedexpectations, not computer malfunctions. For example:
● Some executives blindly hope that new software will cure fundamental busi-ness problems that are not curable by any software. The root of the problemmay lie in flawed core business processes. Unless the company changes itsbusiness processes, it will just be computerizing a bad way to do business.
● Some executives and IT managers don’t take enough time for a proper analy-sis during the planning and implementation phase.
● Some executives and IT managers skimp on employee education and training.● Some companies do not place the ownership or accountability for the imple-
mentation project on the personnel who will operate the system. This lack ofownership can lead to a situation in which the implementation becomes anIT project rather than a company-wide project.
● Unless a large project such as an ERP installation is promoted from the topdown, it is doomed to fail. The top executives must be behind the project 100percent for it to be successful.
● ERP implementation brings a tremendous amount of change for the users. Man-agers need to manage that change well so that the implementation goessmoothly.
Many ERP implementation experts stress the importance of proper education and train-ing for both employees and managers. Most people will naturally resist changing the waythey do their jobs. Many analysts have noted that active top management support is cru-cial for successful acceptance and implementation of such company-wide changes.
The Development of Enterprise Resource Planning Systems
37

Some companies willingly part with funds for software and new hardware, but don’tproperly budget for employee training. ERP software is complex and can be intimidating atfirst. This fact alone supports the case for adequate training. Gartner Research recom-mends allocating 17 percent of the project’s budget for training. Those companies spend-ing less than 13 percent on training are three times more likely to have problems. Thecost includes training employees on how to use the software to do their job, employees’ non-productive downtime during training, and—very important—educating employees abouthow the data they control affect the entire business operation.
Nestlé has learned many lessons from its implementation of ERP systems. Its six-year, $210million project was initially headed for failure because Nestlé didn’t include on the implemen-tation team any employees from the operating groups affected. Employees left the com-pany, morale was down, and help desk calls were up. After three years, the ERP implementationwas temporarily stopped. Nestlé USA’s vice president and CIO at that time, Jeri Dunn, learnedthat the project was not about implementing the software, but about change management.“When you move to SAP, you are changing the way people work. . . . You are challenging theirprinciples, their beliefs and the way they have done things for many, many years,” said Dunn.After addressing the initial problems, Nestlé ultimately reaped benefits from its ERPinstallation.
For many users, it takes years before they can take advantage of many of an ERP sys-tem’s capabilities. Most ERP installations do generate returns, and news coverage nowfocuses on how companies gain value from their existing systems or are upgrading and add-ing functionality to their existing ERP systems. Del Monte Foods needed to meet Wal-Mart’s and Target’s requirements for package tracking using radio frequency identificationdevices (RFIDs), so approximately a year after its ERP system installation, the companytied its RFID applications into its existing SAP platform and is working to make the sup-ply chain efficient.
A N O T H E R L O O K
Digitizing the Depot: Beyond the No. 2 Pencil
When CIO Bob DeRodes joined Home Depot in 2001, he described the company’s technol-ogy as consisting of the No. 2 pencil. Home Depot has come a long way since 2001. In2005, the company was opening a new store every 24 hours; in the first six months of 2007,Home Depot opened 47 new stores. A No. 2 pencil couldn’t keep up with all thatexpansion! A solid ERP system is the only type of system that could handle that growth.In fact, when asked if Home Depot could use open source software, DeRodes said, “Bigcompanies need big software companies.” In keeping with this statement, in 2002, HomeDepot began a 10-year implementation of SAP software.
The implementation will help Home Depot in areas such as supply chain managementand connecting electronically to its suppliers. SAP is already helping out in the four areas ofHome Depot’s expansion plans: international sales, Web sales, in-home installation, and salesto contractors. SAP’s scalability is a good fit for Home Depot’s expansion plans.
continued
Chapter 2
38
Home Depot has some other lofty goals for the new system. The company will even-tually allow each store employee to pull up detailed information about the product thatis being sold. This information will include availability and uses. In addition, employees willhave access to customer information. The product and customer data will be available atthe checkout kiosk and also through a hand-held device.
Home Depot also uses business analytics to help manage pricing changes, which willdiffer from store to store. For example, if customers in one city are hesitant to buy a cer-tain item, that particular item’s price might be lowered for that store only. Also, HomeDepot is embracing the service-oriented architecture of SAP’s NetWeaver, as a way to linkdifferent software applications seamlessly.
Questions:
1. What type of information needs does a large and very rapidly expanding com-pany like Home Depot have? Does a traditional ERP system meet those needs?
2. Research open source software. Why do you think the CIO implied that opensource software is not appropriate for a large company like Home Depot?
T H E C O N T I N U I N G E V O L U T I O N O F E R P
Understanding the social and business implications of new technologies is not easy.Howard H. Aiken, the pioneering computer engineer behind the first large-scale digital com-puter, the Harvard Mark I, predicted in 1947 that only six electronic digital computerswould be needed to satisfy the computing needs of the entire United States! Hewlett-Packard passed up the opportunity to market the computer created by Steve Wozniakthat became the Apple I. Microsoft founder Bill Gates did not appreciate the importanceof the Internet until 1995, by which time Netscape controlled the bulk of the Internetbrowser market. (Gates, however, did dramatically reshape Microsoft around an Inter-net strategy by the late 1990s. Its Internet Explorer browser is more commonly used thanany other.) Thus, even people who are most knowledgeable about a new technology do notalways fully understand its capabilities or how it will change business and society.
ERP systems have been in common use only since the mid-1990s. As this young tech-nology continues to mature, ERP vendors are working to solve the adaptability problemsthat plague customers. The demand for new ERP installations is still going strong. AMRResearch has calculated that, in 2005, companies spent $14.5 billion on licenses andmaintenance.
The Development of Enterprise Resource Planning Systems
39
A N O T H E R L O O K
Implementation Problems at Universities
ERP systems are attractive to universities for the same reasons that they are attractive tobusiness organizations: control, accurate information, and centralized systems, all in realtime. However, implementing ERP systems at universities has posed some uniqueproblems. By nature, universities are not integrated organizations. Each department oper-ates separately and autonomously, so trying to tie everyone together is difficult enough.Furthermore, university IT personnel are not as experienced as those in large compa-nies, implementations are often rushed, and testing and training often have beeninadequate.
Universities have been attracted to ERP systems since the mid-1990s, when theirlegacy systems were unable to keep up with increasing technology demands. There weretoo many legacy systems to maintain, and new systems couldn’t be developed in-housebecause of a lack of staff and experience; ERP seemed like a good alternative. PeopleSoftaggressively marketed to universities and by the end of 2004 had 730 installations in col-leges and universities.
Some universities have had a particularly difficult time with implementation. Stan-ford University began its PeopleSoft implementation in 2001. Stanford users complain thatcompleting tasks takes longer than it did prior to the ERP system installation, while theuniversity’s IT department complains that the new system is more expensive to supportthan the prior system. Users at Stanford have been hesitant to adopt the new system, andmany of those who are using it are requesting further customization. Lacking widespreaduse at this stage, the installation of this multimillion dollar system cannot be consid-ered a complete success. Most of the problems related to the PeopleSoft installation arepeople problems; as with many corporate ERP implementations, the university and itsIT department are coping with a tight budget and, consequently, providing little training.Although training was offered to the users, few participated.
The University of Massachusetts’s PeopleSoft system was down for four days duringthe critical drop/add period in 2004, leaving 24,000 students in the lurch. The glitch wastraced to a lack of testing. Cleveland State sued PeopleSoft because the college’s soft-ware was “unusable” and the university had to install an alternative software package toprocess accounts receivables. In February 2005, Oracle, which now owns PeopleSoft,settled the suit for $4.25 million.
The University of Delaware has taken a slow approach to its PeopleSoftimplementation. The first department to use the software was HR, for payroll. The univer-sity chose HR because the department is small. The next phase for the implementationwas the university-wide financials. The last phase, and the largest phase, has been the stu-dent records. There have been a few hiccups, as in all implementations, but in general,it has gone smoothly.
Question:
1. Research the PeopleSoft corporation, and explain why its software is an attrac-tive ERP package for higher education.
Chapter 2
40

Additional Capabilities Within ERPSales production, data analysis, and Internet connectivity are a few areas where ERP ven-dors are expanding ERP capabilities. As discussed previously, ERP vendors and other soft-ware companies are continuing to develop Customer Relationship Management (CRM)applications that increase the efficiency of the sales force. For example, if salespeople cantarget the most profitable customers—actual and potential—they’ll have a competitiveadvantage (you will learn more about CRM in Chapter 3). Other software focuses ondetecting changes in customer satisfaction and responding quickly to remedy any problems.
Supply Chain Management (SCM) is one area that can benefit from ERP. SCM applica-tions help to translate customer demand into production plans more efficiently. For example,SAP’s Advanced Planner and Optimizer module provides sales representatives with a GlobalAvailable-to-Promise (ATP) capability. Global ATP allows the sales representatives to instantlycheck all available plants and warehouses in the company to find the best option for meet-ing a customer order in a timely and cost-efficient way. If an office supply company sends anorder for 100 computer printers to a printer manufacturer, specifying delivery the followingweek, the manufacturer will look at its inventory of printers and production of printers. Tradi-tionally, if the manufacturer has 100 printers in inventory, and 100 printers are to be manu-factured the following week, the manufacturer will assign the items in inventory to the officesupply company. This process handled in ATP would assign the future manufacturing run tothe office supply company because the printer manufacturer could receive an additional orderfor 100 printers that needs to be filled immediately.
ERP developers are also trying to make their existing systems smarter by extending ERP’scapabilities into more areas of decision support, management reporting, and data mining. Datamining is the statistical and logical analysis of large sets of transaction data, looking for pat-terns that can aid decision making. For example, discovering patterns in customer behavior canlead to better marketing efforts. Strategic Enterprise Management (SEM) applications help acompany translate corporate-level goals (such as profit and market share targets) into opera-tional decisions (such as production plans and workforce levels).
Internet connectivity is another area in which ERP capabilities are expanding. ERP ven-dors continue to improve software and Internet connections that integrate a business’sinternal operations, while also integrating the business with its dealers, vendors, andcustomers. Web services is one area that is receiving a lot of attention.
The InternetThe Internet’s rapid development since the mid-1990s has been a threat to ERP softwaredevelopers. ERP software lets users access the company’s software and central databasethrough internal connections. Now, users often need to access that central databasedirectly from the Internet. Access through the Internet allows for greater flexibility in workbecause all one needs is a computer with an Internet connection and a Web browser. Thisaccessibility has forced ERP companies to rethink how users get to and use their ERPsoftware. ERP developers have been incorporating Web-based systems with their ERPproducts. This effort is typified by SAP’s NetWeaver, an application that lets companies addcomponents to their SAP ERP systems, and also allows external partners to access cer-tain parts of the company’s ERP system. Such open access is a necessity for the successof Internet-based business activities such as electronic commerce (or e-commerce), the
The Development of Enterprise Resource Planning Systems
41

conduct of business over the Internet. The Internet has become an important way to sellgoods and services and will probably become more important in the future. Companies willhave a continuing need to take orders electronically and to pass them seamlessly to thecompany’s database. Once the order is in the database, the ERP system can manage thetransaction as if it had come in through a traditional method, such as the telephone.
In conducting e-commerce, companies put a lot of focus on their sites’ Web inter-faces, spending great amounts of time and money to ensure that the site works smoothly.However, a company that intends to sell its products on the Web must still manage its busi-ness processes. Some experts have speculated that e-commerce will make ERP systemsobsolete, but ERP is not likely to disappear. Rather, e-commerce is another activity thatERP systems can help manage.
As ERP installations continue to grow, so does interest in Web services, or, as it is fre-quently called, service-oriented architecture (SOA). Web services are software thatenables systems to exchange data without complicated software links. This capability allowscompanies to quickly launch new businesses, partnerships, and technology. A nonbusi-ness example of service-oriented architecture is the use of Craigslist and Google Maps to dis-play rental property. These are two separate applications that work together on a third-party Web site. If you were searching Craigslist for an apartment in San Francisco, you couldclick the Google map link under the apartment listing and see exactly where it is located.Web services also make ERP systems easier to manage, especially when interfacing withother applications and the Web. For example, Apple was able to launch its iTunes store inthree months by using SOA with SAP running as the back-office system. This shift from thetraditional ERP client-server system to the service-oriented architecture is gainingmomentum. SAP’s NetWeaver platform serves the same role as SOA.
A N O T H E R L O O K
Whirlpool and Web Services: Maximizing Value from an ERP System
Whirlpool is moving beyond the traditional ERP system into Web services for its Web siteand phone support system. Using SAP’s NetWeaver’s service-oriented architecture, Whirl-pool can be more flexible and responsive.
Whirlpool can outsource its Web page portal design because with service-orientedarchitecture, the Web page is separated from the underlying order-processing system. Infact, Whirlpool has been able to change its Web page in two to three days with this newflexibility, which extends to nonstandard devices such as PDAs.
In Whirlpool’s phone support, three different areas are linked—the phone system, theproduct-tracking system, and the production system—which results in more efficiency.Note that these three areas originate from one in-house system and two different soft-ware systems.
Questions:
1. Research service-oriented architecture. Write a detailed definition and give anexample.
2. Imagine you run a financial services company. How would service-orientedarchitecture help you in running your business?
Chapter 2
42

Chapter Summary
Several factors led to the development of ERP:
● The speed and power of computing hardware increased exponentially, while cost andsize decreased.
● The early client-server architecture provided the conceptual framework for multiple userssharing common data.
● Increasingly sophisticated software facilitated integration, especially in two areas: A/Fand manufacturing resource planning.
● The growth of business size, complexity, and competition made business managersdemand more efficient and competitive information systems.
● SAP AG produced a complex, modular ERP program called R/3.The software could inte-grate a company’s entire business by using a common database that linked all opera-tions, allowing real-time data sharing and streamlined operations.
● SAP R/3, now called SAP ERP, is modular software offering modules for Sales and Distri-bution, Materials Management, Production Planning, Quality Management, and other areas.
● ERP software is expensive to purchase and time-consuming to implement, and it requiressignificant employee training—but the payoffs can be spectacular. For some compa-nies, however, the ROI may not be immediate or even calculable.
● Experts anticipate that ERP’s future focus will be on managing customer relationships,improving planning and decision making, and linking operations to the Internet and otherapplications through service-oriented architecture.
Key Terms
Advanced Business ApplicationProgramming (ABAP)
Asset Management (AM) module
Best practices
Client-server architecture
Controlling (CO) module
Data mining
Database management system (DBMS)
Electronic commerce (e-commerce)
Electronic data interchange (EDI)
Financial Accounting (FI) module
Human Resources (HR) module
Legacy system
Materials Management (MM) module
Material requirements planning (MRP)
Modules
Open architecture
Plant Maintenance (PM) module
Production Planning (PP) module
Project System (PS) module
Quality Management (QM) module
R/3
Return on investment (ROI)
Sales and Distribution (SD) module
SAP ERP
Scalability
Service-oriented architecture (SOA)
Silo
Tolerance groups
Web services
Workflow (WF) module
The Development of Enterprise Resource Planning Systems
43

Exercises
1. Define Moore’s Law and explain why it is significant in the development of ERP. Is Moore’sLaw still holding?
2. What are the main characteristics of an ERP system? What are some newly developed fea-tures of ERP systems?
3. Imagine that you have been appointed the chief information officer of a start-up companythat rents out DVDs via the Internet. An integrated information system is critical to yourbusiness. Write a proposal to the CEO highlighting the reasons why you need an ERPsystem. Use examples, gleaned from the Internet, of other companies’ systems to aug-ment your proposal.
4. Much has been written about ERP, both in the news media and on the Internet. Using libraryresources or the Internet, report on (1) one company’s positive experience with implement-ing ERP, and (2) one company’s disappointing experience.
5. Although ERP software packages have similar features, there are some differences betweenthem. Document how Oracle’s ERP systems and Microsoft’s Dynamics differ from those of SAP.Visit www.oracle.com to research the “Applications” area, and visit www.microsoft.com.
6. Visit the online magazine CIO.com and conduct a search on ERP. Choose an example ofan ERP implementation and write a memo to your instructor describing the procedure. Makecomments as to areas in which the company could have improved its implementation.
For Further Study and Research
Allesch, Adolf. “Thriving or Surviving? How to Take Your SAP NetWeaver Pulse.” SAPNetWeaver Magazine 03, no. 3 (Summer 2007). http://www.sap.com/community/pub/flash/kw28_07_story_2.epx.
Blau, John. “SAP arrives at Home Depot.” InfoWorld, June 1, 2005. http://www.infoworld.com/article/05/06/01/HNsaphomedepot_1.html?SUPPLY%20CHAIN%20MANAGEMENT.
“Whirlpool whirls into Web services.” InfoWorld, May 23, 2006. http://www.infoworld.com/article/06/05/23/78591_HNwhirlpoolwebservices_1.html?WEB%20SERVICES%20DEVELOPMENT.
Burleson, Donald. “Four factors that shape the cost of ERP.” TechRepublic, August 16, 2001.http://search.techrepublic.com.com/index.php?q=Four+factors+that+shape+the+cost+of+ERP&t=11&go=Search.
“Connecting the Chemical Industry.” Chemical Week, September 25, 2002.Davenport, Thomas H. “Putting the Enterprise into the Enterprise System.” Harvard
Business Review, July–August 1998, 121–31.Foroohar, Rana. “Software Savior?” Newsweek, January 29, 2007. http://www.msnbc.msn.com/id/
16692270/site/newsweek/.Few, Stephen. “The Information Cannot Speak for Itself.” IntelligentEnterprise.com,
July 10, 2004. http://www.intelligententerprise.com/showArticle.jhtml;jsessionid=0VWVEUEXBJOASQSNDLPCKH0CJUNN2JVN?articleID=22102226.
Forbes.com. “SAP sees orders from mid-sized businesses climbing to 45% from 30% by 2010.”Forbes.com, April 13, 2007. http://www.forbes.com/afxnewslimited/feeds/afx/2007/04/13/afx3609185.html.
Chapter 2
44

Greenbaum, Joshua. “The Ecosystem Advantage: It’s Not Nice to Fool Mother Nature.” SAPNetWeaver Magazine 03, no. 3 (Summer 2007). http://www.sapnetweavermagazine.com/archive/Volume_03_(2007)/Issue_03_(Summer)/v3i3a02.cfm?session=.
Hamerman, Paul and R. Wang. “ERP: Still a Challenge After All These Years.” Information Week,July 11, 2005. http://www.informationweek.com/showArticle.jhtml?articleID=165600651.
Kirkpatrick, David. “The E-Ware War.” Fortune, December 7, 1998, 102–112.Kumar, Kuldeep and Jos van Hillegersberg. “ERP Experiences and Evolution.”
Communications of the ACM, 43, no. 4 (April 2000): 23–26.MacDonald, Elizabeth. “W. L. Gore Alleges PeopleSoft, Deloitte Botched a Costly Software
Installation.” The Wall Street Journal, November 2, 1999.McCue, Andy. “Too Much Candy: IT Glitch Costs Cadbury.” BusinessWeek, June 8, 2006. http://
www.businessweek.com/globalbiz/content/jun2006/gb20060608_252289.htm?chan=search.Meissner, Gerd. SAP: Inside the Secret Software Power. New York: McGraw-Hill, 2000.Montgomery, Nigel. “European Retailers Divided Over ERP Versus Best of Breed.” Tech Update,
April 18, 2003. http://techupdate.zdnet.com/techupdate/stories/main/0%2C14179%2C2913405%2C00.html.
Nadeau, Michael. “5 Keys to McKesson’s Rapid BI Transformation.” SAP NetWeaverMagazine 1, no. 1 (2005).
Nelson, Emily and Evan Ramstad. “Hershey’s Biggest Dud Is Its New Computer System.” The WallStreet Journal, November 4, 1999.
Nolan, Sean. “By the Numbers: November 2003.” Baseline.com, November 1, 2003.http://www.baselinemag.com/article2/0,1540,1374440,00.asp.
Osterland, Andrew. “Blaming ERP.” CFO.com, January 1, 2000. http://www.cfo.com/article.cfm/2987370.
Peerstone Research. “ERP ROI: Myth and Reality.” Information Week, March 29, 2004.http://www.informationweek.com/reports/showReport.jhtml;jsessionid=5WZPDA3FLJXX0QSNDLQSKHSCJUNN2JVN?articleID=18600087&_requestid=16698.
PeopleSoft Case Studies. 2002. http://www.peoplesoft-hp.com/tools/successstories/%5Bfiles%5D/Enterprise/Automotive/Toyota%20Motor%20Manufacturing%20NA%20Drives%20Real-Time%20Productivity%20with%20PeopleSoft%208%20HRMS%20and%20Enterprise%20Portal.pdf.
SAP.com. “SAP Customer Success Story Chemicals: Rohm and Haas – MySAP Business SuiteAids in Drive for Six Sigma Business Process Improvement.” SAP.com, 2007.
Schneider, Polly. “Human Touch Sorely Needed in ERP.” CIO, March 2, 1999. http://www.cnn.com/TECH/computing/9903/02/erpeople.ent.idg/index.html.
Slater, Derek. “How to Choose the Right ERP Software Package,” CIO, February 16, 1999.http://www.cnn.com/TECH/computing/9902/16/erppkg.ent.idg/index.html.
Sliwa, Carol. “IT difficulties help take Kmart Down.” Computerworld, January 28, 2002.Stein, Tom. “Making ERP Add Up.” Information Week, May 24, 1999.Steinert-Threlkeld, Tom. “Home Depot Hopes SAP Can Help Boost Sales.” Baseline,
May 18, 2005. http://www.baselinemag.com/article2/0,1397,1817341,00.asp.Sullivan, Laurie. “ERPzilla.” InformationWeek, July 11, 2005. http://www.informationweek.com/
story/showArticle.jhtml?articleID=165700832.
The Development of Enterprise Resource Planning Systems
45
van Everdingen, Yvonne, Jos van Hillegersberg, and Eric Waarts. “ERP Adoption byEuropean Midsize Companies.” Communications of the ACM 43, no. 4 (April 2000): 27–31.
Wailgum, Thomas. “University ERP: Big Mess on Campus.” CIO, May 1, 2005. http://www.cio.com/article/107706/.
Westervelt, Robert. “U.S. software sales boost SAP earnings, says CEO.” SearchSAP.com, April22, 2004. http://searchsap.techtarget.com/originalContent/0,289142,sid21_gci961032,00.html.
Wheatley, Malcolm. “ERP Training Stinks.” CIO, June 1, 2000.White, Joseph B., Don Clark, and Silvia Ascarelli. “Program of Pain.” The Wall Street
Journal, March 14, 1997.Whiting, Rick. “At SAP, R/3 Is a Distant Memory.” InformationWeek, July 24, 2006.
http://www.informationweek.com/story/showArticle.jhtml?articleID=190900725.Whiting, Rick. “Home Depot Looks to SAP As It Modernizes.” InformationWeek, May 23, 2005.
http://www.informationweek.com/story/showArticle.jhtml?articleID=163106241.Worthen, Ben. “Extreme ERP Makeover: How to Determine If a Single-Instance ERP
Implementation Is Right for You.” CIO, November 15, 2003. http://www.cio.com/article/31964/How_to_Determine_If_a_Single_Instance_ERP_Implementation_is_Right_for_You.
Worthen, Ben. “Nestle’s ERP Odyssey.” CIO, May 15, 2002. http://www.cio.com/article/31066/Nestle_s_Enterprise_Resource_Planning_ERP_Odyssey.
Chapter 2
46

C H A P T E R 3MARKETINGINFORMATION SYSTEMSAND THE SALES ORDERPROCESS
L E A R N I N G O B J E C T I V E S
After completing this chapter, you will be able to:
● Describe the unintegrated sales processes of the fictitious Fitter Snackercompany.
● Explain why unintegrated Sales and Marketing information systems leadto company-wide inefficiency, higher costs, lost profits, and customerdissatisfaction.
● Discuss sales and distribution in the SAP ERP system, and explain howintegrated data sharing increases company-wide efficiency.
● Describe how SAP ERP processes a standard sales order.
● Describe the benefits of customer relationship management software,a useful extension of ERP software.
I N T R O D U C T I O N
In this chapter, you will begin learning about the operations of Fitter Snacker (FS), a fictitious company that
makes healthy snack bars and does not have an integrated information system.Throughout the remainder
of this book, we will use FS to illustrate information systems concepts in general and ERP concepts in
particular.

As is the case in many other companies, Marketing and Sales (M/S) is the focal point of many of
FS’s activities. Why? Because Marketing and Sales is responsible for selling the company’s product,
meaning that marketing personnel often guide the company’s key strategies and tactics. Marketing
personnel in most companies make the following kinds of decisions:
● What products should we produce?
● How much of each product should we produce?
● How are our products best promoted and advertised?
● How should our products be distributed for maximum customer satisfaction?
● What price should we charge for our products?
On a day-to-day basis, M/S is involved in generating key transaction data (including data for
recording sales), creating customers’ bills, and allocating credit to customers. As you have learned in
previous chapters, the availability of a common database to all modules is one of the advantages of
having an integrated information system, because the data in the system are consistent. Integration can
lead to problems, however; if the data are not correct, the error will carry over into all modules.
FS’s M/S information systems are not well integrated with the company’s other information systems.
As a result, company-wide use of transaction data is inefficient, as you will see in this chapter.You’ll also
see how FS’s M/S information systems could be improved by using ERP. We begin by looking at an
overview of the company’s operations.
O V E R V I E W O F F I T T E R S N A C K E R
Fitter Snacker manufactures and sells two types of nutritious snack bars: NRG-A andNRG-B. NRG-A touts “advanced energy.” NRG-B boasts “body building proteins.” Each barcontains the following ingredients:
● Vitamins and Minerals: important nutrients
Chapter 3
48

● Dry Base Mixture: oats, wheat germ, protein powder, and spices● Wet Base Mixture: honey and canola oil
Each type of bar contains additional unique ingredients: NRG-A contains carob chipsand raisins, while NRG-B contains hazelnuts and dates.
Fitter Snacker has organized its sales force into two groups, known as divisions: theWholesale Division and the Direct Sales Division. The Wholesale Division sells to interme-diaries who distribute the bars to small shops, vending machine operators, and health foodstores. The Direct Sales Division sells directly to large grocery stores, sporting goodsstores, and other large chain stores. Each division has an organizational structure that inter-acts with FS’s other functional areas, such as Accounting and Supply Chain Management.The two divisions operate separately from one another, in effect breaking the M/S func-tional area into two pieces.
The two sales divisions differ primarily in terms of quantities of orders and pricing terms.The Direct Sales Division offers customers volume discounts to encourage larger sales orders,which are more efficient to process because each order—regardless of size—generates costsrelated to the paperwork, shipping, and handling of the order. Thus, an order of 500 cases ofsnack bars incurs the same handling costs as an order of 10 cases, but the large order might gen-erate $5,000 in profit, while the small order might generate only $100. The Wholesale Divi-sion charges customers a lower fixed price because the orders are usually large (otherwise, theorders would be handled by the Direct Sales Division). Both divisions send their customersinvoices requesting the total balance within in 30 days and offering a 2 percent discount if theypay within 10 days (2–10/net 30).
In addition to selling snack bars under the Fitter Snacker brand name, the companyalso packages the bars in store-brand wrappers for some chain stores.
P R O B L E M S W I T H F I T T E R S N A C K E R ’ SS A L E S P R O C E S S
Many of Fitter Snacker’s sales orders have some sort of problem, such as incorrect pricing,excessive calls to the customer for information, delays in processing orders, missed deliv-ery dates, and so on. These problems occur because FS has separate information systemsthroughout the company for three functional areas: the sales order system, the ware-house system, and the accounting system. Information from each system is shared elec-tronically through periodic file transfers (sales order system to accounting system) andmanually by paper printout (credit status from the Accounting department to sales clerks).The high number of transactions that are handled manually creates many opportunities fordata entry errors. Further, all the information stored in the three systems is not avail-able in real time, resulting in incorrect prices and credit information.
In each sales division, Fitter Snacker has four salespeople who work on the road, plustwo sales clerks who work in the sales office. Salespeople work on commission and havesome leeway in offering customers “discretionary discounts” to make a sale. The entire salesprocess involves a series of steps that require coordination between Sales, Warehouse,Accounting, and Receiving, as shown in Figure 3-1 on the next page. (Notice that Manufac-turing is usually not directly involved in the sales process because goods are shipped fromthe warehouse.)
Marketing Information Systems and the Sales Order Process
49

Sales Quotations and OrdersGiving a customer a price quotation and then taking the customer’s order should be astraightforward process, but at FS it is not. For a new customer, the sales process begins witha sales call, during which the salesperson either telephones the customer or visits inperson. At the end of the sales call, the salesperson prepares a handwritten quotation on aform that generates two copies. The original sheet goes to the customer, the middle copyis first faxed and then mailed to the sales office, and the salesperson keeps the bottom copyfor his or her records. The quotation form has an 800 number that the customer can callto place an order.
A number of problems can occur with this process:
● The salesperson might make an arithmetic error in the sales quotation. Forexample, a salesperson in the Direct Sales Division might offer both a quan-tity discount and a discretionary discount. If the salesperson isn’t careful, thetwo discounts combined might be so deep that the company receives little orno profit.
● Salespeople fax a copy of their sales quotations to the sales office, but some-times the same customer calls to place an order before the fax is transmitted.
Sales
Warehouse
Fitter Snacker’sSales Process
Pricequote
Salesorder
Pick,pack, and
ship
Invoice
Payment
ReturnsAccounting
Receiving
FIGURE 3-1 The sales process
Chapter 3
50

The in-office clerk has no knowledge of the terms of the sale (which are out-lined on the quotation) and must ask the customer to repeat the information.On the other hand, even if the quotation has been faxed, the data might nothave been entered into the customer database, and still the customer mustrepeat the order information, much to his annoyance. This situation can alsolead to a duplicate order.
● The fax received by the sales office is a faxed copy of a handwritten form, andmight not be legible.
When customers place an order, they usually ask for a delivery date. To get a ship-ping date, the in-office clerk must contact the warehouse supervisor and ask whether thecustomer’s order can be shipped from inventory, or whether shipping will be delayed untila future production run is delivered to the warehouse. Because she’s too busy to make aninventory count, total all orders waiting to be filled, and find out how many orders are inprocess in the sales office, the warehouse supervisor can only estimate the shipping date.
Once the in-office sales clerk has the warehouse supervisor’s estimated shipping date,she determines the shipping method for the order and how long delivery will take. Next, theclerk checks the customer’s credit status. For new customers, the clerk fills out a papercredit-check form that includes basic customer data and the amount of the order. The formgoes to Accounting, where accountants perform the credit check and then return thecredit-check form showing the customer’s credit limit. If the credit limit is below the amountof the purchase, assuming there are no other orders outstanding, the clerk calls the cus-tomer to determine what action the customer wants to take (reduce the amount of the order,prepay, or dispute the amount of credit granted). If the order is from an existing cus-tomer, the clerk checks a paper report from Accounting that shows the customer’s cur-rent balance, credit limit, and available balance. Because the report is generated weekly,it might not reflect a customer’s most recent payments.
The sales clerk enters the customer’s order into the current order entry system. Thecomputer program performs four important tasks. First, it stores the customer’s order data,which are used later to analyze sales performance at the division level. Second, it printsout a packing list and shipping labels for the warehouse to use to pick, pack, and ship thecustomer’s order. Third, it produces a data file of all current transactions for the Account-ing department to use for preparing invoices (this file is also used for financial, tax, andmanagerial accounting, which is discussed in Chapter 5). And fourth, the data file is cop-ied to a disk and entered into a PC-based accounting software program on Mondays,Wednesdays, and Fridays.
Order FillingFitter Snacker’s process for filling an order is no more efficient than its sales order process.Packing lists and shipping labels are printed twice a day—at noon and at the end of the day.These are hand-carried to the warehouse, where they are hand-sorted into small ordersand large orders. The Production department produces and wraps the bars and packs themin display boxes, 24 bars to a box. The display boxes have promotional printing and aredesigned to serve as a display case. FS packs 12 display boxes together to form a standard
Marketing Information Systems and the Sales Order Process
51

shipping case. Depending on the inventory levels in the warehouse, Production personnelmight transfer the display boxes directly to the warehouse, or they might pack the dis-play boxes into shipping cases.
The warehouse stores both display boxes and shipping cases, organized by label type(FS brand and store brand). For small orders (less than a full shipping case), the orderpicker goes to the warehouse with a handcart and pulls the number of display boxes listedon the packing list. If there are not enough display boxes in the warehouse to fill the order,the picker might break open a shipping case to get the required number of display boxes.If he does this, he is supposed to advise the warehouse supervisor so she can update theinventory records—but sometimes this step is overlooked.
The picker then brings the display boxes back to the small-order packing area, wherethey are packed into a labeled box with the packing list enclosed and prepared for ship-ping by a small package shipper.
For large orders (one or more shipping cases), the picker uses a forklift to move theappropriate number of shipping cases to the large-order packing area. Workers label themfor shipping, load them on a pallet, and attach them to the pallet with shrink-wrap plas-tic for protection. These pallets are shipped either by one of FS’s two delivery trucks or bya less-than-truckload (LTL) common carrier.
FS uses a PC database program to manage inventory levels in the warehouse. The pro-gram adjusts inventory level figures on a daily basis, using production records (showingwhat has been added to the warehouse), packing lists (showing what has been shipped fromthe warehouse), and any additional sources of data (such as shipping cases that have beenopened to pull display boxes). Each month the warehouse staff conducts a physicalinventory count to compare the actual inventory on hand with what the inventory recordsin the PC database show. Fitter Snacker’s monthly inventory counts show that inventoryrecords are more than 95 percent accurate. Ninety-five percent accuracy doesn’t sound toobad, but FS still has problems filling orders. These are described next.
Because snack bars are somewhat perishable, FS keeps inventory levels fairly low, andinventory levels change rapidly during the day. As a result, a picker might go to the shelvesto pick an order and discover that there are not enough of the desired type of snack barsto fill the order. The picker then has to decide from among several courses of action. Theremight be more of that type of bar in the production area, on the way to the warehouse. Foran important customer, the wrappers and display box labels on the production line mightbe changed to the customer’s brand to produce enough bars to complete the order. In othersituations, the customer may want a partial shipment consisting of whatever is on hand,with the rest shipped when it becomes available, which is known as a backorder. Or, the cus-tomer might prefer to take the goods on hand, cancel the balance of the order, and placea new order later. If the customer’s company has enough inventory on hand, the cus-tomer may wait until the whole order can be shipped, thus saving on delivery charges.
To determine what to do in this situation, the order picker might have conversationswith the warehouse supervisor, production supervisor, and sales clerks. Whatever the finaldecision, the warehouse supervisor has to contact the sales clerk so she can notify the cus-tomer (which doesn’t always happen, when things are busy) and the Accounting depart-ment so they can change the invoice.
Chapter 3
52

Accounting and InvoicingInvoicing the customer is problematic as well. Three times a week, sales clerks send theAccounting department the disk containing the sales order data for customer invoices. TheAccounting department loads the data into the PC-based accounting program; then, clerksmanually make adjustments for partial shipments and any other changes that haveoccurred during the order process. Sometimes, order corrections are delayed and don’tcatch up to the invoicing process, resulting in late or inaccurate invoices. If the com-pleted invoice is waiting to be mailed when the warehouse notifies Accounting of a par-tial shipment, then a new invoice must be prepared. In any case, an invoice is eventuallysent to the customer, separate from the shipment.
Payment and ReturnsFitter Snacker’s procedure for processing payments can yield frustrating results forcustomers. Almost all customers pay the invoice within 10 days to receive the 2 percentdiscount. If any errors have occurred in the sales process—from the original quotationto entering the order into the sales order program—the customer will receive an incor-rect invoice. Even though FS provides customers with two invoice copies, many custom-ers don’t return a copy of the invoice with their payment, as instructed. Errors result ifthe correct customer’s account isn’t credited.
FS’s returns processing is also flawed. Because FS’s snack bars contain no preserva-tives, they have a relatively short shelf life. Thus, FS has a policy of crediting customeraccounts for returned snack bars that have exceeded their “sell by” date (this is a gener-ous policy, because it is impossible to know who—FS or the customer—is responsible forthe bars not selling before they expire). FS also gives credit for damaged or defective cases.Customers are supposed to call FS to get a returned material authorization (RMA) num-ber to simplify the crediting process. When cases are returned to FS, the Receiving depart-ment completes a handwritten returned material sheet, listing the returning company’sname, the materials returned, and the RMA number. However, many customers do not callfor the RMA number, or fail to include it with their returned material, which makes it moredifficult for the Accounting department to credit the appropriate account. Poor penman-ship on the returned material sheet also creates problems for Accounting.
When an account becomes past due, FS sends a dunning letter, notifying the cus-tomer that the account is past due and requesting payment if payment hasn’t already beensent. As the account gets more delinquent, the dunning letters usually get more direct andthreatening. If a customer’s account has not been properly credited, however, the cus-tomer may receive a dunning letter in error, or may receive a call about exceeding theircredit limit after placing a new order. Such situations damage goodwill with both new andrepeat customers.
In the following sections, you will learn how an ERP system can improve the sales pro-cess for Fitter Snacker.
Marketing Information Systems and the Sales Order Process
53
S A L E S A N D D I S T R I B U T I O N I N E R P
An ERP system can improve the sales order process in several ways. Because ERP systemsuse a common database, they can minimize data entry errors and provide accurate infor-mation in real time to all users. An ERP system can also track all transactions (such asinvoices, packing lists, RMA numbers, and payments) involved in the sales order.
Let’s look at how one ERP system, SAP’s ERP and its Sales and Distribution module,manages the sales order process. Other ERP software handles the process in a similarfashion. In SAP ERP, important transactions and events are assigned a number for record-keeping purposes. The electronic evidence of a transaction in SAP ERP is called a“document.”
The SAP ERP Sales and Distribution module treats the sales order process as a cycleof events. SAP ERP defines up to six events for any sale:
● Pre-sales activities● Sales order processing● Inventory sourcing● Delivery● Billing● Payment
Pre-Sales ActivitiesThe first step in the SAP ERP sales and distribution process is Pre-Sales Activities. At thisphase, customers can get pricing information about the company’s products, eitherthrough an inquiry or a price quotation. The difference between an inquiry and a quota-tion is that a quotation is a written, binding document; the seller guarantees the buyerthat, for some specified period of time, he can buy the product at the quoted price. Theinquiry is simply a statement of prices, with no guarantee implied.
Pre-sales activities also include marketing activities such as tracking customer con-tacts, including sales calls, visits, and mailings. The company can maintain data about cus-tomers and generate mailing lists based on specific customer characteristics, whichenhances targeted marketing efforts.
Sales Order ProcessingIn the SAP ERP system, sales order processing is the series of activities that must take placeto record a sales order. The sales order can start from a quotation or inquiry generated in thepre-sales step. Any information that was collected from the customer to support the quota-tion (contact name, address, phone number) is immediately included in the sales order.
Some of the more critical steps in sales order processing are recording the items to bepurchased, determining the selling price, and recording the order quantities. Users candefine various pricing alternatives in the SAP ERP system. For example, a company can useproduct-specific pricing, such as quantity discounts, or it can define discounts that dependon both the product and a particular customer. Configuring a complex pricing schemerequires a significant amount of programming work, but once the system is in place, it willautomatically calculate the correct price for each customer, eliminating many problemsthat FS experiences.
Chapter 3
54

During sales order processing, the SAP ERP system checks the Accounts Receivabletables in the SAP ERP database to confirm the customer’s available credit. SAP ERP adds thevalue of the order to the credit balance, and then compares the result to the customer’scredit limit (also available in the database). If the customer has sufficient credit available,the order is completed. If not, the SAP ERP system prompts sales personnel to either rejectthe order, call the customer to check on recent payments, or contact Accounting to dis-cuss any extenuating circumstances.
Inventory SourcingWhen recording an order, the SAP ERP system checks the company’s inventory records andthe production planning records to see whether the requested material is available and canbe delivered on the date the customer desires. This Available-to-Promise (ATP) checkincludes the expected shipping time, taking into account weekends and holidays. FitterSnacker’s current system does not provide a good method for checking inventoryavailability. In the SAP ERP system, availability is automatically checked and the sys-tem can recommend an increase in planned production if a shortfall is expected. SAP alsokeeps a record of all open orders, so even if the ordered product is still in the ware-house, the system will reserve it on the shelf, making it unavailable to other customers.
DeliveryIn the SAP ERP system, the word delivery means releasing the documents that the ware-house uses to pick, pack, and ship orders, rather than the traditional definition of transfer-ring goods. The delivery process allows deliveries to be created so that the warehouse andshipping activities are carried out efficiently (for example, combining similar orders forpicking, or grouping orders based on shipping method and destination).
Once the system has created the documents for picking, packing, and shipping, thedocuments are transferred to the Materials Management module, where the warehouseactivities of picking, packing, and shipping are carried out.
BillingNext, the SAP ERP system creates an invoice by copying the sales order data into the invoicedocument. Accounting can print this document and mail it, fax it, or transmit it electroni-cally to the customer. Accounting records are also updated at this point. To record thesale, SAP ERP debits (increases) Accounts Receivable and credits Sales, thus updating theaccounting records automatically.
PaymentWhen the customer sends in a payment (physically or electronically), it is automaticallyprocessed by the SAP ERP system, which debits cash and credits (reduces) the custom-er’s account. Notice that the timely recording of this transaction has an effect on the time-liness and accuracy of any subsequent credit checks for the customer. Fitter Snacker hashad a problem with getting accurate credit checks, frequently blocking orders for compa-nies that are within their credit limit, while granting credit to other companies beyond whatis advisable.
Marketing Information Systems and the Sales Order Process
55

A S T A N D A R D O R D E R I N S A P E R P
Now we will take a look at how Fitter Snacker’s sales order process would work with an SAPERP system in place. You will learn how this ERP system would make FS’s sales order pro-cess more accurate and efficient. Notice that ERP allows business processes to cut acrossfunctional area lines.
Taking an Order in SAP ERPFigure 3-2 shows an order entry screen in SAP ERP’s 4.7 Enterprise system, the versionof the software released in 2003. The important fields in this screen are summarized inFigure 3-3.
In SAP ERP, a sales order clerk must enter code numbers for customers’ names and theinventory sold, rather than using customers’ names and inventory item names. Becausemore than one customer might have the same name, a unique number is assigned by thecompany to each customer in the database. This number acts as the primary identifier forthe customer. The same logic applies to distinguishing one inventory item from another. Indatabase terminology, such codes are called key fields. While it sounds as if the sales orderclerk must remember a lot of code numbers to use the SAP ERP system, this is not thecase. For most data entry fields, the SAP ERP system determines whether an entry is valid.Figure 3-4 shows how SAP ERP lists the system’s 34 predefined sales order types. The salesorder clerk can choose the correct type from among these.
Material andOrder quantity:What thecustomer isordering
Req. deliv. date:The date whenthe customerwould like toreceive the order
PO Number: Thenumber assignedby the customerto this sales order
Sold-to party:Where thecustomer’sidentificationnumber isentered
FIGURE 3-2 SAP ERP order entry screen
Chapter 3
56
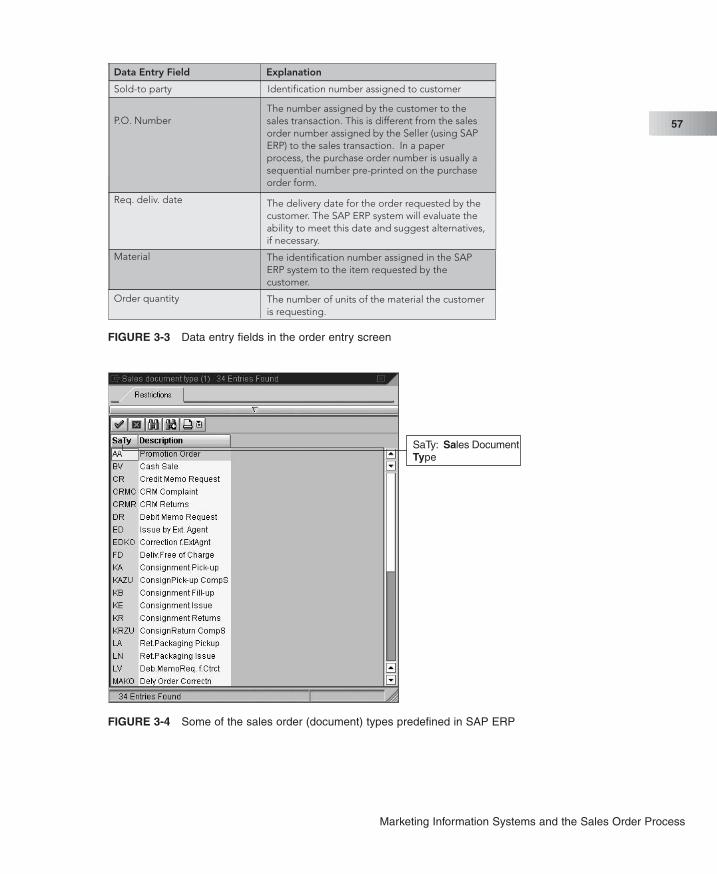
Data Entry Field Explanation
Sold-to party
P.O. NumberThe number assigned by the customer to thesales transaction. This is different from the salesorder number assigned by the Seller (using SAPERP) to the sales transaction. In a paperprocess, the purchase order number is usually asequential number pre-printed on the purchaseorder form.
Req. deliv. date
Material
Identification number assigned to customer
The delivery date for the order requested by thecustomer. The SAP ERP system will evaluate theability to meet this date and suggest alternatives,if necessary.
The identification number assigned in the SAPERP system to the item requested by thecustomer.
Order quantity The number of units of the material the customeris requesting.
FIGURE 3-3 Data entry fields in the order entry screen
SaTy: Sales DocumentType
FIGURE 3-4 Some of the sales order (document) types predefined in SAP ERP
Marketing Information Systems and the Sales Order Process
57
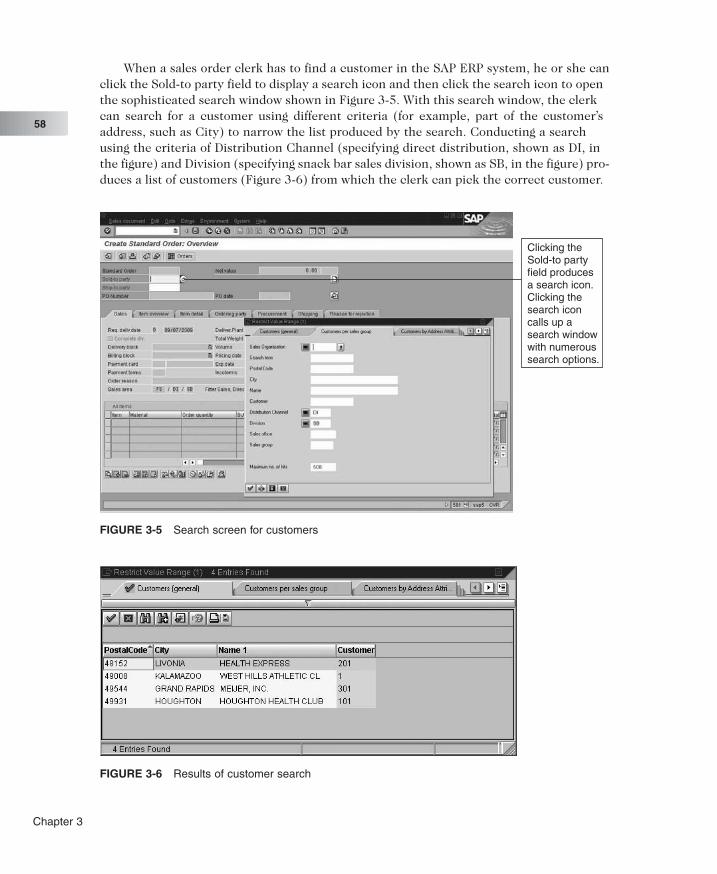
When a sales order clerk has to find a customer in the SAP ERP system, he or she canclick the Sold-to party field to display a search icon and then click the search icon to openthe sophisticated search window shown in Figure 3-5. With this search window, the clerkcan search for a customer using different criteria (for example, part of the customer’saddress, such as City) to narrow the list produced by the search. Conducting a searchusing the criteria of Distribution Channel (specifying direct distribution, shown as DI, inthe figure) and Division (specifying snack bar sales division, shown as SB, in the figure) pro-duces a list of customers (Figure 3-6) from which the clerk can pick the correct customer.
Clicking theSold-to partyfield producesa search icon.Clicking thesearch iconcalls up asearch windowwith numeroussearch options.
FIGURE 3-5 Search screen for customers
FIGURE 3-6 Results of customer search
Chapter 3
58

In the SAP ERP system, a range of information is stored about each customer in mul-tiple tables. These data are referred to as customer master data. Master data are data thatremain fairly stable, such as customer name and address. Master data are maintained in thecentral database, and are available to all SAP ERP modules, including SD (Sales and Dis-tribution), FI (Financial), and CO (Controlling).
Information about materials is in tables collectively called material master data, whichare used by the MM (Materials Management—purchasing and warehousing) and PP (Pro-duction Planning) modules in addition to the SD module.
The SAP ERP system allows the user to define various ways to group customers andsalespeople. These groupings are called organizational structures. One important organi-zational structure for Fitter Snacker is the Distribution Channel. With SAP ERP, the Dis-tribution Channel allows the user to define different ways for materials to be sold anddistributed to the customer. It allows for different types of relationships with different cus-tomers, and lets the company specify aspects of the relationship, such as pricing, deliverymethod, and minimum order quantities. Defining a Wholesale Distribution Channel anda Direct Sales Distribution Channel for FS would help to ensure that customers’ orders arecorrectly priced.
Figure 3-7 shows a completed sales order screen for an order from West Hills AthleticClub for 10 cases of NRG-A bars and 10 cases of NRG-B bars.
FIGURE 3-7 Order screen with complete data
Marketing Information Systems and the Sales Order Process
59

West Hills’s purchase order (PO) number for this sales transaction is WH83128. Thisis a unique number provided by the customer (West Hills) that allows it to track orders withits suppliers. If the customer has a question about an order, it will reference that PO num-ber in its inquiry. Because the SAP ERP system records the customer’s PO number, FScan look up the status of the order using the customer’s PO number in addition to the salesorder number that SAP will assign to this transaction.
Notice also that the order screen shows the name of the customer (West Hills Ath-letic Club) and the names of the products (NRG-A and NRG-B), even though they were notentered directly during the order process. How did they get on the screen at this point?Once the company code is entered, the clerk can easily request the SAP ERP system tosearch the database and access all company information needed to complete the order.Thus, the SAP ERP system simplifies the data entry tasks, reducing data entry time and thepossibility of error.
When the SAP ERP system is instructed to save a sales order, it performs inventorysourcing—that is, it carries out checks to ensure that the customer’s sales order can bedelivered on the requested delivery date. Remember that previously when an FS cus-tomer wanted to know when an order could be delivered, the sales clerk had to make a seriesof phone calls. In the SAP ERP system, this checking is done automatically. It includeschecks on both inventory and production, and it includes the time required for shipping.When the requested delivery date cannot be met, the SAP ERP system automatically pro-poses alternatives to the sales order clerk. For example, Figure 3-8 shows what the salesorder clerk will see if only five cases of NRG-A bars will be available by the requested deliv-ery date. The SAP ERP system provides the sales order clerk with three alternatives:
1. Reduce the order quantity of NRG-A cases to five, which can be delivered bythe requested delivery date.
2. Delay shipment of the NRG-A bars for three days, when 10 cases will beavailable.
3. Ship five cases by the requested delivery data, and ship five cases at thelater date.
three optionsproposedby SAP ERP
FIGURE 3-8 Order proposals
Chapter 3
60

The best situation would be to meet the customer’s request, but when that is not pos-sible, the integrated SAP ERP system can provide the clerk with accurate informationabout the ability to meet the customer’s requirements. With Fitter Snacker’s previous unin-tegrated systems, it could take days for the customer to find out that its requested deliv-ery date could not be met.
When a sales order is saved, the SAP ERP system assigns a document number to thesales order transaction. In the SAP ERP system, a document is an electronic record of a busi-ness transaction, and a document number is created for each business transaction. Whenthe sales order is ready to be processed by the warehouse, a delivery document will becreated with its own unique document number, which the system will link to the sales orderdocument. Finally, when the bill (invoice) is prepared for the customer, the bill’s uniquenumber (called the invoice number) will be created and related to all the other numbersassociated with the sales order.
The SAP ERP system has a mechanism for keeping track of the document numbers forthe sales order so that employees can track the status of an order while it is in process, orresearch it after shipping. The linked set of document numbers related to an order, theaudit trail, is called a document flow in SAP ERP. Figure 3-9 shows the document flow fora completed order. If an order includes partial shipments, partial payments, and returnedmaterial credits, the document flow can become quite complex. Without an integrated infor-mation system, the audit trail can be hard to establish, especially if many paper docu-ments are involved. With an integrated system such as SAP ERP, document numbers are alllinked together electronically. Not only does the document flow show all documents relatedto a sales order, but the user can look at the details of each document simply by double-clicking a line in the document flow. For example, if West Hills Athletic Club chose to takedelivery of five cases of NRG-A bars on its requested delivery date and five cases when theybecame available, a sales order clerk can easily check on the status of the five delayedcases using document flow. He or she can search the SAP system to find the original salesorder by a number of methods (open orders for West Hills, the PO number that West Hillsused, the sales order number assigned by the SAP ERP system, and so on), and then reviewthe delivery document for the delayed cases. As another example, a customer may havea question about an invoice it has received. The clerk can search the SAP ERP system forthe invoice; the document flow will show all activity that led to the invoice. With an unin-tegrated information system, researching the invoice would require checking more than oneinformation system and perhaps searching paper records as well.
Marketing Information Systems and the Sales Order Process
61

Discount Pricing in SAP ERPWhen a company installs an ERP system, it can configure it for a number of pricingstrategies. For example, various kinds of discounts can be allowed (per item, on all items,based on unit price, based on total value, with or without shipping charges and taxes, byindividual customer, by a class of customer, and so on). As a safeguard, the system canenforce limits on the size of discounts, to keep salespeople from offering unprofitable orunapproved discounts.
Suppose a salesperson wants to give a certain customer a 10 percent discretionary dis-count on NRG-A bars. But is the salesperson allowed to discount those bars? Is that dis-count appropriate for that customer? If so, will the discount be so deep that the sale will beunprofitable for FS? An ERP system automatically answers these questions.
Pricing, the process of determining how much to charge a particular customer, can bevery complex. To accommodate the various ways that companies offer price discounts, SAPhas developed a control mechanism it calls the condition technique. While detailed dis-cussion of the condition technique is beyond the scope of this text, Figure 3-10 shows howa discount is automatically applied in the SAP ERP system.
The screen shows the price that FS is offering to West Hills Athletic Club for 10 casesof NRG-A bars. The base price is $240/case, and West Hills is being given a 10 percent dis-count automatically.
accountingdocument90000002 islinked to salesorder 5
FIGURE 3-9 The Document Flow tool, which links sales order documents
Chapter 3
62

The screen in Figure 3-11 shows that the SAP ERP system has been configured to giveWest Hills Athletic Club a 5 percent discount for ordering over $1,000 worth of a particu-lar type of snack bar, and a 10 percent discount if the order for a particular type of snackbar is over $1,500 in value.
net price fororder, includingdiscounts
base price is$240/case
the productioncost of the 10cases is $1,992
discount is10 percent
FIGURE 3-10 Pricing conditions for sales order
if a line in theorder is over$1,000, thediscount is5 percent
if a line in theorder is over$1,500, thediscount is10 percent
FIGURE 3-11 West Hills Athletic Club price discount
Marketing Information Systems and the Sales Order Process
63

If you look again at Figure 3-10, you can see that the SAP ERP system automaticallyapplied the 10 percent discount, so that the net price for 10 cases of NRG-A bars is $2,160.Figure 3-10 also shows that Fitter Snacker will still make a profit on this order, because thecost to produce 10 cases of NRG-A bars is $1,992.
Integration of Sales and AccountingIn the previous FS system, sales records were not integrated with the company’s account-ing records, so Accounting information was not always up-to-date. By contrast, ERP sys-tems integrate Accounting with all business processes, so that when a sales order isrecorded, the related accounting data are updated automatically.
In the document flow shown in Figure 3-9, Accounting document 90000002 is part ofthe sales order process. The clerk can select this line, then click the Display document but-ton and get the accounting detail shown in Figure 3-12.
This document shows that, as a result of this sales order, West Hills Athletic Club haspaid Fitter Snacker $2,160. The Sales Revenue account (account number 600000) recordssales revenue of $2,400 dollars, which represents the list price of the snack bars West HillsAthletic Club purchased. The 10 percent discount of $240 is recorded in the Sales Dis-count account (account number 610000). Because the accounting documents are createdautomatically with the sales order, the Accounting department is using the same data asSales, which results in up-to-date and accurate information. If Marketing needs a report onthe size of discounts currently being offered, the system can easily generate a report of thatdata, and it will be up-to-date and accurate as well.
Now that we have looked at how an ERP system can help a company’s sales order pro-cess, let’s look at how data obtained during that process might be further used to help Fit-ter Snacker build long-term business relationships with its customers and improvebusiness performance.
accountingdocument90000002,accessiblefrom thedocumentflow screen
accountsaffected bythe salesorder
FIGURE 3-12 Accounting detail for the West Hills sales order
Chapter 3
64

C U S T O M E R R E L A T I O N S H I P M A N A G E M E N T
Companies without a good connection between their workers and their customers run therisk of losing business. Take Fitter Snacker, for example. Let’s say a salesperson calls ona good customer, Health Express. The salesperson offers Health Express deep discounts forbuying a certain number of NRG bars. At the same time, the Marketing department is run-ning a sale on NRG bars. Marketing sends Health Express a flyer advertising the dis-counted price, which is less than what the salesperson just offered in person. Meanwhile,the vice president of Fitter Snacker plays golf with the CEO of Health Express and offersyet another discount. The connection or relationship with the customer is confused.customer relationship management (CRM) software can help companies streamline theirinteractions with customers.
Companies with an ERP system have an added benefit beyond systems integration: vastand complete quantities of data available for analysis. By adding other software tools to itsERP system, a company can extend the capabilities of the system, thus increasing itsvalue. Many ERP vendors—and non-ERP software companies—provide CRM software.Siebel (bought by Oracle in 2005 for $5.8 billion) led the CRM software market until 2004,when its market dominance was overtaken by SAP. According to SAP, 34,000 companiesare using SAP CRM. Forrester Research estimates the market for CRM software will reach$10.9 billion by 2010.
The latest method of delivering this software is on-demand. According to AMRResearch, 12 percent of the market (amounting to $600 million) uses CRM by this method.With on-demand CRM, the software and computer equipment reside with the CRMprovider; it is not installed in-house. Salesforce.com, for example, is a company that pro-vides CRM software as it is needed by the user. On-demand access is provided by SAP andother vendors, including Oracle. Microsoft is also in the mix with its Dynamics CRM 3.0.Vendor pricing varies from $65 to $125 per user per month.
With the goal of providing “a single face to the customer,” the basic principle behindCRM is that any employee in contact with the customer should have access to all informa-tion about past interactions with the customer. In a traditional sales organization, infor-mation might only be available to one individual, who might not share it with theorganization. If that individual leaves the company, the information is lost.
Marketing Information Systems and the Sales Order Process
65

Core CRM ActivitiesIn general, all CRM software supports the following activities and tools:
● One-to-one marketing: Once a customer is categorized, the company can tai-lor products, promotions, and pricing accordingly. Customers can be offeredproducts related to what they are now buying (cross-selling) or higher-marginproducts in the same lines (up-selling).
● Sales force automation (SFA): Occurrences of customer contacts are loggedin the company’s database. SFA software can automatically route customerswho contact the company to a sales representative. Companies can use SFAsoftware to forecast customer needs, based on the customer’s history andtransactions, and to alert sales representatives accordingly. Sometimes thissoftware is called “lead management software” because a transaction can betracked from the initial lead to post-sale follow-up.
● Sales campaign management: This software lets a company organize a market-ing campaign and compile its results automatically.
● Marketing encyclopedias: This software serves as a database of promotional lit-erature about products. The material can be routed to sales representativesor customers as needed.
● Call center automation: When customers call a company to get assistance witha company’s products, representatives can query a knowledge managementdatabase containing information about the product. Some knowledge manage-ment software accepts queries in natural language. If the company mustdevelop a new solution in response to a unique customer query, that informa-tion can be added to the knowledge base, which thus becomes “smarter.”
SAP’s CRM SoftwareA number of tools that provide CRM functionality exist within the SAP ERP system. Forexample, to make sure that information about sales contacts is available throughout theorganization, the SAP ERP system provides a contact management tool, shown inFigure 3-13. This tool is essentially a database of personal contact information.
Chapter 3
66
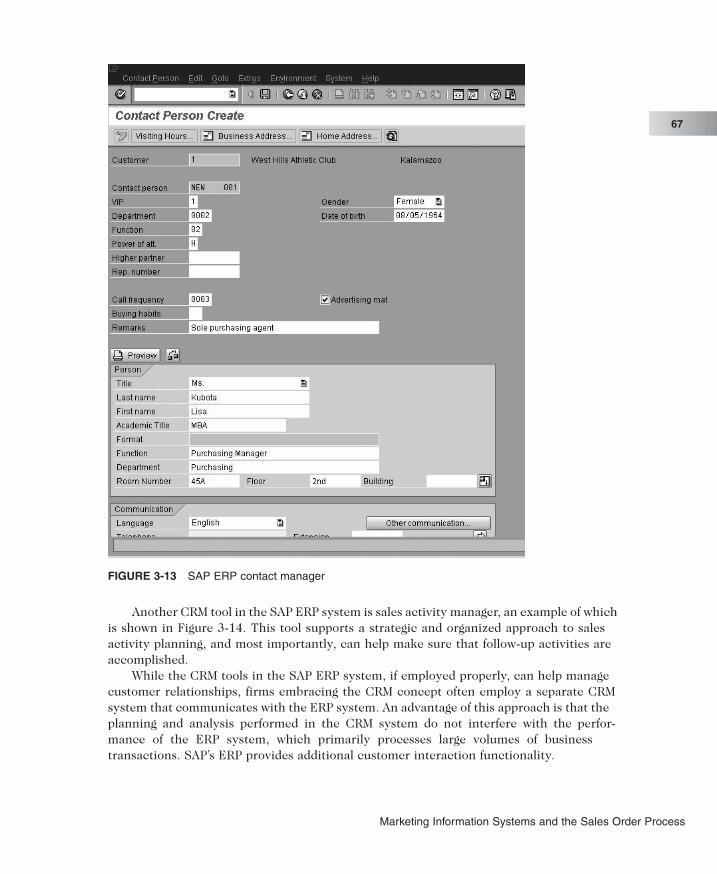
Another CRM tool in the SAP ERP system is sales activity manager, an example of whichis shown in Figure 3-14. This tool supports a strategic and organized approach to salesactivity planning, and most importantly, can help make sure that follow-up activities areaccomplished.
While the CRM tools in the SAP ERP system, if employed properly, can help managecustomer relationships, firms embracing the CRM concept often employ a separate CRMsystem that communicates with the ERP system. An advantage of this approach is that theplanning and analysis performed in the CRM system do not interfere with the perfor-mance of the ERP system, which primarily processes large volumes of businesstransactions. SAP’s ERP provides additional customer interaction functionality.
FIGURE 3-13 SAP ERP contact manager
Marketing Information Systems and the Sales Order Process
67

Figure 3-15 shows how SAP CRM relates to the SAP ERP system as well as SAP’sBusiness Warehouse (BW) and Advanced Planner and Optimizer (APO) modules.
As described previously, the SAP ERP system processes business transactions and pro-vides much of the raw data for CRM. SAP’s Business Warehouse is a flexible system forreporting and analysis of transactional data. By analyzing sales transactions using data min-ing, firms can discover trends and patterns to use in planning marketing activities. TheAdvanced Planner and Optimizer (APO) is a system that supports efficient planning of thesupply chain. The APO’s role in CRM is to provide higher levels of customer supportthrough its Global Available-to-Promise (ATP) capabilities. In the standard SAP ERP sys-tem, the ATP capabilities function on a location-by-location basis. If the product or mate-rial a customer wants is not available in the location that usually serves the customer, thenthe sales order clerk can check for the material in other facilities, but this must be doneon a facility-by-facility basis. With Global ATP, the system automatically checks all facili-ties and determines the most cost-efficient facility to use to meet the customer’s request.The SAP CRM system communicates with the SAP ERP, BW, and APO systems in develop-ing and executing its plans. Thus, CRM not only interfaces with the customer, but enablesthe company to analyze the customer data and best serve the customer.
FIGURE 3-14 SAP ERP sales activity manager
Chapter 3
68

SAP’s view of CRM is to provide a set of tools to manage the three basic task areas, orjobs, related to customers: marketing, sales, and service. With CRM, these task areas con-tribute to the cultivation of the customer relationship. This cultivation goes through fourphases, as defined by SAP: Prospecting, Acquiring, Servicing, and Retaining.
In Prospecting, a potential new customer (or potential new business with existing cus-tomers) is evaluated, and development activities (e-mails, sales calls, mailings, etc.) areplanned to develop the prospective business. Marketing tasks predominate in this phase.
In Acquiring, salespeople develop business prospects into customers. Marketing is stillthe critical task, but the sales tasks (processing inquiries, quotes, and eventually salesorders) become increasingly important in this phase.
Once sales are established with the customer, the business becomes one of servicingthe account. Sales tasks are still important, but service tasks (including technical sup-port, warranty work, product returns, fixing quality problems, and complaint handling) arecritical to maintaining customer satisfaction.
The rate at which prospects become customers is quite low; thus, a critical part of theprocess is Retaining. It is much easier to retain a good customer than to find a new one,
SAPCRM
system
SAPERP
system
BWBusiness
Warehousemodule
APOAdvanced
Planner & Optimizermodule
FIGURE 3-15 SAP CRM system landscape
Marketing Information Systems and the Sales Order Process
69

so the focus of Retaining is making sure that current customers are satisfied by timely deliv-ery of quality products and services at a fair price. Sales and service tasks are still criti-cal, but marketing tasks are again important to anticipate changes in customers’requirements.
The customer development cycle (Prospecting, Acquiring, Servicing, and Retaining)is supported by Contact Channels, the methods the company uses to communicate with itscustomers. An interaction center provides contact through a variety of media (phone, fax,and e-mail). The Internet and mobile technologies are providing an increasingly largepercentage of customer contacts. For example, the Contact Channels might aid a cus-tomer service agent on the telephone and prompt her to ask the customer various ques-tions relating to the account.
Another set of tools in SAP CRM is Marketing and Campaign Management. Compa-nies invest significant sums of money in marketing campaigns, which are promotionalactivities that publicize the product and the company. Successful planning, execution,and evaluation are critical to gain maximum effect from these efforts. Figure 3-16 showshow SAP CRM supports marketing and campaign management. The top half of this dia-gram represents planning activities, while the bottom half represents execution and evalu-ation activities. These activities are supported by most CRM products.
Marketing and campaign planning includes task scheduling, resource allocation, andbudgeting. These planning tasks are executed in conjunction with target group creationtasks, which use data from the SAP ERP system (perhaps using BW) to categorize the com-pany’s customers, offering them more individual product and service promotions.
Target Group Creation
•Modeling•Segment creation•Selection
BW
Campaign Analysis
•Successmeasurement
•Third-party data•Profiles
Phone Web Mobile E-mail
Campaign ExecutionActivity Management
Marketing and Campaign Planning
•Planning•Budgeting•Monitoring
FIGURE 3-16 Marketing and campaign planning
Chapter 3
70

Campaign Execution Activity Management is a set of tools to help manage the execu-tion of the marketing campaign, which can include handling sales calls, mailings, person-alized e-mailings, and Web-based promotional activities directed to the targeted group ofcustomers. These activities can be monitored throughout the campaign to make sure theyare completed. For example, the status of a planned customer phone call will remain openuntil the call is completed.
The Campaign Analysis tool allows the company to evaluate the success of the cam-paign so that it can incorporate improvements in the next marketing campaign. Market-ing employees can use a number of measures to determine the success of the campaign,including tracking lead generation and response rates. Staff can use BW tools, by runningqueries, to support this analysis.
The Benefits of CRMCRM provides companies with these benefits:
● Lower costs: CRM can lead to operational efficiencies, such as better responsetimes in call center operations and better use of sales force time, whichlower costs.
● Higher revenue: Segmenting customers leads to better selling opportunities andrevenue increases.
● Improved strategy and performance measurement: Installing and operating anERP system requires management and staff to think of the company as a whole.This attitude carries over into CRM work. With CRM in place, managementcan think about different performance measures; for example, should sales-people be rewarded for exceeding sales quotas, and marketing peoplerewarded for finding new customers—or, should both receive rewards that arebased on some measure of customer satisfaction? The former approach, typi-cal in days before CRM and ERP, can lead to unintegrated functionalthinking. The latter approach—now feasible with CRM and ERP—can lead allpersonnel to think in terms of a company-wide effort to satisfy customers.
Marketing Information Systems and the Sales Order Process
71

A N O T H E R L O O K
CRM: Strategy and Demand
CIO magazine offers a tutorial on CRM that addresses many practical questions andconsiderations. For example, companies should be emphasizing CRM as a strategy, not justa technical solution. This approach, in many ways, is similar to the way companies shouldimplement ERP solutions; if management just considers an ERP system to be a techni-cal solution, without thinking about strategy and change management, the project isdoomed to fail. CRM’s strategy helps an organization understand its customers and grasphow to meet their requirements. This strategy translates into selling customers what theywant, cross-selling if possible, obtaining new customers while retaining old ones, closingdeals faster, and in general, offering better customer service. Companies can imple-ment this CRM strategy through call centers, Web sites, advertising, or other channels. Pat-terns of customer behavior can be tracked from each of these areas and combined intoa single depiction of the customer. According to CIO, if someone has multiple accountswith one bank, it is to the bank’s benefit to treat this person well each time it has any con-tact with him or her, even if the employee serving that customer has very little businesswith him or her.
A CRM project should be run across all departments, like an ERP project. And man-agement buy-in and commitment is critical for it to be successful. Traditionally, finan-cial services and telecommunications organizations have been the first to adopt CRM.Manufacturing organizations are the last.
There has been a shift toward on-demand CRM, but some companies have reportedproblems with this newer delivery of the software. In 1999, Salesforce.com introducedon-demand CRM, which was an attractive option for small to midsized companies thatwanted to get into CRM without a huge initial investment. However, integration can betricky, especially with larger and more complex integration spanning many departments;upgrades are problematic; and privacy-sensitive organizations, such as health care, arereluctant to give up data to a third party.
Questions:
1. What are the advantages and disadvantages of on-demand CRM for a small tomidsized company? What are the advantages and disadvantages for a largecompany?
2. On the Internet, visit Salesforce.com and report on the various products thecompany offers. Assume you are running a small Internet business that sells tick-ets to concerts and sporting events. Would you be able to use Salesforcesoftware? Why, or why not?
Chapter 3
72

Chapter Summary
● Fitter Snacker’s unintegrated information systems are at the root of an inefficient andcostly sales order process. Because information is not shared in real time, customersare asked to repeat initial sales order information. As an order is processed, errors in pric-ing, credit checks, and invoicing also occur, presenting a poor company image tocustomers. Integrated ERP software would let FS avoid errors because the system storesall customer data in a central database that is shared in real time by all companyemployees.
● An ERP system such as SAP ERP treats a sale as a sequence of related functions,including taking orders, setting prices, checking product availability, checking the custom-er’s credit line, arranging for delivery, billing the customer, and collecting payment. InSAP ERP, all these transactions, or documents, are electronically linked, so tracking anorder’s status (partial shipments, returns, partial payments, and so forth) is easilyaccomplished.
● Installing an ERP system means making various configuration decisions, which reflectmanagement’s view of how transactions should be recorded and later used for deci-sion making. For example, the system can be configured to limit selling price dis-counts, thus avoiding unprofitable pricing.
● An ERP system’s central database contains tables of master data—relatively perma-nent data about customers, suppliers, material, and inventory—as well as transactiondata tables, which store relatively temporary data such as sales orders and invoices.
● Customer relationship management (CRM) systems build on the organizational valueERP provides; they specifically increase the flexibility of the company’s common data-base regarding customer service. Various kinds of CRM software are available, somefrom ERP vendors (including SAP) and some from third-party software companies.CRM software can lead to operational savings, but most companies buy it because theyfeel that having better customer relationships will result in higher revenues. Uses of CRMhave evolved since the software was initially launched; what began as a customer con-tact repository has extended its capabilities to include sophisticated businessintelligence. CRM can be installed in-house or on-demand.
Key Terms
Audit trail
Condition technique
Customer master data
Customer relationship management (CRM)software
Delivery
Document flow
Material master data
On-demand
Organizational structure
Marketing Information Systems and the Sales Order Process
73

Exercises
1. Assume you are the Fitter Snacker salesperson calling on the local headquarters for a chainof convenience stores in your area.You just started this job, and you are nervous about meet-ing your customer for the first time. Describe all the problems you might encounter whentaking and filling the order, if you are using the old Fitter Snacker process described in thischapter. Now assume you have an ERP system in place. Describe the sequence of eventsinvolved in selling the snack bars to the convenience stores with the new system in place.
2. Assume Fitter Snacker plans to install an ERP system and reorganize its sales divisions,consolidating them into one. What personnel issues would the management have to dealwith, when promoting the new system to the sales force? How would you deal with thoseissues?
3. Fitter Snacker’s current sales order accounting involves recording sales in each sales divi-sion and then periodically sending enough data to Accounting to record sales for thecompany. Complete sales order data are retained in each sales division for business analy-sis purposes. Assume that different divisions of the Delicious Foods Company buy NRG-Aand NRG-B bars from each of FS’s sales divisions. To complicate matters, some divi-sions of Delicious buy store-brand bars from FS. (Delicious owns convenience store outlets.)FS management wants to see an analysis of the overall relationship with Delicious Foods.FS’s management thinks there may be opportunities to promote the relationship with Deli-cious, but they need to assess profitability before proceeding. They want to see what prod-ucts each division sells to Delicious, how much is sold, and the terms. Assume that in FS’scurrent system, all the required data are available only at the sales division level. Whatsteps will be needed to pull this company-wide analysis together? (Review how each divi-sion sells its products and keeps its records.) Do you think a sales division manager will beenthusiastic about sharing all data with his or her counterpart in the other division? Do youthink there might be some reluctance? Why?
4. Continuing the Delicious Foods example, now assume that FS has an SAP ERP systeminstalled. Each sales division records sales in the same way. Sales records exist in real timeand are kept in the company’s common database. What steps will be needed to pull thiscompany-wide analysis together? Do you expect that the divisions will meet the new sys-tem with enthusiasm or reluctance?
5. Assume you are the CIO for Fitter Snacker. You are frustrated with the lack of informationflow between Marketing and Sales, Accounting, and Supply Chain. You need to convincetop management to approve an ERP implementation project that will solve this problem.Write a persuasive memo to top management, convincing them of this need. Focus on thelack of information flow to and from Marketing and Sales.
6. Describe how FS’s SAP system simplifies looking up customer numbers, setting a deliverydate, and charging a unique price to a given customer. Include a discussion of master data.
7. What is document flow? Why is it important for auditors of a company?
8. A CIO of a major pharmaceutical company once stated that the reason the corporation usedERP systems could be summed up in one word: control. How does an ERP system give man-agement control?
Chapter 3
74

9. How can a business better serve its customers using the APO tool in SAP?
10. Assume you are the marketing manager for a large consumer products company, such asProcter & Gamble. You need to launch a new marketing campaign. How can you convinceyour company of the value of using CRM to help with this campaign? What type of CRMsystem would you choose for your company?
For Further Study and Research
Database Systems Corp. White Paper. “The CRM Journey.” 2007. http://www.databasesystemscorp.com/tech-crm_26.htm.
Deck, Stewart. “Crunch Time.” CIO, September 15, 2000. http://www.cio.com/archive/09152000_crunch.html.
Edwards, John. “What’s Your Problem?” CIO, September 1, 2000. http://www.cio.com/archive/090100_problem.html.
Fickel, Louise. “Know Your Customer.” CIO, August 15, 1999. http://www.cio.com/archive/081599_customer.html.
Goff, John. “Head Games.” CFO, July 1, 2004. http://www.cfo.com/printable/article.cfm/3014815/c_3046615?f=options.
Hildebrand, Carol. “One to a Customer.” CIO, October 15, 1999. http://www.cio.com/archive/enterprise/101599_customer.html.
Kawamoto, Dawn and Margaret Kane. “Oracle to swallow Siebel for $5.8 billion.” CNETNews.com, September 12, 2005. http://news.com.com/Oracle+to+swallow+Siebel+for+5.8+billion/2100-1014_3-5860113.html?tag=item.
Kontzer, Tony. “Better Late Than Never? SAP Spices Up On-Demand CRM.” Information Week,February 6, 2006. http://www.informationweek.com/showArticle.jhtml;jsessionid=C2AW4U2FFP1FMQSNDLRSKHSCJUNN2JVN?articleID=178601884.
———. “Business Intelligence Can Give CRM A Boost.” Information Week, June 18, 2004. http://www.informationweek.com/showArticle.jhtml;jsessionid=C2AW4U2FFP1FMQSNDLRSKHSCJUNN2JVN?articleID=22100805.
MacRae, Duncan. “Forrester Research praises SAP CRM software.” ITP Technology, April 16,2007. http://www.itp.net/news/489176?tmpl=print&print=1&page=.
Murphy, Chris. “IT Confidential: Executive Swaps and Expletives.” Information Week, August 9,2004. http://www.informationweek.com/showArticle.jhtml;jsessionid=GDL5S2OTJIDE2QSNDLPCKHSCJUNN2JVN?articleID=26806480.
Overby, Stephanie. “The Truth about On-Demand CRM.” CIO, January 15, 2006. http://www.cio.com/article/16546/The_Truth_About_On_Demand_CRM/1.
Pender, Lee. “CRM from Scratch.” CIO, August 15, 2000. http://www.cio.com/archive/081500_scratch.html.
Peppers, Don and Martha Rogers. “Customer Value.” CIO, September 15, 1998.Thompson, Bob and Francis Buttle. “CRM Must Be Linked to Value: An Interview with Francis
Buttle.” CRMGuru.com, June 17, 2004.Varon, Elana. “Suite Returns.” CIO, August 15, 2000.Wailgum, Thomas. “ABC: An Introduction to CRM.” CIO, 2007. http://www.cio.com/article/40295.
Marketing Information Systems and the Sales Order Process
75

This page intentionally left blank

C H A P T E R 4PRODUCTION ANDSUPPLY CHAINMANAGEMENTINFORMATION SYSTEMS
L E A R N I N G O B J E C T I V E S
After completing this chapter, you will be able to:
● Describe the steps in the production planning process of a high-volume manufacturer such as Fitter Snacker.
● Describe Fitter Snacker’s production and materials managementproblems.
● Describe how a structured process for Supply Chain Management plan-ning enhances efficiency and decision making.
● Describe how production planning data in an ERP system can be sharedwith suppliers to increase supply chain efficiency.
I N T R O D U C T I O N
In Chapter 2, you learned that Enterprise Resource Planning (ERP) has its roots in materials require-
ments planning (MRP). In fact, MRP is still a large part of today’s ERP systems. In this chapter, we’ll look
at Supply Chain Management (SCM) in an ERP system. Fitter Snacker is part of a supply chain that starts
with farmers growing oats and wheat and ends with a customer buying an NRG bar from a retail store.
First, we will examine how Fitter Snacker manages its production activities, and then we will look at the
broader concept of supply chain management.

In Chapter 3, we looked at Fitter Snacker’s sales order process, and we assumed that FS had
enough snack bars in its warehouse to fill a typical order. Like most unintegrated manufacturing
operations, however, FS often has trouble scheduling production. Consequently, sometimes its ware-
house is not adequately stocked, and customer orders cannot be filled in a timely fashion, leading to
customer dissatisfaction and lost sales. In this chapter, you’ll explore FS’s SCM problems and learn how
ERP can help fix them.
P R O D U C T I O N O V E R V I E W
To meet customer demand efficiently, Fitter Snacker must develop a forecast of customerdemand, then develop a production schedule to meet the estimated demand. Develop-ing a production plan is a complicated task, but the end result answers two simple questions:
● How many of each type of snack bar should we produce, and when?● What quantities of raw materials should we order so we can meet that level of
production, and when should they be ordered?
Developing a good production plan is just the first part of serving customers: FitterSnacker must be able to execute the plan and make adjustments when customer demanddoes not meet the forecast. An ERP system is a good tool for developing and executing pro-duction plans because it integrates the SCM functions of production planning, purchas-ing, materials management/warehousing, quality management, and sales and accounting.To support even better planning of the supply chain, companies can connect ERP systemsto supplier and customer information systems as well.
In this chapter, we will use spreadsheet examples to illustrate the logic that FS shouldbe using to plan and schedule production of the bars. First, the production process ofmanufacturing the bars is explained. After demonstrating the planning and scheduling logicat each stage of the production planning process, using spreadsheets, we will show the SAPERP screens that implement the logic in an ERP environment. Throughout the chapter,you will learn why using an integrated information system is superior to using uninte-grated systems.
The goal of production planning is to schedule production economically, so that thecompany can ship goods to customers by the promised delivery dates in the most cost-efficient manner. There are three general approaches to production:
1. Make-to-stock items are made for inventory (the “stock”) in anticipation ofsales orders. Most consumer products (for example, cameras, canned corn, andbooks) are made this way.
2. Make-to-order items are produced to fill specific customer orders. Compa-nies usually take this approach when producing items that are too expensiveto keep in stock or items that are made or configured to customer
Chapter 4
78

specifications. Examples of make-to-order items are airplanes and large indus-trial equipment.
3. Assemble-to-order items are produced using a combination of make-to-stockand make-to-order processes. The final product is assembled for a specificorder from a selection of make-to-stock components. Personal computers area typical assemble-to-order product.
Fitter Snacker’s Manufacturing ProcessFitter Snacker uses make-to-stock production to produce its snack bars. The manufactur-ing process is illustrated in Figure 4-1.
The snack bar line can produce 200 bars a minute, or 3,000 pounds of bars per hour.Each bar weighs 4 ounces. The entire production line operates on one shift a day. Here’show it works.
Fitter Snacker’s Production Sequence
Raw materials are taken from the warehouse to one of four mixers. Each mixer mixes doughin 500-pound batches. Mixing a batch of dough requires 15 minutes of mixing time, plus15 additional minutes to unload, clean, and load the mixer for the next batch of dough;therefore, each mixer can produce two 500-pound batches of dough per hour—more thanthe production line can process. Because only three mixers need to be operating at a timeto produce 3,000 pounds of snack bars per hour, a mixer breakdown will not shut down theproduction line.
After mixing, the dough is dumped into a hopper (bin) at the beginning of the snackbar line. A forming mechanism molds the dough into bars, which will weigh 4 ounces eachafter baking. Next, an automated process takes the formed bars on a conveyor belt throughan oven that bakes the bars for 30 minutes. When the bars emerge from the oven, theyare individually packaged in a foil wrapper, and each group of 24 bars is packaged into a dis-play box. At the end of the snack bar line, production personnel either stack the display
Raw
mat
eria
l war
eho
use
Mixer
Mixer
Mixer
Mixer
Mixer Fini
shed
go
od
s w
areh
ous
e
Snack bar line
Form Bake Pack
FIGURE 4-1 Fitter Snacker’s manufacturing process
Production and Supply Chain Management Information Systems
79

boxes on pallets (for small orders) or pack the display boxes into shipping boxes and takethem to the finished goods warehouse.
Changing the snack bar line from one type of bar to the other takes 30 minutes, forcleaning the equipment and changing the wrappers, display boxes, and shipping cases. Eachnight, a second shift of employees cleans all the equipment thoroughly and sets it up forthe next day’s production. Thus, changing production from NRG-A on one day to NRG-B thenext day can be done at the end of the day without a loss of capacity. Capacity is theamount of bars that can be produced. On the other hand, producing two products in one dayresults in a half-hour loss of capacity during the changeover.
Fitter Snacker’s Production ProblemsFitter Snacker has no problems making snack bars. Fitter Snacker has problems decidinghow many bars to make and when to make them. The manufacturing process at FS suf-fers from a number of problems, from communication breakdowns and inventory issues toaccounting inconsistencies, mainly stemming from the unintegrated nature of its informa-tion systems.
Communication Problems
Communication breakdowns are inherent in most companies, and they are magnified in acompany with an unintegrated information system. For example, FS’s Marketing and Salespersonnel do not share information with Production personnel: M/S frequently excludesProduction from meetings, doesn’t consult Production when planning sales promotions,fails to notify Production of planned promotions, and gives Production no warning that it hastaken an exceptionally large order.
When Production must meet an unexpected increase in demand, several things happen.First, an unexpected spike in sales depletes warehouse inventories. To compensate, Pro-duction must schedule overtime labor, which results in higher production costs forproducts. Second, some materials, such as ingredients, wrappers, and display boxes, arecustom products purchased from a single vendor. A sudden increase in sales demand mightcause shortages or even a stockout of these materials. Getting them to the plant mightrequire expedited shipping, further increasing the cost of production. Finally, Productionpersonnel are evaluated on their performance—how successful they are at controllingcosts, keeping manufacturing lines running, maintaining quality control, and operatingsafely. If they can’t keep production costs down, Production staff receive poor evaluations.Managers are especially frustrated when an instant need for overtime follows a period oflow demand. With advance notice of a product promotion by Marketing, they could haveused the slack period to build up inventory in anticipation of the increase in sales.
Inventory Problems
Fitter Snacker’s week-to-week and day-to-day production planning is not linked to expectedsales levels in a systematic way. When deciding how much to produce, the production man-ager applies rules developed through experience. Her primary indicator is the differ-ence between the normal amount of finished goods inventory that should be stocked andthe actual inventory levels of finished goods in the warehouse. Thus, if NRG-A or NRG-Binventory levels seem low, the production manager schedules more bars for production.
Chapter 4
80

However, she doesn’t want too many bars in inventory because they have a limited shelflife. Her judgment is also influenced by the information she hears informally from people inMarketing about expected sales.
The production manager’s inventory data are in an Access database. Data records arenot maintained in real time, and they do not flag inventory that has been sold but not yetshipped. Such inventory is not available for sale, of course, but employees cannot deter-mine this from the records, and thus do not know the level of inventory that is availableto ship. This is problematic if the Wholesale Division generates unusually large orders orhigh volumes of orders. For example, two large Wholesale Division orders arriving at thesame time can deplete the entire available inventory of NRG-A bars. In this case, the Pro-duction department must change the production schedule for NRG-B bars so it can fill theorders for NRG-A. This changeover means delaying production of NRG-B bars, and losingproduction capacity due to the unplanned production changeover.
The production manager lacks not only a systematic method for meeting anticipatedsales demand, but also a systematic method for adjusting production to reflect actual sales.M/S does not share actual sales data with the Production department, partly because thisinformation is hard to gather on a timely basis and partly because of a lack of trustbetween the Sales and Production departments (as a result of prior negative experiencesor competition between the departments). Hence, the production manager must use ware-house inventory levels as a benchmark; standard levels of inventory are the only guideavailable. If Production had access to sales forecasts and real-time sales order informa-tion, the manager could make timely adjustments to production, if needed. These adjust-ments would allow inventory levels to come much closer to what is actually needed.
Accounting and Purchasing Problems
Production and Accounting do not have a good way to accumulate the day-to-day costs ofFS’s production. As discussed in Chapter 3, the warehouse keeps a fairly good runningcount of what is on hand. Furthermore, the company takes a monthly inventory, and actualcounts are usually within 5 percent of what is on the books. Management would like to bemore accurate, of course, but without a real-time inventory system, FS cannot achievehigher inventory accuracy.
Manufacturing costs are based on the number of bars produced each day, a number thatis measured at the end of the snack bar production line. Fitter Snacker uses standard costsfor the purpose of figuring manufacturing costs. Standard costs are the normal costs ofmanufacturing a product, and they are calculated from historical data and any changes inmanufacturing that have occurred since the collection of the historical data. For eachbatch of bars it produces, FS can estimate direct costs (materials and labor) and indirectcosts (factory overhead). The number of batches produced is multiplied by the stan-dard cost of a batch, and the resulting amount is charged to manufacturing costs.
Most manufacturing companies use standard costs in some way, but the methodrequires that standards be adjusted periodically to conform with actual costs. (These adjust-ments will be discussed in Chapter 5.) Actual Fitter Snacker raw material and labor costsoften deviate from the standard costs. FS is not good at controlling raw materials pur-chases, and the production manager cannot give the Purchasing manager a good produc-tion forecast. So the Purchasing manager works on two tracks: First, she tries to keep
Production and Supply Chain Management Information Systems
81

inventories high to avoid stockouts. Second, if she’s offered good bulk-quantity discountson raw materials such as oats, she will buy in bulk, especially for items that have long leadtimes for delivery. These purchasing practices make it difficult to forecast the volume ofraw materials that will be on hand and their average cost. FS also has trouble accuratelyforecasting the average cost of labor for a batch of bars because of the frequent need forovertime labor.
Thus, Production and Accounting must periodically compare standard costs with actualcosts and then adjust the accounts for the inevitable differences. This is always a tediousand unpleasant job. The comparison should be done at each monthly closing, but FS oftenputs it off until the closing at the end of each quarter, when its financial backers requirelegitimate financial statements. The adjustments are often quite large, depending on pro-duction volumes and costs during the quarter.
Exercise 4.1a. A convenience store chain offers to buy a very large amount of its “store
brand” health bars (the NRG-B bars with a customized wrapper). The chainwants a lower-than-normal selling price, but the proposed order is qua-druple the size of its regular order. The marketing manager asks manag-ers from Production, Purchasing, and Accounting whether the terms ofthe proposed deal will be profitable. Why will the managers in these areashave trouble providing a reliable answer on short notice?
b. The production manager notes that warehouse inventory levels are fairlyhigh, so the production line does not need to be run for a full eight hourseach day during the coming week. She plans to run the line for eight hoursa day anyway, because if the line were down, workers would still need to bepaid during the idle time, and overhead costs would be incurred as well.Running the line full-time will also decrease the average cost of bars actu-ally produced (indirect costs can be spread over more bars), and somewarehoused raw materials will spoil if they’re not used soon. Is the produc-tion manager’s reasoning logical? Why, or why not?
T H E P R O D U C T I O N P L A N N I N G P R O C E S S
In this section, you will examine a systematic process for developing a production plan thattakes advantage of an ERP system. Production planning is a complicated process. Spread-sheet calculations are presented to explain and illustrate the key steps, and the correspond-ing screens in the SAP ERP system follow the spreadsheet data.
Production planners are employees who interact with the inventory system and thesales forecast to figure out how much to produce. They follow three important principles:
● Work from a sales forecast and current inventory levels to create an “aggre-gate” (“combined”) production plan for all products. Aggregate productionplans help to simplify the planning process in two ways: First, plans are madefor groups of related products rather than for individual products. Second, the
Chapter 4
82

time increment used in planning is frequently a month or a quarter, while theproduction plans that will actually be executed operate on a daily or weeklybasis. Aggregate plans should consider the available capacity in the facility.
● Break down the aggregate plan into more specific production plans for indi-vidual products and smaller time intervals.
● Use the production plan to determine raw material requirements.
Production planners aggregate products into product groups to reduce the number ofvariables they must consider when developing a production plan. Developing produc-tion groups can become complicated. For example, cereal manufacturers can group togetherdifferent package sizes, or they might group together product brands (such as kids’ cere-als, health cereals, and so on). A consumer products company may group by product types(e.g., shampoo, laundry detergent, and disposable diapers). The aggregate production planfor Fitter Snacker will combine the only two products, NRG-A and NRG-B bars, into onegroup to illustrate the process. The plan will be developed using a monthly time increment;then, this monthly production plan will be disaggregated to determine weekly raw mate-rial orders and daily production schedules.
The SAP ERP Approach to Production PlanningThe SAP ERP approach to the production planning process is shown in Figure 4-2. Referto this figure throughout this section to trace production planning.
Sales forecasting
Sales and operations planning
Demand management
Detailedscheduling
Production
MRP
Purchasing
Starting inventory
FIGURE 4-2 The production planning process
Production and Supply Chain Management Information Systems
83
The information at each stage of the production process flows through the followingsteps. Each step is explained in detail in the next section of the chapter.
● Sales forecasting is the process of developing a prediction of future demandfor a company’s products.
● Sales and operations planning (SOP) is the process of determining what thecompany will produce. The Sales forecasting and Starting Inventory levels inthe diagram are inputs to this process. At first glance, it would seem that acompany should just make products to match the forecasted sales, but devel-oping the production plan can be more complicated, because capacity mustbe considered. Many products have seasonal demand, and to meet demand dur-ing peak periods, production planners must decide whether to build up inven-tory levels before the peak demand, increase capacity during the peakperiod, subcontract production, or use some combination of these approaches.
● Demand management is the process of breaking down the production plan intofiner time units, such as weekly or even daily production figures, to meetdemand for individual products.
● Detailed scheduling uses demand management’s production plans as an inputfor a production schedule. Methods of detailed scheduling depend on the manu-facturing environment. For Fitter Snacker, the detailed production schedulewill determine when to switch between the production of NRG-A and NRG-Bbars.
● Production uses the detailed schedule to manage daily operations, answeringthe questions, “What should we be producing?” and “What staffing do we needto produce those products?”
● Materials requirements planning (MRP) determines the amount and timingof raw material orders. This process answers the questions, “What raw mate-rials should we be ordering so we can meet a particular level of production?”and “When should we order these materials?”
● Purchasing takes the quantity and timing information from MRP and createspurchase orders for raw materials, which it transmits to qualified suppliers.
Let’s take a more detailed look at each of these steps in the production process.
Sales ForecastingA range of forecasting techniques can be used to predict consumer demand. Fitter Snackerhas no formal way of developing a sales forecast and sharing it with Production. SAP’s ERPsystem takes an integrated approach. Whenever a sale is recorded in the Sales and Dis-tribution (SD) module, the quantity sold is recorded as a consumption value for thatmaterial. These consumption values can be maintained on a weekly or monthly basis, asdesired. If more detail is needed, the Logistics Information system that is part of SAP ERPcan record sales with more detail (for example, by region or sales office), or data can bestored in the separate Business Warehouse (BW) system for more detailed analysis. Withan integrated information system, accurate historical sales data are available for forecasting.
Chapter 4
84

One simple forecasting technique is to use a prior period’s sales and then adjust thosefigures for current conditions. To make a forecast for Fitter Snacker, we can use the pre-vious year’s sales data in combination with marketing initiatives to increase sales. Look atthe forecasts shown in Figure 4-3.
The sales data in Figure 4-3 are for shipping cases, which contain 12 display boxes thatcontain 24 bars each, for a total of 288 bars. Note in Figure 4-3 that the forecast starts withthe previous year’s sales levels, to reflect FS’s seasonal sales fluctuations (sales are higherin the summer when more people are active). Also note that there was a special market-ing promotion last year. The estimated impact of this promotion was an increase in salesof 300 cases for May and June. This increase must be subtracted from the previous year’ssales values to get an accurate base measurement. FS’s Marketing department antici-pates a 3 percent growth in sales over the previous year, based on research reported in tradepublications. And finally, FS will be launching a special marketing promotion at the end ofMay to increase sales at the beginning of the summer season. FS marketing experts thinkthis will result in an increase in sales of 500 cases for June.
Exercise 4.2Following the format of the spreadsheet shown in Figure 4-3, develop a spreadsheet toforecast Fitter Snacker’s sales for July through December. Make the sales growth rate of 3percent an input value, and calculate the base projection using the previous year’s val-ues, shown in Figure 4-4. Assume that the special marketing promotion last year resultedin an increase in sales of 200 cases for July, and that a special marketing promotion thisyear will result in an increase in sales for July of 400 cases.
Sales and Operations PlanningSales and operations planning (SOP) is the next step in the production planning process.The input to this step is the sales forecast provided by Marketing. The output of this step is
Jan. Feb. March April May JunePrevious year (cases) 5734 5823 5884 6134 6587 6735Promotion sales (cases) 300 300Previous year base (cases) 5734 5823 5884 6134 6287 6435Growth: 3.0% 172 175 177 184 189 193Base projection (cases) 5906 5998 6061 6318 6476 6628Promotion (cases) 500Sales forecast (cases) 5906 5998 6061 6318 6476 7128
Sales forecasting
FIGURE 4-3 Fitter Snacker’s sales forecast for January through June
July Aug. Sept. Oct. Nov. Dec.Previous year 6702 6327 6215 6007 5954 5813
Sales volume
FIGURE 4-4 Fitter Snacker’s sales for the previous period, July through December
Production and Supply Chain Management Information Systems
85

a production plan designed to balance market demand with production capacity. This pro-duction plan is the input to the next step, demand management.
A sales and operations plan is developed from a sales forecast and determines howManufacturing can efficiently produce enough goods to meet projected sales. In FitterSnacker’s case, there is no way to make this determination, because FS does not pro-duce a formal estimate of sales. If FS had an ERP system, the calculation would be doneas described here.
We know that Fitter Snacker can produce 200 bars per minute, so we can estimate theproduction capacity required by the sales forecast. Figure 4-5 shows FS’s sales and opera-tions plan for the first six months of the year.
At the start of January, the production planner is projecting a beginning inventory of100 cases. The first line in Figure 4-5 is the sales forecast, which is the output of the salesforecasting process shown in Figure 4-3. The next line is the production plan, which is devel-oped by the production planner in a trial-and-error fashion, observing the effect of differ-ent production quantities on inventory levels and capacity utilization (the amount ofplant capacity that is being consumed). The goal is to develop a production plan that meetsdemand without exceeding capacity and that maintains “reasonable” inventory levels (nei-ther too high or two low). This process requires judgment and experience. The third line,inventory, is the difference between the sales forecast and the production plan. The pro-duction planner has developed a plan that maintains a minimum planned inventory of100 cases. This inventory, called safety stock, is planned so that if sales demand exceedsthe forecast, sales can be met without altering the production plan. Notice that in May, theproduction plan is greater than the May sales forecast, and the inventory is 524. Why?Because the planner wants to build up inventory to handle the increased demand in June,which results from the normal seasonal increase in snack bar sales and additional demandfrom the planned promotional activities. The fourth line is working days, an input basedon the company calendar. Using the number of working days in a month, the availablecapacity each month is calculated in terms of the number of shipping cases.
200 bars per minute × 60 minutes per hour × 8 hours per day = 96,000 bars per day, whichequals 333.3 cases per day (96,000 bars per day ÷ 24 bars per box ÷ 12 boxes per case).
If you multiply the number of working days in a month by the production capacity of333.3 shipping cases per day, you get the monthly capacity in shipping cases, which isshown in line 5.
Sales and operations planning Dec. Jan. Feb. March April May June
1) Sales forecast 5906 5998 6061 6318 6476 7128
2) Production plan 5906 5998 6061 6318 6900 67003) Inventory 100 100 100 100 100 524 96
4) Working days 22 20 22 21 23 215) Capacity (shipping cases) 7333 6667 7333 7000 7667 7000
6) Utilization 81% 90% 83% 90% 90% 96%
7) NRG-A (cases) 70.0% 4134 4199 4243 4423 4830 46908) NRG-B (cases) 30.0% 1772 1799 1818 1895 2070 2010
FIGURE 4-5 Fitter Snacker’s sales and operations plan for January through June
Chapter 4
86
With the available capacity (assuming no overtime) now expressed in terms of ship-ping cases, it is possible to determine the capacity utilization for each month by dividing theproduction plan amount (line 2) by the available Capacity (line 5) and expressing the resultas a Utilization percentage (line 6). This capacity calculation shows whether FS has thecapacity necessary to meet the production plan. While higher levels of capacity utiliza-tion mean that Fitter Snacker is producing more with its production resources, this per-centage must be kept below 100 percent to allow for production losses due to productchangeovers, equipment breakdowns, and other unexpected production problems.
The last step in sales and operations planning is to disaggregate the plan, that is, breakit down into plans for individual products. Lines 7 and 8 disaggregate the planned produc-tion shown in line 2, based on the breakdown of 70 percent NRG-A and 30 percentNRG-B snack bars. This 70/30 breakdown is based on previous sales data for these products.These monthly production quantities are the output of the sales and operations planningprocess, and are the primary input to the demand management process.
Suppose that FS is regularly able to achieve production levels at 90 percent of capacity.If the sales forecast requires more than 90 percent capacity, FS management can choosefrom among the following alternatives to develop a production plan:
1. FS might choose not to meet all the forecasted sales demand, or it might reducepromotional activities to decrease sales.
2. To increase capacity, FS might plan to use overtime production. Doing that,however, would increase labor cost per unit.
3. Inventory levels could be built up in earlier months, when sales levels are lower,to reduce the capacity requirements in later months. Doing that, however,would increase inventory holding costs and increase the risk that NRG barsheld in inventory might pass their expiration date before being sold byretailers.
4. To find the right balance, management might try a hybrid approach to thecapacity problem: reduce sales promotions slightly, increase production in ear-lier months, and plan for some overtime production.
The monthly production quantities in lines 7 and 8 of Figure 4-5 create some inven-tory in May to meet June’s sales; in addition, some overtime production is likely in Junebecause capacity utilization is over 90 percent. This example illustrates the value of anintegrated system: it provides a tool to incorporate data from Marketing and Manufactur-ing to evaluate different plans. Whereas Marketing may want to increase sales, the com-pany might not increase its profits if overtime costs or inventory holding costs are too high.This sort of planning is difficult to do without an integrated information system, even forsmall companies like FS. Having an integrated information system helps managers of allfunctional areas meet corporate profit goals.
In SAP ERP, the sales forecast can incorporate historical sales data from the Sales andDistribution (SD) module, or input from plans developed in the Controlling (CO) modulecan form the basis for the forecast. In the CO module, profit goals for the company can beset, which can then be used to estimate the sales levels needed to meet the profit goals. Fig-ure 4-6 (on the next page) shows the sales and operations planning screen from the SAPERP system. The title of this screen is “Create Rough-Cut Plan.” Rough-cut planning is a
Production and Supply Chain Management Information Systems
87
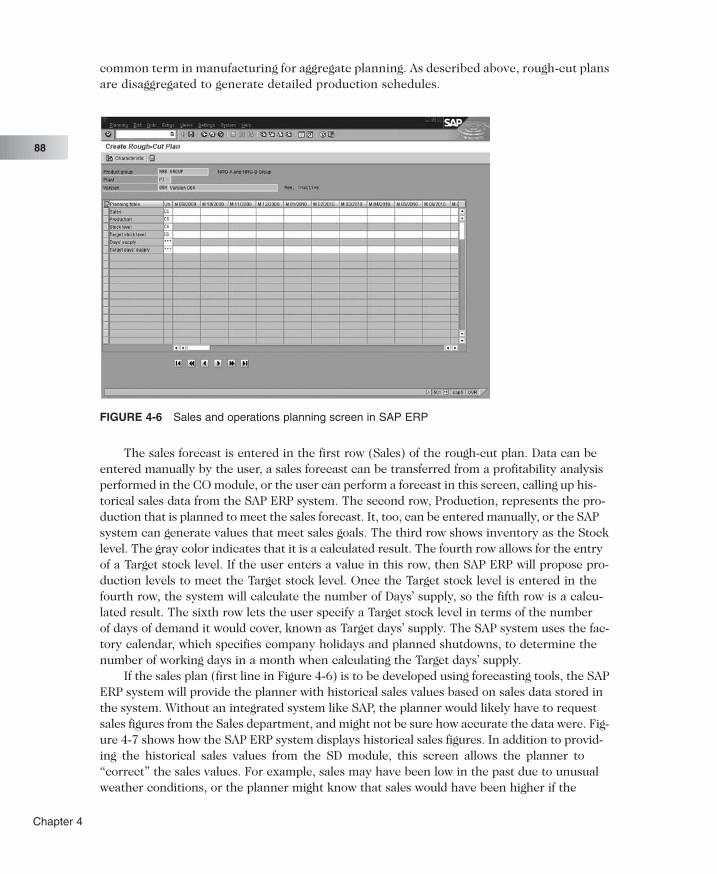
common term in manufacturing for aggregate planning. As described above, rough-cut plansare disaggregated to generate detailed production schedules.
The sales forecast is entered in the first row (Sales) of the rough-cut plan. Data can beentered manually by the user, a sales forecast can be transferred from a profitability analysisperformed in the CO module, or the user can perform a forecast in this screen, calling up his-torical sales data from the SAP ERP system. The second row, Production, represents the pro-duction that is planned to meet the sales forecast. It, too, can be entered manually, or the SAPsystem can generate values that meet sales goals. The third row shows inventory as the Stocklevel. The gray color indicates that it is a calculated result. The fourth row allows for the entryof a Target stock level. If the user enters a value in this row, then SAP ERP will propose pro-duction levels to meet the Target stock level. Once the Target stock level is entered in thefourth row, the system will calculate the number of Days’ supply, so the fifth row is a calcu-lated result. The sixth row lets the user specify a Target stock level in terms of the numberof days of demand it would cover, known as Target days’ supply. The SAP system uses the fac-tory calendar, which specifies company holidays and planned shutdowns, to determine thenumber of working days in a month when calculating the Target days’ supply.
If the sales plan (first line in Figure 4-6) is to be developed using forecasting tools, the SAPERP system will provide the planner with historical sales values based on sales data stored inthe system. Without an integrated system like SAP, the planner would likely have to requestsales figures from the Sales department, and might not be sure how accurate the data were. Fig-ure 4-7 shows how the SAP ERP system displays historical sales figures. In addition to provid-ing the historical sales values from the SD module, this screen allows the planner to“correct” the sales values. For example, sales may have been low in the past due to unusualweather conditions, or the planner might know that sales would have been higher if the
FIGURE 4-6 Sales and operations planning screen in SAP ERP
Chapter 4
88

company could have met all demand. The sales figures used for forecasting should representthe best estimate of what demand was in the past, not necessarily what the actual sales were.
The SAP ERP system can automatically graph these data to help the planner deter-mine if there are any unusual patterns in the historical sales values that requireinvestigation. The planner can “correct” these values as well, to adjust sales values thatwere unusually high or low, or to “back out” the effects of previous sales promotions. Afterthe sales forecast is made, it can be adjusted to incorporate increased sales from plannedsales promotions. Once the historical data are acceptable, the user can select one of theSAP ERP tools shown in Figure 4-8 to prepare the forecast.
Field where planner can“correct” the sales value
Sales provided fromSD module
FIGURE 4-7 Historical sales levels for Fitter Snacker
FIGURE 4-8 Forecasting model options in SAP ERP
Production and Supply Chain Management Information Systems
89

This screen allows the user to specify a number of forecasting parameters, includingwhether the model should allow for trends and seasonal variations. Once the SAP ERP sys-tem generates a forecast, the planner can view the results graphically, as shown in Fig-ure 4-9. While the SAP ERP system also provides the standard statistical measures offorecast accuracy, human judgment is frequently the best determinant of whether theforecast results make sense.
Another feature of the SAP ERP sales and operations planning process is the integra-tion of rough-cut capacity planning, which is shown in Figure 4-10. Rough-cut capacity plan-ning applies simple capacity-estimating techniques (like those shown in the spreadsheetexample in Figure 4-5) to the production plan, to see if the techniques are feasible. Fre-quently, rough-cut capacity planning techniques are applied to critical resources—thosemachines or production lines where capacity is usually limited. For a company like FitterSnacker, with a simple manufacturing process, these estimates can be very accurate. Formore complex manufacturing processes, these estimates will not be completely accurate butwill ensure that the production plans are at least reasonable. Managers can use SAP ERP’smore sophisticated planning tools at the detailed scheduling level, when the plans thatare developed will actually be converted into manufacturing decisions on the shop floor.
Forecasted sales
Historical sales values
FIGURE 4-9 Forecasting results presented graphically in SAP ERP
Chapter 4
90
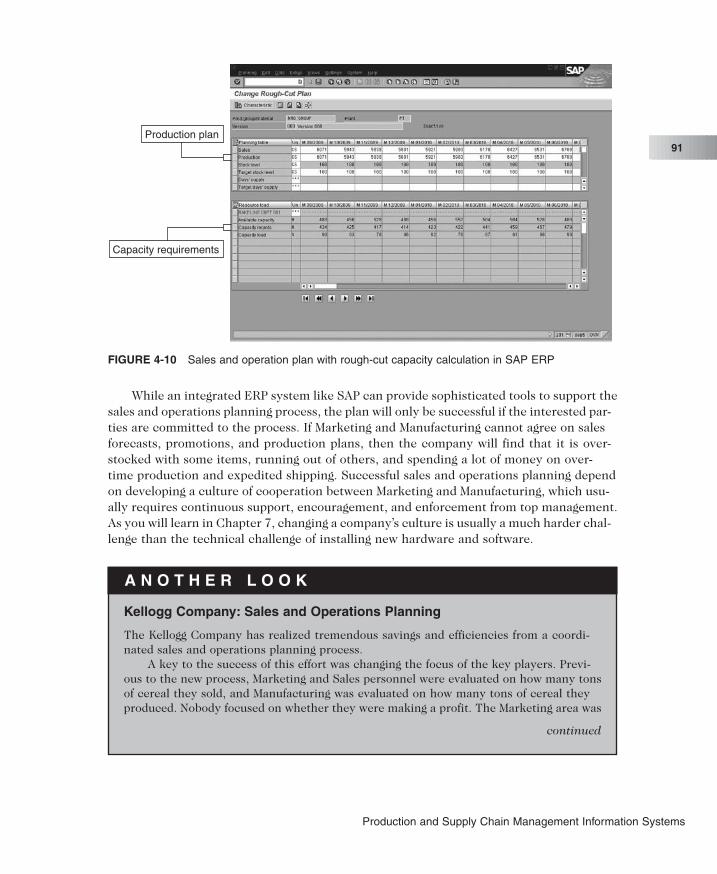
While an integrated ERP system like SAP can provide sophisticated tools to support thesales and operations planning process, the plan will only be successful if the interested par-ties are committed to the process. If Marketing and Manufacturing cannot agree on salesforecasts, promotions, and production plans, then the company will find that it is over-stocked with some items, running out of others, and spending a lot of money on over-time production and expedited shipping. Successful sales and operations planning dependon developing a culture of cooperation between Marketing and Manufacturing, which usu-ally requires continuous support, encouragement, and enforcement from top management.As you will learn in Chapter 7, changing a company’s culture is usually a much harder chal-lenge than the technical challenge of installing new hardware and software.
A N O T H E R L O O K
Kellogg Company: Sales and Operations Planning
The Kellogg Company has realized tremendous savings and efficiencies from a coordi-nated sales and operations planning process.
A key to the success of this effort was changing the focus of the key players. Previ-ous to the new process, Marketing and Sales personnel were evaluated on how many tonsof cereal they sold, and Manufacturing was evaluated on how many tons of cereal theyproduced. Nobody focused on whether they were making a profit. The Marketing area was
continued
Capacity requirements
Production plan
FIGURE 4-10 Sales and operation plan with rough-cut capacity calculation in SAP ERP
Production and Supply Chain Management Information Systems
91
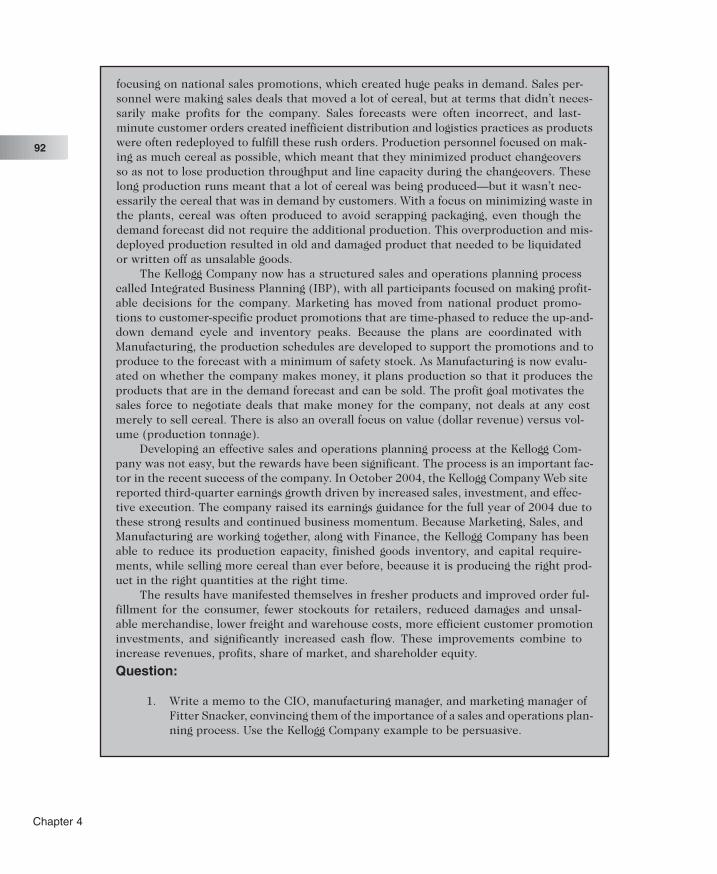
focusing on national sales promotions, which created huge peaks in demand. Sales per-sonnel were making sales deals that moved a lot of cereal, but at terms that didn’t neces-sarily make profits for the company. Sales forecasts were often incorrect, and last-minute customer orders created inefficient distribution and logistics practices as productswere often redeployed to fulfill these rush orders. Production personnel focused on mak-ing as much cereal as possible, which meant that they minimized product changeoversso as not to lose production throughput and line capacity during the changeovers. Theselong production runs meant that a lot of cereal was being produced—but it wasn’t nec-essarily the cereal that was in demand by customers. With a focus on minimizing waste inthe plants, cereal was often produced to avoid scrapping packaging, even though thedemand forecast did not require the additional production. This overproduction and mis-deployed production resulted in old and damaged product that needed to be liquidatedor written off as unsalable goods.
The Kellogg Company now has a structured sales and operations planning processcalled Integrated Business Planning (IBP), with all participants focused on making profit-able decisions for the company. Marketing has moved from national product promo-tions to customer-specific product promotions that are time-phased to reduce the up-and-down demand cycle and inventory peaks. Because the plans are coordinated withManufacturing, the production schedules are developed to support the promotions and toproduce to the forecast with a minimum of safety stock. As Manufacturing is now evalu-ated on whether the company makes money, it plans production so that it produces theproducts that are in the demand forecast and can be sold. The profit goal motivates thesales force to negotiate deals that make money for the company, not deals at any costmerely to sell cereal. There is also an overall focus on value (dollar revenue) versus vol-ume (production tonnage).
Developing an effective sales and operations planning process at the Kellogg Com-pany was not easy, but the rewards have been significant. The process is an important fac-tor in the recent success of the company. In October 2004, the Kellogg Company Web sitereported third-quarter earnings growth driven by increased sales, investment, and effec-tive execution. The company raised its earnings guidance for the full year of 2004 due tothese strong results and continued business momentum. Because Marketing, Sales, andManufacturing are working together, along with Finance, the Kellogg Company has beenable to reduce its production capacity, finished goods inventory, and capital require-ments, while selling more cereal than ever before, because it is producing the right prod-uct in the right quantities at the right time.
The results have manifested themselves in fresher products and improved order ful-fillment for the consumer, fewer stockouts for retailers, reduced damages and unsal-able merchandise, lower freight and warehouse costs, more efficient customer promotioninvestments, and significantly increased cash flow. These improvements combine toincrease revenues, profits, share of market, and shareholder equity.
Question:
1. Write a memo to the CIO, manufacturing manager, and marketing manager ofFitter Snacker, convincing them of the importance of a sales and operations plan-ning process. Use the Kellogg Company example to be persuasive.
Chapter 4
92

Disaggregating the Sales and Operations Plan
As mentioned previously, companies typically develop sales and operations plans for prod-uct groups. Product groups are especially important for companies that have hundreds ofproducts, because developing unique plans for hundreds of individual products isextremely time-consuming. Furthermore, it would be hard to develop these plans in a coor-dinated fashion so that production capacity could be considered. Fitter Snacker’s prod-uct group is very simple, consisting of 70 percent NRG-A and 30 percent NRG-B bars. Figure4-11 shows how product groups are defined in the SAP ERP system. The system allows anynumber of products to be assigned to a product group. Product groups can have otherproduct groups as members, as well, so complicated aggregations can be defined.
When the sales and operation plan is disaggregated, the production plan quantitiesspecified for the group are transferred to the individual products that make up the group,according to the percentages defined in the product group structure (Figure 4-11).
The results of the disaggregation process can be seen in the Stock/Requirements Listshown in Figure 4-12 (on the next page). This screen displays the inventory level for anindividual product, including all planned additions and reductions. As you can see in Fig-ure 4-12, the production plan from the sales and operation plan has been added to theStock/Requirements List for NRG-A bars as reductions to the inventory levels.
The Stock/Requirements List is aptly named. It shows current stock, required materi-als, material expected to be received, and availability.
NRG group consists of70% NRG-A bars and30% NRG-B bars
FIGURE 4-11 Product group structure in SAP ERP
Production and Supply Chain Management Information Systems
93
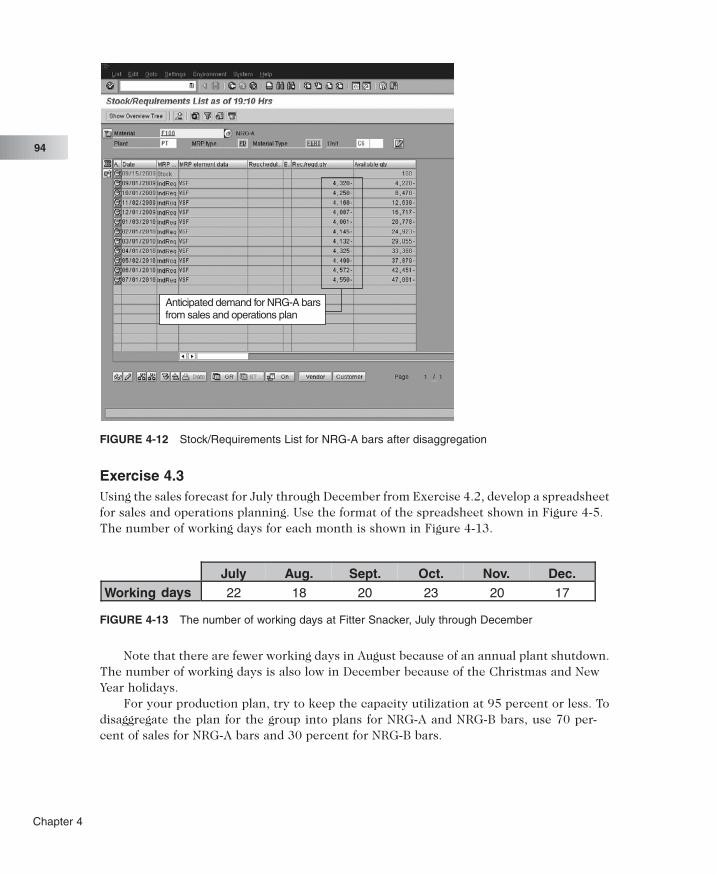
Exercise 4.3Using the sales forecast for July through December from Exercise 4.2, develop a spreadsheetfor sales and operations planning. Use the format of the spreadsheet shown in Figure 4-5.The number of working days for each month is shown in Figure 4-13.
Note that there are fewer working days in August because of an annual plant shutdown.The number of working days is also low in December because of the Christmas and NewYear holidays.
For your production plan, try to keep the capacity utilization at 95 percent or less. Todisaggregate the plan for the group into plans for NRG-A and NRG-B bars, use 70 per-cent of sales for NRG-A bars and 30 percent for NRG-B bars.
Anticipated demand for NRG-A barsfrom sales and operations plan
FIGURE 4-12 Stock/Requirements List for NRG-A bars after disaggregation
days
FIGURE 4-13 The number of working days at Fitter Snacker, July through December
Chapter 4
94

Demand ManagementThe demand management step of the production planning process links the sales andoperations planning process with the detailed scheduling and materials requirements plan-ning processes. The output of the demand management process is the master produc-tion schedule (MPS), which is the production plan for all finished goods. For Fitter Snacker,the MPS is an input to detailed scheduling, which determines which bars to make and whento make them. The MPS is also an input to the MRP process, which determines what rawmaterials to order to support the production schedule.
The demand management process splits FS’s monthly production planning values intofiner time periods. Figure 4-14 shows January’s production plan by week and by day.
FS will use the weekly plan to plan materials management for purchasing. Daily planswill be used for the product(s) that are to be produced on the snack bar line. The calcu-lations were performed as follows:
● For the weekly plan, the MPS plan for NRG-A bars in week 1 was calculated as:4,134 cases in Jan. (monthly demand) × 4 working days in week 1 ÷ 22 workingdays in month of Jan. = 751.6 cases
FIGURE 4-14 Fitter Snacker’s production plan for January: The first five weeks of production arefollowed by a day-by-day disaggregation of week 1
Production and Supply Chain Management Information Systems
95
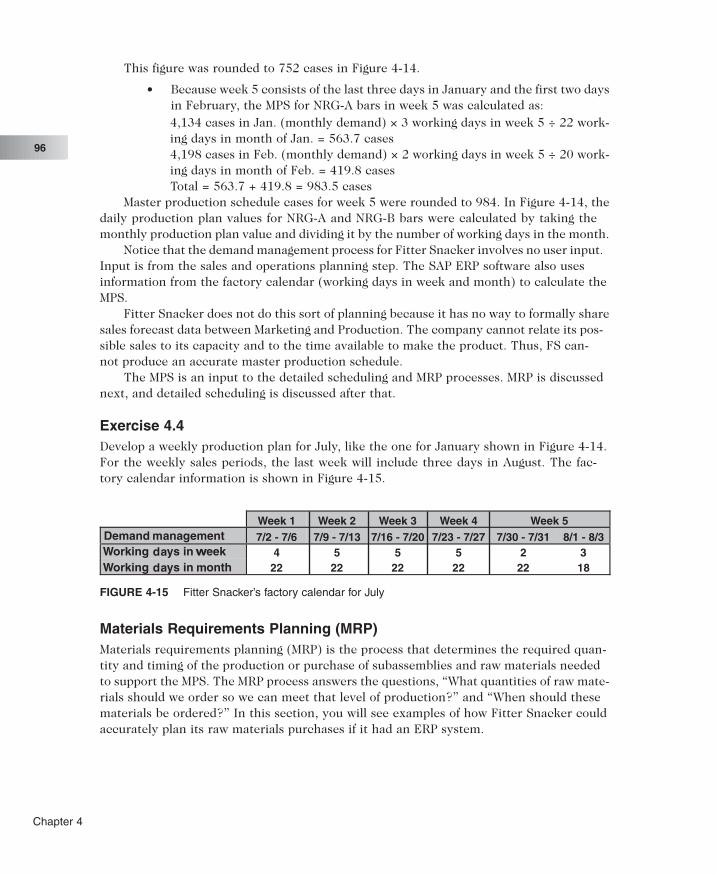
This figure was rounded to 752 cases in Figure 4-14.
● Because week 5 consists of the last three days in January and the first two daysin February, the MPS for NRG-A bars in week 5 was calculated as:4,134 cases in Jan. (monthly demand) × 3 working days in week 5 ÷ 22 work-ing days in month of Jan. = 563.7 cases4,198 cases in Feb. (monthly demand) × 2 working days in week 5 ÷ 20 work-ing days in month of Feb. = 419.8 casesTotal = 563.7 + 419.8 = 983.5 cases
Master production schedule cases for week 5 were rounded to 984. In Figure 4-14, thedaily production plan values for NRG-A and NRG-B bars were calculated by taking themonthly production plan value and dividing it by the number of working days in the month.
Notice that the demand management process for Fitter Snacker involves no user input.Input is from the sales and operations planning step. The SAP ERP software also usesinformation from the factory calendar (working days in week and month) to calculate theMPS.
Fitter Snacker does not do this sort of planning because it has no way to formally sharesales forecast data between Marketing and Production. The company cannot relate its pos-sible sales to its capacity and to the time available to make the product. Thus, FS can-not produce an accurate master production schedule.
The MPS is an input to the detailed scheduling and MRP processes. MRP is discussednext, and detailed scheduling is discussed after that.
Exercise 4.4Develop a weekly production plan for July, like the one for January shown in Figure 4-14.For the weekly sales periods, the last week will include three days in August. The fac-tory calendar information is shown in Figure 4-15.
Materials Requirements Planning (MRP)Materials requirements planning (MRP) is the process that determines the required quan-tity and timing of the production or purchase of subassemblies and raw materials neededto support the MPS. The MRP process answers the questions, “What quantities of raw mate-rials should we order so we can meet that level of production?” and “When should thesematerials be ordered?” In this section, you will see examples of how Fitter Snacker couldaccurately plan its raw materials purchases if it had an ERP system.
w
FIGURE 4-15 Fitter Snacker’s factory calendar for July
Chapter 4
96
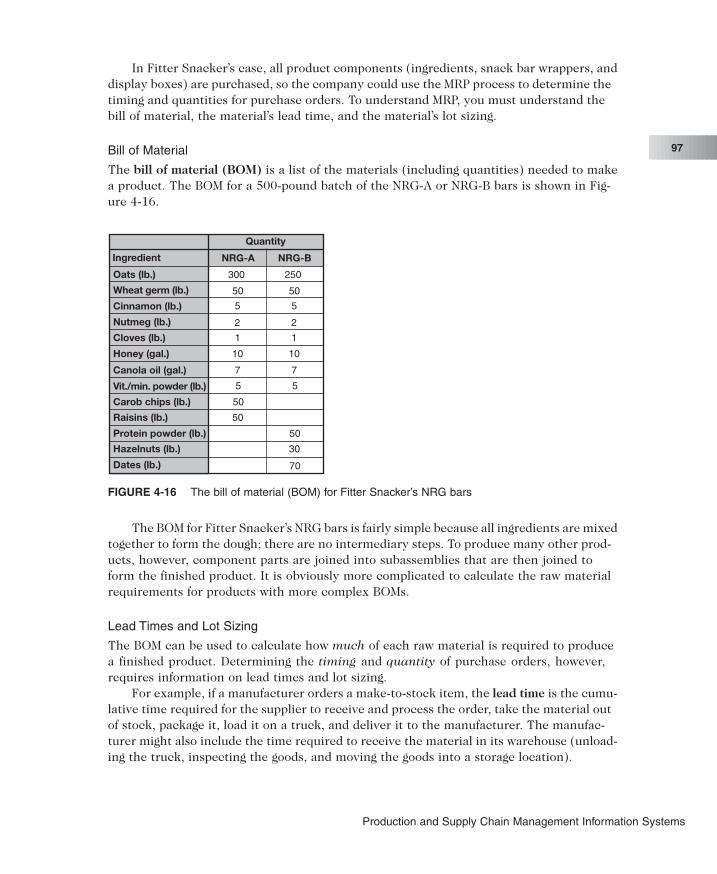
In Fitter Snacker’s case, all product components (ingredients, snack bar wrappers, anddisplay boxes) are purchased, so the company could use the MRP process to determine thetiming and quantities for purchase orders. To understand MRP, you must understand thebill of material, the material’s lead time, and the material’s lot sizing.
Bill of Material
The bill of material (BOM) is a list of the materials (including quantities) needed to makea product. The BOM for a 500-pound batch of the NRG-A or NRG-B bars is shown in Fig-ure 4-16.
The BOM for Fitter Snacker’s NRG bars is fairly simple because all ingredients are mixedtogether to form the dough; there are no intermediary steps. To produce many other prod-ucts, however, component parts are joined into subassemblies that are then joined toform the finished product. It is obviously more complicated to calculate the raw materialrequirements for products with more complex BOMs.
Lead Times and Lot Sizing
The BOM can be used to calculate how much of each raw material is required to producea finished product. Determining the timing and quantity of purchase orders, however,requires information on lead times and lot sizing.
For example, if a manufacturer orders a make-to-stock item, the lead time is the cumu-lative time required for the supplier to receive and process the order, take the material outof stock, package it, load it on a truck, and deliver it to the manufacturer. The manufac-turer might also include the time required to receive the material in its warehouse (unload-ing the truck, inspecting the goods, and moving the goods into a storage location).
Oats (lb.)
Wheat germ (lb.)
Cinnamon (lb.)
Nutmeg (lb.)
Cloves (lb.)
Honey (gal.)
Canola oil (gal.)
Vit./min. powder (lb.)
Carob chips (lb.)
Raisins (lb.)
Protein powder (lb.)
Hazelnuts (lb.)
Dates (lb.)
Ingredient NRG-A NRG-B
Quantity
300
50
5
2
1
10
7
5
50
50
250
50
5
2
1
10
7
5
50
30
70
FIGURE 4-16 The bill of material (BOM) for Fitter Snacker’s NRG bars
Production and Supply Chain Management Information Systems
97
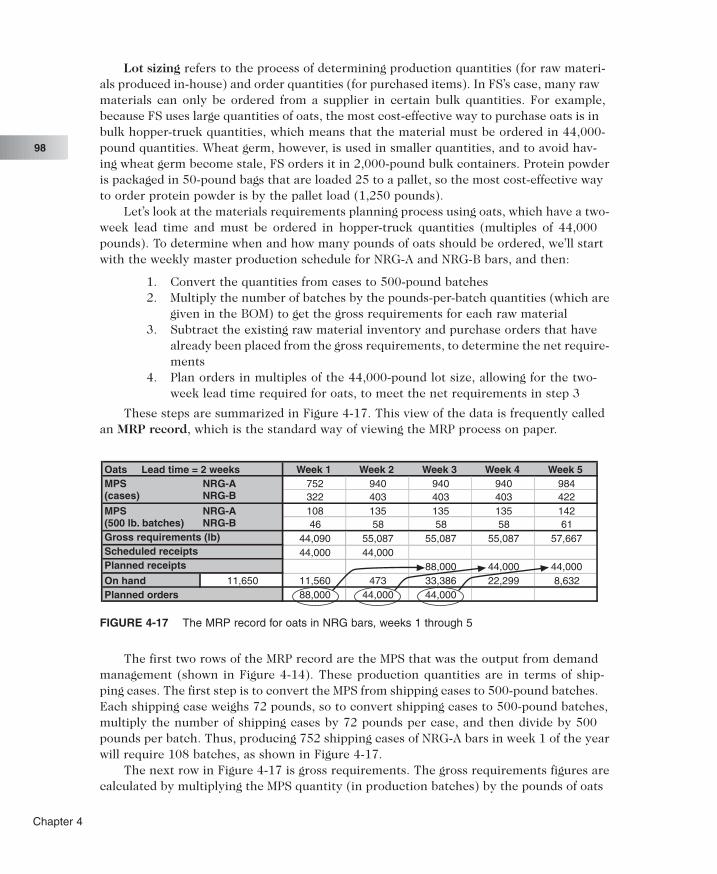
Lot sizing refers to the process of determining production quantities (for raw materi-als produced in-house) and order quantities (for purchased items). In FS’s case, many rawmaterials can only be ordered from a supplier in certain bulk quantities. For example,because FS uses large quantities of oats, the most cost-effective way to purchase oats is inbulk hopper-truck quantities, which means that the material must be ordered in 44,000-pound quantities. Wheat germ, however, is used in smaller quantities, and to avoid hav-ing wheat germ become stale, FS orders it in 2,000-pound bulk containers. Protein powderis packaged in 50-pound bags that are loaded 25 to a pallet, so the most cost-effective wayto order protein powder is by the pallet load (1,250 pounds).
Let’s look at the materials requirements planning process using oats, which have a two-week lead time and must be ordered in hopper-truck quantities (multiples of 44,000pounds). To determine when and how many pounds of oats should be ordered, we’ll startwith the weekly master production schedule for NRG-A and NRG-B bars, and then:
1. Convert the quantities from cases to 500-pound batches2. Multiply the number of batches by the pounds-per-batch quantities (which are
given in the BOM) to get the gross requirements for each raw material3. Subtract the existing raw material inventory and purchase orders that have
already been placed from the gross requirements, to determine the net require-ments
4. Plan orders in multiples of the 44,000-pound lot size, allowing for the two-week lead time required for oats, to meet the net requirements in step 3
These steps are summarized in Figure 4-17. This view of the data is frequently calledan MRP record, which is the standard way of viewing the MRP process on paper.
The first two rows of the MRP record are the MPS that was the output from demandmanagement (shown in Figure 4-14). These production quantities are in terms of ship-ping cases. The first step is to convert the MPS from shipping cases to 500-pound batches.Each shipping case weighs 72 pounds, so to convert shipping cases to 500-pound batches,multiply the number of shipping cases by 72 pounds per case, and then divide by 500pounds per batch. Thus, producing 752 shipping cases of NRG-A bars in week 1 of the yearwill require 108 batches, as shown in Figure 4-17.
The next row in Figure 4-17 is gross requirements. The gross requirements figures arecalculated by multiplying the MPS quantity (in production batches) by the pounds of oats
Oats Lead time = 2 weeks Week 1 Week 2 Week 3 Week 4 Week 5MPS NRG-A 752 940 940 940 984(cases) NRG-B 322 403 403 403 422MPS NRG-A 108 135 135 135 142(500 lb. batches) NRG-B 46 58 58 58 61Gross requirements (lb) 44,090 55,087 55,087 55,087 57,667Scheduled receipts 44,000 44,000Planned receipts 88,000 44,000 44,000On hand 11,650 11,560 473 33,386 22,299 8,632Planned orders 88,000 44,000 44,000
FIGURE 4-17 The MRP record for oats in NRG bars, weeks 1 through 5
Chapter 4
98

needed for a batch of snack bars. FS uses 300 pounds of oats per batch of NRG-A bar and250 pounds of oats per batch of NRG-B bar. This information is derived from the BOM (Fig-ure 4-16). Therefore, for week 1, FS needs:
● NRG-A: 108.3 batches × 300 lb. per batch = 32,490 lb. oats● NRG-B: 46.4 batches × 250 lb. per batch = 11,600 lb. oats
Total = 44,090 lb. oatsThe next row in Figure 4-17 is the scheduled receipts. This row shows the expected
arrival dates of orders of materials that have already been placed, meaning that the sup-plier has been given the purchase order and is in the process of fulfilling it. There is a two-week lead time for oats, so for oats to be available in week 1 and week 2 of the year, oatsorders must be placed in the last two weeks of the previous year.
The next row, planned receipts, shows when planned orders will arrive. The plannedreceipts row is directly related to the planned orders row at the bottom of the record. Aplanned order is one that has not been placed with the supplier but will need to be placedto prevent Production from running out of materials. Because there is a two-week lead timefor oat orders, the items in the planned orders will be available for production in two weeks,which is indicated by an entry in the planned receipts row. The arrows in Figure 4-17show the relationship between planned orders and planned receipts. For example, theplanned order for 88,000 pounds of oats in week 1 will be available for use in week 3, whichis shown by the planned receipt of 88,000 pounds in week 3. The materials require-ments planning calculation suggests that an order for 88,000 pounds of oats should beplaced in week 1 so that it will arrive in week 3; there is only one order, but it shows upin two places on the MRP record.
The next row in Figure 4-17 is the on hand row. The first number in this row (11,650)is the inventory of oats on hand at the beginning of week 1. The number in the week 1 col-umn (11,560) is a projection of the inventory that will be on hand at the end of week 1(and therefore at the beginning of week 2)—accounting for the beginning inventory, grossrequirements, and planned and scheduled receipts. In the case of the on-hand value forweek 1, the initial inventory of 11,650 pounds, plus the 44,000 pounds of scheduled deliv-ery, minus the 44,090 gross requirement, leaves 11,560 pounds of oats available at the startof week 2.
The last row is the planned orders row. This is the quantity that the MRP calculationrecommends ordering, and it is the output from the MRP process that purchasing uses todetermine what to order to produce the product, and when to order it.
Many times, a planner may intervene to tell the system to adjust the planned order.For example, notice that the on-hand quantity of oats in week 2 is only 473 pounds. Thismeans that at the start of week 2, there will only be enough oats to mix one batch of dough.Since the production line produces 3,000 pounds of bars per hour, one batch of dough willkeep the production line running for only 10 minutes. If the scheduled order does notarrive early enough on the first day of week 2, the production line could be shut down. Whenthe purchase order scheduled to arrive in week 1 was ready to be placed (two weeks priorto the beginning of week 1), the planner should have evaluated that order, consideringthe low inventory level projected for the beginning of week 2. The planner might havedecided to place an order for two hopper-truck loads of oats, instead of the planned orderfor one load. Or he could have ensured that the scheduled receipt shown in week 2 would
Production and Supply Chain Management Information Systems
99

actually be delivered at the end of week 1. Planning factors such as lead times are just esti-mates, so someone should evaluate the planned orders suggested by the materials require-ments planning calculation before allowing the program to automatically turn them intopurchase orders.
Notice once again the need for software to help with this kind of calculation. Of course,a human being can do these computations, but with many products and constituent mate-rials, the calculations become very tedious and are prone to error. Even for a small com-pany such as FS, doing the calculations with reasonable speed and accuracy requiressoftware help. Notice also the information needed to do the MRP calculation: startingwith a sales forecast, the software works down to the master production schedule and thento a schedule of needed raw materials.
Exercise 4.5Develop an MRP record, similar to the one in Figure 4-17, for wheat germ for the five weeksof January. Wheat germ must be ordered in bulk-container quantities, so the plannedorders must be in multiples of 2,000 pounds. Use a lead time of one week and an initialon-hand inventory of 1,184 pounds; assume that an order of 8,000 pounds is scheduledfor receipt during week 1. Are there any weeks when you, as a planner, would consider plac-ing an order above or below the minimum required? Why? Assume that there are no prob-lems with storage capacity or shelf life.
Exercise 4.6Fitter Snacker’s purchasing policy has been to carry high levels of inventory to avoidstockouts. Why can inventory levels be lower with an integrated ERP system and MRP-based purchasing? If you had to calculate the financial advantage of this change, howwould you do it?
Materials Requirements Planning in SAP ERPThe MRP list in SAP ERP looks very much like a Stock/Requirements List, which you alreadysaw in Figure 4-12. The MRP list shows the results of the MRP calculations, while the Stock/Requirements List shows those results plus any changes that have occurred since theMRP list was generated (planned orders converted to purchase orders or production orders,material receipts, and so on). Because the materials requirements planning calculationsare time-consuming to process for a company producing hundreds of products using thou-sands of parts, the MRP process is usually repeated every few days—or perhaps weekly. TheStock/Requirements List allows the users of the system to see what is happening (andwill happen) with a material in real time. Compare the data shown in the MRP record in Fig-ure 4-17 with the MRP list in Figure 4-18 and the Stock/Requirements List in Figure 4-19.
The MRP list in Figure 4-18 shows planned orders (PldOrd) and dependent require-ments (DepR) in the second column. Dependent requirements represent the demand forsnack bar dough from planned orders. Each batch of snack bar dough planned by the sys-tem requires 300 pounds of oats for NRG-A bars and 250 pounds of oats for NRG-B bars,which are referred to as dependent requirements because they are records (data) cre-ated by the production plans for snack bar dough. The MRP process creates planned
Chapter 4
100
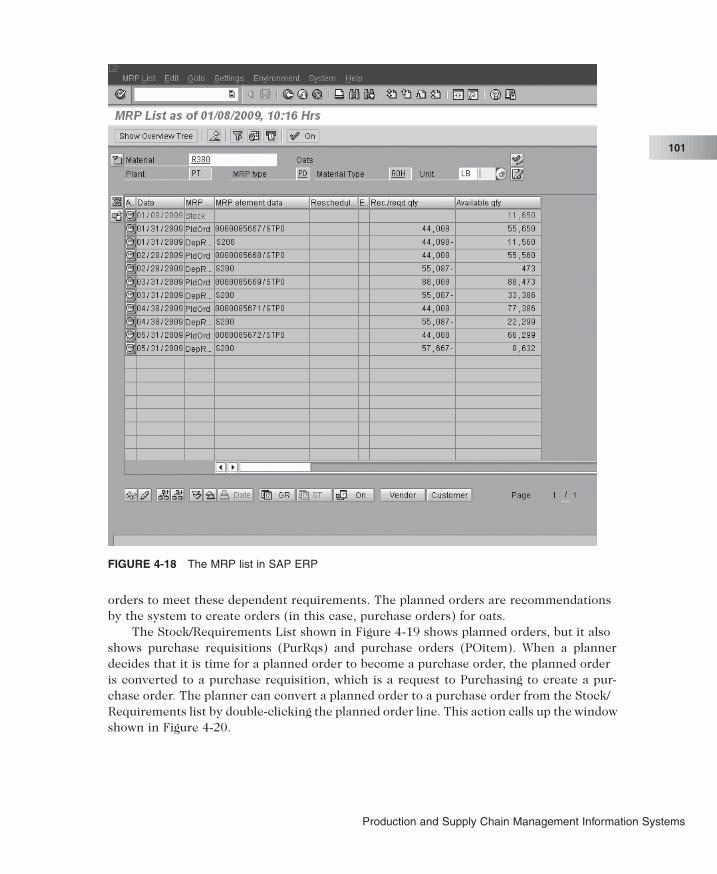
orders to meet these dependent requirements. The planned orders are recommendationsby the system to create orders (in this case, purchase orders) for oats.
The Stock/Requirements List shown in Figure 4-19 shows planned orders, but it alsoshows purchase requisitions (PurRqs) and purchase orders (POitem). When a plannerdecides that it is time for a planned order to become a purchase order, the planned orderis converted to a purchase requisition, which is a request to Purchasing to create a pur-chase order. The planner can convert a planned order to a purchase order from the Stock/Requirements list by double-clicking the planned order line. This action calls up the windowshown in Figure 4-20.
FIGURE 4-18 The MRP list in SAP ERP
Production and Supply Chain Management Information Systems
101

FIGURE 4-19 The Stock/Requirements List in SAP ERP
Planned order releaseand receipt dates
Option to convertplanned order topurchase requisition
FIGURE 4-20 Conversion of planned order to purchase requisition
Chapter 4
102

From this window, the planner can create a purchase requisition or review the plannedorder and make changes before creating the requisition. SAP ERP also provides the abil-ity to mass-process planned orders, by converting groups of planned orders to purchaseorders simultaneously. The materials requirements planning process can also be config-ured to automatically create purchase requisitions; for example, all planned orders cre-ated within one week of the MRP calculation could be automatically created as purchaserequisitions.
Once a purchase requisition is created, an employee in the Purchasing department hasto turn it into a purchase order. One of the important steps in creating a purchase orderis choosing the best vendor to supply the material. An integrated information system suchas SAP can facilitate this process. Figure 4-21 shows the Source Overview screen, whichprovides access to information that can help to select the vendor. From this screen, the Pur-chasing employee can view information about each vendor, simulate the price from eachvendor (which might include quantity discounts and transportation costs), and also look atthe vendor evaluation—the company’s rating of the vendor. The SAP ERP system can beconfigured to rate vendors based on a number of performance criteria, including quality ofgoods provided and on-time delivery. The evaluation scores for each vendor are updatedautomatically as materials are received. The integrated information system allows Purchas-ing to make the best decision on a vendor based on relevant, up-to-date information.
Once the Purchasing employee decides which vendor to use, the purchase order istransmitted to the vendor. The SAP ERP system can print out a paper order that can bemailed to the vendor. More likely, the system will be configured to either fax the orderto the vendor, transmit it electronically through EDI (electronic data interchange), or sendit over the Internet.
Options toevaluate vendors
FIGURE 4-21 Source Overview screen for supplier selection
Production and Supply Chain Management Information Systems
103
Detailed SchedulingFinally, let’s examine the last portion of the production process, detailed scheduling. Theaggregate production plan for product groups developed in sales and operations planning isdisaggregated to individual products in finer time increments through the demand man-agement process. In detailed scheduling, a detailed plan of what is to be produced needs tobe developed, considering machine capacity and available labor. Detailed scheduling issomewhat complex and tedious and will not be presented here in spreadsheet form, but wewill discuss the important concepts and issues.
A key decision in detailed production scheduling is how long to make the productionruns for each product. Longer production runs mean that fewer machine setups arerequired, reducing the production costs and increasing the effective capacity of theequipment. On the other hand, shorter production runs can be used to lower the inven-tory levels for finished products. Thus, the production run length requires a balancebetween setup costs and holding costs to minimize total costs to the company.
Because the capacity of the Fitter Snacker production mixers is much greater than thatof the snack bar production line, scheduling mixer production is not an issue. Because thedough must be mixed before the snack bar production line can start, employees who runthe mixers at FS should begin working a half-hour before the employees who run the pro-duction line. Therefore, four batches of dough can be mixed before the production linestarts. With a bit of a head start and a detailed schedule for the production line, it is a simplematter for the personnel operating the mixers to keep ahead of the production line. Thus,the key step is to develop a detailed production schedule for the snack bar productionline.
The manufacturing process that Fitter Snacker uses is known as repetitivemanufacturing. Repetitive manufacturing environments usually involve production linesthat are switched from one product to another similar product. Most packaged consumergoods are produced in repetitive manufacturing environments. In repetitive manufactur-ing, production lines are scheduled for a period of time, rather than for a specific numberof items, although it is possible to estimate the number of items that will be produced overa period of time. For Fitter Snacker, the production schedule for a week might be to pro-duce NRG-A bars from Monday morning until the end of Wednesday, then change over toNRG-B bars for all of Thursday until Friday at noon, when the production line will beswitched back to NRG-A bars. Given this schedule, it is possible to estimate the numberof bars that will be produced. Figure 4-22 shows the repetitive manufacturing planningscreen in the SAP ERP system. This screen allows the planner to view capacity, produc-tion schedule length, and quantity produced in one screen. NRG-A bars are being pro-duced for 31⁄2 days, and NRG-B bars are being produced for 41⁄2 days. The top line showsavailable capacity of 24 hours a day from September 15 through September 28. The bot-tom screen shows that a total of 1,095 cases of NRG-A snack bars will be produced fromSeptember 15 through September 20, and then production will change over to NRG-B barson September 20. The NRG-B bars will be produced through September 24. Notice that Fit-ter Snacker has no production scheduled over the weekend.
In some companies, responsibility for inventory costs belongs to a Materials Manage-ment group, and capacity utilization performance is the responsibility of a Productiongroup. The Materials Management group wants short production runs to keep inventory
Chapter 4
104
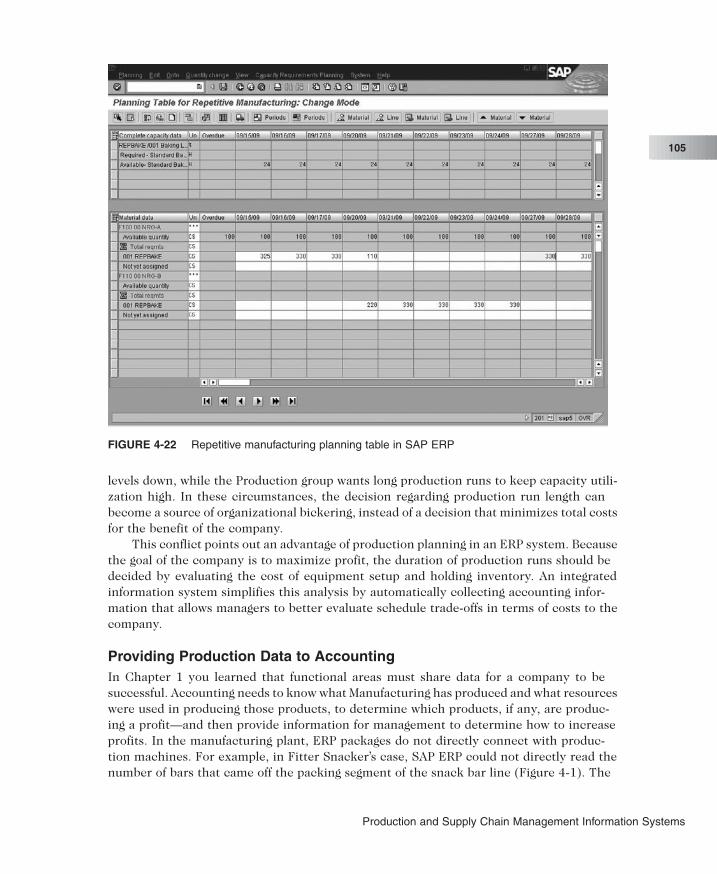
levels down, while the Production group wants long production runs to keep capacity utili-zation high. In these circumstances, the decision regarding production run length canbecome a source of organizational bickering, instead of a decision that minimizes total costsfor the benefit of the company.
This conflict points out an advantage of production planning in an ERP system. Becausethe goal of the company is to maximize profit, the duration of production runs should bedecided by evaluating the cost of equipment setup and holding inventory. An integratedinformation system simplifies this analysis by automatically collecting accounting infor-mation that allows managers to better evaluate schedule trade-offs in terms of costs to thecompany.
Providing Production Data to AccountingIn Chapter 1 you learned that functional areas must share data for a company to besuccessful. Accounting needs to know what Manufacturing has produced and what resourceswere used in producing those products, to determine which products, if any, are produc-ing a profit—and then provide information for management to determine how to increaseprofits. In the manufacturing plant, ERP packages do not directly connect with produc-tion machines. For example, in Fitter Snacker’s case, SAP ERP could not directly read thenumber of bars that came off the packing segment of the snack bar line (Figure 4-1). The
FIGURE 4-22 Repetitive manufacturing planning table in SAP ERP
Production and Supply Chain Management Information Systems
105
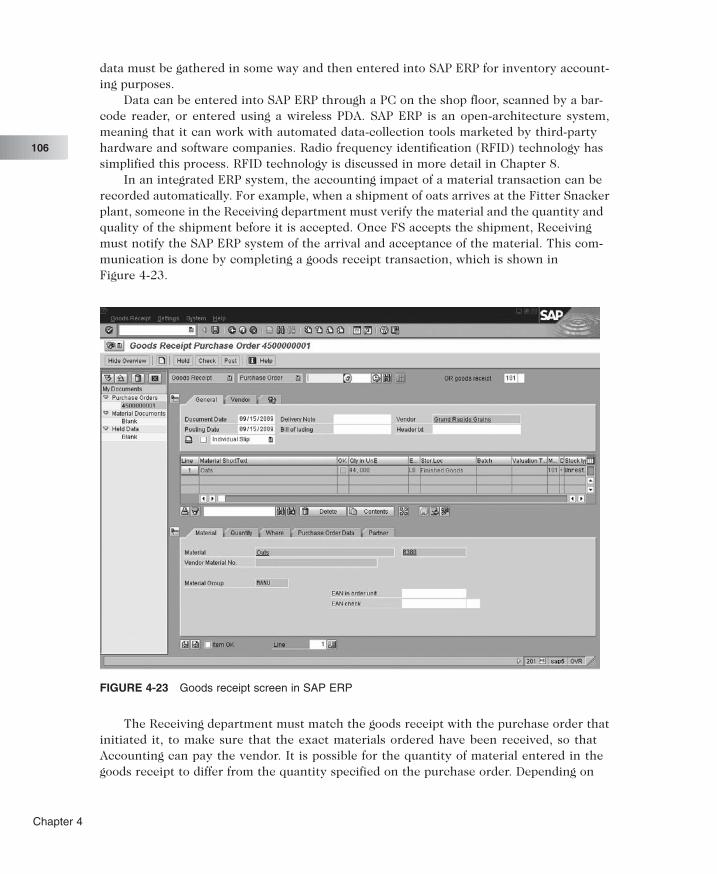
data must be gathered in some way and then entered into SAP ERP for inventory account-ing purposes.
Data can be entered into SAP ERP through a PC on the shop floor, scanned by a bar-code reader, or entered using a wireless PDA. SAP ERP is an open-architecture system,meaning that it can work with automated data-collection tools marketed by third-partyhardware and software companies. Radio frequency identification (RFID) technology hassimplified this process. RFID technology is discussed in more detail in Chapter 8.
In an integrated ERP system, the accounting impact of a material transaction can berecorded automatically. For example, when a shipment of oats arrives at the Fitter Snackerplant, someone in the Receiving department must verify the material and the quantity andquality of the shipment before it is accepted. Once FS accepts the shipment, Receivingmust notify the SAP ERP system of the arrival and acceptance of the material. This com-munication is done by completing a goods receipt transaction, which is shown inFigure 4-23.
The Receiving department must match the goods receipt with the purchase order thatinitiated it, to make sure that the exact materials ordered have been received, so thatAccounting can pay the vendor. It is possible for the quantity of material entered in thegoods receipt to differ from the quantity specified on the purchase order. Depending on
FIGURE 4-23 Goods receipt screen in SAP ERP
Chapter 4
106
the configuration settings, the SAP ERP system might block entry of the receipt if the dis-crepancy is too large. If the discrepancy is small, then the receipt may be allowed, with thedifference posted to the correct variance account, which allows the transaction to be pro-cessed but maintains a record for management to review, to see if there is a consistentproblem with a vendor “shorting” an order (consistently shipping less than was ordered).
When the receipt is successfully recorded, the SAP ERP system immediately recordsthe increase in inventory levels for the material. On the Accounting side of the system, thiscauses the value of the inventory shown in the general ledger account to automaticallyincrease as well. This is an important feature of an integrated information system: the goodsreceipt is recorded once, but the information is immediately available to both Manufactur-ing and Accounting—and the information is consistent. An integrated information sys-tem also has the ability to adjust for changes in material costs. If the cost of the materialchanges frequently, the system can be configured to reevaluate the value of all the inven-tory of the material that the company has. For example, suppose Fitter Snacker has 10,000pounds of cinnamon that it bought at $3 per pound. The company would value its inven-tory of cinnamon at $30,000. Then suppose the price of cinnamon has risen to $4 perpound, and Fitter Snacker has just purchased 1,000 pounds of cinnamon at the higher price.What is the value of the 11,000 pounds of cinnamon that Fitter Snacker now owns? TheSAP ERP system can be configured to use a moving average formula to reevaluate the inven-tory based on the current market prices. Depending on the exact nature of the formula, thecinnamon would be valued at somewhere between the $3 per pound previously assumedand the $4 per pound that was just paid. The system can perform this calculation automati-cally each time material is received.
Using an ERP package to record data does not necessarily make the shop-floor account-ing data more accurate. The ERP system allows employees to enter data in real time. Fur-thermore, capturing data for manufacturing and inventory purposes on the shop floormeans that it is captured at the same time for accounting and inventory managementpurposes—eliminating any need to reconcile Accounting and Manufacturing records. Butthe system requires employees to follow the process. If employees can take material outof inventory without recording the transaction, then the real-time information in the ERPsystem is worthless. Technologies such as bar-code scanners and RFID tags can help in thisprocess, but accurate data require both a capable information system and properly trainedand motivated employees.
Exercise 4.7Briefly describe how the implementation of SAP ERP might change the relationship betweenProduction and Warehousing at Fitter Snacker.
E R P A N D S U P P L I E R S
As mentioned in the introduction to this chapter, Fitter Snacker is part of a supply chainthat starts with farmers growing oats and wheat and ends with a customer buying an NRGbar from a retail store. Previously, companies used competitive bidding to achieve low pricesfrom suppliers, which frequently led to an adversarial relationship between suppliers andtheir customers. In recent years, companies have realized that they are part of a supply
Production and Supply Chain Management Information Systems
107

chain, and if the supply chain is more efficient, all participants in the chain can benefit. Col-laboration can frequently achieve more than competition, and ERP systems can play a keyrole in collaborative planning.
Working with suppliers in a collaborative fashion requires trust among all parties. Acompany opens its records to its suppliers, and suppliers can read the company’s databecause of common data formats. Working this way with suppliers cuts down on paper-work and response times. Reductions in paperwork, savings in time, and other efficiencyimprovements translate into cost savings for the company and the suppliers. ERP lets com-panies and suppliers share information (sales, inventory, production plans, and so on) inreal time throughout the supply chain. This allows all parties (suppliers, manufacturers, andcustomers) to eliminate from the supply chain costs that don’t add value to the product(such as inventory, overtime, changeovers, and spoilage), while simultaneously improvingcustomer service.
The Traditional Supply ChainThe term supply chain describes all of the activities that occur between the growing ormining of raw materials and the appearance of finished products on the store shelf. In a tra-ditional supply chain, information is passed through the supply chain reactively as partici-pants increase their product orders—as illustrated in Figure 4-24. For example, a retailersees an increase in the sales of FS’s bars and orders a larger quantity of bars from thewholesaler. If a number of retailers increase their orders, the wholesaler will increase itsorders from Fitter Snacker. When FS gets larger orders from wholesalers, it must increaseproduction to meet the increased demand. To increase production, FS will order more rawmaterials from suppliers.
Because of the time lags inherent in a traditional supply chain, it might take weeks—oreven months—for information about FS’s increased need for raw materials to reach FS’ssuppliers. Raw material suppliers may require time to increase their production to meet FS’slarger orders, resulting in temporary shortages for the supplier.
By contrast, if the participants in the supply chain are part of an integrated process,information about the increased customer demand can be passed quickly through the sup-ply chain, so each link in the chain can react quickly to the change.
FIGURE 4-24 Supply chain management (SCM) from raw materials to consumer
Chapter 4
108
EDI and ERP
The development of supply chain strategies does not necessarily require an ERP system.Before ERP systems were available, companies could be linked with customers and suppli-ers through electronic data interchange (EDI) systems. Recall from Chapter 2 that EDI isthe computer-to-computer exchange of standard business documents (such as purchaseorders) between two companies. A well-developed ERP system, however, can facilitate SCMbecause the needed production planning and purchasing systems are already in place. Inaddition, the integration of accounting data in the ERP system (described in the next chap-ter) allows management to evaluate changes in the market and make decisions about howthose changes should affect the production plan. With an ERP system, sharing produc-tion plans along the supply chain can occur in real time. Using the Internet can make thiscommunication even faster and cheaper than using private EDI networks.
A N O T H E R L O O K
Supply Chain Management: It’s All About Relationships
Procurement, the ordering of raw materials and supplies, has the potential to save compa-nies millions of dollars. According to FinListics, an Atlanta consulting company, if an aver-age Standard & Poor’s-listed company with $5 billion in revenue could reduce costthrough better procurement by 5 percent, it could increase profits by $20 million. The net-work technology; namely, the Internet, is in place. When a customer places an order onthe Internet, it starts a chain of reaction from all suppliers and manufacturers to fill thatorder. With the network technology in place, companies need only manage the relation-ships that go into these savings. Companies must open themselves up and share their salesforecasts, and manufacturing and inventory management systems. Traditionally, compa-nies’ suppliers and manufacturers have had adversarial relationships rather than open ones.
One company, Cisco, has taken a friendlier approach with its suppliers, and has mod-eled itself after the Japanese automakers – enabling their suppliers rather than challeng-ing them. Cisco’s philosophy is that if it can help suppliers be more efficient, it too can bemore efficient. Cisco, for example, operates an extranet to include suppliers on futureproduct plans so suppliers can start to gear up for future orders. Cisco, which makes net-working equipment, handles over 90 percent of orders over the Internet. Less than halfof Cisco employees even touch an order. Incoming orders trigger alerts to suppliers thatmake components for that specific order. Throughout order assembly, Cisco’s manufac-turing system is checking to make sure all assembly processes are set up perfectly. The sup-ply chain basically runs itself. According to AMR Research, Cisco’s revenue was $713,000per employee compared with the average $192,000 per employee of a Fortune 500 com-pany in 1999. Cisco says its administrative overhead has gone from $100 per order tobetween $5 and $6 per order.
With this sharing of information, ERP systems are more important than ever, accord-ing to Tim Lambeth, the Vanity Fair vice president of global finance. “[ERP is] more criti-cal than ever. If you are going to begin to collaborate with your suppliers, you will have
continued
Production and Supply Chain Management Information Systems
109
to have real-time information available to them. If Wal-Mart wants to come into my sys-tem to place or track orders, it expects my system to tell it precisely what I can do andwhen I can do it.” Lambeth states that companies who have not used the Web for their sup-ply chain management will soon be forced to by their customers.
Supply chain management comes down to relationships. Communication betweentrading partners is critical. For example, Staples, the office supply chain, wanted to knowwhy Hewlett-Packard required a 21-day lead time for orders. HP had believed that Staplesrequired the 21-day lead time, when in fact neither company required it – the param-eter was some leftover decision from the days when purchasing agents cut deals. Now thetwo companies have a seven-day lead time for orders. Staples can hold less safety stock,has fewer stock-outs, and HP has reduced its order-to-cash cycle time.
Staples shares a lot of information with its suppliers. In 2005, Staples set up a secureWeb site where its suppliers can log on and view Staples supply chain metrics. The met-rics act as a report card for each company, allowing for further communication with sup-pliers and thus improvement with the supply chain.
Question:
1. How can Fitter Snacker improve its relationships with its suppliers of rawmaterials?
The Measures of SuccessPerformance measurements (sometimes referred to as metrics) have been developed toshow the effects of better supply chain management. One measure is called the cash-to-cashcycle time. This term refers to the time between paying for raw materials and collectingcash from the customer. In one study, the cash-to-cash cycle time for companies with effi-cient SCM processes was a month, whereas it was 100 days for companies without SCM.
Another measure is total SCM costs. These costs include the cost of buying and han-dling inventory, processing orders, and information systems support. In one study, com-panies with efficient SCM processes incurred costs equal to 5 percent of sales. By contrast,companies without SCM incurred costs of up to 12 percent of sales.
Other metrics have been developed to measure what is happening between a com-pany and its suppliers. For example, Staples, the office-supply company, measures three fac-ets of the relationship. Initial fill rate is the percentage of the order that the supplierprovided in the first shipment. Another metric is initial order lead time, which is the timeneeded for the supplier to fill the order. Finally, Staples measures on-time performance.If the supplier agreed to requested delivery dates, this measurement tracks how often thesupplier actually met those dates.
Improvement in metrics like these leads to improvement in overall supply chain costmeasurements.
Exercise 4.8Assume a manufacturer of residential lawn and garden equipment is considering investingin hardware and software that will improve linkages with suppliers. Management expectsto save 5 percent of sales by tightening up the supply chain in the first year, 3 percent in the
Chapter 4
110

second year, and 1 percent in the third year. The company’s annual sales are $1 billion. Thecompany’s chief financial officer insists that the investment must pay for itself in cost sav-ings in three years. To meet this requirement, how much should the chief informationofficer be allowed to spend on improving the supply chain? Explain your answer.
A N O T H E R L O O K
SCM and Its Critical Success Factors
For a supply chain management project to be successful, a company must achieve cer-tain key factors. The Advisory Council at Information Week has put together a list of thosekey factors:
● Business-driven strategy: The information system for managing the supplychain must focus on the customer, allowing the customer greater efficiencies inthe process. The customer should find that ordering material from the vendoris now more efficient with the new system. The system is based on a complexbusiness process model. When a vendor fulfills a customer’s order, many differ-ent business processes are at work to ensure quality products, timely deliver-ies, and good prices.
● Management commitment: As with any IT project, top management must becommitted to support the project; otherwise, the project is doomed to fail.
● Supplier and partner expectation management: An SCM implementationrequires change from all parties. A company implementing an SCM project mustbe prepared to work closely with both vendors and customers and manage thatchange from all angles.
● Internal expectation management: Change management is especially impor-tant within a company. Personnel involved in a new system must be informedand trained to manage any anxiety they might experience in their job changes.
● Learning period acceptance: Companies implementing SCM must accept thatit takes a long time to fully realize the benefits of the system.
SCM has the further benefit of driving business value. Simply put, SCM will help yourcompany’s bottom line by making it more efficient for customers to buy your product andfor you to buy your suppliers’ products. In this way, your entire company will benefitand become more efficient.
Implementing an SCM system without paying attention to the critical factors listedabove will result in poor performance. In fact, a large percentage of companies that imple-ment SCM are not satisfied. Forty-five percent of respondents to a Booz Allen Hamiltonsupply chain management survey report that their IT solutions are failing to meetexpectations. SCM consultants often find that companies have unrealistic expectations ofthe technology. However, companies dealing in the service parts business (for example,Caterpillar Logistics and Ford Motor Company) are finding that SCM allows them to
continued
Production and Supply Chain Management Information Systems
111

decrease inventory by between 10 and 30 percent, according to AMR Research Inc. Com-panies must decide how their supply chains should be designed and run, and then usetechnology to implement those goals.
Questions:
1. Assume you were recently hired in an IT role at a large manufacturing company.Your first job is to convince the manufacturing manager that the implementa-tion of an SCM system is feasible. Write a memo to that manager, highlightingadvice on how to ensure the smooth implementation of such a system.
2. Outline the potential pitfalls that your company may encounter when imple-menting SCM.
A N O T H E R L O O K
Nike’s Global Planning Initiative
Nike has spent over eight years and $500 million on its supply chain project, which wasoriginally planned to take six years and cost $400 million. In addition to increased imple-mentation costs, the project also cost Nike more than $100 million in lost sales, reducedits stock price by 20 percent, triggered a flurry of class-action lawsuits, and causedchairman, president, and CEO, Phil Knight, to publicly lament, “This is what you get for$400 million, huh?”
Nike’s original business model, developed in the 1970s, was based on centralization.In the 1970s, U.S. sneaker manufacturers were just beginning to produce shoes in the FarEast. While its competitors were suffering from unpredictable delivery and high levels ofinflation, Nike dominated the market by guaranteeing delivery and locking in aninflation-proof discount from its Asian suppliers. Nike, in return, committed to placingorders six months in advance. Both retailers and Nike gained certainty with thisarrangement.
But as Nike grew and times changed, Nike’s central control became moredecentralized. By 1998, Nike had 27 different order management systems worldwide, allpoorly linked to the Beaverton, Oregon, facility that was supposed to coordinate allplanning. To regain control over production planning, Nike selected SAP ERP to be itsinformation system in conjunction with i2’s supply, demand, and collaboration planningsoftware.
The implementation project began on a troubled path. Nike decided to deploy the i2software with its legacy systems prior to implementing SAP ERP. The i2 software requiredsignificant customization to make it compatible with Nike’s legacy systems, and the soft-ware didn’t always work. Sometimes it took as long as a minute for a single transaction
continued
Chapter 4
112
to be processed, and the tens of millions of product numbers Nike used were too muchfor the i2 software, causing the system to crash frequently. The i2 system ignored someproduction orders, duplicated others, and deleted ordering data six to eight weeks afterit was entered, making it impossible for planners to recall what they had asked each fac-tory to produce. Finally, the software instructed Nike to make a certain number of dif-ferent types of sneakers—instructions that often conflicted with the real demand from thecustomer. Soon the Asian factories were producing products that had no actual matchwith customer demand.
Another big problem with Nike’s implementation was a lack of appreciation for theimportance of the project. At $10 million, the price tag of the i2 system represented a smallpercentage of the total $400 million supply chain project, leading to a feeling that it wouldbe an easier part of the project. According to Nike CIO Gordon Steele, “This felt likesomething we could do a little easier since it wasn’t changing everything else [in thebusiness]. But it turned out it was very complicated.”
Technology was not the only source of problems with the implementation. Askedwhether more user training would have helped, Steele replied, “You can never trainenough.” Nike now makes training an important part of its business. For example, U.S.customer service representatives are locked out of the SAP ERP system until they com-plete the full training course, which consists of 140 to 180 hours of instruction from highlytrained fellow Nike employees.
Question:
1. Suppose you were responsible for implementing new supply chain planning soft-ware for Fitter Snacker. How would you plan the project to make sure that thesystem would deliver reliable plans? Whom would you put on the implemen-tation team? How would you test the system? What training would you pro-vide for employees, and when?
Production and Supply Chain Management Information Systems
113

Chapter Summary
● An ERP system can improve the efficiency of production and purchasing processes. Effi-ciency begins with Marketing sharing a sales forecast. A production plan is created basedon that forecast and shared with Purchasing so raw materials can be ordered properly.
● Companies can do production planning without an ERP system, but an ERP system thatcontains materials requirements planning allows Production to be linked to Purchasingand Accounting. This data sharing increases a company’s overall efficiency.
● Companies are building on their ERP systems and integrated systems philosophy topractice supply chain management (SCM), a strategy by which a company looks at itselfas part of a larger process that includes customers and suppliers. Using informationmore efficiently along the entire chain can result in significant cost savings. Because ofthe complexity of the global supply chain, developing a planning system that effec-tively coordinates information technology and people is a considerable challenge.
Key Terms
Bill of material (BOM)
Capacity
Cash-to-cash cycle time
Initial fill rate
Initial order lead time
Lead time
Lot sizing
Master production schedule (MPS)
Metrics
MRP record
On-time performance
Repetitive manufacturing
Rough-cut planning
Standard costs
Supply chain
Exercises
1. In which industries is Supply Chain Management important? In which industries is it not?Why, or why not?
2. Review the information in this chapter regarding Fitter Snacker’s production problems, andcreate a flowchart to document that flawed process. Use the flowcharting tools in MicrosoftExcel to produce a professional-looking diagram. Supplement your flowchart with a para-graph that explains how ERP systems will help remove flaws from the FS productionprocess.
3. Using an Internet search engine or the library, research a manufacturing company that hassuccessfully implemented SCM. Did the company have an ERP system prior to the SCMimplementation? Can the company quantify the benefits of having SCM? How does the com-pany measure success?
4. Summarize the sources and destinations of production and purchasing information withina company that has MRP and ERP. Refer to Figure 4-2 as a guide. Data could be summa-rized in a tabular format using the table feature in a word processor. Use three columns:Data, Source, and Provided to.
Chapter 4
114

5. Interview a professor at your university who teaches in the operations research area. Askthe professor about his or her industry contacts and how those contacts use ERP, MRP, andSCM. Get the name of a production manager in a manufacturing firm, and then try to makean appointment with that manager. If possible, interview that production manager and askabout the flow and channels of information to and from the Production department.
6. Compare Customer Relationship Management (CRM) and SCM. How are they similar? Howare they different? Where do they interact? In answering, consider the kinds of technolo-gies used in each.
For Further Study and Research
Bacheldor, Beth. “Supply Chain Management Still A Work In Progress.” Information Week, May19, 2003. http://www.informationweek.com/showArticle.jhtml;jsessionid=NKXLRK21WJW24QSNDLRSKH0CJUNN2JVN?articleID=10100101.
Beg, Humayun, Stephen Rood, and Bill Spernow. “Smart Advice: Top-Down Strategy.”Information Week, February 23, 2004. http://www.informationweek.com/showArticle.jhtml;jsessionid=NKXLRK21WJW24QSNDLRSKH0CJUNN2JVN?articleID=17701385.
Koch, Christopher. “Nike Rebounds: How (and Why) Nike Recovered from Its Supply ChainDisaster.” CIO, June 15, 2004. http://www.cio.com/article/32334/.
———. “The Big Payoff.” CIO, June 12, 2007. http://www.cio.com/article/118901/The_Big_Payoff.
———. “The Big Payoff.” CIO, October 1, 2000.Sullivan, Laurie, “SAP Launches Latest Supply Chain Management Suite.” Information Week,
March 9, 2006. http://www.informationweek.com/showArticle.jhtml;jsessionid=EVB2F0BHSAHFQQSNDLRSKH0CJUNN2JVN?articleID=181502558&queryText=scm+benefits.
Production and Supply Chain Management Information Systems
115

This page intentionally left blank

C H A P T E R 5ACCOUNTING IN ERPSYSTEMS
L E A R N I N G O B J E C T I V E S
After completing this chapter, you will be able to:
● Describe the differences between financial and managerial accounting.
● Identify and describe problems associated with accounting and finan-cial reporting in unintegrated information systems.
● Describe how ERP systems can help solve accounting and financialreporting problems in an unintegrated system.
● Describe how the Enron scandal and the Sarbanes-Oxley Act haveaffected accounting information systems.
● Explain accounting and management-reporting benefits that accrue fromhaving an ERP system.
I N T R O D U C T I O N
In previous chapters, you learned about functional area activities, both generally and specifically: In
Chapter 1, you read an overview of functional area activities; in Chapter 3, you learned about Marketing
and Sales activities; and in Chapter 4, you learned about Supply Chain Management. In this chapter, you
will learn about the activities in another functional area, Accounting.You will see how Accounting is tightly
integrated with all of the other functional areas, as well as how Accounting activities are necessary for
decision making.

A C C O U N T I N G A C T I V I T I E S
Accounting activities can generally be classified as either financial accounting or mana-gerial accounting. An additional area of accounting, tax accounting, is beyond the scope ofthis text. Because tax accounting is chiefly the external reporting of a business’s activi-ties to the Internal Revenue Service, data gathered for financial accounting forms the basisfor tax accounting.
Financial accounting consists of documenting all transactions of a company that havean impact on the financial state of the firm, and then using these documented transac-tions to create reports for external parties and agencies. These reports, or financial state-ments, must follow the prescribed rules and guidelines of various agencies, such as theFinancial Accounting Standards Board (FASB), the Securities and Exchange Commission(SEC), and the Internal Revenue Service (IRS).
Common financial statements include balance sheets and income statements. Thebalance sheet is a statement that shows account balances such as cash held, amounts owedto the company by customers, the cost of raw materials and finished-goods inventory, long-term assets such as buildings, amounts owed to vendors, amounts owed to banks andother creditors, and amounts that the owners have invested in the company. A balance sheetis a good overview of a company’s financial health at a point in time, a key considerationfor a company’s creditors and owners. Figure 5-1 shows a balance sheet for Fitter Snacker.
Fitter Snacker Balance SheetAt December 31, 2009 (in thousands of dollars)
Land
$26,116Total assets
$6,400
Liabilities
$10,000
Inventories
$6,231Plant and equipment
$1,142
Cash
$4,715Accounts receivable
$9,025
Assets
$5,003
Contributed capital $2,000
Retained earnings $7,716
Total stockholders’ equity $9,716
Total liabilities and stockholders’ equity $26,116
Total liabilities
Stockholders’ Equity
Accounts payable
$16,400
Notes payable
FIGURE 5-1 Fitter Snacker sample balance sheet
Chapter 5
118

The income statement, or profit and loss (P&L) statement, shows the company’s sales,cost of sales, and the profit or loss for a period of time (typically a quarter or year). Prof-itability is important to creditors and owners. It is also important information for manag-ers in charge of day-to-day operations. A manager sees profits as indicators of success andlosses as indicators of problems to be solved. You can get an idea of the contents of anincome statement by looking at Figure 5-2, which shows an income statement for FitterSnacker.
Companies prepare financial statements quarterly, and sometimes more frequently. Toprepare these statements, companies must “close their books,” which means that tempo-rary or nominal accounts (such as revenue, expense, gain, and loss) have their bal-ances transferred or closed to the retained earnings account. The closed nominal accountswill have a zero balance from which to start accumulating revenues and expenses in thenext reporting period. Closing entries are made to transfer balances and to establish a zerobalance. To do this, employees must check the accounts to see that they are accurate andup to date. If a company’s information systems routinely generate accurate and timelydata, closing the books can go smoothly. If they do not, “adjusting” entries must be made,and, in that case, closing the books can be a very time-consuming chore with inaccurateresults.
Fitter Snacker Income StatementFor the Year Ended December 31, 2009
(in thousands of dollars)
Cost of goods sold expense $25,691
Selling, general, and administrative expense $4,251
Research and development expense $962
Total revenues $36,002
Expenses
Sales revenue
Revenues
Pretax income $4,577
Income tax expense $1,144
Net income $3,433
Total expenses $31,425
Interest expense
$36,002
$521
FIGURE 5-2 Fitter Snacker sample income statement
Accounting in ERP Systems
119

One advantage of an integrated information system is that it simplifies the process ofclosing the books and preparing financial statements. There is no need to assemble datafrom different systems because all of the required data are contained in a centralizedsystem. Figure 5-3 shows how Fitter Snacker’s balance sheet and P&L statement wouldlook in the SAP ERP system. In an ERP system, the balance sheet and P&L statement aredatabase reports. They can be quickly generated at any time, and because the data to pre-pare the reports are read from the database tables, these reports are always up-to-date.Another feature of the ERP balance sheet and P&L statement is the ability to quickly dis-play data at different levels of detail, as shown in Figure 5-4. In addition, the system allowsthe user to create financial statement variants, which are financial statements in other for-mats, prepared to suit the needs of different users.
Managerial accounting deals with determining the costs and profitability of the com-pany’s activities. While the information in a company’s balance sheet and income state-ment shows whether a firm is making an overall profit, the goal of managerial accountingis to provide managers with detailed information that allows them to determine the prof-itability of a particular product, sales region, or marketing campaign. Managerial account-ing provides information that managers use to control a company’s day-to-day activitiesand to develop long-term plans for operations, marketing, personnel needs, repayment ofdebt, and other management issues. Because managerial accounting provides reports andanalyses for internal use, companies have great flexibility in how they configure their mana-gerial accounting systems.
comparison ofcurrent year toprevious year
FIGURE 5-3 Balance sheet and income statement for Fitter Snacker in SAP ERP system
Chapter 5
120

Using ERP for Accounting InformationRecall from Chapter 1 that in the past, companies have had separate functional informa-tion systems: a marketing information system, a manufacturing information system, and soon, each with its own way of gathering data and its own file system for recording data. Com-panies built these unintegrated systems primarily to handle the needs of the individualfunctional areas, and secondarily to provide data to Accounting. With unintegrated sys-tems, the functional areas shared their data with Accounting, so Accounting could “keep thebooks,” that is, maintain records of all financial transactions. Data sharing, however, usu-ally did not occur in real time, so Accounting’s data were often out of date. Further,because the shared data might not be the only information that Accounting needed to pre-pare reports for management, accountants, and functional area clerks had to do signifi-cant research. Since the 1960s, legions of accountants, analysts, and programmers havetried to make unintegrated systems work, but this approach has not worked very well,as prior chapters illustrate.
An ERP system, with its centralized database, avoids these problems. For example, sup-pose finished goods are transferred from the assembly line to the warehouse. An employeein the warehouse can easily record the transaction, using a terminal or a bar-codescanner. In SAP ERP, the Materials Management module would see the transfer event as anincrease in finished-goods inventory available for shipment; the Accounting module would
ability toexpand levelof detail
FIGURE 5-4 Balance sheet and income statement in SAP ERP, showing ability to control levelof detail
Accounting in ERP Systems
121
see the event as an increase in the monetary value of finished goods. With ERP, everyoneuses the same database to record operating data. This database is then used to generatemanagement reports, make financial statements, and create budgets.
In traditional accounting, a company’s accounts are kept in a record called the generalledger. In the SAP ERP system, input to the general ledger occurs simultaneously with thebusiness transaction in the specific module. Many SAP ERP modules cause transactiondata to be entered into the general ledger, including:
● Sales and Distribution (SD), which lets the user record sales and creates anaccounts receivable entry (a general ledger document that indicates a cus-tomer owes money for the goods received).
● Materials Management (MM), which controls purchasing and recording ofinventory changes. The creation of a purchase order creates an accounts pay-able entry in the general ledger, noting that the company has an obligation topay for goods that it will receive. Whenever material moves into or out ofinventory (purchased materials arrive from the vendor, materials are taken outof inventory to support production, or finished goods go from production toinventory), general ledger accounts are affected.
● Financial Accounting (FI), which manages the accounts receivable andaccounts payable items created in the SD and MM modules, respectively. TheFI module is also where the general ledger accounts are closed at the end of afiscal period (quarter or year) and financial statements are generated.
● Controlling (CO), which tracks the costs associated with producing products.To make a profit, it is critical for the company to have an accurate picture ofits product costs, allowing it to make correct decisions about product pric-ing and promotions, as well as capital investments.
● Human Resources (HR), which manages the recruiting, hiring, compensa-tion, termination, and severance of employees. The HR module also managesbenefits and generates the payroll.
● Asset Management (AM), which manages fixed-asset purchases (plant andmachinery) and the related depreciation.
O P E R A T I O N A L D E C I S I O N - M A K I N GP R O B L E M : C R E D I T M A N A G E M E N T
Out-of-date or inaccurate accounting data that result from an unintegrated informationsystem can cause problems when a company is making operational decisions. This prob-lem was illustrated in Chapter 3 by Fitter Snacker’s challenges in making creditdecisions. In this section, FS’s credit-granting problems will be discussed in more detail.First, we’ll look at industrial credit granting in general, and then at FS’s credit-checkproblem.
Industrial Credit ManagementCompanies routinely sell to customers on credit. Good financial management requires thatonly so much credit be extended to a customer, however. At some point, the customer mustpay off some of the debt to justify the faith the seller has shown (and so that the seller
Chapter 5
122
can turn the accounts receivables into cash). Credit management requires a good balancebetween granting sufficient credit to support sales and making sure that the company doesnot lose too much money by granting credit to customers who end up defaulting on theircredit obligations.
In practice, sellers manage this relationship by setting a limit on how much money acustomer can owe at any one time, and then monitoring that limit as orders come in andpayments are received. For example, the seller might tell a buyer that her credit limit is$10,000, which means that the most she can owe the seller is $10,000. If the buyerreaches that amount, the seller will accept no further sales orders until she pays off someof her debt. When making a sale on credit, the seller makes an entry on the books toincrease his accounts receivable and his sales. Thus, when the buyer’s accounts receiv-able balance on the seller’s books reaches $10,000, the buyer must make some payment.
Continuing the example, assume that the buyer calls the seller to order $3,000’s worthof goods, and her credit limit is $10,000. If the seller’s records show that the accountsreceivable balance for the buyer is already $8,000, then the seller should not accept the$3,000 order, because it would bring the accounts receivable balance to $11,000, whichexceeds the buyer’s credit limit. Instead of refusing the order, the seller’s sales representa-tive might suggest that the buyer reduce the size of the order, or ask her to send in a pay-ment before processing the order, thus reducing the buyer’s debt. Clearly, to make thissystem work, a sales representative needs to be able to review an up-to-date accounts receiv-able balance when an order comes in.
If Marketing and Accounting have unintegrated information systems, full cooperationbetween the two functional areas will not be easy to achieve. Marketing knows the cur-rent order’s value, but Accounting keeps the accounts receivable records. If Accountingkeeps the books up-to-date and can provide the current accounts receivable balance toMarketing when needed, then credit limits can be properly managed. Marketing can com-pare the customer’s credit limit to an accurate balance-owed amount (plus the order’svalue) to make a decision. However, in an unintegrated system, Accounting may not imme-diately record sales and/or payment receipts as they occur. In that case, accounts receiv-able balances will not be current. Furthermore, the sales clerk may be working from anout-of-date credit-balance printout. If the printout balances do not reflect recent pay-ments, a customer may be improperly denied credit. The customer would probably chal-lenge the denial, which would trigger a request for updated information in Accounting. Thedelay entailed in that research could reduce customer satisfaction, and performing theresearch would consume valuable employee time.
These problems should not arise with an integrated information system. When a saleis made, the system immediately increases accounts receivable. When the companyreceives and records a payment, accounts receivable is immediately decreased. Because theunderlying database is available to Marketing and Accounting, sales representatives canalso see customer records immediately. Thus, sales representatives do not need to make arequest to Accounting for the customer’s accounts receivable balance.
With that background, we can now consider how Fitter Snacker handles creditmanagement.
Accounting in ERP Systems
123
Fitter Snacker’s Credit Management ProceduresAs described in Chapter 3, an FS sales clerk refers to a weekly printout of a customer’scurrent balance and credit limit to see if credit should be granted. Assuming that the cus-tomer’s order would not present credit-limit problems, the sales clerk enters the sale in thesales order entry system, which is a stand-alone computer program. Sales data are trans-ferred to Accounting by disk three times a week. An accounting clerk can use the salesinput to prepare a customer invoice.
Accounting must make any adjustments for partial shipments before preparing theinvoice. The accuracy of the adjustment process depends on whether the warehouse trans-mits order changes in a timely fashion. Accounting also makes the standard revenue-recognition accounting entry: a debit to accounts receivable and a credit to sales for theamount billed.
Accounting clerks also process customer payments. Clerks receive and manuallyhandle checks. They enter data in the accounting program, increasing cash and decreas-ing accounts receivable. These data are later used to make entries to individual cus-tomer accounts, reducing the amount that customers owe to FS. If time permits, accountsare posted on the day payment is received and the bank deposit is made; otherwise, theentries are done as soon as possible the next day. Thus, there can be some delay betweenthe time FS receives a check from a customer and the actual reduction of the custom-er’s accounts receivable balance.
Now let’s look at how SAP ERP could help FS’s credit management.
Credit Management in SAP ERPSuppose FS is using SAP ERP as its ERP system. This system would allow FS to set a creditlimit for each customer. A company can configure any number of credit-check options inthe SAP ERP system. Figure 5-5 shows a dynamic credit check with Reaction C selected.Reaction C means that if the order being saved will cause the customer to exceed its creditlimit, the system will issue a warning indicating the amount by which the order exceedsthe credit limit. Because the system is issuing a warning, the order can be saved, but will beblocked from further processing until the credit problem is cleared. Frequently, compa-nies do not configure the system to provide warnings to sales order clerks because they arenot equipped to correct the problem and because the credit problem is an issue betweenthe selling firm’s Accounts Receivable department and the customer’s Accounts Payabledepartment.
Chapter 5
124
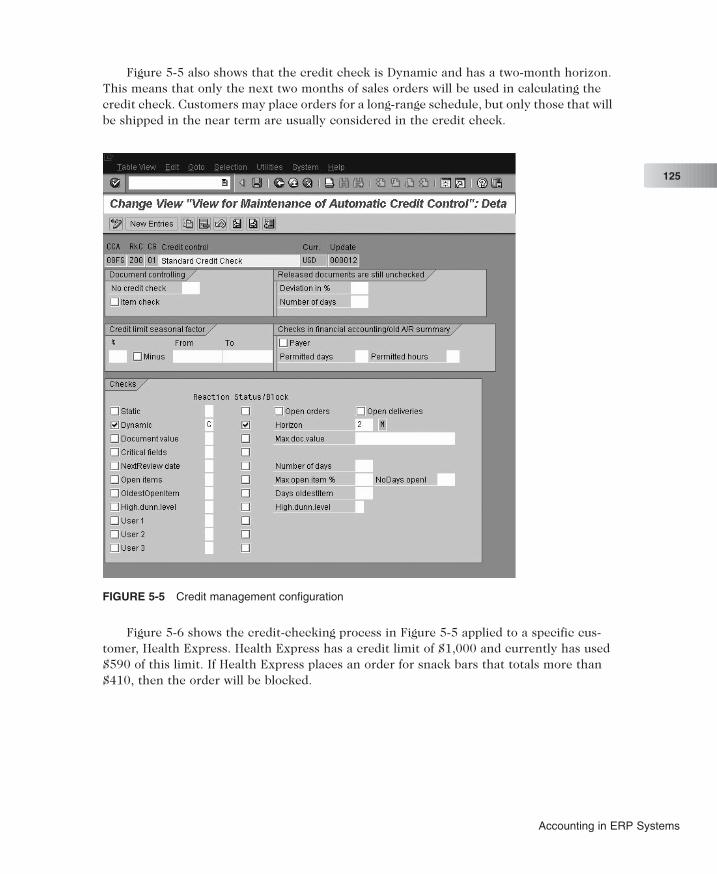
Figure 5-5 also shows that the credit check is Dynamic and has a two-month horizon.This means that only the next two months of sales orders will be used in calculating thecredit check. Customers may place orders for a long-range schedule, but only those that willbe shipped in the near term are usually considered in the credit check.
Figure 5-6 shows the credit-checking process in Figure 5-5 applied to a specific cus-tomer, Health Express. Health Express has a credit limit of $1,000 and currently has used$590 of this limit. If Health Express places an order for snack bars that totals more than$410, then the order will be blocked.
FIGURE 5-5 Credit management configuration
Accounting in ERP Systems
125

Figure 5-7 shows the transaction where blocked sales orders are listed. Most compa-nies have an employee who is responsible for reviewing blocked sales orders (perhaps everytwo hours) and taking corrective action. The advantage of using SAP ERP to manage creditis that the process is automated and the data are available in real time. The user candouble-click the sales order to see company information, such as contacts, or to see pay-ment history.
FIGURE 5-6 Credit management for Health Express
options to release,reject, or forwardthe blocked salesorder
FIGURE 5-7 Blocked sales order
Chapter 5
126

In the case of Fitter Snacker, the sales order clerk must manually check credit. If theclerk fails to do this, then a customer who is a bad risk may receive more credit. How-ever, even when the clerk does perform the manual credit check, the credit decision can fre-quently be made in error, since the data are not current. Finally, because it is a manualsystem, blocked orders may erroneously become real orders, so sales may be affected. Withthe SAP ERP system, the check is automatic, the data are up-to-date, and it is a simple mat-ter to review blocked sales orders.
Exercise 5.1
1. Create a document that describes Fitter Snacker’s current credit manage-ment procedure. Write this document so that it could be used to train a newemployee in the credit management process.
2. Revise the document to reflect the process improvements that would result ifFitter Snacker were performing credit checks using an integrated informa-tion system.
P R O D U C T P R O F I T A B I L I T Y A N A L Y S I S
Business managers use accounting data to perform profitability analyses of a company andits products. When data are inaccurate or incomplete, the analyses are flawed. There arethree main reasons for inaccurate or incomplete data: inconsistent recordkeeping, inaccu-rate inventory costing systems, and problems consolidating data from subsidiaries. In thenext section, we’ll look at each of these causes.
Inconsistent RecordkeepingEach of FS’s marketing divisions maintains its own records and keeps track of sales datadifferently. When the Direct Sales Division records a sale, the files include a code for a salesregion (Northeast, Southeast, and so on). When the Distributor Division records a sale, thefiles include a code for the state. Suppose that an FS executive asks for a report that sum-marizes monthly sales dollars for all states in the Mid-Atlantic region for the previous year.Neither division’s records are set up to answer that question. An FS accountant would needto perform this tedious series of steps:
1. Go to the source sales documents.2. Code each document by state and region (as the case may be).3. Summarize the data by state and region to produce the report. This would have
to be done by hand, entering the data into a spreadsheet for review, or by someother means.
Now, suppose FS’s management wants to evaluate the efficiency of Production’soperations. Production uses paper records, so data must be taken from the paper recordsand entered into a spreadsheet. As often happens, those paper records might be inaccu-rate or missing, making the validity of the final report questionable.
There are many variations on this theme. Conceivably, a company’s divisions do main-tain the same data about a function, but often each division’s system was created at a dif-ferent time, each using a different file system. To answer a manager’s question, at least
Accounting in ERP Systems
127

one set of data would need to be rekeyed into a spreadsheet (or some other middleware pro-gram) for the merged analysis. Again, it is possible to get an answer, but doing so takes time.
Without integrated information systems, much of the effort of accounting and report-ing to management resembles the situation in these examples: working around the limita-tions of the information systems to produce useful output.
With an ERP system, however, this sort of effort is minimized or eliminated becauseboth divisions record and store their data in the same way, in the same records. If the com-pany’s process was changed to fit the best practices of the software when the system wasinstalled, the managers of each division would have agreed on the way to store and col-lect data, as part of the system’s configuration. Later, questions can be answered in a fewminutes by any accountant (or manager or salesperson, for that matter) who understandshow to execute a query in the database language, or how to use built-in management-reporting tools.
Inaccurate Inventory Costing SystemsCorrectly calculating inventory costs is one of the most important and challengingaccounting tasks in any manufacturing company. Managers need to know how much it coststo make individual products, so they can identify which products are profitable and whichare not.
First, we will provide an overview of inventory cost accounting. Next, we will see howan ERP system can improve the accuracy of inventory cost accounting. Finally, we will dis-cuss the rationale behind activity-based costing as a method to further improve the accu-racy of inventory cost accounting.
Inventory Cost Accounting Background
A manufactured item’s cost has three elements: the cost of raw materials, the cost of laboremployed directly in the production of the item, and all other costs, which are com-monly called overhead. Overhead costs include factory utilities, general factory labor (suchas custodians or security guards), managers’ salaries, storage, insurance, and othermanufacturing-related costs.
Materials and labor are often called direct costs because the constituent amounts ofeach in a finished product can be estimated fairly accurately. On the other hand, the over-head items, called indirect costs, are difficult to associate with a specific product or a batchof specific products. In other words, the cause-and-effect relationship between an over-head cost (such as the cost of heat and light) and making a particular product (NRG-A bars)is difficult to establish.
Nevertheless, overhead costs are part of making products, so companies must havesome way to allocate these indirect costs to items made. A common method is to use totalmachine hours, on the assumption that overhead is incurred to run the machines thatmake the products. Overhead costs are added up and then divided by the expected totalmachine hours to get an amount per hour. This value is then used to allocate overheadcosts to products. If, for example, FS’s overhead per machine hour is $1,000, and 10,000bars are made in an hour, then each bar made would be allocated $0.10 of overhead ($1,000÷ 10,000). Another allocation method distributes total overhead costs by direct laborhours, on the assumption that overhead costs are incurred so that workers can do their jobs.
Chapter 5
128
Companies such as FS that produce goods for inventory typically record the cost ofmanufacturing during a period using a standard cost. Standard costs for a product are estab-lished by studying historical direct and indirect cost patterns in a company and taking intoaccount the effects of current manufacturing changes. At the end of an accountingperiod, if actual costs differ from standard costs, adjustments to the accounts must be madeto show the cost of inventory owned on the balance sheet and the cost of inventory soldon the income statement.
For example, FS might determine that each NRG-A bar should cost $0.75 to make—thatis, the cost of raw materials, labor, and overhead should equal $0.75, given the budgetednumber of units. That amount would be FS’s standard cost for a bar. During a month, FSmight make 1 million NRG-A bars. Using the standard cost, it would increase its bal-ance sheet inventory account by $750,000. Also, assume that the company sells 800,000bars in the month. In the income statement, the cost of the sales would be shown as$600,000. The inventory account would be reduced by $600,000, because the company nolonger has the units to sell.
If actual costs in the month equaled standard costs, no balance sheet or income state-ment adjustments would be needed. Actual costs never exactly equal expected costs, how-ever, so adjustments are needed. The differences between actual costs and standard costsare called cost variances. Note that cost variances arise with both direct and indirect costs.These variances are calculated by comparing actual expenses for material, labor, utili-ties, rent, and so on, with predicted standard costs.
If the company keeps records for the various elements separately, compiling varianceadjustments can be quite tedious and difficult. If products are made by assembling partsthat are made at different manufacturing sites, and the sites use different information sys-tems, the adjustments may be very imprecise.
ERP and Inventory Cost Accounting
Many companies with unintegrated accounting systems analyze their cost variancesinfrequently. Often, these companies do not know how much it actually costs to produce aunit of a product. As the following example illustrates, knowing precisely how much pro-duction costs can be very important.
Suppose FS has an opportunity to sell 300,000 NRG-A bars to a new customer. Thisis a huge order for FS. The customer wants a price of $0.90 per bar. FS’s standard cost perbar is currently $0.70, based on information that is two months old. FS knows that thecosts to manufacture snack bars have been increasing significantly in the past months. FSdoes not want to sell at a loss per unit, but it also does not want to lose a large order or apotentially good customer. Because of the difficulty of compiling all the data to calcu-late cost variances, FS only analyzes cost variances quarterly, and new data will not be avail-able for another month. Should FS accept the large order?
If FS had an ERP system, employees throughout the company would have recordedcosts in the company-wide database as they occurred. The methods for allocating costs toproducts and for computing variances would have been built into the system when it wasconfigured. Thus, the system could compute variances automatically when needed. Not onlywould this simplify the process of adjusting accounts, FS’s management would always haveaccurate, up-to-date information on cost variances. FS could decide whether it can prof-itably sell snack bars for $0.90 each. Furthermore, with a properly operating sales and
Accounting in ERP Systems
129
operations planning process, FS could determine whether it has the capacity to completethe order on time, as well! If overtime would be required to complete the order, then ana-lysts could use the planning capabilities of the ERP system to evaluate costs using over-time production.
ERP system configurations allow analysts to track costs using many bases—by job, bywork area, or by production activity. This means that unit costs can be computed using dif-ferent overhead allocation bases, allowing an analyst to play “what if” with product profit-ability decisions. In an unintegrated system, doing such multifaceted tracking would betime-consuming and difficult.
Product Costing Example
Suppose Fitter Snacker wishes to update standard costs for NRG-A bars. By analyzing thecompany’s recent indirect costs related to the products produced, FS’s cost accountantshave calculated new overhead rates. Because the material costs are much larger than directlabor costs at Fitter Snacker, the company applies production overhead as a percentage ofdirect material costs. The new rate for production overhead is 100 percent of directmaterial costs.
Figure 5-8 shows the product cost analysis for the NRG-A bar. The cost analysis is basedon seven cases of bars. The recipe for a 500-pound batch of NRG-A bars was given in Chap-ter 4, Figure 4-16. This information is repeated in the cost analysis of Figure 5-8, alongwith the cost of each of these materials. Multiplying the quantity of materials by the unitcost and summing the results gives a direct material cost of $537.65. Applying the produc-tion overhead rate of 100 percent to this direct material cost gives a production over-head cost equal to the direct material cost, or $537.65. The direct labor cost to mix thedough and bake the snack bars is $54.50. It is important to note that the labor cost isonly about 10 percent of the direct material cost, which is why the Fitter Snacker com-pany has chosen to apply production overhead costs based on direct material only.
The sum of direct materials, production overhead, and direct labor is the cost of goodsmanufactured (COGM). Fitter Snacker currently uses a rate of 30 percent of the cost ofgoods manufactured to estimate the sales and administrative costs. Adding the sales andadministrative costs to the COGM gives the cost of goods sold (COGS). Because theCOGM and COGS were estimated based on the BOM (recipe) from Chapter 4 that pro-duces seven cases of snack bars, the figures must be divided by seven to give the COGM andCOGS on a per-case basis. Figure 5-8 shows that these are $161.40 and $209.82,respectively.
The product cost analysis lets you determine whether selling 300,000 NRG-A bars toa new customer for a price of $0.90 per bar would earn a profit for Fitter Snacker. Given thatthere are 24 bars in a box and 12 boxes in a case, the current cost for an NRG-A bar is:
$ . /$
209 820
case
24 bars/box 12 boxes/case( )( ) = .. /72 bar
Fitter Snacker can sell the bars at $0.90 and make a profit of $0.18 per bar.
Chapter 5
130

Exercise 5.2Given the following product costs for the Fitter Snacker company:
Protein Powder (lb) $4.40Hazelnuts (lb) $1.64Dates (lb) $3.55
and the product information in Figure 4-16, estimate the COGM and COGS on a per-casebasis for the NRG-B bar. Use the same direct labor costs and overhead percentages usedfor the NRG-A bar product cost analysis in Figure 5-8.
Product Cost Analysis in SAP ERP
Developing product costs in a large company can be a very time-consuming task. There maybe thousands of complicated products, and the task of gathering the required informa-tion and insuring its accuracy can be a major challenge. An advantage of an integrated infor-mation system like SAP ERP is that timely, accurate information is available in theinformation system. The key information for a cost analysis is the direct material and directlabor. In SAP ERP, the direct material is determined from the bill of material (BOM), whichis managed in the Production Planning (PP) module. Direct labor is determined from the
Oats
Wheat germ
Cinnamon
Nutmeg
Cloves
Honey
Canola
Vit./min. powderCarob chips
Raisins
Total Material
Production of OH(100% of Direct Material)
Direct Labor
IngredientUnit of
measure NRG-A
lb
lb
lb
lb
lb
gal
gal
lb
lb
lb
300
50
5
2
1
10
7
5
NRG-A Bar Product Cost Analysis (7 cases)
Cost per unitof measure
DirectMaterial
Cost
Cost of Goods Manufactured
Sales and Administrative(30% of COGM)
COGS
COGM per case
COGS per case
50
2
10
5
50
50
$0.20
$0.30$3.00
$4.50
$5.50
$6.40
$1.70
$18.45$2.10
$3.20
$60.00
$15.00
$15.00
$9.00
$5.50
$64.00
$11.90
$92.25$105.00
$160.00
$537.65
$537.65
54.50
1,129.80
338.94
1,468.74
$161.40
$209.82
FIGURE 5-8 Product cost analysis for NRG-A bar
Accounting in ERP Systems
131

product routing, which describes the machines and workcenters that are used in the pro-duction of a product, and is also stored in the PP module. The routing, combined withother information maintained in the PP module, allows the SAP ERP system to determinethe quantities of direct material and direct labor used in a product. These production data,combined with material cost information stored in the FI module, provide the basis for aproduct cost analysis.
In the SAP ERP system, the method for developing a product cost is called a productcost variant. The product cost variant is basically the procedure for developing a prod-uct cost analysis. Once a product cost variant is developed, it only takes seconds for the SAPERP system to gather the required information and create a product cost estimate. Fig-ure 5-9 shows how the SAP ERP system provides a material cost estimate for the NRG-A bar.Not only does the SAP ERP product cost tool greatly reduce the time required to developcost estimates, it also increases their accuracy because it gets its data directly from mod-ules, where the data are real-time and maintained by the users.
Activity-Based Costing and ERP
A trend in inventory cost accounting is toward activity-based costing (ABC). In ABC,accountants identify activities associated with overhead cost generation, and then keeprecords on the costs and on the activities. The activities are viewed as causes (drivers)of the overhead costs. This view treats overhead costs as more direct than traditional cost-accounting methods have treated them. ABC tries to avoid rough allocation procedures inan attempt to assign costs more precisely to individual products. A company using ABCto provide more accurate cost allocations can determine which products have the highestprofit margin, information that is crucial for making strategic decisions on product lines.
FIGURE 5-9 Material cost estimate for the NRG-A bar in SAP ERP
Chapter 5
132
ABC is often used when competition is stiff, overhead costs are high, and products arediverse.
Consider this example from FS’s operations. Suppose that storage of raw materials isconsidered an activity. Assume that storage activities differ between NRG-A and NRG-B barsbecause the ingredients are different, and that some of these storage activities are morelabor-intensive than others. In an ERP system, FS would keep track of the various activi-ties (how often they occur) and the cost of each. Later, when determining the profitabil-ity of each kind of bar, FS cost accountants would add in storage costs, based on the numberof storage activities required by each type of bar. This costing is more precise than com-puting an average storage cost based on total storage costs and machine hours, and thenallocating that amount to each kind of bar. Conceivably, if the activities differ enough fromone bar to the next, one could be significantly more or less profitable than the other. Thisfact would be revealed by the ABC approach, but not by traditional cost-accountingapproaches. Letting managers see that difference is the value of an information system thatsupports ABC.
Not all overhead costs can be linked to products by their activities. However, many can,depending on the company and the manufacturing situation. For many companies, the costand effort required to implement ABC is justified by the value of the improved informa-tion yielded.
ABC requires more bookkeeping than traditional costing methods because a com-pany must do ABC in addition to traditional costing, and because ABC requires a com-pany to keep track of instances of activities, not just the costs. Companies often use ABCfor strategic purposes, and at the same time use traditional costing for generally acceptedaccounting principles such as bookkeeping and taxes. Having an integrated informationsystem allows a company to do both kinds of accounting much more easily. A recent studyof companies with and without ERP revealed that: (1) ERP companies had nearly twice asmany cost-allocation bases to use in management decision making, and (2) the ERP com-panies’ managers rated their cost-accounting system much higher. Companies with ERP sys-tems value their cost-accounting systems more than companies without ERP do, and ERPcompanies also have more faith in the numbers from their system.
Companies with SubsidiariesSome companies have special operations that make closing their books at the end of anaccounting period a challenge. Companies that have subsidiaries or branches face such achallenge. Because company managers want the big picture of overall operations and prof-itability, account balances for each entity must be compiled and forwarded to the homeoffice. A consolidated statement for the company as a whole must then be created.
You might think this would be merely an arithmetic problem: add up cash for all theentities, accounts receivables for all the entities, and so on through the accounts. The job,however, is more difficult than that. Problems can arise from two sources: accounts statedin another country’s currency must be converted to U.S. dollars (in the case of a U.S. par-ent company), and transactions between companies and their subsidiaries must be elimi-nated from the accounts.
Accounting in ERP Systems
133
Currency Translation
The following scenario illustrates the problems of currency translation. Assume one eurois worth $1.25. A company’s European subsidiary reports cash of 1 million euros at theend of the year. When the European subsidiary’s balances are consolidated with those of theU.S. parent company at the end of the year, $1,250,000 will be recorded. The same sort oftranslation would be done for all the European subsidiary’s accounts.
A complicating factor is that exchange rates fluctuate daily. An ERP system can be con-figured to access daily exchange rates and translate daily transactions automatically.
A N O T H E R L O O K
SAP in Use at Basell
Author Ellen Monk had a chance to interview Maureen Sullivan, an accounting man-ager at Basell, a privately held chemical company based in the Netherlands. Basell is theworld’s largest producer of polypropylene and the largest producer of polyethylene inEurope. Both products are used for making plastics for various industries such as auto-motive, packaging, and toys. Basell’s customers also include soft drink companies andconsumer products companies.
EM: When did your company implement SAP?MS: We’ve had SAP for about 10 years. After the initial implementation, we’ve had
some upgrades and also one downgrade. The downgrade was from version 4.6 to 4.5because of a merger, where we had to use the same version as the acquiring company.We have many modules within SAP, for example, MM, FI, CO, Fixed Assets, and PP.Company-wide we consolidate with Hyperion, not with SAP. [Consolidation is the combin-ing of financial statements of the parent company and subsidiaries.]
EM: How does your company handle exchange rates in the SAP system?MS: There is an exchange rate table in the SAP system and the data in that table is
changed daily at the company headquarters in the Netherlands. For accounting purposesat Basell North America, the month-end rate is used for the balance sheet reporting. Thereis a function in SAP FI to do that.
EM: Your company has hundreds of products. How does your company do prod-uct costing?
MS: Costing of raw materials and finished goods is done in the SAP system. Becausewe make polypropylene, there is not a cost associated with work-in-progress. The mainraw material is valued at standard cost price, whereas other raw material is valued at mov-ing average. In moving average, the inventory is valued at the cost price of the item. Thefinished goods at the producing location are valued at standard cost, but once thosegoods are moved to another location they are valued at moving average. The month-endcosting utilizes the FIFO method. All overhead is included in the product cost. [FIFOstands for first in, first out. It’s a way of costing goods such that the first goods acquired arethe first costs charged to expense.]
continued
Chapter 5
134
EM: You’ve been with Basell for 20 years. How has your job changed with the usageof SAP?
MS: We can get by with fewer people in Accounting. If the system is set up correctly, thereare no journal entries. Journal entries are simply done automatically when an action occursin an operating unit. Years ago, if you made a journal entry, you had to wait a day to see thechanges to the accounting records because they were done in batch on a daily basis.
Question:
1. There have been many changes to the field of accounting with the advent of ERPsystems and other factors, such as the influence of Sarbanes-Oxley. Researchthe field of accounting and report on these changes over the last 20 years.
Intercompany Transactions
Transactions that occur between companies and their subsidiaries, known as intercompanytransactions, must be eliminated from the books of the parent company because the trans-action does not represent any transfer of funds into or out of the company.
Suppose that Acme Inc. owns Bennett Manufacturing. Bennett sells raw materials toAcme for $1 million. Acme then uses the materials to make its product. Bennett’s sale isAcme’s cost of sales. From the point of view of an outsider, money has merely passed fromone part of the consolidated company to another. A company cannot make a profit by sell-ing to itself.
Companies often do business with their subsidiaries. If a company does so, then suchtransactions will occur frequently. Keeping track of them and making the adjustments canbe a challenge for the accountants.
A N O T H E R L O O K
Integrated Accounting at NB Power
In recent years, the Canadian government has made some changes to its energy market.As a result, NB Power, the electric utility company in New Brunswick, was divided into aholding company and four operating entities—Generation, Nuclear, Transmission, and Dis-tribution and Customer Service—which were simply cost centers within NB Power priorto 2002. The company split the responsibility for managing revenues, expenses, andfinancial statements among the four operating companies. Intercompany transactions werea huge chore because the budgeting and forecasting were done outside the SAP system.Now, each unit handles budgeting and forecasting within SAP. All intercompany data arehandled within the SAP system, which makes forecasting and other accounting choresmuch easier.
Question:
1. How does an intercompany transaction differ from an intracompany transac-tion in the field of accounting?
Accounting in ERP Systems
135

M A N A G E M E N T R E P O R T I N G W I T H E R PS Y S T E M S
The integrated nature of an ERP system and the use of a common database and built-inmanagement reporting create numerous benefits. Although reporting accounting informationis commonplace, it is often very challenging for companies to generate the right reports for theright situation. Without an ERP system, the job of tracking all the numbers that need to go intoa report is a monumental undertaking. With an ERP system, a vast amount of information isavailable for reporting purposes. Often companies take years after ERP implementation to fig-ure out which reports are the most critical for decision making. In this section, we will exam-ine some management-reporting and analysis tools available with ERP systems.
Document Flow for Customer ServiceAs you have seen, when an ERP system is used, all transactions in all areas of a company getposted in a centralized database. It is worth reemphasizing that the database is the compa-ny’s “books.” There is no separate set of books for Marketing or Production or Purchasing.
Thus, even though it is common usage to refer to “data flows” in an ERP system, it isactually a misnomer. Data do not flow from one ERP module to another because they areall in one place—the database. Each area views the same records. It might be better to speakof “data access” than of “data flows” when talking about how these areas use the com-mon database. However, typical usage by companies (data flows and data sharing) is prob-ably too ingrained to avoid.
As you learned in Chapter 3, each transaction that is posted in SAP ERP gets its ownunique document number. This number allows quick access to the data. If you need tolook up a transaction online, you do so by referencing the document number, which acts asan index to the appropriate database table entries.
In SAP ERP, document numbers for related transactions are associated in the database.This provides an electronic audit trail for analysts trying to determine the status of anorder. The best example of this concept is the linkage of document numbers for a sales order.Figure 5-10 illustrates the document flow concept.
FIGURE 5-10 Document flow of a transaction in SAP ERP
Chapter 5
136

The linked events shown in Figure 5-10 progress as follows:
1. When the order was placed, sales order document 142 was created.2. The system recorded the delivery, which is the transfer of the order’s require-
ments to the Materials Management module. It is denoted by document80000001.
3. The picking request, which is the document that tells warehouse personnelwhich items make up the order, was created on Dec. 28, 2008, and given docu-ment number 20041228.
4. The goods were removed from inventory on the same day, an event recordedby document number 4900000101.
5. After the goods were issued, an invoice was generated so that the customerwould be billed. The invoice was given document number 90000001.
6. At the same time, the accounting entries for the sale were generated. The post-ing document number is 9000481.
The document flow can be used to drill down to see the details of any one of theseevents. The term drill down refers to the ability to view the details behind a summary ofinformation. For example, the user can double-click the order number (142) and see thedetails of the order—products ordered, quantity, customer name, and so on. From that dis-play, the user can double-click the product numbers or the customer number to see detailsabout them. To see the debits and credits in the accounting entry, the user can double-click 9000482 to see the scheduled entries.
Users can access the document flow from any SAP screen. If a customer were to calland ask about the status of an order, the clerk could access the document flow and seewhether the goods had been shipped. If the customer called with an invoice number andquestions about the billing, the customer service representative could use the documentflow to access the appropriate documents in the chain of events, such as the original orderor the picking request. This sort of research can be done quickly with SAP ERP. With unin-tegrated systems, establishing the audit trail and researching source documents can bevery difficult and time-consuming.
Built-In Management-Reporting and Analysis ToolsAccounting records are maintained in the common database. The advantage of using adatabase is the ability to query the records to produce standard reports as well as answerad hoc questions. An ad hoc question is one that is spontaneous. For example, a FitterSnacker manager might run into an analyst’s office and ask for an immediate sales reportfor the third quarter, snack bar division, by product. Traditional accounting packages arenot optimized to set up and execute queries against accounting records, but database pack-ages are. Therefore, when the records are kept in a database, the user gets a double benefit.The records can be kept in an accounting package, and the records can be queriedbecause of the built-in database language.
Thus, a user who wants to identify the 10 largest orders placed by Health Express inthe past year can execute a query to show the answer. In principle, this query could directly
Accounting in ERP Systems
137
access the transaction records to get the answer. In practice, this would mean that ana-lysts running queries would be accessing the records at the same time as current transac-tions are being recorded. This competition can slow down processing in even a largedatabase, such as those used by ERP packages.
SAP’s solution to this problem is to provide a data warehouse within each majormodule. A data warehouse is a repository for data from various sources. Analysts can useit without affecting the underlying data or performance of the transactional database.Users query the warehouse rather than the transaction database. For example, SAP ERPprovides the Sales Information System (SIS) tool for analysts querying the sales records,and the Logistics Information System (LIS) tool for analysts querying the logistics (ship-ping) records. Both the SIS and the LIS come embedded with SAP ERP. Also, as men-tioned in Chapter 2, SAP also sells its Business Warehouse (BW) product, a completelyseparate information system that extracts data from the SAP ERP system. With BW, usershave great flexibility in defining data reports and analyses in a system that does not com-pete for system resources with transaction processes.
As the previous sections illustrate, an ERP system is a key component in creating man-agement reports. Managerial accounting reports help the company’s managers under-stand how the company is making money—what products are profitable, where costs mayneed to be reduced, and so on. Financial accounting reports are used to inform externalparties—shareholders and government agencies—how well the company is doingfinancially. The importance of accurate accounting reports cannot be overstated, as youwill see in the next section.
T H E E N R O N C O L L A P S E
On October 16, 2001, Enron, then one of the world’s largest electricity and natural gastraders, reported a $618 million third-quarter loss and disclosed a $1.2 billion reduction inshareholder equity, partly related to partnerships run by its chief financial officer (CFO),Andrew Fastow. Until that time, Enron had been a rapidly growing firm that was revolu-tionizing the energy business and making millionaires out of its investors. CEO Jeffrey Skill-ing, who resigned on August 14, 2001, for personal reasons, had helped transform thecompany from a natural gas pipeline company to a global marketer and trader of energy. Thecompany had encouraged its employees to invest large portions of their 401K retirementsavings accounts in Enron stock by matching employee contributions. On October 17, theday after Enron reported its tremendous third-quarter loss, the U.S. Securities andExchange Commission (SEC) sent a letter to Enron asking for information about the loss.The SEC is dedicated to protecting investors and maintaining the integrity of the securi-ties markets. Enron’s high-flying business practices immediately began unraveling.
On October 22, 2001, Enron acknowledged an SEC inquiry into a possible conflict ofinterest related to the company’s dealings with the partnerships run by CFO Fastow.Shares of Enron sank more than 20 percent on the news. Two days later, Enron ousted CFOFastow. On November 8, Arthur Andersen, Enron’s auditing firm, received a federal sub-poena for documents related to Enron, and on December 2, Enron made the largest Chap-ter 11 bankruptcy protection filing in history. Clearly, the accounting records made publicfrom Enron, which were released quarterly and were not audited, did not reflect thefinancial health of the company.
Chapter 5
138
Enron began as an oil pipeline company in Houston in 1985. With the deregulation ofelectrical power markets, Enron expanded into an energy broker, trading electricity andother commodities. Unlike a traditional exchange, which brings together buyers and sell-ers, Enron entered into separate contracts with sellers and buyers, making money on thedifference between the selling price and the buying price. Because Enron kept its books pri-vate, it was the only party that knew both prices. Enron’s business developed over time,extending to practices that allowed firms to insure themselves against a range of risk fac-tors, including changes in interest rates, weather, and a customer’s inability to pay. Thevolume of these financial contracts was far greater than the volume of contracts to actu-ally deliver commodities.
To manage the risk in these contracts, Enron was employing Ph.D.s in mathematics,physics, and economics. Risk management balances the opportunities offered by a busi-ness against the risks inherent in taking that business. As Enron’s services became morecomplex and its stock soared, Fastow created partnerships between Enron and companiesinvolved in Internet broadband technologies, computer technology, and energy, to namea few. Some of the partnerships were faked to mask billions of dollars in debt, allowing man-agers to shift debt off the books.
The partnerships that Fastow engineered were the subject of discussion well beforeEnron’s bankruptcy. In a June 1, 1999, article in CFO magazine, Ronald Fink noted that theFinancial Accounting Standards Board was looking at rule changes that would affect com-panies using creative financing techniques, like Enron. Enron owned a number of sub-sidiaries, but made sure that it owned no more than 50 percent of the voting stock. As aresult, Enron was able to keep the debt and assets of these subsidiaries off Enron’s ownbooks. If Enron had not been able to use these creative accounting practices, the com-pany would have had to report a much higher percentage of debt, which would haveincreased the costs that Enron paid to borrow money.
For years, Enron’s financial statements had been audited by Arthur Andersen, a highlyregarded accounting firm. As Enron’s auditor, Andersen issued annual reports attesting tothe validity of Enron’s financial statements; it was supposed to function as an unbiased,incorruptible observer and reporter. Enron’s October 16, 2001, press release character-ized numerous charges against income for the third quarter as “non-recurring,” even thoughAndersen believed the company did not have a basis for concluding that the charges wouldin fact be non-recurring. Indeed, Andersen advised Enron against using that term, anddocumented its objections internally in the event of litigation, but did not report its objec-tions or otherwise take steps to correct the public statement.
Perhaps the most damning part of Andersen’s indictment was the destruction ofdocuments. On October 22, 2001, Enron acknowledged the Securities and Exchange Com-mission inquiry, and on October 23, Andersen personnel were called to urgent and man-datory meetings. Andersen employees on the Enron engagement team were instructed byAndersen partners and others to immediately destroy documentation relating to Enron,and were told to work overtime if necessary to accomplish the destruction. During the nextfew weeks, an unparalleled initiative led to the shredding of paper documentation and thedeletion of hundreds of computer files.
Accounting in ERP Systems
139
Outcome of the Enron ScandalThe effects of the Enron scandal go both deep within and well beyond the company. Enronis approximately $63 billion in debt, but most of its more than 20,000 creditors will receiveabout one-fifth of the amount they are owed. Many of Enron’s shareholders were Enronemployees who invested their 401K accounts in Enron stock. Shareholders lost an esti-mated $40 billion dollars—in many cases, these individuals lost their entire life savings. Aclass-action lawsuit against financial institutions that had dealings with Enron (includingCanadian Imperial Bank of Commerce, JPMorgan, and Citigroup) has produced more than$7 billion in settlements, although legal fees will consume a significant portion of this.
Thousands of workers lost their jobs, and 31 individuals were either charged or pledguilty to criminal charges. J. Clifford Baxter resigned as Enron vice chairman on May 2,2001. He was found shot to death in his car on January 15, 2002, in an apparent suicide.Andrew Fastow, Enron’s former chief financial officer, received a six-year prison sentence.His sentence had been limited to no more than 10 years as part of a plea agreement to tes-tify against former CEO Jeffrey Skilling and CEO Ken Lay. Fastow had also involved hiswife, Lea, in his crimes. She served a year in prison and a halfway house. Jeffrey Skillingwas convicted on 19 counts of conspiracy, fraud, and insider trading in October 2006. Hewas ordered to pay nearly $45 million into a restitution fund for Enron’s victims, and wassentenced to 24 years in jail. Although he is appealing his conviction, he began serving hissentence in late 2006. Ken Lay was convicted on fraud and conspiracy charges in May2006, but two months later, prior to being sentenced, he died of a heart attack.
On June 15, 2002, jurors convicted the accounting firm Arthur Andersen for obstruct-ing justice by destroying Enron documents while on notice of a federal investigation.Andersen had claimed that the documents were destroyed as part of its housekeepingduties, and not as a ruse to keep Enron documents away from the regulators. That Octo-ber, U.S. District Judge Melinda Harmon sentenced Andersen to the maximum: a $500,000fine and five years’ probation. Those events were anticlimactic, however, as the formerauditing giant had been all but dismantled by then. Once a world-class firm with 28,000employees in the United States alone, Andersen has since been whittled down to about200 people, most of them dealing with litigation and running a training center outsideChicago.
As a result of the failure of Enron, as well as the high-profile bankruptcies of World-Com and Global Crossing, the U.S. Congress passed the Sarbanes-Oxley Act of 2002. Thisact was designed to prevent the kind of fraud and abuse that led to the Enron downfall.
Key Features of the Sarbanes-Oxley ActThe Sarbanes-Oxley Act is designed to encourage top management accountability in firmsthat are publicly traded in the United States. Frequently, top executives involved in cor-porate scandals claim that they were unaware of abuses occurring at their company. TitleIX of the Sarbanes-Oxley Act adds the requirement that financial statements filed with theSecurities and Exchange Commission must include a statement signed by the chief execu-tive officer and chief financial officer, certifying that the financial statement complies withthe SEC rules. Specifically, the statements certify that “the information contained in theperiodic report fairly presents, in all material respects, the financial condition and resultsof operations of the issuer.” Anyone “willfully certifying any statement . . . knowing that
Chapter 5
140
the periodic report accompanying the statement does not comport with all the require-ments set forth in this section shall be fined not more than $5,000,000, or imprisoned notmore than 20 years, or both.”
Title II of the act addresses auditor independence. Among other things, this section ofthe act limits the non-audit services that an auditor can provide. Among the non-audit ser-vices prohibited by the act are:
● Bookkeeping or other services related to the accounting records or financialstatements
● Financial information systems design and implementation services● Legal services● Expert services unrelated to the audit● Management functions● Human resources functions● Any other service that the Public Company Accounting Oversight Board (PCAOB)
determines to be impermissible. The PCAOB was created in Title I of the act withbroad powers to regulate audits and auditors of public companies.
Title IV of the act, Enhanced Financial Disclosures, specifies more stringent require-ments for financial reporting. Section 404 of Title IV requires that a public company’sannual report contain management’s internal control report. This control report out-lines management’s responsibility for establishing and maintaining adequate internal con-trol over financial reporting, and assesses the effectiveness of its internal control overfinancial reporting. Section 409 of Title IV addresses the timeliness of reports, and mayrequire companies to file an SEC report within two days of a significant trigger event—forexample, completion of an acquisition or default by a major customer.
I M P L I C A T I O N S O F T H E S A R B A N E S - O X L E YA C T F O R E R P S Y S T E M S
Certainly the Sarbanes-Oxley Act has significant implications for a firm’s information systems.To meet the internal control report requirement, a company must first document the con-trols that are in place and then verify that they are not subject to error or manipulation.
An integrated information system provides the tools to implement internal controls,as long as the system is configured and managed correctly. However, even the passage of theSarbanes-Oxley Act and the availability of state-of-the-art ERP technology cannot pre-vent insidious and systematic fraud similar to that of the Enron scandal. An ERP systemrelies on a central database with accurate information. ERP systems make it difficult tohide fraudulent dealings, and perhaps Enron’s problems would have been more obvious tostakeholders of the company had the company implemented an ERP system. But it isunlikely that an ERP system can prevent all fraud.
On the positive side, companies with ERP systems in place will have an easier time com-plying with the Sarbanes-Oxley Act than will companies without ERP. Companies are also dis-covering that complying with the Sarbanes-Oxley Act will allow them to measure the success oftheir ERP system, and improve its performance, by revealing how powerful their ERP sys-tems actually are. Most companies take years to find out how to use the full power of their ERPsystems, and Sarbanes-Oxley provides them with a vehicle for exploiting those benefits.
Accounting in ERP Systems
141

A N O T H E R L O O K
Sarbanes-Oxley Five Years Later
The Sarbanes-Oxley Act has been a part of doing business in the United States since 2002,and its impact is both widespread and unclear. A study by AMR Research has estimatedthe costs of compliance for U.S. business at $26 billion, while a controversial 2005 studyconducted by Assistant Professor Ivy Zhang, then a graduate student, estimated the law’scosts at a staggering $1.4 trillion. Other researchers claim the law has reduced invest-ment in R&D and overall capital spending, and has led to an increase in the takeover ofpublicly traded companies by private-equity buyers (private firms do not have to complywith Sarbanes-Oxley requirements). No one argues that the law has been good for audit-ing firms, which is ironic given that the failure of auditors at Arthur Andersen contrib-uted to the Enron collapse.
As firms have strengthened their financial controls, many have had to restate theirfinancial results—1,403 firms did so in 2006. But as firms have improved in their ability tocomply with the act, that number has been dropping.
The costs of complying with the act are also coming down. According to a 2007 sur-vey of 200 companies with average revenues of $6.8 billion, the typical cost of Section404 compliance was $2.9 million in 2006, which was 23 percent lower than in 2005.Relaxed audit standards approved by the SEC in 2007 will allow a more pragmatic,common-sense auditing approach that may lower compliance fees by up to 50 percent.
Question:
1. Use the Internet to research the latest regulations surrounding the Sarbanes-Oxley Act.
The next section explores ways in which SAP ERP and other ERP systems can pre-vent corporate fraud and abuse. Systems from vendors other than SAP have functionalitysimilar to that of SAP ERP.
ArchivingOne of the first things a new SAP ERP user notices is that the software offers very few waysto delete items. For example, the menus in the SAP ERP system related to material mas-ter data (master records that describe material characteristics) are shown in Figure 5-11.There are options for creating, changing, and displaying, but not simply deleting—the clos-est option is to flag for deletion. Before a material can be deleted from the SAP ERP sys-tem, a user must create an auditable record of its existence. Data are removed from theSAP ERP system only after they have been recorded to media (tape backup, DVD-R) for per-manent storage. This permanent storage, or archive, allows auditors to reconstruct thecompany’s financial position at any point in the past.
Suppose data could be freely deleted from the system. An unscrupulous employee couldcreate a fictitious vendor, post an invoice from the vendor, have payment made for thebogus invoice to a Swiss bank account, and then delete all records of this transaction. Itwould be very hard to detect the fraud and probably impossible to find out who commit-ted it, because the records would no longer exist.
Chapter 5
142

Not only does the SAP ERP system require archiving before data can be deleted, butit also keeps track of when data are created or changed. Figure 5-12 shows the ChangeRecord for the material master. Each time a user changes the material master, the ChangeRecord tracks the change in the data, who changed them, and when the change occurred.
FIGURE 5-11 Transaction options for material master data
FIGURE 5-12 Change Record for material master
Accounting in ERP Systems
143
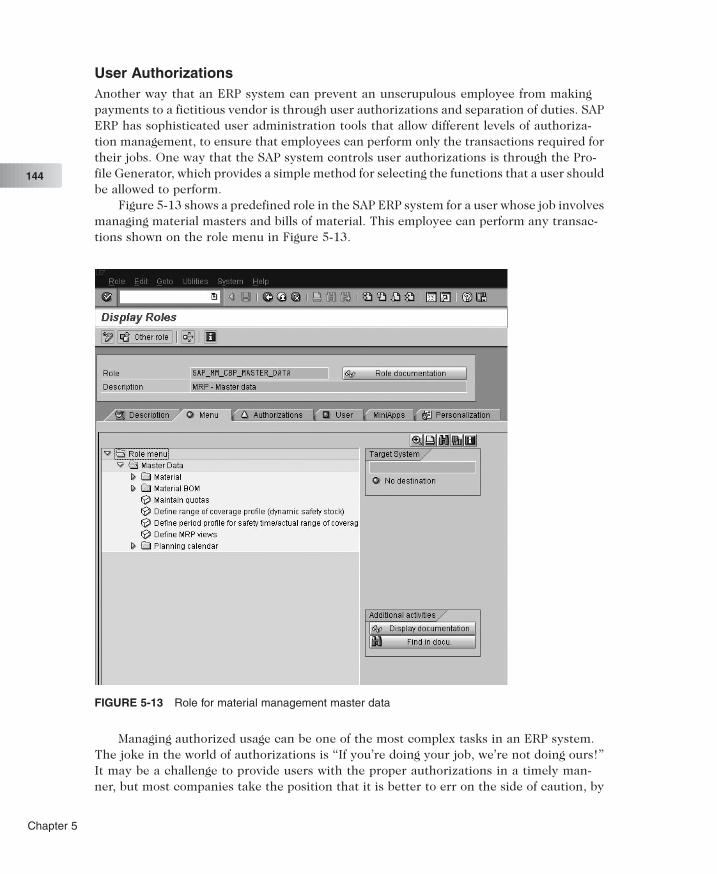
User AuthorizationsAnother way that an ERP system can prevent an unscrupulous employee from makingpayments to a fictitious vendor is through user authorizations and separation of duties. SAPERP has sophisticated user administration tools that allow different levels of authoriza-tion management, to ensure that employees can perform only the transactions required fortheir jobs. One way that the SAP system controls user authorizations is through the Pro-file Generator, which provides a simple method for selecting the functions that a user shouldbe allowed to perform.
Figure 5-13 shows a predefined role in the SAP ERP system for a user whose job involvesmanaging material masters and bills of material. This employee can perform any transac-tions shown on the role menu in Figure 5-13.
Managing authorized usage can be one of the most complex tasks in an ERP system.The joke in the world of authorizations is “If you’re doing your job, we’re not doing ours!”It may be a challenge to provide users with the proper authorizations in a timely man-ner, but most companies take the position that it is better to err on the side of caution, by
FIGURE 5-13 Role for material management master data
Chapter 5
144

taking a little longer to grant the right level of authorization, than to give users too muchauthority quickly.
Tolerance GroupsAnother ERP way to make sure employees do not exceed their authority in financialtransactions is to set limits on the size of transaction an employee can process. In the SAPERP system, this is done using tolerance groups, as shown in Figure 5-14. As you learnedin Chapter 2, tolerance groups are preset limits on an employee’s ability to posttransactions. Tolerance groups set limits on the dollar value for a single item in a docu-ment as well as the total value of the document. Just as importantly, they set a limit on pay-ment differences. Suppose a customer has been invoiced for $1,005 but accidentally sendsin a check for $1,000 to pay the invoice. The cost of requesting and processing a sec-ond payment for the $5.00 would cost both parties more than $5.00. In this case it is bet-ter to accept the $1,000 check as payment in full and account for the difference as avariance. In Figure 5-14, the Permitted payment differences section shows that the sys-tem would allow the user to process a payment that was in error by no more than 1 per-cent, or $10.00. Notice that the group field is blank in Figure 5-14. That means that thisgroup is the default tolerance group. If an employee is not assigned to any other toler-ance group, then by default the limits in the default group apply. As with authorizations,it is a safe policy to define a default tolerance group with low limits and err on the side of lessauthority rather than more authority.
no group spe-cified, so thisis the defaulttolerance
the defaultonly allowsposting ofdocuments for$1,000 or less
payments candiffer by $10or 1 percent
FIGURE 5-14 Default tolerance group
Accounting in ERP Systems
145

Financial TransparencyA key feature of any ERP system is the ability to drill down from a report to the source docu-ments (transactions) that created it. For example, if sales figures for a region look unusuallyhigh, the user can double-click the figure in the report and drill down to review the specific salesorders that constitute the overall sales figures, to verify the results. The ability to drill downfrom reports to transactions makes it easier for auditors to confirm the integrity of the reports.Figure 5-15 shows a general ledger account balance for raw material consumption. This gen-eral ledger accounts for all raw material usage at the company.
To see where the figures in this report come from, a user can double-click the line forPeriod 9, which brings up the screen in Figure 5-16. Figure 5-16 shows that two items makeup the $8,810.00 raw material consumption. A manager might be intrigued by the $10expense and want more information on what caused it. Clicking the Detail button pro-vides more detailed information on the $10 expense, as shown in Figure 5-17. Fifty poundsof material were charged to cost center R010, which is a research and development costcenter. From this screen even more details can be displayed.
FIGURE 5-15 G/L (general ledger) account balance for raw material consumption
Chapter 5
146

detail button
FIGURE 5-16 Documents that make up G/L account balance for raw material consumption
FIGURE 5-17 Details on $10.00 line item in G/L account for raw material consumption
Accounting in ERP Systems
147

With a few mouse clicks, an auditor can move from a summary statement of a gen-eral ledger account to find out all of the details related to an employee in the Research andDevelopment department taking 50 pounds of oats from inventory for productdevelopment. With a properly configured and managed ERP system, there are direct linksbetween the company’s financial statements and the individual transactions that make upthe statements, so that fraud and abuse can be detected more easily.
Exercise 5.3Assume that you are the manager of the Accounting department at Fitter Snacker. FitterSnacker still does not have an ERP system. What changes must you make in your account-ing practices to prepare for the Sarbanes-Oxley Act? Write a proposal to your manager out-lining your plan to be ready for the additional amount of reporting necessary. Rememberthat Fitter Snacker does not have an ERP system in place.
Chapter 5
148

Chapter Summary
● Companies need accounting systems to record transactions and generate financialstatements. The accounting system should let the user summarize data in meaningfulways.The data can then be used to assist managers in their day-to-day work and in long-range planning.
● With unintegrated information systems, accounting data might not be current, and thiscan cause problems for sales representatives trying to make operational decisions, suchas granting credit. Data can also be inaccurate because of weaknesses in uninte-grated systems, and this problem can affect decision making and therefore profitability.
● Closing the books at the end of an accounting period can be difficult with an uninte-grated IS, but it is relatively easy with an integrated IS. Closing the books means zero-ing out the temporary accounts.
● Using an integrated IS and a common database to record accounting data has impor-tant inventory cost-accounting benefits. More precise recordkeeping is possible, and thiscan lead to more accurate product cost calculations. These, in turn, can help manag-ers determine which products are profitable and which are not.
● The use of an integrated system and a common database to record accounting data hasimportant management-reporting benefits. The user has built-in drill-down and querytools available as a result.
● The introduction of the Sarbanes-Oxley Act, a 2002 U.S. federal regulation written andpassed in the wake of the Enron collapse, promoted management accountability byrequiring extra financial approval and reporting. Because ERP systems can help compa-nies meet the requirements of this legislation, the act has increased the demand for inte-grated data reporting.
Key Terms
Accounts receivable
Activity-based costing (ABC)
Archive
Balance sheet
Cost variance
Currency translation
Data warehouse
Direct costs
Drill down
Financial accounting
General ledger
Income statement
Indirect costs
Intercompany transaction
Managerial accounting
Product cost variant
Profit and loss (P&L) statement
Overhead
Standard costs
Accounting in ERP Systems
149

Exercises
1. Describe the differences between financial and managerial accounting. How can ERP sys-tems benefit workers in both?
2. This exercise tests your understanding of the information needed to trace a sale through amultistep ERP sales cycle: sales order, inventory sourcing, delivery, billing, and payment.Assume that an order has been placed with your company’s ERP system. Theseevents occur:
a. The system automatically checks the customer’s credit and finds it to be acceptable.The order is recorded for the delivery date requested.
b. The system schedules the production of the goods. (There is not enough inventory toship from stock.)
c. The system schedules raw material orders from the vendors to make the goodsordered.
d. The raw materials are received and stored.
e. The goods are produced and reserved for shipment to the customer.
f. The system schedules the delivery, and the goods are put on the delivery truck. Aninvoice is printed and included with the shipment.
g. Shipping notifies Accounting of the shipment’s details.
h. A month later, the customer sends in payment, which is recorded in accounting.
For each of these events, list the information that must be recorded in the common database.You do not need to know how to use a database to do this, nor do you need to under-stand bookkeeping. At each step, did the wealth of the company increase or decrease? Ateach step, how did the company’s obligations to outsiders change? At each step, how didthe obligations of outsiders to the company change?
3. Suppose it is 4:00 p.m., September 29, 2008. Fitter Snacker’s CEO sends this e-mail mes-sage to the accounting manager: “I need to meet with the Board of Directors tomorrowmorning. The Board members are concerned about the current sales of our energy bars.They would like to see sales data for today, 9/29, as a typical day. Please complete theattached report and have it on my desk by 9:00 a.m. tomorrow, September 30.” The blanktable shown in Figure 5-18 is attached to the memo.
Given the company’s sales order data-processing practices, why won’t the accountants beable to easily accomplish this task? Cite the practices that cause difficulty, and explain. IfFS had an ERP system, why would this task be easy to complete? To answer this ques-tion, review Chapters 3 and 4 to see how sales orders are processed.
Chapter 5
150
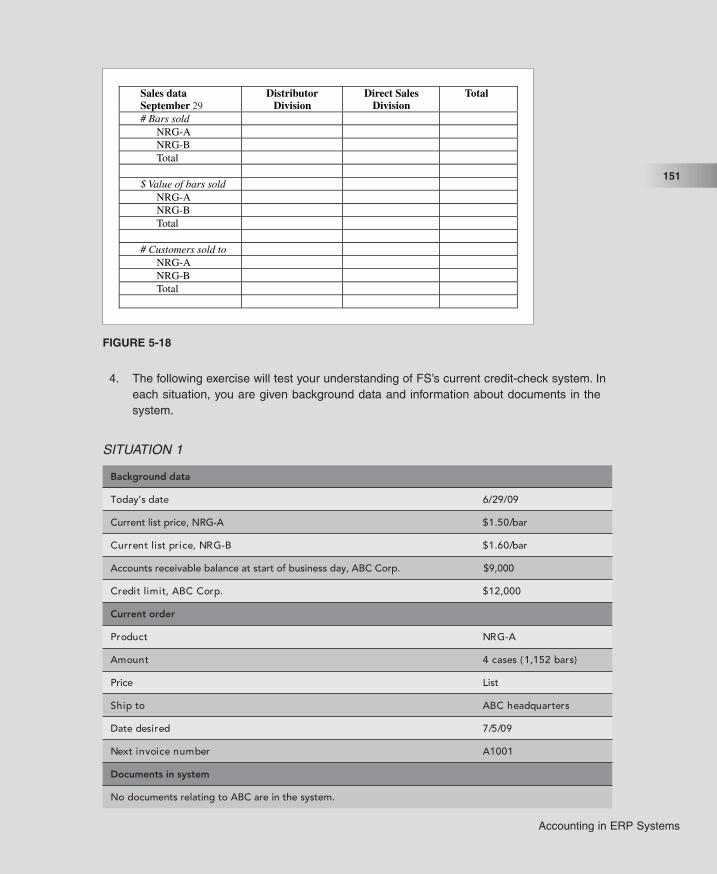
4. The following exercise will test your understanding of FS’s current credit-check system. Ineach situation, you are given background data and information about documents in thesystem.
Sales dataSeptember 30
DistributorDivision
Direct SalesDivision
Total
# Bars soldNRG-ANRG-BTotal
$ Value of bars soldNRG-ANRG-BTotal
# Customers sold toNRG-ANRG-BTotal
29
FIGURE 5-18
SITUATION 1
Background data
Today’s date 6/29/09
rab/05.1$Current list price, NRG-A
rab/06.1$B-GRN,ecirptsiltnerruC
Accounts receivable balance at start of business day, ABC Corp. $9,000
000,21$.proCCBA,timiltiderC
Current order
A-GRNtcudorP
)srab251,1(sesac4tnuomA
Price List
sretrauqdaehCBAotpihS
90/5/7derisedetaD
1001ArebmuneciovnitxeN
Documents in system
No documents relating to ABC are in the system.
Accounting in ERP Systems
151
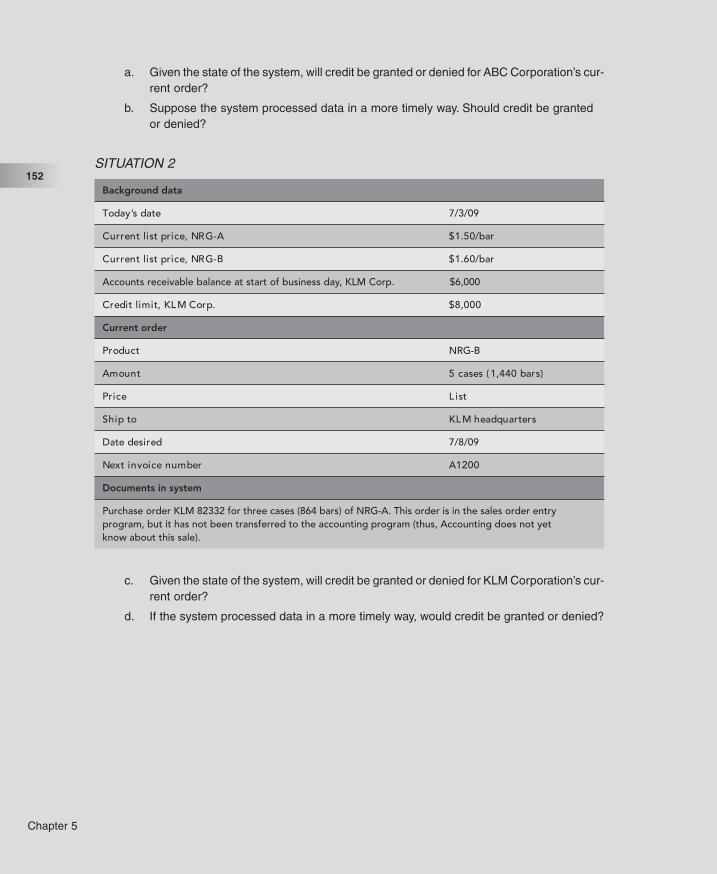
a. Given the state of the system, will credit be granted or denied for ABC Corporation’s cur-rent order?
b. Suppose the system processed data in a more timely way. Should credit be grantedor denied?
c. Given the state of the system, will credit be granted or denied for KLM Corporation’s cur-rent order?
d. If the system processed data in a more timely way, would credit be granted or denied?
SITUATION 2
Background data
7/3/09etads’yadoT
0/bar5.1$A-GRN,ecirptsiltnerruC
0/bar6.1$B-GRN,ecirptsiltnerruC
Accounts receivable balance at start of business day, KLM Corp. $6,000
000,8$.proCMLK,timiltiderC
Current order
NRG-BtcudorP
)srab044,1(sesac5tnuomA
tsiLecirP
sretrauqdaehMLKotpihS
7/8/09derisedetaD
0021ArebmuneciovnitxeN
Documents in system
Purchase order KLM 82332 for three cases (864 bars) of NRG-A. This order is in the sales order entryprogram, but it has not been transferred to the accounting program (thus, Accounting does not yetknow about this sale).
Chapter 5
152
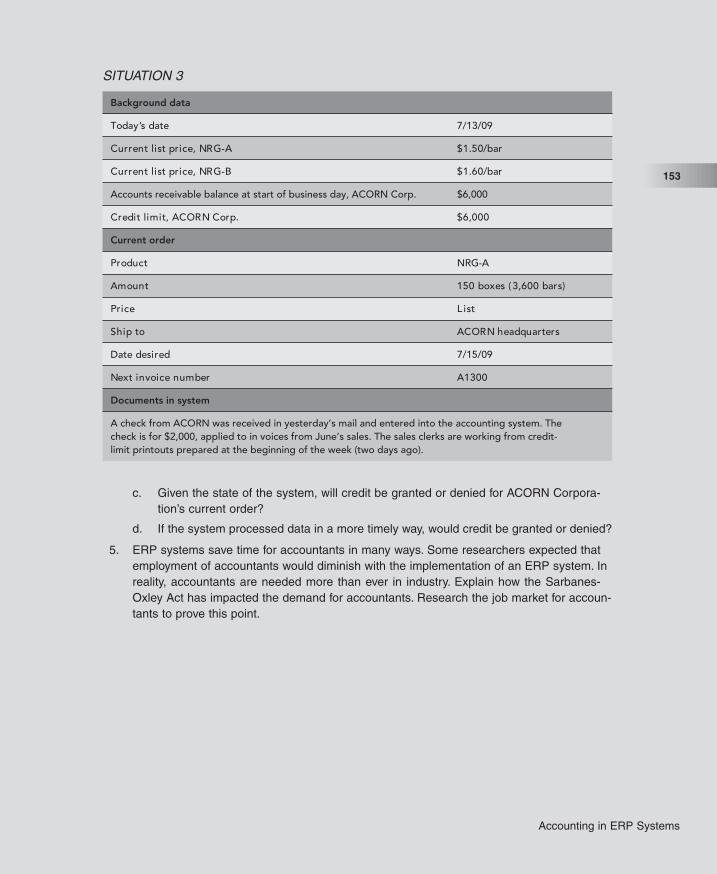
c. Given the state of the system, will credit be granted or denied for ACORN Corpora-tion’s current order?
d. If the system processed data in a more timely way, would credit be granted or denied?
5. ERP systems save time for accountants in many ways. Some researchers expected thatemployment of accountants would diminish with the implementation of an ERP system. Inreality, accountants are needed more than ever in industry. Explain how the Sarbanes-Oxley Act has impacted the demand for accountants. Research the job market for accoun-tants to prove this point.
SITUATION 3
Background data
7/13/09etads’yadoT
0/bar5.1$A-GRN,ecirptsiltnerruC
0/bar6.1$B-GRN,ecirptsiltnerruC
Accounts receivable balance at start of business day, ACORN Corp. $6,000
000,6$.proCNROCA,timiltiderC
Current order
NRG-AtcudorP
)srab006,3(sexob051tnuomA
tsiLecirP
sretrauqdaehNROCAotpihS
7/15/09derisedetaD
0031ArebmuneciovnitxeN
Documents in system
A check from ACORN was received in yesterday’s mail and entered into the accounting system. Thecheck is for $2,000, applied to in voices from June’s sales. The sales clerks are working from credit-limit printouts prepared at the beginning of the week (two days ago).
Accounting in ERP Systems
153

6. Companies usually prepare division- and company-wide budgets each year. These bud-gets show important monthly results that the company plans to achieve: sales, cost of sales,inventory levels, cash on hand, and other key data. Such budgets are effective for plan-ning and controlling operations if they are designed as “flexible” budgets. A flexible budgetis restated as conditions change from month to month, so goals remain reasonable anduseful for evaluating performance. If information systems are unintegrated, getting data fromthe company’s departments, in order to create the budget, is a chore. Keeping the data cur-rent is very difficult and often is not done. If not kept up to date, budgets are not usefulfor planning and controlling operations. Thus, the flexible budget concept is a good idea, butit is difficult to achieve. Because ERP makes flexible budgeting more achievable, ERP helpsmanagement discharge its planning and controlling roles better. Why do you think flex-ible budgeting would be more achievable with an ERP system? List your reasons, andexplain.
7. Review FS’s unintegrated production and purchasing procedures, described in Chapter 4.How would its current job-scheduling, production, and purchasing procedures result in vari-ances from standard costs? Why would FS have trouble researching these costs at month’send to adjust the “standard costs per unit” to accurate “actual costs per unit”?
For Further Study and Research
Barnhart, Todd M. “The Financial Supply Chain.” Darwin Magazine, April 2004.Bloomberg News. “Lawyer who negotiated Enron settlements retiring.” Bloomberg News, August
28, 2007.Economist.com. “Sarbanes-Oxley: Five years under the thumb.” The Economist, July 26, 2007.
http://www.economist.com/business/displaystory.cfm?story_id=9545905&CFID=19771870&CFTOKEN=7941782.
Fink, Ronald. “Balancing Act: Will a new accounting rule aimed at off-balance-sheet financing tripup Enron?” CFO, July 1, 1999.
Flood, Mary. “Andersen conviction affirmed: Appeals court upholds verdict in Enron case.” Hous-ton Chronicle, July 1, 2004.
Goff, John. “They Might Be Giants: It’s been nearly two years since Arthur Andersen went underand Sarbanes-Oxley was passed. Have the Big Four audit firms changed since then?” CFO,January 12, 2004.
Hays, Kristin. “Ex-Enron CFO Fastow sentenced to 6 years in prison.” Houston Chronicle, Sep-tember 26, 2006.
Johnson, Carrie. “Enron’s Lay Dies of Heart Attack: Convicted Founder Faced Life in Prison.”Washington Post, July 6, 2006.
KPMG LLP. “Sarbanes-Oxley Section 404: Management Assessment of Internal Control and theProposed Auditing Standards.” White Paper, March 2003. http://www.kpmg.ca/en/services/audit/documents/SO404.pdf.
KPMG LLP. “Sarbanes-Oxley: A Closer Look.” White Paper, January 2003.Krumweide, Kip R., and Win G. Jordan. “Reaping the Promise of Enterprise Resource Systems.”
Strategic Finance, October 2000, 49–52.Lubin, Joann S., and Kara Scannell, “Critics See Some Good from Sarbanes-Oxley.” The Wall
Street Journal, July 30, 2007.
Chapter 5
154

McClenahen, John S. “The Book On The One-Day Close.” IndustryWeek.com, April 1, 2002.http://www.industryweek.com/ReadArticle.aspx?ArticleID=1058.
Preacher, Debbie. “Sarbanes-Oxley: A Business Blessing in Disguise.” ebizq.net, July 17, 2005.http://www.ebizq.net/topics/com_sec/features/6116.html.
SAP.com. “SAP Customer Success Story: NB Power: Deferred Restructuring Elicits ImpressiveFlexibility from SAP Consulting.” 2004. http://www.sap.com/platform/netweaver/pdf/CS_NB_Power.pdf.
Sarbanes-Oxley Act, H.R. 3763, Title III, Section 302, §1350 (a)(3).Sarbanes-Oxley Act, H.R. 3763, Title IX, Section 906, §1350 (c).U.S. Securities and Exchange Commission. “The Investor’s Advocate: How the SEC Protects
Investors, Maintains Market Integrity, and Facilitates Capital Formation.” http://www.sec.gov/about/whatwedo.shtml.
WashingtonPost.com. “Timeline of Enron’s Collapse.” Washington Post, July 9, 2004. http://www.washingtonpost.com/ac2/wp-dyn?pagename=article&node=&contentId=A25624-2002Jan10.
Accounting in ERP Systems
155

This page intentionally left blank

C H A P T E R 6HUMAN RESOURCESPROCESSES WITH ERP
L E A R N I N G O B J E C T I V E S
After completing this chapter, you will be able to:
● Explain why the Human Resources function is critical to the success ofa company.
● Describe the key processes managed by a Human Resourcesdepartment.
● Describe how an integrated information system can support effectiveHuman Resources processes.
I N T R O D U C T I O N
A company’s employees are its most important resources. The Human Resources (HR) department is
responsible for many of the activities that a company performs to attract, hire, reward, train, and,
occasionally, terminate employees. The decisions made in the HR department can affect every depart-
ment in the company. Companies are increasingly aware of the importance of an experienced, well-trained
workforce and have begun using the term human capital management (HCM) to describe the tasks
associated with managing a company’s workforce.
As a company grows from a small business to a large organization, the need for an organized and
effective HR department becomes increasingly important. The responsibilities of an HR department
usually include:
● Attracting, selecting, and hiring new employees using information from resumes, references,
and the interview process
● Communicating information regarding new positions and hires throughout the organization
and beyond
● Ensuring that employees have the proper education, training, and certification to successfully
complete their duties
● Handling issues related to employee conduct
● Making sure employees understand the responsibilities of their jobs
● Using an effective process to review employee performance and determine salary increases
and bonuses
● Managing the salary and benefits provided to each employee and confirming that the proper
benefits are disbursed to new and current employees
● Communicating changes in salaries, benefits, or policies to employees
● Supporting management plans for changes in the organization (expansion, retirements, and
so on) so that competent employees are available to support business processes
Making sure that these tasks are accomplished and that valid information is communicated requires
an effective system to control the flow of information. In this chapter, we will explore the role of an
integrated information system in Human Resources.
Chapter 6
158

P R O B L E M S W I T H F I T T E R S N A C K E R ’ SH U M A N R E S O U R C E S P R O C E S S E S
As with Fitter Snacker’s other processes, personnel management relies on paper recordsand a manual filing system. This setup creates problems because information is not readilyaccessible or easy to analyze. The HR department’s recruiting, hiring, and post-placementprocesses would operate more efficiently with an integrated system.
Recruiting ProcessFitter Snacker has three employees in its HR department. Problems occur because of thelarge number of HR processes (from hiring and firing to managing health benefits), thelack of integration among all departments, and the number of people with whom HRinteracts. Many of the HR problems also result from inaccurate, out-of-date, and incon-sistent information.
For example, suppose a department has an opening for a new employee. The depart-ment supervisor communicates this need to the Human Resources department by filling outa paper job vacancy form that describes the position, lists the qualifications a candidatemust have to fill the position, specifies the type of position (temporary, part-time, full-time, or co-op/intern), and states when the position will become available. HumanResources takes this information, verifies that the position needs to be filled, and gets finalapproval from the president of Fitter Snacker to begin the recruiting process. Becausethere is no central information system, the details on the job vacancy form are frequentlyinconsistent among, and sometimes within, departments.
Usually the job is first posted internally, so that current employees have the opportu-nity to apply for the position. If no current employees are acceptable for the position, thenFitter Snacker posts the position externally.
A number of problems can arise in the recruiting process. First, the description of the quali-fications required for the job may be incomplete or inaccurate, sometimes because the super-visor is in a hurry, sometimes because the supervisor is not aware of all of the functionsrequired for the position, and sometimes because the supervisor assumes that all candidateswill have certain basic skills. Second, if the job vacancy form is lost or not routed properly, theHuman Resources department will not know that the position is available, while the supervi-sor will assume that the paperwork is in process. When this happens, the department endsup shorthanded, creating tension or animosity between the departments. Obviously, this prob-lem will occur more frequently when job openings are circulated by paper. With an inte-grated information system, the job information is available immediately and easier to monitor.Another serious recruiting problem related to a paper-based hiring process is the potential lossof a good candidate due to drawn-out hiring practices or lost data.
Although Fitter Snacker does not use recruiting agencies or Internet job sites such asMonster.com to find candidates, it does use several other methods to find people for itsjobs. FS publishes its job vacancies on the company’s Web site, in local newspapers, and, inthe case of a professional position, in national publications. In addition, a representativefrom the HR department attends career fairs and recruits on college campuses for prospec-tive candidates. Occasionally, referrals are made by other Fitter Snacker employees, andsometimes individuals searching for open positions at Fitter Snacker send unsolicitedresumes.
Human Resources Processes with ERP
159

Filing and keeping track of resumes and applications is a continuing challenge. FitterSnacker has dozens of jobs with different titles and descriptions, and the companyreceives dozens of resumes and applications each day. The HR department must classify andfile all applications and resumes according to the appropriate description. For example, ifthe resume of a mechanical engineer is accidentally filed with resumes of candidatesapplying for jobs in the accounting department, the mistake may not be discovered in timeto include the engineer in the search process. In this case, Fitter Snacker may not hire thebest person for the engineering position, and the mistake might damage Fitter Snack-er’s reputation.
Keeping the applicant’s data on a paper form means that retrieving the applicant dataand using it to evaluate candidates is also a challenging task. To generate a list of poten-tial candidates, Human Resources evaluates the resumes and applications it receives inresponse to a job posting, and also reviews filed applications that are less than one yearold. These resumes and applications must be photocopied and then circulated through thedepartment making the job request. Frequently, more than one person in the requestingdepartment reviews the applications, and because the applicant data are on paper, manag-ers review the applicant files sequentially, slowing the review process.
The Interviewing and Hiring ProcessAt Fitter Snacker, the requesting department develops a short list of candidates for theposition by selecting up to three applicants, based on the data provided by HR. HumanResources contacts the candidates on the short list, schedules interviews, and creates afile for each candidate. A candidate’s file includes a form that shows when the applicationwas received, the position(s) applied for by the candidate, and the date and time of anyinterviews. If this is the second time the candidate has applied for a job with the com-pany, the form indicates the current status of the candidate: whether the candidate wasinterviewed and rejected, whether the candidate rejected a job offer, and so on.
If a candidate accepts the interview offer, the HR department makes the arrange-ments for the job candidate, including travel arrangements and a schedule of interviewactivities. A representative from the HR department conducts an interview that includesa discussion of the applicant’s experience and questions relevant to the position for whichthe candidate has applied. The supervisor of the department in which the position existsalso interviews the candidate, and other employees in the department are usually given timeto talk to the candidate as well. For most professional positions at Fitter Snacker, the can-didate is interviewed by the plant manager and, frequently, the company president.
After the initial interview process, HR updates the candidate’s file to indicate whetherhe or she is still a possibility for hire. In some cases, a second interview is scheduled. OnceHR has interviewed all the candidates on the short list, a representative of HR and the super-visor of the requesting department decide which candidates on the short list are accept-able, and rank them. If there is an acceptable candidate, the HR person makes the highest-ranking candidate a verbal job offer over the phone. If the candidate accepts the verbaloffer, a written offer letter is sent, which the candidate must sign and return. Once the can-didate formally accepts the written offer, his or her file is again updated, showing that thecandidate has accepted the offer and will begin employment with the company on aspecified date.
Chapter 6
160

If there are no acceptable candidates from the short list, or if none of them accepts thejob offer, then the process must be repeated, which at a minimum will require the devel-opment of a new short list but may involve starting over with a new job posting.
Many of Fitter Snacker’s problems in the interviewing and hiring process have to dowith information flow and communication. Fitter Snacker does not have group appoint-ment calendar software, which would allow HR staff to easily find a time when all key per-sonnel would be available to interview a candidate. A group appointment calendar (availablein software packages such as SAP) allows users to check others’ calendars in order toschedule meetings. Scheduling interviews is frequently a cumbersome process, requiringthe Human Resources employee to coordinate the interview schedule between the can-didate and the appropriate personnel at Fitter Snacker. Because this is done by e-mail andphone, it can take days and sometimes weeks to schedule an interview. A similar prob-lem occurs after the interviews have been completed. Gathering feedback from all involvedparties and ranking the candidates takes time and may require multiple meetings. Manag-ing the travel arrangements and reimbursing candidates for their travel expenses are alsocumbersome tasks. More than once, Fitter Snacker has lost a promising candidate toanother company because of delays in the FS interviewing and hiring process.
After the candidate accepts the formal job offer, Fitter Snacker hires an HR consult-ing firm to perform a background check to verify that the candidate has not falsified anyinformation and does not have a serious criminal record. Fitter Snacker outsources thebackground check because of the special skills required. If the background check is satis-factory, this information is also stored in the candidate’s file, and the job offer stands. If theconsultant finds evidence of falsified information or legal troubles, the file is likewiseupdated, and the job offer is rescinded with a written explanation.
After passing the background check, the new employee completes additional paper-work covering employment terms and conditions, tax withholding, and benefits. All FitterSnacker employees must sign a form that states that the employee has been given a copyof—and agrees to abide by—the company’s policies and procedures. The new employeemust complete an IRS W-4 form, which tells the employer the correct amount of tax towithhold from the employee’s paycheck. Next, the employee must attend an orientation ses-sion, during which HR personnel describe Fitter Snacker’s benefits plan. Fitter Snackeroffers a comprehensive benefits plan that gives employees a range of choices for health-care plans, life insurance, retirement plans, and medical savings accounts. The employ-ee’s dependents may also be covered under Fitter Snacker’s health insurance plan. If theemployee elects dependent coverage, then HR must obtain basic information about eachdependent to include in the employee’s file.
Because employees must provide a significant amount of detailed data to properly man-age compensation and benefits, it is not surprising that Fitter Snacker frequently has prob-lems enrolling new employees in the correct benefits plans and establishing the properpayroll deductions. It can often take months to manage the new employee’s compensa-tion and benefits correctly. The enrollment issues can generate many time-consumingphone calls to HR management—calls that would not be needed with an integratedsystem.
Human Resources Processes with ERP
161
A N O T H E R L O O K
Challenges in Hiring Talent
Talented workers are hard to come by. The average quality of a worker has declined by10 percent since 2004, and the time it takes to hire a talented worker has gone from 37 daysto 51 days, so HR departments must be vigilant in their recruiting efforts. Using an inte-grated system, such as an ERP system, helps HR departments identify and retain thatrare talent. Seventy-five percent of managers surveyed by the Corporate Executive Boardsaid that attracting and retaining talented workers was their top goal.
The consulting firm McKinsey & Company groups jobs into three categories: transfor-mational, transactional, and tacit. The first two job types—converting raw materials intoproducts and performing easily automated business events—are shrinking compared tothe tacit category, which requires a worker to have a high level of judgment. From 2000 to2006, the number of jobs requiring a high level of judgment increased 2.5 times more thanthe transactional jobs, and three times compared with all jobs. Roughly 40 percent ofU.S. employers now require workers with a high level of judgment. Furthermore, with babyboomers reaching retirement age, the consulting firm RHR International estimates thatby 2012 the nation’s 500 largest companies will lose half of their top managers.
Companies are trying to find ways to lure workers away from their current jobs. Withdownsizing a concern for many workers, employees are often eager to be lured away. Tofind candidates, companies will comb through lists of attendees at conferences, look forscientists who created new patents, or even buy information on the competition. Compa-nies are also using corporate Web sites for recruiting. Surveys have shown that 95 per-cent of large companies in North America use their corporate Web sites for hiring. The sitesoften are connected to HCM software at the home office that screens resumes.
The hiring of good employees is so vital to a company’s success that HR managers arenow commanding larger salaries. HR executives for Black & Decker, Home Depot, Via-com, and Timberland are among those companies’ five highest-paid employees.
Questions:
1. Why is the hiring process more crucial than ever for companies?
2. List some incentives, other than salary, that a company could use to encour-age a prospective employee to accept a job offer.
Human Resources Duties After HiringThe Human Resources department has responsibilities that continue beyond the hiring andjob start of an employee. The HR department should maintain a good and continual lineof communication with the employee and the supervisor to make sure the employee is per-forming well.
Fitter Snacker, like most companies, issues performance evaluations to new and cur-rent employees. The supervisor performs an initial evaluation and reviews it with theemployee. After the review, the supervisor may modify the evaluation, which both thesupervisor and the employee sign. The employee may submit a written response to thereview, listing any disagreements or explanations. Other senior employees, such as the plant
Chapter 6
162
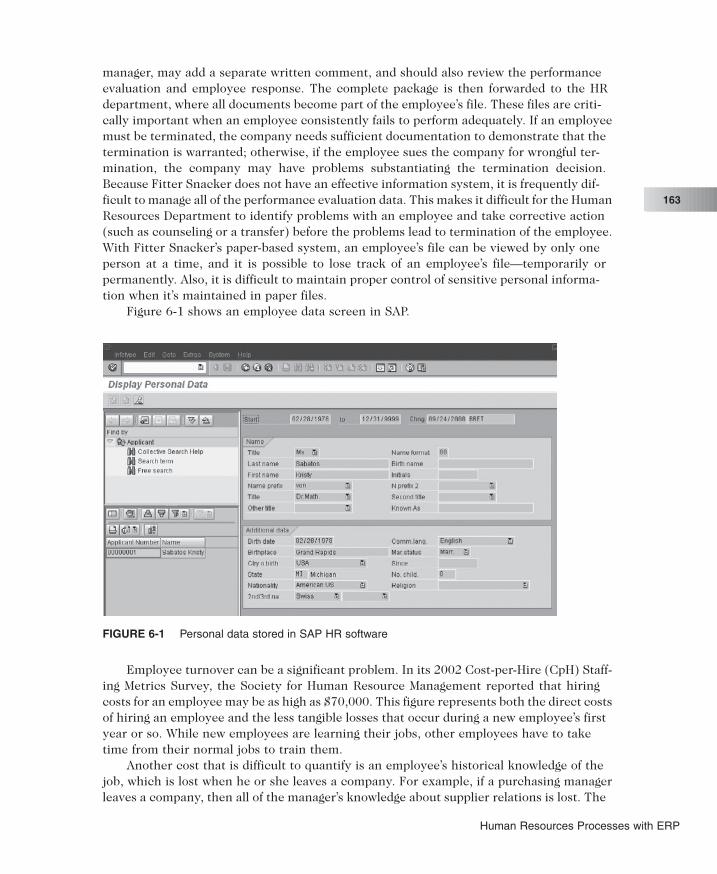
manager, may add a separate written comment, and should also review the performanceevaluation and employee response. The complete package is then forwarded to the HRdepartment, where all documents become part of the employee’s file. These files are criti-cally important when an employee consistently fails to perform adequately. If an employeemust be terminated, the company needs sufficient documentation to demonstrate that thetermination is warranted; otherwise, if the employee sues the company for wrongful ter-mination, the company may have problems substantiating the termination decision.Because Fitter Snacker does not have an effective information system, it is frequently dif-ficult to manage all of the performance evaluation data. This makes it difficult for the HumanResources Department to identify problems with an employee and take corrective action(such as counseling or a transfer) before the problems lead to termination of the employee.With Fitter Snacker’s paper-based system, an employee’s file can be viewed by only oneperson at a time, and it is possible to lose track of an employee’s file—temporarily orpermanently. Also, it is difficult to maintain proper control of sensitive personal informa-tion when it’s maintained in paper files.
Figure 6-1 shows an employee data screen in SAP.
Employee turnover can be a significant problem. In its 2002 Cost-per-Hire (CpH) Staff-ing Metrics Survey, the Society for Human Resource Management reported that hiringcosts for an employee may be as high as $70,000. This figure represents both the direct costsof hiring an employee and the less tangible losses that occur during a new employee’s firstyear or so. While new employees are learning their jobs, other employees have to taketime from their normal jobs to train them.
Another cost that is difficult to quantify is an employee’s historical knowledge of thejob, which is lost when he or she leaves a company. For example, if a purchasing managerleaves a company, then all of the manager’s knowledge about supplier relations is lost. The
FIGURE 6-1 Personal data stored in SAP HR software
Human Resources Processes with ERP
163
company does have a record of the contract signed with the supplier, but details of the nego-tiations that led to the contract may not be documented. Such details can be crucial in suc-cessfully negotiating the next contract. The manager may have developed good relationswith the supplier and know whom to contact when there are problems. These relation-ships are not specified as part of the purchasing manager position, but accrue over timewith the individual holding the position. When companies experience high rates of turn-over, they lose knowledge and skills that may be crucial to keeping them competitive.
Employee turnover is strongly related to job satisfaction and compensation. If employ-ees have satisfying jobs and are well compensated, they are less likely to leave thecompany. Human Resources can help maintain a satisfying work environment through anumber of means, such as holding training programs for supervisors and managers, con-ducting periodic employee satisfaction surveys, and gathering data from employee exitsurveys. Human Resources also has a critical role to play in compensation, which shouldbe related to the skills and tasks required by the job and the performance of the employee.An important function of the HR department is to make sure compensation levels are com-petitive and are applied fairly to all employees. Failure to do so can result in high ratesof turnover as well as discrimination lawsuits.
A N O T H E R L O O K
Discrimination Lawsuits
In February 2007, a federal appeals court approved class-action status for a discrimina-tion lawsuit brought by seven women against Wal-Mart, claiming they were discrimi-nated against in pay and promotion. It has been estimated that 1.6 million women whohave worked for the large retailer since 1998 could join the lawsuit, which would makethem the largest group ever to sue a company for discrimination. These women areclaiming that they were denied promotion because of their gender, and that some were sub-jected to sexual harassment. In this class-action case, the group of seven women is bring-ing the suit against Wal-Mart on behalf of the larger group.
Wal-Mart is known for its close attention to data capture and storage. In this instance,these detailed data are being used against the company. Statistically, the case claims, Wal-Mart has been paying men more than women and has been promoting more men thanwomen. Wal-Mart says its statistics do not support this claim. With its federal appeals courtapproval, this lawsuit has gone further than most. The U.S. Equal Employment Opportu-nity Commission reported that it had resolved 27,146 sex discrimination claims in2003. Fifty-seven percent of the claims were dropped because they were found to have noreasonable cause, and only 10.6 percent resulted in settlements. Out of the original 27,146 claims, only 393 lawsuits were actually filed. At the time of the writing of this book, theWal-Mart case had yet to be settled.
continued
Chapter 6
164
The Boeing Corporation has also had a problem with pay discrimination. In 1996, theLabor Department’s Office of Federal Contract Compliance Programs (OFCCP) ran a routineinvestigation of Boeing’s Philadelphia plant. Because of Boeing’s work on federal govern-ment contracts, the OFCCP had the right to audit Boeing’s level of compliance with antidis-crimination laws. It did this by comparing the median pay and median job experience ofmale and female employees. Using this median analysis, the OFCCP report stated that Boe-ing demonstrated “a prima facie case of systemic discrimination concerning compensation offemales and minorities.” Boeing’s response was to conduct its own analysis. Boeing initi-ated the Diversity Salary Analysis (DSA) project to develop a legally defensible statistical analy-sis of Boeing’s pay practices, to counter the OFCCP’s median analysis. Unfortunately forBoeing, the DSA project concluded in 1997 that “gender differences in starting salaries gener-ally continue and often increase as a result of salary planning decisions.’’ Boeing’s own analy-sis showed that there was a pay gap for entry-level managers of $3,741.04.
In 2000, thirty-eight women filed a class-action lawsuit against Boeing, charging paydiscrimination. Boeing’s own salary studies supported the charges in the lawsuit, but Boe-ing claimed that the studies had been prepared at the direction of Boeing’s lawyers and thuswere protected by attorney-client privilege. While lawyers routinely prepare statisticalstudies to help defend a client against a lawsuit, the data contained in salary studies forbusiness-related purposes (data that predate litigation and that are prepared by nonle-gal executives) do not fall under the confidentiality protection of attorney-client privilege.On October 25, 2000, Judge George Pinkie ordered Boeing to release the salary studies,explaining that, “Legal departments are not citadels in which public business . . . may beplaced to defeat discovery.”
On May 17, 2004—two days before the discrimination case was scheduled to go totrial—Boeing made a settlement offer. After negotiation, in June 2004, Boeing agreed to pay$72.5 million to settle the case.
Questions:
1. Boeing settled its discrimination lawsuit for $72.5 million. What other costs wereincurred by Boeing in association with this lawsuit? How do these costs com-pare to the financial cost of the settlement?
2. How could an integrated Human Resources information system be used to detectpotential pay discrimination before it becomes systematic?
3. How would you design a compensation system so that pay discrimination is notlikely to occur?
H U M A N R E S O U R C E S W I T H E R P S O F T W A R E
Now that you are familiar with the numerous business processes required to manage acompany’s human capital, you can begin thinking about how ERP software can improvethose processes, leading to overall improvements in a company’s performance. With anintegrated system, a company can store employee information electronically, eliminatingthe piles of papers and files that make the retrieval of information difficult or tedious. Agood information system allows all relevant information for an employee to be retrieved ina matter of seconds. An integrated information system is a key component in this process.
Human Resources Processes with ERP
165

A N O T H E R L O O K
Major League Baseball Pioneers Sophisticated Data Analysis
Enterprise Resource Planning systems hold a wealth of data on a company—data that canbe manipulated and analyzed using statistics. A wealth of data also exists on the sport ofbaseball, and those data are manipulated by statistics, too. Human resource managerscan take a lesson from baseball when assessing employees’ performance and hiring newemployees. The Society for American Baseball Research uses statistical techniques calledsabermetrics, which can analyze players on performance attributes other than the tradi-tional batting averages. Measures are collected on the probability that a player will geta hit with other players on base—for example, by determining the number of times theplayer has done this in the past, and what type of hit he produced. Teams such as the 2007World Champion Boston Red Sox are also using such measures to analyze their currentroster and identify weaknesses, so they know which new players to recruit.
The sabermetrics method uses raw data, such as high-school and college records, fam-ily backgrounds, psychological profiles, and medical histories, all culled from a wide rangeof sources. Teams can also measure 11 attributes, including drive, endurance, leader-ship, self-confidence, emotional control, mental toughness, coachability, and trust. Usingsoftware, baseball scouts can look for players with the potential for good fielding, hit-ting, or even “hustle.” Prospects are rated on physical qualities and baseball abilities suchas running speed, hitting, fielding, and strength.
Companies such as Target are beginning to use this analytical approach to evaluatejob applicants. Applicants complete in-store and online job applications that include ques-tions to determine suitability for the position, as well as true-or-false statements such as“I would rather sit around and read a book than go to a party with lots of people,” and“I don’t act polite when I don’t want to.” Once the candidate has filled out the initial appli-cation, the system prompts the hiring manager with additional questions that probe moredeeply into areas of concern.
Dow Chemical used to hire MBAs from Ivy League schools—until the company real-ized that these candidates demanded high salaries and few of them wanted to move toMidland, Michigan. Dow delved into the vast quantities of data in its PeopleSoft ERP sys-tem and found that its best candidates came from schools such as Michigan State,Brigham Young, and Purdue. Now Dow focuses its recruiting efforts at the institutionswhere it will be more successful. The cost to hire a new graduate, which exceeds$70,000, is now well spent.
Questions:
1. Assume you are the HR manager at Fitter Snacker. What metrics or measure-ments would you develop to assess the potential of an applicant for a produc-tion supervisor position? A sales manager position? A chief accountant?
2. How successful have the baseball leagues been in using sabermetrics? Researchyour answer on the Internet. Can you estimate how successful Fitter Snackerwould be if it invested in a similar analysis?
Successfully using a Human Resources ERP system requires managing a significantamount of detailed information. The SAP ERP Human Resources (HR) module providestools for managing an organization’s roles and responsibilities, definitions, personal
Chapter 6
166

employee information, and tasks related to time management, payroll, travel manage-ment, and employee training. Advanced HR features of SAP ERP are discussed later in thechapter.
Most companies have an organizational chart or plan that helps define managementresponsibilities. Without an ERP system, the organizational chart defines only the manage-rial relationships among employees. With an ERP system, the organizational chart pro-vides a structure with more detail than a typical organizational chart and supports HR taskssuch as recruiting employees and planning organizational changes.
SAP ERP provides an Organization and Staffing Plan tool that is used to define a com-pany’s management structure and the positions within the organizational structure as awhole. The Organization and Staffing Plan tool also names the person who holds eachposition. Figure 6-2 shows how the Fitter Snacker organizational structure could bedefined in SAP ERP. The figure shows that the Fitter Snacker organization consists of threemain organizational units: Manufacturing, Marketing, and Administrative. The organiza-tional units Accounting and Human Capital Management are part of the Administrativeorganization. Within the Human Capital Management organization are three positions:the HCM Manager and two Analysts.
SAP ERP distinguishes between task, job, position, and person. In SAP, an employeeis a person who performs tasks, which can be assigned either to a job, which is a genericdescription of an employee’s work responsibilities, or to the specific position that the indi-vidual person holds. Figure 6-3 shows the relationships among tasks, jobs, positions, and
organizationalunits
positions
person holdingposition
FIGURE 6-2 Organization and staffing plan in SAP ERP
Human Resources Processes with ERP
167

persons in a Marketing organization. The job of administrative assistant is assigned a num-ber of tasks such as reviewing employee time charges, reviewing employee expensereports, and preparing monthly budget reports for the department. These are tasks that thecompany requires of any administrative assistant, whether that job is in Marketing, Engi-neering, Production, or another department. The job of administrative assistant can bedefined once in SAP by assigning it tasks; then, that definition can be used to create admin-istrative assistant positions in different organizational units. The administrative assistantjob in Marketing is one position, while the administrative assistant job in Accounting is a dif-ferent position. Additional tasks can be added to an administrative assistant position to tai-lor it to the specific requirements of the organizational unit. For example, in Figure 6-3,the position of Marketing Administrative Assistant has the marketing-specific task of pre-paring sales reports; an administrative assistant in Procurement would not be required toperform that task. In ERP, a person is the unique individual who fills a position.
Figure 6-4 shows the screen in SAP ERP where tasks are assigned to jobs—in this case,the task Prepare Budget Report is assigned to the job Administrative Assistant. If the tasksassociated with jobs and positions are well defined and current, it is easier for a recruiterto determine whether candidates have the qualifications for a job. Determining appropri-ate compensation for a position is also simplified if the tasks required for each positionin a company are clearly and consistently defined.
Complete and accurate human resource data simplify a manager’s duties. The Manag-er’s Desktop tool within the SAP HR module provides access to all the Human Resourcesdata and transactions in one location. Figure 6-5 shows the Personal Data portion of theManager’s Desktop. This area provides all of the data maintained in the Human Resourcesmodule for all employees who report to the manager. Human Resources data are very sen-sitive because they are related to employees’ personal information, so controlling access
AdministrativeAssistant
Emily Best
Reviewtime charges
MarketingAdministrative
Assistant
Reviewexpense reports
Preparebudget reports
Preparesales reports
Person
Position
Job
Tasks
FIGURE 6-3 Relationships among positions, jobs, tasks, and persons who fill positions
Chapter 6
168

to them is critical. An advantage of an integrated information system over a paper-based sys-tem is that controlling access to data is automated; managers can use the system to deter-mine which users should have access to various data.
job
task
FIGURE 6-4 Assignment of a task to a job in SAP ERP
employees inmanager’sorganization
functions intask area
FIGURE 6-5 Manager’s Desktop provides single-point access to HR functions
Human Resources Processes with ERP
169
A D V A N C E D S A P E R P H U M A N R E S O U R C E SF E A T U R E S
Discussing in detail the many processes related to Human Resources is beyond the scopeof this text; however, some of the advanced features of the Human Resources module inthe SAP ERP system, including time management, payroll processing, travel and trainingcoordination, are discussed below.
Time ManagementHourly employees, who are paid for each hour worked, must record the time that they workso that they can be paid. Salaried employees are not paid based on hours worked, but theirtime must usually be tracked as well. For cost-accounting purposes, it is important to beable to attribute an employee’s time to a cost object (such as cost center, project, or pro-duction order), and any time not worked must be attributed to vacation or leave. TheSAP ERP system uses Cross Application Time Sheets (CATS) to record employee workingtimes and provide the data to applications that include:
● The SAP Controlling module, for cost management● The SAP Payroll module, for calculating employee pay and transferring the data
to the Financial Accounting module● The SAP Production Planning module, to determine whether enough labor is
available to support production plans
PayrollPayroll is probably the most important Human Resources function. Employees are, not sur-prisingly, very particular about being paid the correct amount at the correct time! Many peoplelive paycheck-to-paycheck, meaning that getting paid correctly and on time is crucial. With-out proper management of the payroll process, employees might not be paid for all of the hoursthey worked, they might not be paid at the appropriate rate, or they might have too much ortoo little money withheld from their pay for taxes and benefits. Mistakes in payroll can causesignificant job dissatisfaction. The two key processes in determining the pay an employeereceives are calculation of the remuneration elements and determination of statutory andvoluntary deductions. The remuneration elements of an employee’s pay include the base pay,bonuses, gratuities, overtime, sick pay, and vacation allowances that the employee has earnedduring the pay period. The statutory and voluntary deductions include taxes (federal, state,local, Social Security, and Medicare), company loans, and benefit contributions. Properly deter-mining the pay for an employee requires accurate input data and correct evaluation of remu-neration elements and deductions.
The process of determining each employee’s pay is called a payroll run. In the pay-roll run, the SAP ERP system evaluates the input data and notes any discrepancies in anerror log. Payroll employees review the error log, make the necessary corrections, andrepeat the payroll run until no errors are recorded. Then the payroll run is used to gener-ate information for accounting, electronic funds transfers, employee pay statements, with-holding tax payments, and other calculations.
Chapter 6
170
Travel ManagementCompanies can spend a significant amount of money on employee travel, and managing traveland its associated expenses can be a significant task. A travel request, which may originatewith the employee or the employee’s manager, is the first step in the travel managementprocess. Travel requests usually require management approval, and the level at which travelmust be approved may depend on the duration and location of the travel. Once managementhas approved the travel, travel reservations must be made. Because airfare, hotel, and rentalcar costs can vary widely, companies frequently require employees to make reservationsthrough either a company travel office or a travel agency under contract to the company. Theemployee must keep receipts for expenses incurred during the trip in order to complete anexpense report and receive reimbursement. The SAP ERP Travel Management system facili-tates this process by maintaining travel data for each employee, including flight, hotel, and carpreferences, and integrating this data with the Payroll module (for reimbursements) and withthe Financial Accounting and Controlling modules, to properly record travel expenses. Sub-mitting an expense report can be simplified using a Web-based application that allows employ-ees to submit reports through a Web browser.
A N O T H E R L O O K
FXIS: From SAP Customer to Solution Provider
Photocopier manufacturer Fuji Xerox established Fuji Xerox Information Services (FXIS)in 1984 to create software for its computer-related products. Since that time, FXIS hastaken over responsibility for managing Fuji Xerox’s information systems and networks, andhas expanded its business to include sales of computer and network equipment, as wellas education and training in computer software applications.
In 1998, FXIS sought to improve its own internal software systems with the goal ofbeing able to close its books (reconcile all of its accounting records) two days after the endof the month. To accomplish this task, FXIS chose to implement SAP ERP.
When planning its SAP implementation, FXIS decided that to meet its goal of clos-ing its books in two working days it should use SAP for all of its business applications andget rid of legacy systems. Unlike some companies using SAP, FXIS emphasizes the inte-gration of HR data. FXIS implemented the Sales & Distribution, Materials Management,Financial Accounting, Controlling, Project System, and Human Resources modules of theERP system. To meet the two-day closing requirement, FXIS needed to have expenseaccount information from its sales force and time charge information from its softwaredevelopers and system administrators. To simplify the collection of travel and time chargedata, FXIS created its Direct Input (DI) system, which makes it easy for users to entertheir time charge data into the system through a Web interface. The DI system stores thesedata in its own database, which allows managers to review and approve the data. Whenthe data have been approved, the information is transferred to the SAP ERP system.
continued
Human Resources Processes with ERP
171

The DI system provides the advantage of a familiar browser interface for users whomay not be comfortable using SAP ERP directly. It also does not require additional soft-ware or hardware. The DI system has proved so successful that FXIS has formed an ERPsolution business and has developed standard templates for its DI system, which it is mar-keting to other SAP customers in Asia.
Questions:
1. What are the advantages and disadvantages of the FXIS decision to use SAP forall business processes and eliminate its legacy system?
2. How does the use of the DI system contribute to FXIS’s goal of closing its booksin two days? Do you think that FXIS experiences any problems because the datacollected by the DI system are not available in real time?
Training and DevelopmentThe Personnel Development component of the SAP ERP Human Resources module supportsthe planning and implementation of employee development and training activities. Sucheducation maximizes an employee’s ability to contribute to the organization. Becauseadvances in technology quickly render an employee’s knowledge obsolete, employees willnot be productive without continuing development and training efforts. In addition, manypositions require certifications that must be updated, and continuing education is fre-quently required for recertification. Without an effective Human Resources information sys-tem, managing the training, development, and certification needs for a company’semployees can be both time-consuming and error-prone.
In the SAP ERP system, employee development is driven by qualifications andrequirements. Requirements are skills or abilities associated with a position, whilequalifications are skills or abilities associated with a specific employee. Requirementsand qualifications refer to the same concept from a different perspective. Using the Person-nel Development tool allows a manager to compare an employee’s qualifications with therequirements for a position to which the employee aspires. This comparison enables themanager to identify gaps and to plan development and training efforts to close the gaps. Itcan also serve as a basis for employee evaluation, and can motivate the employee by pro-viding a goal and the means to achieve it.
One of the most important reasons for managing the development and training ofemployees is succession planning. A succession plan outlines the strategy for replacing keyemployees when they leave the company. The success of a company depends in large parton the skills, abilities, and experience of its management team. This is especially true fora small company like Fitter Snacker. Savvy customers have been known to avoid establish-ing long-term relationships with companies that do not have well-developed successionplans. The Career and Succession Planning components of the SAP ERP Human Resourcesmodule allow HR professionals to create, implement, and evaluate succession planningscenarios. HR departments use Career Planning with individual employees, identifyingpotential career goals and drawing up career plans. Companies use Succession Planningto find people to fill unoccupied positions. Succession Planning allows the human resources
Chapter 6
172

function to meet staffing requirements by identifying candidate employees within the com-pany and ensuring that their training and development plans will prepare them for the newposition when it becomes available. Using the career and succession planning tools in anERP system ensures that HR will have accurate and timely employee and position data whendeveloping the plans. The system allows changes in human resources (such as hiring newemployees, current employees leaving, promotions) to be more easily integrated andtracked, and gives all important users easy access to the information.
A N O T H E R L O O K
Management Succession PlanningFinding a chief executive officer (CEO) can be a tremendous challenge for a company. Formany companies—including Coca-Cola, Xerox, and Procter & Gamble—finding a newCEO has been a process marked by long searches, poor choices, bad luck, and fumbledtransitions. In other cases, succession planning has worked to ensure a smoothtransition. When McDonald’s Corporation CEO James Cantalupo died of a heart attack onApril 19, 2004, succession planning allowed the board of directors to name Charles H. Bellas the new CEO within hours. Unfortunately, McDonald’s succession planning capabili-ties were quickly tested a second time when Bell was diagnosed with cancer only onemonth after being named CEO. Bell was replaced by Jim Skinner in November 2004. Belldied on January 17, 2005.
At Juniper Networks, succession planning was called into action when vice presi-dent and chief information officer Alan Boehme had a car accident that left him with seri-ous injuries. From the accident site, Boehme used his BlackBerry to send an e-mailmessage to Danny Moquin, then the vice president of operations and infrastructure,instructing him to take over Boehme’s duties. Juniper had a modest succession plan ona spreadsheet—it only included the senior management. The plan was modest because thecompany was still in the midst of restructuring when the accident occurred.
A 2006 report on succession planning by Aberdeen Research found that 62 percentof companies have succession plans on paper or on a spreadsheet. This level of succes-sion planning is insufficient. Succession planning goes hand-in-hand with disaster plan-ning, but companies find disaster planning more important, even though accidents occurmore frequently than hurricanes, earthquakes, or terrorist attacks—and people leave orget fired all the time. No one should be irreplaceable, yet most companies, like Jupiter, haveonly modest succession plans. Aberdeen found that 82 percent of companies have suc-cession plans for executives, while 17 percent of companies have succession plans for theirlower-level staff.
continued
Human Resources Processes with ERP
173
ERP HR software can aid greatly in succession planning. At Juniper, Boehme has returnedand is heading up the installation of Oracle’s PeopleSoft for succession planning as part of itsHCM software installation. Far more comprehensive than a simple list of names, HCM soft-ware incorporates information such as skill sets, experience levels, and work histories. Com-panies that don’t have this information available often have minimal succession planning inplace, or find succession planning to be unnecessarily challenging. Experts advise that com-panies should create a succession plan that incorporates every level of the organization. Theyalso say that employees should be encouraged to take over for others who are on vacation, togain experience in doing other jobs. And all employees should have their skill sets analyzedand recorded.
At Juniper, Moquin did a good job replacing Boehme, but the transition derailedmomentum related to Juniper’s growth and restructuring. Now, Boehme has 45 peopleassigned to the PeopleSoft implementation and is hoping to organize a more comprehen-sive succession plan.
Question:
1. What are the reasons that companies fail to create comprehensive successionplans?
A D D I T I O N A L H U M A N R E S O U R C E SF E A T U R E S O F S A P E R P
SAP ERP has to keep pace with rapidly changing social and legislative developments in thecorporate world. The HR module has been expanded to include features that assist man-agers with HR tasks that have only recently become important to corporations.
Mobile Time ManagementMany employees, especially sales personnel who spend a significant amount of time on theroad, may not have regular access to a PC. Mobile Time Management allows employees touse cellular phones to record their working times, record absences, enter a leave request,and check their time charge data.
Management of Family and Medical LeaveThe Human Resources module reduces the administrative burden imposed by the federalFamily and Medical Leave Act (FMLA) of 1993. The HR system can now determinewhether an employee is eligible to take FMLA absences and automatically deducts thoseabsences from the days the employee takes from allowable leave.
Domestic Partner HandlingMany companies provide benefits for domestic (unmarried) partners. The HumanResources module now supports the management of benefits for domestic partners and theirchildren. The system now provides more flexibility in customizing dependent coverage
Chapter 6
174

options for health plans, eligibility for enrollment of dependents, and designation ofbeneficiaries.
Administration of Long-Term IncentivesAn outgrowth of the Sarbanes-Oxley Act (see Chapter 5) is that companies must accountfor the expected costs that occur as a result of long-term incentives such as the exercis-ing of stock options. The Human Resources module now provides more options for process-ing long-term incentives. Integration with the SAP Payroll module enables companies tocalculate taxes accurately when employees exercise incentives and sell their shares in thecompany. SAP can share the incentive data with Accounting so that Accounting can do thenecessary reporting.
Personnel Cost PlanningChanges in an organization (including expansions, acquisitions, and downsizing) can havean impact on employee-related expenses, which are usually a significant portion of a com-pany’s costs. The Personnel Cost Planning tool allows HR personnel to define and evalu-ate planning scenarios to generate cost estimates. Performing cost planning and simulationallows HR to forecast cost estimates by integrating data with other SAP ERP modules.
Management and Payroll for Global EmployeesThe management of global employees involves many complicated issues, including reloca-tion plans, visas and work permits, housing, taxes, and bonus pay. SAP ERP has enhancedfeatures to support the management of these issues, with customized functionality for over50 countries, allowing payroll processes to meet current legal regulations and collectivebargaining agreements in the local business environments.
Management by ObjectivesThe concept of management by objectives (MBO) was first outlined by Peter Drucker in his1954 book The Practice of Management. In MBO, managers are encouraged to focus onresults, not activities, and to “negotiate a contract of goals” with their subordinates with-out dictating the exact methods for achieving them. SAP ERP provides a comprehen-sive process to support the MBO approach that incorporates performance appraisal. Theappraisal results can affect an employee’s compensation, generating annual pay raisesthat can be either significant or insignificant, depending on the employee’s performance.The MBO process in SAP ERP also allows managers to include the results of achieved objec-tives in the employee’s qualifications profile.
Human Resources Processes with ERP
175

Chapter Summary
● Employees are among a company’s most important assets. Without qualified and moti-vated employees, a company cannot succeed.
● The Human Resources department has the primary responsibility of ensuring that thecompany can find, evaluate, hire, develop, evaluate, and compensate the right employ-ees to achieve the company’s goals. HR is also responsible for employee training anddevelopment, succession planning, and termination.
● Managing, sharing, controlling, and evaluating the data required to manage a compa-ny’s human capital are simplified by an integrated information system.
● Additional features of the SAP HR system address today’s changing technology andlegislation.
Key Terms
Error log
Human capital management (HCM)
Job
Payroll run
Person
Position
Qualifications
Remuneration elements
Requirements
Short list
Statutory and voluntary deductions
Succession planning
Task
Exercises
1. Describe a position in a company that you would like to have. What type of information mustbe collected to determine if a candidate is appropriate for this job? List the skills that youthink would be required for this position. Suppose you are designing a system to summa-rize information from resumes submitted to a company’s Human Resources department.Create a list of the information that you think would be useful to collect from the resumes.
2. Describe a position in a company that you would like to have after five years of workexperience. List the requirements that you think would be necessary to hold this position.List the qualifications that you currently possess. Describe how you plan to obtain the quali-fications necessary to hold the position.
3. Suppose you are a manager of Fitter Snacker’s Sales department. What Human Resourcesinformation do you think you would need to manage your sales force?
4. List the steps in a typical recruiting process. Highlight the steps that involve interaction withthe potential job candidate. Identify problems in the process that might lead a candidate todevelop a negative opinion of the company. How might an effective information systemreduce the potential for these problems? Incorporate into your answer experiences you mayhave had in looking for a job.
Chapter 6
176

For Further Study and Research
Ackman, Dan. “Wal-Mart and Sex Discrimination By the Numbers.” Forbes.com, June 23, 2004.http://www.forbes.com/careers/2004/06/23/cx_da_0623topnews.html.
CNNMoney.com. “Wal-Mart to appeal discrimination suit status.” CNNMoney.com, February 6,2007. http://money.cnn.com/2007/02/06/news/companies/walmart/index.htm.
Duvall, Mel. “Boston Red Sox: Backstop Your Business.” Baseline, May 14, 2004.http://www.baselinemag.com/article2/0,1397,1590697,00.asp.
Hines, Matt. “Postal Service seals big SAP deal.” CNET.com, August 23, 2004. http://news.com.com/Postal+Service+seals+big+SAP+deal/2100-1012_3-5319934.html?tag=item.
Holmes, Stanley, and Mike France. “Coverup At Boeing? Internal documents suggest a cam-paign to suppress evidence in a pay-bias lawsuit.” Business Week, June 28, 2004.
Lavelle, Louis. “How to Groom the Next Boss.” Business Week, May 10, 2004.Lynch, C. G. “Smash-Up: How a Violent Car Crash Provided Lessons in Business Continuity and
Succession Planning.” CIO, July 11, 2007.Singer, Michael. “SAP Delivers for the Mailman.” Internetnews.com, August 25, 2004. http://www.
internetnews.com/ent-news/article.php/3399361.Taleo.com. “iLogos Study Shows Majority of Global 500 Companies Recruit on the Careers Web
Site.” Taleo.com, April 8, 2002. http://www.taleo.com/news/press/ilogos-study-shows-majority-global-500-85.html.
“US Postal Service Selects mySAP Business Suite.” SAP & Partner News, August 28, 2004.Wooldridge, Adrian. “A Survey of Talent.” The Economist, October 7, 2006.
Human Resources Processes with ERP
177

This page intentionally left blank

C H A P T E R 7PROCESS MODELING,PROCESS IMPROVEMENT,AND ERP IMPLEMENTATION
L E A R N I N G O B J E C T I V E S
After completing this chapter, you will be able to:
● Use basic flowcharting techniques to map a business process.
● Develop an event process chain (EPC) diagram of a basic businessprocess.
● Evaluate the value added by each step in a business process.
● Develop process improvement suggestions.
● Discuss the key issues in managing an ERP implementation project.
● Describe some of the key tools used in managing an ERP implementa-tion project.
I N T R O D U C T I O N
The underlying theme of this text is the management of business processes. In this chapter, we explore
tools, such as flowcharts and even process chains, that can be used to describe processes. Next, you
learn about how these tools, which are not specific to ERP, can help managers identify process elements
that can be improved. We finish by describing the role these process-modeling tools play in ERP
implementation projects.

P R O C E S S M O D E L I N G
By now, it should be clear that business processes can be quite complex. Individuals withvarious skills and abilities are responsible for executing business processes. In order forbusiness processes to be effective (achieve the desired results) and efficient (achieve thedesired results with the minimum use of resources), they must be clearly defined, and indi-viduals must be adequately trained to perform their roles and to understand how their rolesfit within the business process.
We have used a range of terms, including flowchart, to describe methods of represent-ing processes. We will use the term process model to describe any abstract representa-tion of a process. A process model can be as simple as a diagram with boxes and arrows oras complex as computer software that allows for simulation of the process. Process-modeling tools provide a way to describe a business process so that all participants canunderstand the process. Frequently, process models are developed by a team of employ-ees involved in the process. The interaction required to develop a process model oftenreveals misunderstandings and ensures that all team members are “on the same page.”Graphical representations are usually easier to understand than written descriptions. Awell-developed process model provides a good starting point for analyzing a process so thatparticipants can design and implement improvements. Process models also document thebusiness process, making it easier to train employees to support the business process.
Flowcharting Process ModelsFlowcharts are the simplest of the process-modeling tools. A flowchart can be defined asany graphical representation of the movement or flow of concrete or abstractitems—materials, documents, logic, and so on. Flowcharts originated with computer pro-grammers and mathematicians, who used them to trace the logical path of an algorithm.In the early days of computer programming, computer resources were limited, and execut-ing a program used considerable resources. As a result, most programmers spent a signifi-cant amount of their time clearly defining the logic of their programs, using flowchartsbefore actually writing the code and testing the program.
A flowchart is a clear, graphical representation of a process from beginning to end, regard-less of whether that process is an algorithm or a manufacturing procedure. Flowcharting hasbeen used since the 1960s in business applications to help businesspeople visualize work-flows and functional responsibility within organizations. Today the term process mapping isused interchangeably with flowcharting, the distinction being that process mapping specifi-cally refers to the activities occurring within an existing business process. Process mappingdevelops an “as is” representation of the process, with a goal of exposing weaknesses that needto be addressed. Once a company develops a process map, it can perform a gap analysis, whichis an assessment of disparities between an organization’s current situation and itslong-term goals.
Flowcharting uses a standardized set of symbols to represent various business activities.Few symbols are required to define a business process. Figure 7-1 shows the basic flow-charting symbols. You can use a wide range of symbols for process mapping, but the basicset shown in Figure 7-1 is sufficient to describe even a complicated business process. Usinga few simple symbols places the focus on the process, not on the tool used to represent it.
Chapter 7
180

The following description of the process Fitter Snacker uses to reimburse sales person-nel for their business expenses illustrates process mapping.
Fitter Snacker Expense Report ProcessAfter a Fitter Snacker salesperson, Maria, incurs travel expenses on her credit card, shecompletes a paper expense report, makes a copy for her records, attaches receipts for anyexpenses over $25, and mails it to her zone manager at the branch office. The manager,Kevin, reviews it and either approves the report or mails it back to Maria with a note ask-ing for an explanation, verification, or modification. Once Kevin approves the expensereport, he mails it to the corporate office. After the administrative assistant sorts the mailat the corporate office, she forwards the expense report to the accounts payable (A/P)clerk, who performs a preliminary check of the report. The clerk contacts the zone man-ager for any necessary clarification, then forwards the expense report to the expensereport auditor, who reviews it. If there is a problem with the report, the auditor mails it backto Maria, who revises and returns it. Then the auditor enters the report into Fitter Snack-er’s PC-based accounting system and files a hard copy with the receipts in a filing cabi-net, organized by employee name.
At the end of each week, an A/P clerk uses the PC-based accounting system to print pay-roll checks, payments to suppliers, and expense reimbursement checks. When Mariareceives her reimbursement check, she deposits it into her checking account and mails apayment to the credit card company, which credits her card account. Figure 7-2 shows theprocess map for the first part of the current Fitter Snacker expense-reporting process.
One of the most important decisions to make in process mapping is to define the pro-cess boundaries. The process boundaries define which activities are to be included in theprocess, and which are considered part of the environment—external to the process. It isimportant to clearly define the activities that are part of the process and those that areexternal to the process. Many activities related to sales employee expenses are consid-ered outside of the boundary of the process map shown in Figure 7-2. For example, a
1
Operation
Decision
Connector
Boundaries (beginning/end of process)
Direction of logic
FIGURE 7-1 Basic flowcharting symbols
Process Modeling, Process Improvement, and ERP Implementation
181

company might provide cash advances or issue corporate credit cards before employeesincur travel expenses. Employees might need to make reservations for air travel or hotelsthrough a corporate travel office. The company might want employees to use a pre-ferred hotel, or might have specific policies regarding car rentals, including preferred rentalcompanies, approved car classes, insurance, and prepaid gas. While all of these consider-ations are important and should be documented somewhere, the process mapped inFigure 7-2 is the expense-reporting process; the process boundaries do not include theseadditional travel-related activities. The process map begins after travel expenses havebeen incurred and ends with the receipt by the salesperson of a refund check. These start-ing and end points are the process boundaries for the expense-reporting process.
Yes
No
1
Expenses incurred
Employee completesexpense report
Employee copiesreport and receipts
Employee attachesreceipts for all
expenses > $25
Employee mailsexpense report to
sales manager
Sales managerreviews report
Employee modifiesexpense report
Sales managermails report back
to employee
Expensereport
approved?
Sales manager mailsexpense report tocorporate office
FIGURE 7-2 Partial process map for Fitter Snacker expense-reporting process
Chapter 7
182
In Figure 7-2, the beginning process boundary is represented by the oval figure con-taining the text “Expenses incurred.” All processes should have only one beginning pointand one ending point. After the Expenses incurred oval, the process map shows fouroperation blocks that define the tasks performed by the employee in completing the expensereport. The number of operation blocks and the level of detail in the descriptions are a mat-ter of the user’s preference and depend on the purpose for which the process map iscreated. If the process map will be used to improve a business process, and the membersof the process improvement team are familiar with the process, then less detail is needed. Infact, too much detail could obscure the key features of the process. On the other hand, theprocess map might be used to document the process for training new sales employees.In that case, more detail is needed so that new employees can use the process map to fol-low the process properly.
Figure 7-2 also contains a decision diamond. A decision diamond asks a question thatcan be answered with “yes” or “no.” In the figure, the decision diamond asks whether thesales manager approves the expense report. There are only two possible options—yes andno. It is tempting for the novice to create process maps with decision diamonds that havemore than two outcomes. Doing so can lead to confused logic—all business processes can bedefined using one or more decision diamonds, each with only two outcomes.
Finally, because Figure 7-2 only shows part of the expense-reporting process, the flow-chart ends with a connector. Most business processes are too complicated to fit on a singlesheet of paper. Connectors provide a way to continue process maps from one sheet tothe next.
Exercise 7.1Complete the process map for the Fitter Snacker expense report process started inFigure 7-2, using the process-mapping symbols shown in Figure 7-1.
Extensions of Process MappingThe development of computer technology, specifically high-quality graphical interfaces, hasallowed process-mapping tools to evolve beyond the simple symbols of flowcharting. Onehelpful tool is hierarchical modeling, which is the ability to flexibly describe a business pro-cess in greater or less detail, depending on the task at hand. Figure 7-3 illustrates a hier-archical model of Fitter Snacker’s expense report process.
It is important to document (for training purposes) the detailed steps that the salesper-son follows to complete the expense report; however, the details can make the process mapcumbersome for process improvement activities. In hierarchical modeling, the four stepsthat the salesperson follows to complete the expense report can be condensed into one step,designated as Employee prepares expense report. Modeling software that supports hierarchi-cal modeling provides the user with the flexibility to move easily from higher-level, lessdetailed views to the lower-level, more detailed views. Hierarchical modeling can aid inprocess mapping by allowing a user to create a broad, high-level view of a process and then addmore detail as the process is analyzed.
Process Modeling, Process Improvement, and ERP Implementation
183
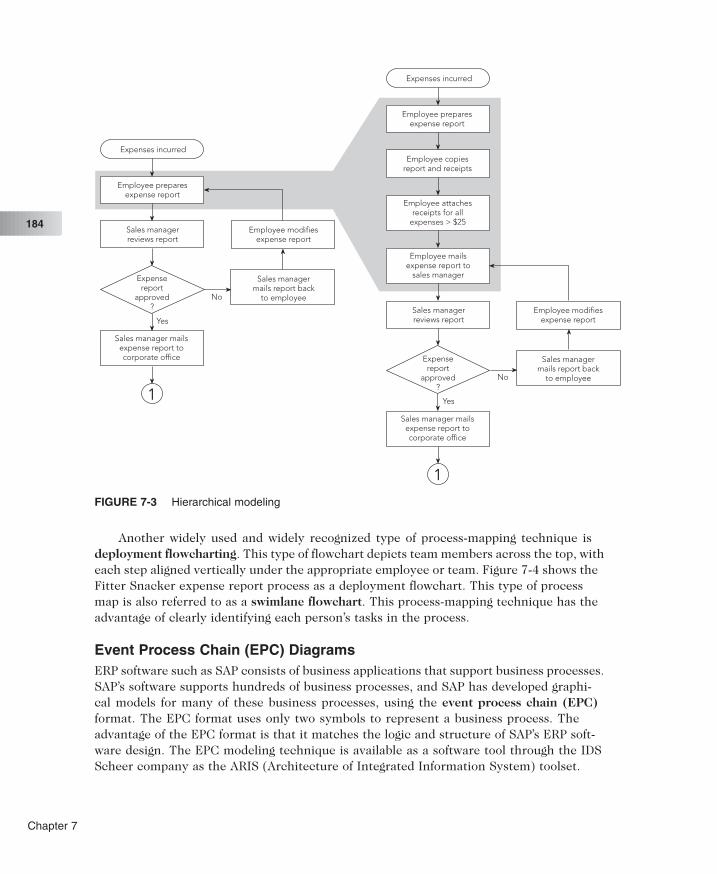
Another widely used and widely recognized type of process-mapping technique isdeployment flowcharting. This type of flowchart depicts team members across the top, witheach step aligned vertically under the appropriate employee or team. Figure 7-4 shows theFitter Snacker expense report process as a deployment flowchart. This type of processmap is also referred to as a swimlane flowchart. This process-mapping technique has theadvantage of clearly identifying each person’s tasks in the process.
Event Process Chain (EPC) DiagramsERP software such as SAP consists of business applications that support business processes.SAP’s software supports hundreds of business processes, and SAP has developed graphi-cal models for many of these business processes, using the event process chain (EPC)format. The EPC format uses only two symbols to represent a business process. Theadvantage of the EPC format is that it matches the logic and structure of SAP’s ERP soft-ware design. The EPC modeling technique is available as a software tool through the IDSScheer company as the ARIS (Architecture of Integrated Information System) toolset.
Yes
No
Yes
No
1
Expenses incurred
Sales managerreviews report
Employee modifiesexpense report
Sales managermails report back
to employee
Expensereport
approved?
Sales manager mailsexpense report tocorporate office
1
Expenses incurred
Sales managerreviews report
Employee modifiesexpense report
Sales managermails report back
to employee
Expensereport
approved?
Sales manager mailsexpense report tocorporate office
Employee preparesexpense report
Employee mailsexpense report to
sales manager
Employee copiesreport and receipts
Employee attachesreceipts for all
expenses > $25
Employee preparesexpense report
FIGURE 7-3 Hierarchical modeling
Chapter 7
184
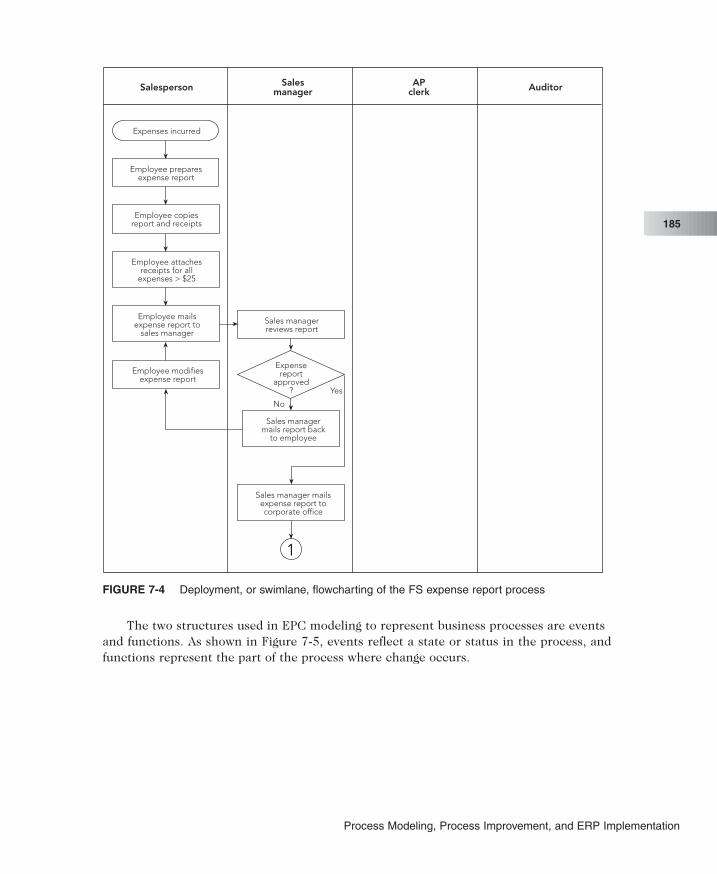
The two structures used in EPC modeling to represent business processes are eventsand functions. As shown in Figure 7-5, events reflect a state or status in the process, andfunctions represent the part of the process where change occurs.
Salesperson Salesmanager
APclerk Auditor
Yes
No
Sales managermails report back
to employee
Sales managerreviews report
Expensereport
approved?
1
Expenses incurred
Employee preparesexpense report
Employee copiesreport and receipts
Employee attachesreceipts for all
expenses > $25
Employee mailsexpense report to
sales manager
Employee modifiesexpense report
Sales manager mailsexpense report tocorporate office
FIGURE 7-4 Deployment, or swimlane, flowcharting of the FS expense report process
Process Modeling, Process Improvement, and ERP Implementation
185
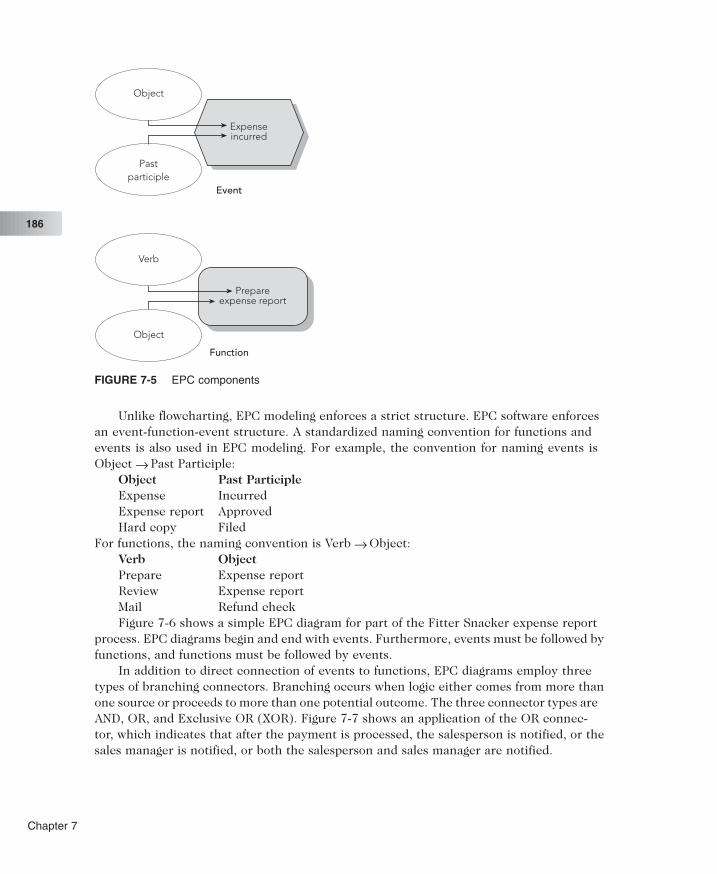
Unlike flowcharting, EPC modeling enforces a strict structure. EPC software enforcesan event-function-event structure. A standardized naming convention for functions andevents is also used in EPC modeling. For example, the convention for naming events isObject Past Participle:
Object Past ParticipleExpense IncurredExpense report ApprovedHard copy Filed
For functions, the naming convention is Verb Object:Verb ObjectPrepare Expense reportReview Expense reportMail Refund checkFigure 7-6 shows a simple EPC diagram for part of the Fitter Snacker expense report
process. EPC diagrams begin and end with events. Furthermore, events must be followed byfunctions, and functions must be followed by events.
In addition to direct connection of events to functions, EPC diagrams employ threetypes of branching connectors. Branching occurs when logic either comes from more thanone source or proceeds to more than one potential outcome. The three connector types areAND, OR, and Exclusive OR (XOR). Figure 7-7 shows an application of the OR connec-tor, which indicates that after the payment is processed, the salesperson is notified, or thesales manager is notified, or both the salesperson and sales manager are notified.
Event
Function
Object
Pastparticiple
Prepareexpense report
Expenseincurred
Object
Verb
FIGURE 7-5 EPC components
Chapter 7
186

Expense reportreceived
Prepareexpense report
Expenseincurred
Mail expensereport
Expense reportcompleted
FIGURE 7-6 Basic EPC layout
Processpayment
Salespersonnotified
Sales managernotified
OR connector
FIGURE 7-7 OR connector
Process Modeling, Process Improvement, and ERP Implementation
187
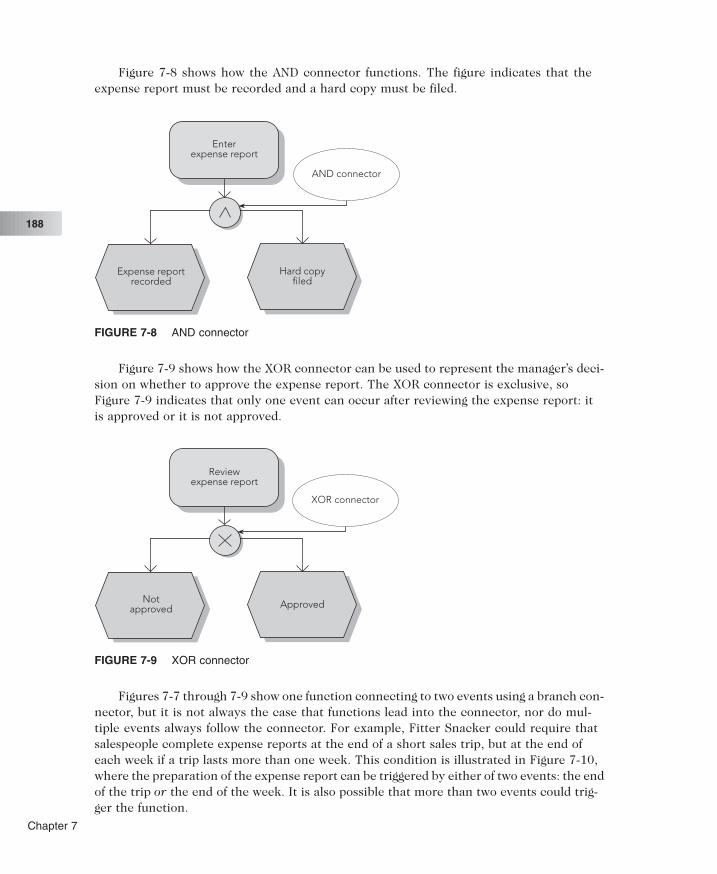
Figure 7-8 shows how the AND connector functions. The figure indicates that theexpense report must be recorded and a hard copy must be filed.
Figure 7-9 shows how the XOR connector can be used to represent the manager’s deci-sion on whether to approve the expense report. The XOR connector is exclusive, soFigure 7-9 indicates that only one event can occur after reviewing the expense report: itis approved or it is not approved.
Figures 7-7 through 7-9 show one function connecting to two events using a branch con-nector, but it is not always the case that functions lead into the connector, nor do mul-tiple events always follow the connector. For example, Fitter Snacker could require thatsalespeople complete expense reports at the end of a short sales trip, but at the end ofeach week if a trip lasts more than one week. This condition is illustrated in Figure 7-10,where the preparation of the expense report can be triggered by either of two events: the endof the trip or the end of the week. It is also possible that more than two events could trig-ger the function.
AND connector
Enterexpense report
Expense reportrecorded
Hard copyfiled
FIGURE 7-8 AND connector
Reviewexpense report
Notapproved Approved
XOR connector
FIGURE 7-9 XOR connector
Chapter 7
188

Figure 7-11 shows all possible connection combinations. Note that it is not possible tohave a single event connect to multiple functions with OR or XOR connectors, becauseevents represent a status or state. Because OR and XOR connectors require a decision, theymust be preceded by a function, so that a decision can be made.
Tripcompleted
Weekends
Prepareexpense report
FIGURE 7-10 OR connector with two triggering events
Event
FunctionFunctionFunction
Event Event
Event Event
Function
Event
FunctionFunctionFunction
Event Event
Event Event
Function
Event
FunctionFunctionFunction
Event Event
Event
Function Function
Event Event
Function
Event trigger Function trigger
Single Multiple Single Multiple
AND
OR
XOR
Notallowed
Notallowed
FIGURE 7-11 Possible connector and triggering combinations
Process Modeling, Process Improvement, and ERP Implementation
189

Finally, Figure 7-12 shows splitting and consolidating of a path through the process.In this case, the Fitter Snacker salesperson can submit her expense report online if she hasInternet access; otherwise, she must send in a paper report. Note that the type of branchconnector that splits the path also must be used to consolidate it.
CheckInternet availability
Expenseincurred
Preparepaper report
Internetnot available
Internetavailable
Prepareonline report
Reportmailed
Reportsubmitted
electronically
Reviewexpense report
FIGURE 7-12 Splitting and consolidating process paths
Chapter 7
190

The basic EPC diagram can be augmented with additional information. For example,Figure 7-13 shows the first part of an EPC diagram for the Fitter Snacker expense report pro-cess that also shows data elements (unapproved multicopy expense reports) and organi-zational elements (salesperson, sales manager). The additional elements allow for a morecomplete description of the process, documenting the “who” and “what” aspects of theprocess.
Expense reportreceived
Prepareexpense report
Expenseincurred
Mail expensereport
Expense reportcompleted
Reviewexpense report
Salesperson
Salesperson
Salesmanager
Unapprovedmulticopy
expense report
Unapprovedmulticopy
expense report
FIGURE 7-13 EPC diagram with organizational and data elements
Process Modeling, Process Improvement, and ERP Implementation
191
Exercise 7.2Using the above description, complete the EPC diagram of the Fitter Snacker expense reportprocess shown in Figure 7-13. Add both the logic elements (events, functions, and connec-tors) and the organizational elements.
P R O C E S S I M P R O V E M E N T
Process-mapping tools provide the ability to describe business processes in a universallyunderstood format. Generally, the task of mapping a process requires a team consisting ofkey personnel who are involved in the process. Frequently, the act of accurately describ-ing the process, and understanding how the functional areas interact, make it obvious to theteam what steps are necessary to improve the process. This is especially true for organi-zations that have focused on functional responsibilities, and not on business processes.
Using the simple technique of value analysis can also generate process improvementideas. In value analysis, each activity in the process is analyzed for the value it adds to theproduct or service. The value added is determined from the perspective of the customer.Activities can add:
● Real value: Value for which the customer is willing to pay● Business value: Value that helps the company run its business● No value: An activity that should be eliminated
Activities that cost more than their value added should be improved. The Fitter Snackerexpense report process does not provide real value, because Fitter Snacker’s customers donot care whether sales employees receive prompt and accurate reimbursement of theirbusiness expenses. However, the expense report process does provide business value, andit should provide this value at a minimum cost. Evaluating the value of a business activ-ity is not a hard science. Determining the value of a good or service is easy—it’s what some-one is willing to pay for it. Applying this idea to a part of a business process is morechallenging, because parts of a process can’t be “sold” on the open market. While a chal-lenging task, evaluating each activity on the basis of value provided can highlight oppor-tunities for improvement.
The value analysis concept can be expanded to an evaluation of both the time and costof each process step. For each step in the current process, you would estimate the actualtime and cost. Then you would estimate the value-added time and cost—determininghow much of the actual time is adding value and how much of the cost is worth paying for.
We will use a Fitter Snacker process to illustrate value analysis. The company’s mailexpense report function could cost upwards of $50, including not just the cost of the enve-lope and postage, but also the time spent by the salesperson to mail the expense report. Thevalue analysis includes elapsed time for mailing the expense report—the length of time fromwhen the salesperson mails the report until the sales manager receives it. This elapsed timeshould include the time it takes the salesperson to find a mailbox, the time the postal servicetakes to deliver the expense report to the company headquarters, plus the time it takes thecompany’s internal mail system to deliver the expense report to the sales manager.
Suppose that for Fitter Snacker the elapsed time is typically three days. To perform valueanalysis, you would determine how much of this time and cost is value-added. To determinethis value, you must view the activity mail expense report in terms of what is actually being
Chapter 7
192
accomplished. It is not the physical transmission of paper that matters. Mailing the expensereport is a means to transmit expense data and documentation. E-mail minimizes the time andcost required to transmit data; therefore, mailing an expense report at a cost of $50, to arrivein three days, is only providing value worth pennies (which is the cost to send an e-mail) ina function that it should be possible to execute within seconds. Looking at the current time andcost of each process step, then asking, “What is actually being accomplished and what is thevalue?” can help identify areas for process improvement.
Each step in a business process should be challenged to determine if it is providingvalue. H. James Harrington, in his book Business Process Improvement, suggests that com-panies ask the following questions about their business processes to identify areas forimprovement:
● Are there unnecessary checks and balances?● Does the activity inspect or approve someone else’s work?● Does it require more than one signature?● Are multiple copies required?● Are copies stored for no apparent reason?● Are copies sent to people who do not need the information?● Is there unnecessary written correspondence?● Are there people or agencies involved that impede the effectiveness and effi-
ciency of the process?● Do existing organizational procedures regularly impede the efficient, effec-
tive, and timely performance of duties?● Is someone approving something they already approved (for example, approv-
ing capital expenditures that were approved as part of a budget)?● Is the same information being collected at more than one time or location?● Are duplicate databases being maintained?
Harrington also suggests concepts that can be used to improve processes:
● Perform activities in parallel, for example, approvals.● Change the sequence of activities.● Reduce interruptions.● Avoid duplication or fragmentation of tasks.● Avoid complex flows and bottlenecks.● Combine similar activities.● Reduce the amount of handling.● Eliminate unused data.● Eliminate copies.
Evaluating Process ImprovementWhile identifying process improvements is challenging, implementing them is even morechallenging. Disrupting the current process to make changes can be costly and time-consuming, and managers are frequently reluctant to risk trying process improvementideas—especially if the ideas require significantly different ways of doing things. One wayto overcome this risk is to use dynamic process modeling to evaluate process changesbefore they are implemented. Dynamic process modeling takes a basic process flowchart
Process Modeling, Process Improvement, and ERP Implementation
193
and puts it into motion, using computer simulation techniques to facilitate the evaluationof proposed process changes. Computer simulation uses repeated generation of randomvariables (such as customer orders) that interact with a logical model of the process to pre-dict the performance of the actual system. These models can estimate the performance ofthe system, using measures such as cycle time (how long the process takes), productiv-ity, total cost, idle time, and bottlenecks.
A N O T H E R L O O K
Business Process Innovation at Nova Chemicals
Nova Chemicals has used business process innovation to move from a function-orientedcompany to a process-oriented company. According to John Wheeler, CIO of NovaChemicals, “Business process innovation (BPI) is the process of improving processes. BPIis based on understanding the way you work. Once you understand the way you work, youcan begin to improve the way you work.” As part of its BPI initiative, Nova has used IDSScheer’s ARIS toolset to document its business processes. The ARIS toolset is a graphicalprocess-mapping tool that helps companies define business processes and the relation-ships between the processes and the people who execute them. Nova has seen the ARIStoolset as a “huge enabler” in BPI. The tool requires structure and discipline to use, butallows companies to understand all of their processes, not just the workflow. Wheeler esti-mates that in the early days of computer information systems, technology was 75 to80 percent of the cost of a project, while today technology is only 10 to 15 percent of theproject’s cost. Wheeler estimates that 30 to 40 percent of the budget for a business pro-cess improvement project is spent on understanding the current process.
Nova has seen considerable success using BPI in its sales process. In this project, Novagathered top salespeople and had them document the sales process using the ARIS toolset.Nova discovered that every salesperson performed the process differently, and in facili-tating innovation sessions, managers were able to develop the best practices for usethroughout the company, taking the best ideas from each participant. Wheeler hasobserved that “thought leaders”—the people who contribute most to generating processimprovement ideas—can come from anywhere in the organization, and it is frequently sur-prising who the thought leaders turn out to be.
Wheeler sees BPI as just the next step in the evolution of process improvementmethods. Other methods for improving processes include quality circles, continuousimprovement, and business process reengineering. In many ways, BPI resembles qual-ity circles, the quality improvement technique pioneered in Japan in the 1970s. In qualitycircles, employees in a department have regular team meetings to discuss problems andcollaboratively develop solutions. Quality circles were followed by the continuousimprovement quality philosophy, again imported from Japan, which prescribed system-atic and repeated improvement efforts. The concept of business process reengineering waspopularized by Michael Hammer and James Champy in their 1993 book Reengineeringthe Corporation. Unlike continuous improvement, which stressed repeated improvementactivities to achieve gradual improvements, business process reengineering recom-mends radical change to achieve radical improvements. BPI is the latest evolution ofimprovement methodologies.
continued
Chapter 7
194
Some people might see the continually changing methods merely as fads that allowconsultants to sell new consulting services. Wheeler doesn’t see it that way. Innovations inmethods and techniques of process improvement can keep innovation fresh and new. ToWheeler, BPI is itself a process, and all processes can be improved.
Questions:
1. What role does process mapping play in business process improvement? Is therean advantage to using a structured approach like IDS Scheer’s ARIS toolset?
2. How would you form a team to improve a business process? How would you man-age the project? What tools would you use?
3. Can you think of any ways in which technology can contribute to furtherimprovements in the process of improving business processes?
E R P W O R K F L O W T O O L S
Most business processes are performed regularly, enabling employees responsible for theprocess to become efficient in the tasks involved in the process. For example, the sales orderprocess is fundamental to a manufacturing business; the salespeople, sales order clerks,warehouse managers, accounts receivable clerks, and others are spending most of their daysupporting the process. If the process is efficiently designed and managed, and the employ-ees are properly trained, workers will experience enough repetition to become efficientin their daily tasks.
Many business processes, however, are performed sporadically. The effectiveness ofthese processes can be poor, especially when the processes apply to more than one func-tional area. Many times, the work “falls through the cracks,” not necessarily through neg-ligence, but due to a lack of repetition. For example, the process of establishing credit limitsoccurs occasionally, and requires coordination between Sales, which identifies new cus-tomers and gathers basic data (contact names, addresses, terms and conditions) andAccounts Receivable, which must evaluate the customer’s credit history to establish acredit limit. Unless employees manage the process of establishing a credit limit properly, anew customer’s order may be blocked for an unacceptable length of time. For sporadic pro-cesses, a workflow tool can automate the process to ensure that the tasks are per-formed in a timely and correct manner.
Workflow tools are software programs that automate the execution of business pro-cesses and address all aspects of a process, including the process flow itself (the logical stepsin the business process), the people involved (the organization), and the effects (the pro-cess information). ERP software provides a workflow management system that supportsand speeds up business processes. It enables employees to carry out complex business pro-cesses and track the current status of a process at any time.
The SAP ERP workflow tool integrates organizational data (which indicate how anauthorized worker is supposed to perform a transaction) with business transactions. SAP’sinternal e-mail system lets you use workflow to view links between work and varioustransactions. These links, called workflow tasks, can include basic information, notes, and
Process Modeling, Process Improvement, and ERP Implementation
195
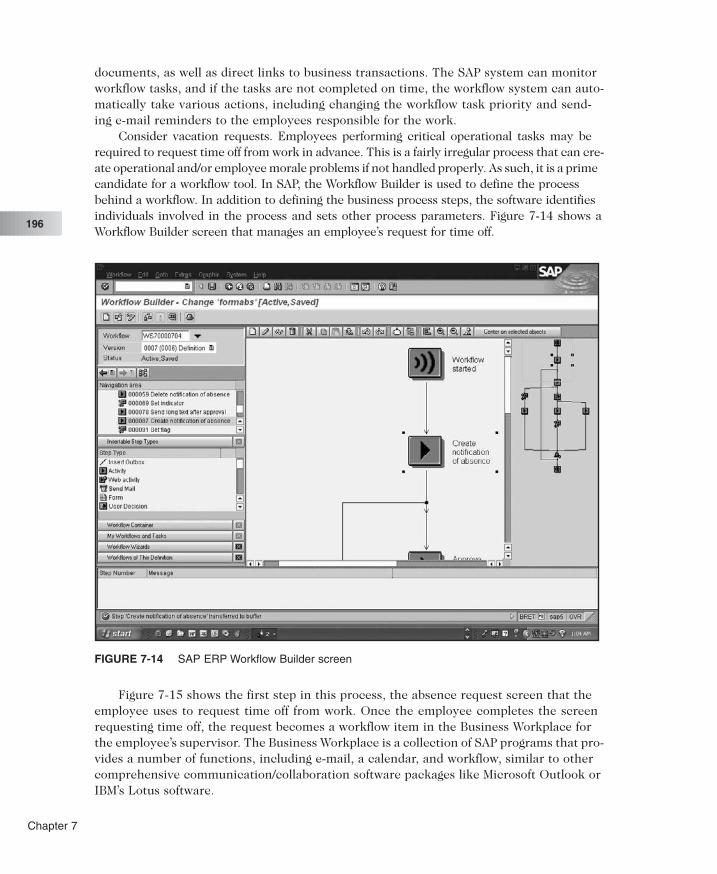
documents, as well as direct links to business transactions. The SAP system can monitorworkflow tasks, and if the tasks are not completed on time, the workflow system can auto-matically take various actions, including changing the workflow task priority and send-ing e-mail reminders to the employees responsible for the work.
Consider vacation requests. Employees performing critical operational tasks may berequired to request time off from work in advance. This is a fairly irregular process that can cre-ate operational and/or employee morale problems if not handled properly. As such, it is a primecandidate for a workflow tool. In SAP, the Workflow Builder is used to define the processbehind a workflow. In addition to defining the business process steps, the software identifiesindividuals involved in the process and sets other process parameters. Figure 7-14 shows aWorkflow Builder screen that manages an employee’s request for time off.
Figure 7-15 shows the first step in this process, the absence request screen that theemployee uses to request time off from work. Once the employee completes the screenrequesting time off, the request becomes a workflow item in the Business Workplace forthe employee’s supervisor. The Business Workplace is a collection of SAP programs that pro-vides a number of functions, including e-mail, a calendar, and workflow, similar to othercomprehensive communication/collaboration software packages like Microsoft Outlook orIBM’s Lotus software.
FIGURE 7-14 SAP ERP Workflow Builder screen
Chapter 7
196

Figure 7-16 shows a request for time off in the workflow inbox of the manager’s BusinessWorkplace. From this screen, the manager can either approve or deny the request. If the requestis approved, the employee receives notification of the approval by e-mail. If the request isdenied, the manager can include a note explaining the rationale. The rejected request will besent to the employee’s workflow inbox, where that person can either modify the request orcancel it.
Workflow provides a number of useful features. Employees can track the progress ofworkflow tasks, reviewing their status at any time. The system can be programmed to sendreminders to the employee(s) responsible for a task after a predetermined period of time.Managers can build flexibility into workflow tasks regarding who can perform the task.For example, suppose that the Accounts Receivable (A/R) department has three employ-ees who can set credit limits. You could create a workflow task to set a new customer’s creditlimit and send it to the workflow inbox of all three A/R employees. When one of the employ-ees completes the task, the system removes it from all three workflow inboxes. You canalso generate statistics on the number of workflow tasks handled by each employee and theaverage time taken to complete the tasks, resulting in better staffing decisions.
For regular, day-to-day business processes, workflow tools are not required. But for spo-radic processes that are repeated frequently enough to justify the development costs, work-flow tools are a powerful way to improve process efficiency and effectiveness.
FIGURE 7-15 Absence request screen
Process Modeling, Process Improvement, and ERP Implementation
197

I M P L E M E N T I N G E R P S Y S T E M S
You learned about some of the issues and challenges in implementing ERP in Chapter 2.Implementation was particularly challenging in the late 1990s, as many firms rushed toimplement ERP systems to avoid the Y2K problem. The explosive growth in demand forERP implementations at that time caused a significant shortage of experienced consultants.Since 2000, the pace of implementations has slowed considerably. Most Fortune 500 firmshave implemented an ERP system. The current growth area in ERP implementations isin the small to midsized business market, and vendors have been developing products,including Microsoft Great Plains and SAP Business One, tailored to this market.
Recall that the implementation of ERP is an ongoing process, not a one-time task. ERPsystems are extremely complicated, and no company takes full advantage of all the capa-bilities in the system. Firms that implemented ERP systems to avoid the Y2K problem likelyinstalled ERP systems that only covered the basic functionality necessary to operate thebusiness through the Y2K transition. Many of these firms are now looking to leverage theirERP systems to improve their business processes, which means that their implementa-tion projects, while smaller than the initial ERP implementation, still require effectivemanagement.
FIGURE 7-16 Manager’s Business Workplace with workflow task
Chapter 7
198
A N O T H E R L O O K
Implementation Choices for the Small to Midsized Market
Traditionally, when small to midsized companies looked to implement an ERP system, theywould buy one that was offered regionally and for their specific industry; many Euro-pean companies adopted this strategy because the European ERP vendors were familiarwith regional differences in business. However, now that the marketplace and manufac-turing are global scenarios, this method of choosing ERP systems is no longer valid. Fur-ther, these smaller, regional ERP vendors often offered only one part of the package. If acompany wanted more, it had to piece together different ERP systems.
Now the small to midsized market is being served by the larger ERP vendors, in anenvironment that is experiencing tremendous consolidation. Companies are concernedthat if they choose an ERP vendor, that vendor could be bought by another vendor thatwould provide minimal update support for the original ERP system. Or in some cases, thecompany might have to migrate to a different ERP system. For example, PeopleSoft, oncean independent vendor, is now one of several ERP products owned by Oracle. Oraclealso has purchased J.D. Edwards, Retek, and Siebel. In 2005, when Oracle took overPeopleSoft, it laid off 5,000 employees but spared staffers directly involved with custom-ers and with code and technology originating from PeopleSoft and J.D. Edwards.
The two largest players in the ERP market, SAP and Oracle, are now focusing on smallto midsized customers (companies with fewer than 1,000 employees). These two ven-dors enjoy a direct advantage over their smaller competitors because of their huge researchand development efforts. The third-largest ERP vendor is a company called Sage Soft-ware, which has acquired a number of companies, including the accounting softwaremanufacturer Peachtree. The fourth player in this market is Infor, which also hasacquired a large number of companies, including MAPICS (with 4,500 customers, includ-ing Volvo Construction Equipment) and Mercia Software (which services General Motorsand Coca-Cola). Microsoft, which acquired Great Plains, Solomon Software, and Navi-sion, is growing at 20 percent per year with revenues exceeding $800 million, and is esti-mated to be about fifth in the ERP market.
One very important criterion for a small or midsized company to identify when select-ing an ERP system is the depth of the system. The ERP software must be capable of han-dling the industry that the company is in, with all of its fine details. For example, an ERPsystem that specializes in accounting will not be very useful if you are running a law firm.SAP addresses this need for specialization by partnering with firms that can provide thatindustry depth—or, as it is known, serve a “vertical.” SAP’s product, All-in-One, is cre-ated with industry partners to provide a single solution for a specific industry. By partner-ing with other firms who have expertise in the specific areas, SAP is able to offer manymore tailored packages.
Questions:
1. What specific needs do you think a small to midsized company has in select-ing an ERP vendor? How do these needs differ from those of a large company?
2. If your ERP vendor is bought by another, what challenges might you face in termsof your ERP system?
Process Modeling, Process Improvement, and ERP Implementation
199
ERP System Costs and BenefitsAs you learned in Chapter 2, ERP implementation is expensive (usually ranging between$10 million and $500 million, depending on company size). Among its costs are:
● Software licensing fees: ERP software is quite expensive, and most ERP ven-dors charge annual license fees based on the number of users.
● Consulting fees: ERP implementations require the use of consultants withdetailed knowledge of how to configure the software to support the compa-ny’s business processes. Good consultants have extensive experience in theway ERP systems function in practice, and they can help companies makedecisions that avoid excessive data input, while capturing the needed informa-tion to make managerial decisions.
● Project team member time: ERP projects require key people in the companyto guide the implementation. These team members have detailed knowledgeof the company’s business, and they work with the consultants to make surethat the configuration of the ERP software will support the company’s needs.This means that these workers are frequently removed from their daily respon-sibilities to work on the implementation project.
● Employee training: Project team members need training in the ERP softwareso that they can work successfully with the consultants in the implementation.The team members frequently work with training consultants to develop anddeliver company-specific training programs for all employees.
● Productivity losses: No matter how smooth the ERP implementation, compa-nies normally lose productivity during the first weeks and months after switch-ing to the new ERP system.
Companies must identify a significant financial benefit that will be generated by theERP system, to justify the money they will spend on it. The only way companies can savemoney with ERP systems is by using them to support more efficient and effective busi-ness processes. This means that implementation projects should not re-create the compa-ny’s current processes and information system in a new ERP package—which is a very realpossibility. SAP provides all source code with its ERP package, which means that the usercan see how its ERP system is designed and can alter the package through its internal pro-gramming language, called Advanced Business Application Programming (ABAP), which youfirst learned about in Chapter 2. With access to the SAP ERP source code, it is possible fora company to spend a significant sum of money on software code development to avoidchanging its business process to the best practices designed into the ERP software. Recallthat many companies would prefer to avoid changing their processes and continue doingbusiness as they always have – rather than adopt the best practices built into the ERPsystem.
Finally, companies must manage the transfer of data from their old computer systemsto the new ERP system. In addition to managing master data such as materials data, cus-tomer data, vendor data, and so on, a company must also transfer transaction data, whichincludes sales orders and purchase orders, many of which are in various stages ofprocessing—a challenging task.
Chapter 7
200

I M P L E M E N T A T I O N A N D C H A N G EM A N A G E M E N T
How does a company make sure that its ERP investment pays off in increased profitability?The key challenge is not in managing technology, but in managing people. An ERP sys-tem changes how people work, and for the system to be effective, the change may have tobe dramatic, going beyond the look of the software and into the way employees performtheir tasks. Furthermore, business processes that are more effective require fewer people.Some employees will no longer be needed. It is no small thing to ask people to partici-pate in a process that may not only change their day-to-day activities, but could also elimi-nate their current jobs.
Managing the human behavior aspects of organizational change is called organizationalchange management (OCM). Do not underestimate the importance of this part of theimplementation process. One of the keys to managing OCM is to realize that people do notmind change, they mind being changed. If the ERP implementation is a project that isbeing forced on the employees, they will resist it. If employees view it as a chance to makethe company more efficient and effective by improving business processes, and if theseprocess improvements will make the company more profitable and therefore provide morejob security, then there is a greater likelihood that employees will support the implemen-tation efforts. As the previous section mentioned, the best way to improve a business pro-cess is to have the people most familiar with the process participate, using their experienceand creativity to develop process improvement ideas. When employees have contributedto a process change, they have a sense of ownership and will likely support the change.
Implementation ToolsMany tools are available to help manage implementation projects. Process mapping,described previously, is perhaps the most critical. For an ERP implementation to gosmoothly and provide value, it is critical that a company understand both its current pro-cesses and the state of the process after implementation.
SAP provides Solution Manager, a tool that helps companies manage the implementa-tion of SAP ERP. In Solution Manager, the ERP implementation project is presented in afive-phase Implementation Roadmap. The five phases are:
1. Project Preparation (15 to 20 days)2. Business Blueprint (25 to 40 days)3. Realization (55 to 80 days)4. Final Preparation (35 to 55 days)5. Go Live and Support (20 to 24 days)
Figure 7-17 shows an example of this roadmap. The left side of the Solution Managerscreen shows a hierarchical menu structure that organizes each step in the process, andon the right side of the screen are the detailed items and explanations for one step.
Solution Manager has tools to support each phase in the roadmap, including docu-ments, reports, white papers, and planning tools. The first phase of the ImplementationRoadmap is Project Preparation. Some of the tasks in Project Preparation include orga-nizing the technical team, defining the system landscape (including servers and network),selecting the hardware and database vendors, and, most importantly, defining the project’s
Process Modeling, Process Improvement, and ERP Implementation
201

scope—what the project is to accomplish. A common problem in ERP implementations isscope creep, which is the unplanned expansion of the project’s goals and objectives. Scopecreep causes the project to go over time and over budget, and increases the risk of an unsuc-cessful implementation. Defining the project’s scope ahead of time helps prevent thisproblem.
The second phase, the Business Blueprint, produces detailed documentation of thebusiness process requirements of the company. The Business Blueprint provides a detaileddescription of how the company intends to run its business with the SAP ERP system. Pro-cess mapping is critical in the Business Blueprint phase. The Business Blueprint guidesconsultants and project team members in configuring the SAP ERP system (which occursin the third phase). During the Business Blueprint phase, technical team members deter-mine the method of data transfer from the firm’s existing computer systems (called legacysystems), which will either be replaced by the ERP system or will continue to function withthe ERP system through an interface.
In the Realization phase (the third phase), the project team members work with con-sultants to configure the ERP software in the development system. The team also devel-ops any necessary ABAP code or other tools (such as third-party software packages) andcreates the required connections to the legacy systems.
FIGURE 7-17 Implementation Roadmap in Solution Manager
Chapter 7
202

The fourth phase, Final Preparation, is critical to the success of the implementationproject. Tasks in this phase include:
● Testing the system throughput for critical business processes (determiningwhether it can handle the volume of transactions)
● Setting up the help desk where end-users can get support● Setting up operation of the Production (PROD) system and transferring data
from legacy systems● Conducting end-user training● Setting the Go Live date
When scope creep occurs in a project, it is commonly not discovered until well intothe Realization phase, when the team begins to miss deadlines, and the costs begin toexceed the budget. By the time the scope creep is discovered and its impact is under-stood, there is little management can do to correct the problem, as most of the time and bud-get have been spent. Management can choose to shorten or omit the Final Preparationphase, which means that testing of the system and training of employees are reduced oreliminated. Unfortunately, with reduced testing, errors in configuring the system are notdiscovered until it is put into use. Likewise, with reduced training, employees do not knowhow to use the system properly, which can create a complicated chain of problems, due tothe integrated nature of the system. Any cost savings gained by shortening the FinalPreparation phase are overshadowed by productivity losses and consulting fees in the GoLive and Support phase.
In the fifth and final phase, Go Live and Support, the company begins using the newERP system. Wise managers try to schedule the Go Live date for a period when the com-pany is least busy. Setting up a properly staffed help desk is critical for the success of theGo Live phase, because users have the most questions during the first few weeks of oper-ating with the new system. The SAP ERP project team members and consultants shouldbe scheduled to work the help desk during the first few weeks of the Go Live period.Although significant testing of the system and settings should have been done through-out the project, it is not possible to test all the settings and thoroughly evaluate the through-put of the system. Therefore, monitoring of the system is critical so that changes can bemade quickly if the performance of the system is not satisfactory. Finally, it is important toset a date at which the project will be complete. Any enhancements or extensions to thesystem should be managed as separate projects, not as extensions of the original implemen-tation project.
Process Modeling, Process Improvement, and ERP Implementation
203
A N O T H E R L O O K
Training Challenges
In 2007, Kimberly-Clark, the $17 billion maker of disposable diapers, tissues, and toiletpaper, completed a $100 million implementation of SAP in 32 manufacturing mills in NorthAmerica. Installing the software for the business processes of requisition to check,accounting to reporting, plant maintenance, and materials management was enough of achallenge. But the real test came in the training of Kimberly-Clark’s employees. It cost thecompany $17 million to train all of the 16,000 employees in the affected facilities. Most ofthe employees being trained were mill workers, some of whom had never used a computer.So basic skills like how to use a mouse were required in the training sessions.
Most of the mill jobs are not high-tech positions, so it may seem strange that installa-tion of the SAP system has changed the way mill workers do their jobs. For example, ifa part on a machine breaks down, the mill worker used to call the parts department toreport the broken piece. The worker in the parts department would take the informa-tion down on paper. Now, the mill worker reports a broken part on the SAP system. Man-agement can now track which parts are breaking down and how quickly they are beingfixed, and can compare those data to those of other mills.
Kimberly-Clark is also tracking usage of the SAP system and spotting troublesomeareas, using specialized technology called “IT end user experience monitoring software.”Kimberly-Clark uses Knoa Experience and Performance Manager for SAP, which helps thecompany understand how users interact with the system. The Knoa software will send analert if the system is slow in one area, which can indicate that users are having troublewith this area. By issuing reference cards to help employees with one trouble spot,Kimberly-Clark saved $395,000 on additional training. Through this software, Kimberly-Clark can ascertain whether the problem is user-based or system-based. ForresterResearch predicted that the market for this type of software would grow 20 percent bythe end of 2007 to $138 million.
Kimberly-Clark is planning to implement more modules in the SAP system in 2008.
Question:
1. Research IT end user experience monitoring software and report on the detailsof this software.
System Landscape ConceptSAP recommends a system landscape for implementation, like the one shown in Figure 7-18.In this system landscape, there are three completely separate SAP systems, designated asDevelopment (DEV), Quality Assurance (QAS), and Production (PROD). The Development(DEV) system is used to develop configuration settings for the system, as well as specialenhancements using ABAP code. These changes are automatically recorded in the transportdirectory, which is a special data file location on the DEV server. These changes areimported into the QAS system, where they are tested to make sure that they function properly.If any corrections are needed, they are made in the DEV system and transported to the QASsystem. Once the configuration settings and ABAP programs pass testing in the QAS system,
Chapter 7
204
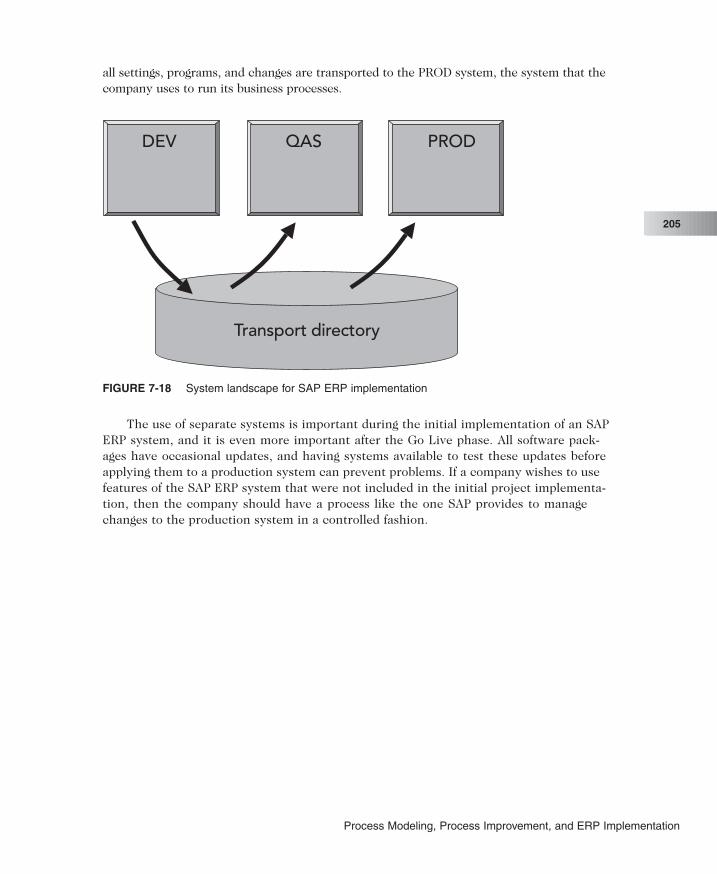
all settings, programs, and changes are transported to the PROD system, the system that thecompany uses to run its business processes.
The use of separate systems is important during the initial implementation of an SAPERP system, and it is even more important after the Go Live phase. All software pack-ages have occasional updates, and having systems available to test these updates beforeapplying them to a production system can prevent problems. If a company wishes to usefeatures of the SAP ERP system that were not included in the initial project implementa-tion, then the company should have a process like the one SAP provides to managechanges to the production system in a controlled fashion.
Transport directory
QAS PRODDEV
FIGURE 7-18 System landscape for SAP ERP implementation
Process Modeling, Process Improvement, and ERP Implementation
205

Chapter Summary
● The concept of business processes has been an important theme throughout this book.ERP systems are designed to provide the information, analysis tools, and communica-tion abilities to support efficient and effective business processes. This chapter intro-duced process modeling as a fundamental tool in understanding and analyzing businessprocesses.
● Process mapping is one process-modeling tool that uses graphical symbols to docu-ment business processes. Other methodologies include hierarchical modeling, deploy-ment flowcharting, event process chain diagramming, value analysis, and businessprocess improvement. SAP’s Solution Manager, a set of tools and information that canbe used to guide an implementation project, is included in SAP ERP to help manage theimplementation of the ERP software.
● SAP’s system landscape was introduced to show how changes to the ERP system dur-ing implementation (and beyond) are managed.
● Most challenges to ERP implementation involve managing personnel and their reac-tions to the change, rather than managing technical issues.
Key Terms
Business process innovation (BPI)
Business process reengineering
Continuous improvement
Deployment flowcharting (swimlaneflowcharting)
Development (DEV) system
Dynamic process modeling
Event process chain (EPC)
Flowchart
Gap analysis
Hierarchical modeling
Organizational change management (OCM)
Process boundary
Process mapping
Process model
Production (PROD) system
Quality Assurance (QAS) system
Quality circles
Scope creep
Transport directory
Value added
Value analysis
Workflow
Workflow tasks
Exercises
1. Develop a process map for the process a professor must follow to prepare a multimedia pre-sentation of a concept for students. Developing a multimedia presentation can require vari-ous steps:
a. First, if the concept is not abstract, then it may be possible to record the subject.
b. If you have access to the subject of your multimedia presentation, then you shouldrecord audio, video, or graphic images, as appropriate.
c. If your concept is abstract or you do not have access to it, then you should search to seeif someone has already created media that illustrate the concept sufficiently for your use.
Chapter 7
206

d. If an alternate source does not exist, you must create drawings, animations, or simula-tions of the concept.
e. If you find existing material, you have to obtain copyright clearance, unless it is in thepublic domain or your use is covered by the Fair Use Guidelines (check with yourinstructor on this).
f. If the media are not in digital form, you must digitize them before distribution to students.
2. Develop a process map for the process of handling food shipments at a FoodMoreGrocery Store:
● If a truck that contains perishable items (such as dairy, meat, or produce) arrives at aFoodMore store, the temperature of the truck has to be checked to ensure that the itemswere transported properly. Each product category has a product data sheet that definesthe acceptable temperature range for the truck. If the truck is not in the proper tem-perature range for the product category, then all items of that category are rejected. Morethan one product category may be on a truck if the temperature ranges for the prod-ucts are compatible.
● As cases are removed from the truck, they are checked for damage. Damaged casesare rejected. The expiration dates are checked against the date information on the prod-uct data sheets to make sure each case will have an acceptable minimum shelf life. Ifa case has an unacceptable expiration date, then the case is rejected.
● Differing processing steps are followed for all accepted cases, depending on whetherthey are perishable. Once a case of perishable food is accepted, it is moved immedi-ately to the cooler to await further processing. Some products, like beef, pork, wholechicken, and cheese, are bought in bulk and must be cut and packaged before beingput on the shelves. The processing procedures are defined in the product data sheets foreach food. Bulk foods are processed on an as-needed basis, and a stock clerk takes theprocessed packages to the appropriate location in the store immediately after they areprocessed and packaged. The stock clerk also provides one last check of package integ-rity before placing the items on the shelves and display cases. If the package is dam-aged, the item is discarded.
● If an item is not perishable, it is placed in the storeroom and then moved onto a storeshelf when the number of items on the shelves gets low. The stock clerks also check thepackage integrity of the nonperishable items before placing them on the shelves, look-ing for damage such as dents in cans. Depending on the level of damage, dented cansmay be marked down in price and placed on the shelves in a special reduced-price area.The clerks might discard the items if the damage is too great.
● Once items are on the store shelves, they must be monitored periodically to make surethat the expiration dates have not passed. If an item is getting close to its expiration date,the price may be marked down for quick sale. If the expiration date has passed, the itemmust be discarded.
Process Modeling, Process Improvement, and ERP Implementation
207

3. Develop a process map for the following process, which describes the sales process forDaisy Scout cookies. The cookies generate income for individual scout troops and for theregional scout council. Use a deployment (swimlane) format. Can you suggest any changesto improve the process?
● The Daisy Scout troop leader for each troop receives the order forms from the local DaisyScout council office. The leader distributes the order forms to the girls at the beginningof the cookie campaign. The girls go out and book cookie orders during the first orderperiod. If a scout completes the entire form, she can turn it in to the troop leader and getanother form. At the end of the first order period, the scout leader collects all the cookieorder forms, makes copies, and gives the forms to the “cookie mom” (a volunteer whomanages the cookie orders for the scouts). The cookie mom tabulates all of the ordersand then delivers a consolidated order form to the Daisy Scout council cookiecoordinator.The troop order must be for full cases (12 boxes per case).The troop’s ordersmight not total full cases, meaning that it will receive more cookies than the scouts sold.
● When the cookie manufacturer delivers the cookies to the Daisy Scout council office, thecouncil contacts the cookie mom, and she picks up the cookie order from the counciloffice, checking the delivered quantity against the order.The cookie mom takes the orderhome and then breaks the cases down into groups for the individual orders. She deliv-ers these orders to the girls at their next meeting. The girls deliver the cookies to thecustomers, collecting $3 for each box.The girls return the money to the Daisy Scout troopleader, who passes it on to the cookie mom. The cookie mom deposits a portion of themoney in the troop’s account and deposits the council’s portion in the council bankaccount. This process must be documented at the bank and all receipts turned in to thecouncil before more cookies can be ordered. The portion of the sales revenue that thetroop keeps depends on the sales level. Normally they collect $0.50 per box, but if thetroop sells an average of 100 boxes per Daisy Scout, they collect $0.55 per box. Thecouncil also gets a percentage of the proceeds to support their operations.The troop canplace a second order with the council coordinator if they deposit by the required date atleast 50 percent of the money they collected from their first sales effort.
● The second order also has to be for case quantities, and the excess boxes from the firstorder must be considered. To avoid buying an entire case of cookies to get one or twoboxes needed for the orders, the cookie mom can deal with cookie moms from othertroops to buy excess boxes of cookies (although this practice is discouraged by thecouncil office). When buying a box of cookies from another cookie mom, the moms haveto agree on which troop gets to keep the profits. This cookie dealing can be reduced ifthe troop decides to have a direct sales effort. For example, they might set up a table atthe local grocery store and sell boxes of cookies for cash. If the troop wants to do this,they have to get approval from the council office. The council office assigns the sell-ing locations, so the troops should do this early in the process, to get their choice oflocation. If her troop is holding a direct sales event, then the cookie mom can dispose ofany excess boxes from her own troop’s orders, although she may choose to help outother cookie moms by selling boxes to cover some of their orders (again, the sales pricehas to be determined).
● Once all the money from the second round of orders and the direct sales is collected,the cookie mom needs to deposit the money in the troop and council accounts. She must
Chapter 7
208
submit all paperwork to the council cookie coordinator by a given date. It is possible thatthe troop sold less than 100 boxes per girl in their first effort but achieved that goal withthe second order and direct selling. In that case, the troop gets to keep $0.55 for allboxes sold, and the deposit needs to be calculated accordingly. Any leftover boxes canbe used for snacks at the troop meetings, and are paid for with troop funds.
4. For the accounts payable process described below:
a. Develop a process map of the current process.
b. Analyze the value added by each step in the process. Determine whether the step addsreal value, business value, or no value.
c. Develop a process map for an improved process.
● The accounts payable process at Frizz Master Hair Product Manufacturer begins whenspecific departments ask to purchase certain products or equipment. The departmentmanager then approves the requests so that the buyers in the Purchasing departmentmay purchase the requested materials or products.
● Once the necessary product has been bought and the invoice has been generated,an invoice for payment is sent to the Accounts Payable (A/P) department. The A/Ptasks are divided between two people. One person handles invoices for companieswith names that start with the letters A through M, while the other person handlesinvoices for companies with names that begin with N through Z. As each A/P workeropens the invoices, he or she sorts them according to the department responsiblefor the payment. All invoices that involve overhead (and therefore do not get directedto a specific department), such as utility and shipping invoices, are coded by the A/Pclerk and entered into the accounting system for payment. All other invoices aresent by intercompany mail to their respective departments. Invoices for amountsunder $1,000 are directed to the person who requested the purchase, while invoicesover $1,000 are sent directly to the manager in charge of the specific departmentwhere the request originated. Once the originator or manager approves the invoice,it is sent back to the A/P clerk, who enters it into the accounting system.
● The A/P clerk selects all approved invoices that have been entered into the account-ing system and prints them as a list for the accounting manager, who marks the listto show which invoices are to be paid during the current check cycle. The account-ing manager gives the annotated invoice list back to the A/P clerk, who reports to thestaff accountant to retrieve a special disk that allows access to the check-printingsystem. The disk must be kept under lock and key, which is the responsibility of thestaff accountant. The A/P clerk uses the disk to connect to the check-printing sys-tem and print checks to be immediately mailed to the vendors, along with the corre-sponding invoices. The A/P clerk must keep written records of the check numbersand the amount of each check that is printed and mailed. Finally, the account man-ager double-checks for errors and signs off on the check number and dollar amountof each check, after each check run.
5. Develop an EPC diagram for the following Human Resources process:
a. The current recruitment process for Yellow Brook Photography takes approximately90 days. It begins when a manager has a need for a position. The manager must com-plete a requisition and send it to the Human Resources (HR) department. HR reviews
Process Modeling, Process Improvement, and ERP Implementation
209
and assigns a number to the requisition, and returns it to the manager for approval. Heapproves it, obtains the appropriate signatures, and then returns it to HR.
b. Next, HR creates a job posting and announces the position internally, first through thecompany’s intranet, bulletin boards, or a binder of current job openings. HR collectsresponses for eight days. HR also solicits resumes from external sources by advertising.HR prescreens resumes and forwards data on qualified candidates to the hiring man-ager for review. The hiring manager notifies HR of candidates to interview. She alsoconducts phone screens; if the phone screen is promising, HR coordinates and sched-ules an on-site interview. Candidates interview with the hiring manager and with HR.HR records the interviews in an applicant flow log.
c. Once a candidate is selected for hire, HR and the hiring manager prepare an offer, andthe background check is initiated. The hiring manager then must approve the offer andobtain the required signatures on an internal associate data/change form. Subse-quently, she must extend the offer verbally to the candidate, while HR sends the writ-ten offer, including a start date for work. Once the applicant accepts the offer, a drugscreening is scheduled with the candidate, who must also sign the offer letter and returnit to HR. HR notifies the hiring manager of the candidate’s acceptance. Finally, if thedrug test comes back negative, the new employee completes “new-hire” orientation onthe date hired.
For Further Study and Research
Cordes, Ronald M. “Flowcharting: An Essential Tool.” Quality Digest, January 1998.Cowley, Stacy. “Update: Oracle laying off 5,000.” Computerworld, January 14, 2005.Hammer, Michael, and James Champy. Reengineering the Corporation: A Manifesto for
Business Revolution. HarperCollins. 1993.Harrington, H. James. Business Process Improvement: The Breakthrough Strategy for Total
Quality, Productivity, and Competitiveness. New York: McGraw-Hill, April 1991.MacIver, Kenny. “ERP roulette.” Information Age, July 11, 2007. http://www.information-age.com/
article/2006/february/erp_roulette.
Chapter 7
210

C H A P T E R 8ERP AND ELECTRONICCOMMERCE
L E A R N I N G O B J E C T I V E S
After completing this chapter, you will be able to:
● Describe business-to-business e-commerce.
● Explain the importance of ERP to the success of a company engagedin e-commerce.
● Describe the function of an application service provider (ASP).
● Describe the delivery of ERP services through an ASP.
● Describe Web services and SAP’s NetWeaver.
● Describe the unique components of NetWeaver.
● Explain why accessing an ERP system through a Web browser isefficient.
● Define XML and its significance to ERP.
● Define RFID and its future role in logistics and sales.
I N T R O D U C T I O N
This chapter examines connectivity topics relevant to Enterprise Resource Planning (ERP) systems. As
you have read, an ERP system lets a company accomplish things that cannot be done well, if at all, without
such a system. In this chapter, you’ll learn how effectively competing in high-volume e-commerce may be
impossible without the infrastructure provided by ERP.You will further learn how companies can integrate
ERP systems with the Internet and “rent” ERP software from special-purpose software companies. This
chapter also explains the basic components of Web services, with a focus on NetWeaver, SAP’s Web
services platform.You will find out why XML is becoming the new markup language of the Internet and how

ERP companies are using it. Finally, you will read about radio frequency identification (RFID) devices
and their significance to managing the movement of goods in the supply chain.
E L E C T R O N I C C O M M E R C E B A C K G R O U N D
Today, most companies conduct at least part of their business operations through elec-tronic commerce, more commonly known as e-commerce. As you learned in Chapter 2,e-commerce is the conduct of business over the Internet. When people think ofe-commerce, they often think of retail e-commerce, typified by companies such asAmazon.com. Most of the business growth on the Internet, however, has been in the areaof business-to-business (B2B) e-commerce, rather than in retail business-to-consumer(B2C) e-commerce.
Business-to-Business E-CommerceBusiness-to-business e-commerce is defined as buying and selling between two companiesover the Internet. The companies might be manufacturers, suppliers, wholesalers, orretailers.
Business-to-business e-commerce is transforming the way companies work with eachother. For example, industry-specific online auctions allow companies to buy raw mate-rials at the lowest possible cost. Say a food company’s purchasing manager wants to buyhoney. She can go to an auction site—either for the food industry or a general“wholesale/retail only” auction site—and get competitive bids simply by posting the requestrather than requesting competitive bids from each supplier independently by e-mail or fax.
Electronic Data Interchange (EDI)
B2B e-commerce is not new. Prior to the development of the Internet, companies electroni-cally transferred purchase orders through a system known as electronic data inter-change (EDI). Recall from Chapter 2 that EDI is an electronic computer-to-computertransfer of standard business documents. Companies have been doing EDI since the1960s and originally used telephone lines to transfer data.
Companies can set up their own private EDI networks to communicate directly withtheir suppliers’ systems. EDI networks are very expensive, so many companies subscribe toa value-added network (VAN), an intermediary Internet-based network run by an out-side EDI service provider. With EDI, when a company needs to order raw materials, it canplace the order electronically. EDI should not be confused with a simple e-mail messagebetween two parties that reads, “Dear Joe, please send us 500 gallons of honey.” In EDI, theorder is sent on a standardized business transaction form, following a specific computerprotocol.
The benefits of EDI are enormous:
● Costs of paper, printing, and postage have almost disappeared from orderingsystems.
● Errors have been minimized because orders are not manually entered into thesupplier’s information system.
Chapter 8
212
● Ordering is fast and efficient. As a result, large companies can force theirsmaller suppliers to use EDI, through a VAN if necessary. The supplier paysthe VAN’s fees, based on the amount of information sent and received.
● Suppliers and buyers are “locked” into business relationships: Once a com-pany sets up an EDI system with its supplier, changing suppliers becomes amajor inconvenience. Most buyers don’t change suppliers, hence locking in therelationship. This is an advantage for suppliers and buyers, as long as bothremain satisfied.
Internet-Based Procurement
Even though EDI has been useful, companies are moving from EDI to Internet-basedprocurement, which is the use of Internet technologies for procurement activities (recallthat procurement is the buying of raw materials for manufacture, or purchase of fin-ished goods for resale). Internet-based procurement provides the following benefits:
● It is less expensive to use the Internet than private EDI networks.● Purchasing costs are further reduced as suppliers compete for orders on the
buyer’s Web site.
Locking in suppliers often does not occur in Internet-based procurement. Buyers tendto ignore suppliers who cannot compete on price, instead focusing on relationships withviable suppliers. Smaller companies now can get a share of the market by connecting elec-tronically with larger customers. Vetco International, Inc., a small supplier of equipmentin the petroleum industry, can count giants such as Exxon Mobil Corp. and BritishPetroleum PLC as customers because the petroleum companies link their product cata-logs electronically. Vetco spent about $150,000 in 2004 to implement SAP’s Business Onesuite, which allows the company to connect easily with its customers’ SAP ERP systems.
Buying and selling goods on the Internet has evolved into the concept of electronicmarketplaces. To understand this concept, think about how farmers’ markets work. Farm-ers, growers, and gardeners bring their produce to a central location in town, where cus-tomers can compare sellers’ goods on quality and cost. It is efficient for both buyers andsellers. Being grouped together, sellers gain access to more customers than they would ontheir own. Customers can shop for a variety of items in one place, making it easier to findthe best quality at the lowest cost.
An electronic marketplace is a gathering place for buyers and sellers on the Internet.It can be run with or without a central operator. Marketplaces without central operatorsare simply lists of Web sites directing buyers to certain products. Marketplaces with cen-tral operators facilitate and expedite the buying and selling of goods. Businesses using thistype of marketplace may have to pay fees to join, and they usually pay fees to use themarketplace. Exchanges are one type of B2B electronic marketplace. Exchanges typi-cally focus on a single industry.
Chemical buyers, sellers, and traders can find their products at the ChemConnectmarketplace, www.chemconnect.com. The Web site claims the following advantages:
● Buyers can find the best prices without traditional negotiations.● Faster contracts are completed between buyers and sellers.
ERP and Electronic Commerce
213
● Buyers and sellers can gain access to new worldwide markets and new trad-ing partners.
● Instant market information is available to all parties.
Members of the ChemConnect marketplace use the marketplace exchange to react tochanges in the often-volatile chemical market faster than they could using more tradi-tional methods of buying and selling. For example, Vanguard Petroleum Corporation placesbids and offers simultaneously on ChemConnect to multiple customers. About 15 per-cent of Vanguard’s spot purchases and sales of natural gas liquids are conducted on theChemConnect site. Vanguard can now publicize its offers to 150 potential partners inonly a few minutes; prior to its involvement with the exchange, it took an entire day to getthe information out to that many companies.
Another type of industry marketplace is the private exchange, where membership isrestricted to select participants. Private exchanges can be attractive to businesses becausethey are limited to trading partners with which the responsible party has an establishedrelationship. For example, IBM runs a private exchange for its customers and suppliers;IBM’s competitors are prohibited from participating in the exchange. Volkswagen hasslashed procurement costs by up to half through its use of a private exchange.
Internet Auctions and Reverse Auctions
As previously mentioned, B2B e-commerce allows companies to do online bidding throughauctions and reverse auctions. Reverse auctions feature one buyer and many sellers. Acompany can use a standard auction to put its products or even its obsolete equipment upfor bid, and at the same time use reverse auctions to request bids from suppliers for goodsor services.
For example, Fitter Snacker needs raw materials such as oats and wheat germ, whichfor FS are essentially commodities. Commodities are items that are widely available at astandard level of quality; the only thing that varies between one commodity and another isprice. The company can go to a “bidding” Web site—one that seeks bids from sellers ratherthan buyers—and set up a reverse auction program to run overnight. The program usesthe Internet to solicit bids to supply those raw materials. In the morning, FS’s purchasingagent can choose the lowest price bid for the oats and wheat germ.
Internet-based auctions are changing the way in which commodities are purchased.A few years ago, commodities would have been purchased through a supplier, or interme-diary, who negotiated prices of raw materials with sellers. Now, the Internet and its bid-ding programs have threatened the intermediary’s role and made the buying process moreefficient. In a sense, the Internet has replaced the intermediary. Pricing is open anddynamic, meaning that competitors can see each others’ bids (although they probably can’tsee who is making the bids). Epsilon Products Company, a producer of polypropylene, hasused a reverse auction on the ChemConnect marketplace to reduce its cost by 5 percent.
Dynamic pricing is not only forcing out intermediaries, it is also putting pressure onsellers to be flexible. This means that a seller’s accounting and logistics operations mustbe in excellent shape (requiring an ERP system) before it tries to sell in the auction mar-ket, as competition is based on price.
Chapter 8
214

Electronic Commerce Security
E-commerce brings with it a major concern: security. No company (or individual, or gov-ernment agency, for that matter) is immune to security breaches. In the past, large firmshave been shut down due to various types of systems attacks, including denial of serviceattacks. In denial of service (DoS) attacks, attackers block access to a Web-based ser-vice through a variety of means, including bombarding a site with so many messages thatthe site can’t handle the volume.
On February 6, 2007, a denial of service attack was launched against DNS servers, thecomputers that handle the domain name service of the Internet, in charge of Web pagenames. Six of the root servers were flooded with bogus queries at the rate of 1 GB persecond—roughly equivalent to 13,000 e-mails per second. E-commerce companies usevirus-scanning software, encryption, intrusion detection, and other measures to protecttheir networks, their Web sites, and the privacy of customer data.
E - C O M M E R C E A N D E R P
You might ask yourself, “What does e-commerce have to do with ERP?” The answer is thateach technology complements the other, and each is necessary for success. An offlinecompany cannot compete with companies offering similar goods and services if the com-petitors also provide the added convenience of doing business over the Internet. WithoutERP, a company cannot fill orders—either Web orders or traditional orders—expeditiously.Here’s why.
When a company receives an order through its Web site, the company should notmerely file or print orders for later handling. The orders should be efficiently fed into thecompany’s marketing, manufacturing, shipping, and accounting systems—a series of stepssometimes called back-office processing.
An efficient back-office operation is crucial for any company’s success. E-commerceoften exacerbates problems and reveals weaknesses in current back-office systems.Amazon.com invests its profits back into warehouses and other support that the com-pany needs to keep its back office in order, supporting its continued success. Some Web-only businesses are worried by the entry of massive retailers like Wal-Mart into their Webmarketplaces. Large companies already have well-established, integrated back-office anddistribution systems, which are typically more expensive to develop than e-commercesystems, giving the large retailers speed-to-market and financial advantages.
Some companies with unintegrated information systems have built Web sites beforecreating an integrated back-office system. As a result, those companies often can’t fill ordersin a timely fashion. Many e-commerce businesses suffered from a lack of integration dur-ing the 1999 holiday season. The online toy retailer eToys.com announced less than a weekbefore Christmas that it would not be able to fill all its Web orders. Surprisingly enough,all the toys were in the warehouse, but the company couldn’t organize basic warehousefunctions such as picking, packing, and shipping to get toys to consumers on time. Inte-grating the Internet front-office operation and the ERP back-office operation is fundamen-tal in today’s business environment.
ERP and Electronic Commerce
215

Fitter Snacker and E-CommerceFitter Snacker has traditionally sold its NRG bars through the sales force in either the DirectDivision or the Distributor Division. Now FS’s customers want to order directly from a Website. Currently, Fitter Snacker has neither a Web-based ordering system nor an ERPsystem. In the current annual-planning cycle, FS executives are looking at two IS invest-ment options: (1) implement a Web-based ordering system, or (2) implement an ERPpackage. Company executives would like to make both investments, but they are reluc-tant to make two large investments in one year because of the cost and disruptive natureof the implementation efforts. Implementing an ERP system would improve its businessprocesses, but the company is experiencing significant customer pressure for Web-siteordering.
Suppose FS executives succumb to customer pressure and implement a secure Website, allowing customers to place orders online. FS does not know exactly what percent-age of customers would use the system (although if FS already had an ERP system, thatdata would be readily available). To promote sales and be competitive with other online mer-chants, the company promises delivery from Web site orders in five working days, whichseems reasonable, based on FS’s past performance.
After the Web site’s implementation, orders come in more frequently, which is good—it means that business is thriving. However, orders now have shorter lead times because,without an ERP system, Internet orders are saved to a text file, printed, and then manu-ally transferred into the order entry system described in Chapter 3. The order is thenhandled using the warehouse procedures discussed in Chapters 3 and 4. The increase inorders is putting a strain on the company’s back-office operations.
A customer who orders NRG bars from the Web site thinks he will be receiving the barswithin five business days, as stated on the company’s Web site. After 24 hours have elapsed,however, the customer receives an e-mail advising him that the NRG bars are out of stockand will not be available for at least one week, maybe two. The company’s unintegratedinformation system, barely adequate for personal and phone-based ordering, is simplytoo cumbersome to handle the Internet orders. With e-commerce, customers haveincreased service expectations, and FS’s unintegrated system cannot meet thoseexpectations.
Now consider an alternate scenario. If Fitter Snacker implemented an ERP system first,and later connected it to a Web-based ordering system, Internet orders could flow directlyinto the ERP system. As customers placed orders through the Web system, the ERP sys-tem could provide accurate delivery date quotes. With this information, customers couldmake an informed choice and would be more satisfied. For FS, accurate and timely orderdata would support more effective production planning. And of course this discussiondoesn’t begin to address all the other ERP-related benefits that FS would enjoy.
Recent studies on back-office systems concluded that an attractive Web site does notprovide enough benefit on its own for an e-commerce business to stay afloat. The con-ventional back-office systems must be in place and operating correctly for the business toflourish. As with any kind of business, effective infrastructure is key for e-commercesuccess.
Chapter 8
216
Exercise 8.1
1. Assume you are opening a small business to sell a product that interests you.Some ideas might be clothing for your favorite sport or some new toys for yourdog. Also assume that you only will have an Internet presence with thisbusiness—no physical store. What do you think is involved with setting up ane-commerce business? Use the Internet or interviews with people you knowwho have tried this. List the steps involved. Report your findings to the class.
2. Do you think customers’ expectations are different when ordering on the Webversus ordering in a traditional store? Use some of your own experiences andthose of your classmates to answer this question.
3. Assume Fitter Snacker implemented both an ERP system and a Web orderingsystem. Develop a process map of the steps needed to fill a Web order. SeeChapter 7 for details on process mapping. Be sure to include a description ofhow the ERP system interfaces with the Web page.
4. Develop a plan for an e-commerce business that sells concert gear such ast-shirts, hats, and pins. How will it establish a competitive advantage? Whatrole will back-office systems play?
U S I N G E R P T H R O U G H A N A P P L I C A T I O NS E R V I C E P R O V I D E R
Many companies today outsource some of their operations to an outside service provider,sometimes called a third party. In the next section, we will look at how outsourcing cansimplify the management of ERP systems.
Application Service ProvidersAn application service provider (ASP) is a company that provides management of appli-cations for a company over a network. Usually that network is the Internet. Companies canoutsource their e-mail software, accounting programs, or other programs to an ASP.
The ASP, not the company using the ASP’s services, owns the hardware and the rightsto the software; it also employs the workers who run the outsourced applications. The usersof the system, of course, are the company’s employees. Suppose an ASP were to run anERP package such as SAP ERP for Fitter Snacker. The ASP would own the rights to use theSAP software, as well as the server on which the SAP software runs. The ASP could also pro-vide consulting services for configuring the ERP system, so that Fitter Snacker would nothave to find its own ERP specialists. The ERP program would be delivered to FS workers overa network, probably the Internet. The ASP would charge a monthly or yearly fee, or it couldcharge a per-use fee for the system, based on the number of users at FS. Thus, an ASPcan provide ERP software with a much lower start-up cost, making it possible for smallercompanies to use ERP systems when they cannot afford the costs of installing and main-taining their own system. Figure 8-1 outlines the details of running an ERP systemin-house, versus using an ASP.
ERP and Electronic Commerce
217

Advantages of Using an ASP
Many companies find it advantageous to use an ASP for ERP and other information sys-tem applications. Some of the benefits include:
● Affordability: Companies that cannot afford their own ERP system can now“lease” one on a monthly basis, avoiding the high cost of obtaining the hard-ware and software and hiring and training support personnel. ASP servicescan be received through the Internet, using either a Web browser or the ERPsystem’s graphical user interface (GUI) software.
● Shorter implementation time: The time needed for ERP implementation isshorter for those who implement ERP through an ASP. An ASP should haveexperience with implementing and maintaining ERP software. (If it does not,the company should find another ASP.) ASPs have servers, telecommunica-tions, and highly trained personnel already in place.
● Expertise: ASPs are experts in delivering IS applications. They do all the main-tenance, including execution of backups, training, and customizing of thesystem. Customers of ASPs do not need to hire additional IT personnel. ASPscan also run information systems more efficiently because they do it on alarge scale. ASPs can spread fixed costs over many users, thus achieving econo-mies of scale that might translate into a lower total cost of ownership. The
Fitter Snacker Application Service Provider Users Servers
Maintenance Training Implementation
Fitter Snacker Users Servers Maintenance Training Implementation
Fitter Snacker in-house ERP
Fitter Snacker ASP ERP
FIGURE 8-1 ERP responsibilities in-house versus with an ASP
Chapter 8
218

availability of IT talent is tight in the current market; an ASP might have a bet-ter chance of attracting and retaining a talented workforce than a small manu-facturing company like Fitter Snacker.
Disadvantages of Using an ASP
There are some potential problems with using an ASP:
● Security: Companies using ASPs are turning their information systems overto a third party. They must be confident that the ASP has a high level ofsecurity. How hardware will be shared is also a security concern. The ASP willhave multiple users on a single piece of hardware. Each customer’s data mustbe shielded from other customers. While these are valid concerns, ASPsoften have better security than a small company can have on its own.
● Bandwidth/response time: The telecommunications channel from the ASP toits customers must be fast enough to handle multiple users. An ASP’s serversmust be sufficient in terms of processing capabilities.
● Flexibility: An ASP should be flexible in working with its users and satisfyingtheir requests for processing modifications.
● No frills: An ASP can usually provide basic ERP systems well, but asking forunusual configurations may cause problems, and an ASP might not allow forthird-party add-ons. Further, the ASP might not want to do custom softwaredevelopment using the SAP ERP programming language, ABAP.
● Technical, not business focus: An ASP knows the technical aspects of the soft-ware, but it will need the customer to define the business processes and makethe configuration decisions.
A N O T H E R L O O K
Using ERP Through an Application Service Provider
SAP software is run at over 400 universities as part of SAP’s University Alliance. The Univer-sity Alliance program grants access to SAP’s ERP software for classroom use. At the time theUniversity of Delaware began its University Alliance program, in the 1990s, each universitywas required to purchase its own server (which at the time could cost upwards of $50,000)and had to train its own system administrators. With over 100 universities in the Alliance,managing all of the systems became a significant problem for SAP. On the academic side,operating the system was a chore for the university’s systems administration personnelbecause managing the SAP system was usually an added duty on top of their normalresponsibilities. To address these problems, SAP’s University Alliance program developed itsown ASPs, which it termed University Competency Centers (UCC). Rather than havingevery university administer its own system, the Alliance has four universities serve as UCCsand host the other members of the University Alliance, meaning that the UCCs act as ASPsfor the other members. For SAP, the task of managing four UCCs is much easier than provid-ing support for hundreds of individual universities. Another benefit is that the UCCs have
continued
ERP and Electronic Commerce
219
worked together to develop unique competencies in administering systems for education—aspecialized task. All universities that use a UCC to host their systems gain from this increasedcompetency. If every university hosted its own system, it would be very difficult to share theknowledge developed at hundreds of universities.
For students, accessing an SAP system from a UCC seems no different from access-ing a system at their own university, except that the UCC system is usually much faster, andthe software is current and ready for use.
Questions:
1. What are the advantages for the University of Delaware of using an ASP for itsSAP delivery? Are there any disadvantages?
2. What are the challenges to a university of running a complicated program suchas SAP? Can you relate those challenges to small companies?
Other Considerations
As with all forms of outsourcing, companies considering an ASP should carefully scruti-nize the ASP’s contract to uncover hidden costs and potential problems before signing it.
ERP companies are excited about ASP capabilities because ERP vendors can provideASP services too. Such an offering translates to extra profit and a steady income. Prior todelivering software through an ASP, ERP software companies relied on a small number ofvery large sales to make their yearly profit. Now income is steadier because ERP ven-dors can deliver and support software on a monthly basis to customers of all sizes. Forexample, an ERP vendor might have high revenues one quarter from securing a few, largesales, but may follow that with lower revenues the next quarter if no large software deals arefinalized. Delivering software through an ASP, however, provides a steady monthly incomefrom lease payments.
SAP is offering an ASP version of its ERP product for midsized companies. In September2007, SAP introduced Business ByDesign, which is delivered to customers over the Web.At that time, pricing was set at $149 per month per user, and the product included appli-cations for financials, human resources, supply chain management, and customer rela-tionship management. Also available in a smaller package, Business ByDesign is availableto companies for $54 per month per five users. SAP hopes to increase its customer basewith the new product to 100,000 by 2010.
Exercise 8.2Let’s return to our example company, Fitter Snacker. Assume that under its newly appointedCIO, FS has made the decision to acquire an ERP system. Now the CIO must decide howto implement the system. After talking with the vendors of ERP software, the CIO real-izes that FS has two options for implementing ERP software:
1. Buy the rights to the ERP software and any new hardware required to run it,and also hire and train system administrators.
2. Run FS’s ERP system over the Web through an ASP, which would deliver ERPservices for a monthly fee.
Chapter 8
220
Both types of implementations have advantages and disadvantages, as you have alreadyseen. In this exercise, you must recommend one course of action to FS’s CIO. For the firstpart of this exercise, write a memo to the CIO enumerating the pros and cons of eachmethod. Use the table shown in Figure 8-2 to organize your thoughts.
After distributing your memo to various FS board members, the CIO needs to justifyhis decision. He would like a spreadsheet that analyzes the financial impact of bothscenarios. Your job is to compare the monthly cost of using the ASP with the cost of anin-house ERP system. Weigh the pros and cons of each method, and then make a recom-mendation to the chief financial officer of FS. Keep in mind that Fitter Snacker’s netincome is $3.4 million (you can find more details in Chapter 5). Here are the details of thedecision:
Option 1: Buying Computers and Software Rights
To set up its SAP system, FS must buy:
● Database server: The server would cost $70,000.● Application server: FS needs a server to run the ERP application, which would
cost about $40,000, since there aren’t any servers available for use in thesystem. (ERP software is platform-independent; therefore, it can be run on dif-ferent types of computers. Thus, a company can often use an existing server.)
● PCs: Some of FS’s existing PCs could be loaded with the ERP software’s GUIand be used to access the system. Because more FS employees will be con-nected to the new system, however, FS will need 10 additional computers. Totalcost for the PCs would be $15,000.
● Rights: Rights to the ERP software for all users for five years would cost$500,000. The CIO does not know whether further outlays will be requiredafter the fifth year, and therefore is limiting the analysis to the years 2008through 2012.
● Installation: The ERP vendor will help install the system, but FS also needsto hire consultants for the six-month implementation. At $3,000 per day, thecost is estimated at $486,000.
● User training: With the purchase of the rights to the ERP software, FS employ-ees receive training at a local training center. This training is for key person-nel involved in the ERP implementation project. FS wants further training,
Advantages of purchasing softwareand computers for ERP
Advantages of using an ASP to run ERP
FIGURE 8-2 Arguments for purchasing software versus using an ASP
ERP and Electronic Commerce
221

however, for FS-specific business practices. The additional training will cost$2,000 per day for two weeks. This includes a training consultant to run classesat FS headquarters. With travel and lodging, the total cost is $23,000.
● Ongoing consulting: Once the system is up and running, FS will need to payfor consultants to help maintain the system. FS estimates that if it budgets forconsultants to come in once a month for $3,000 a day, it should be able tohave all employees’ questions answered. The total yearly cost of additional con-sulting is $36,000.
● Computer maintenance: FS needs to make sure all PCs and servers runproperly. To do this, FS would purchase a maintenance contract to cover allhardware. This contract costs about $1,000 a month, or $12,000 yearly.
● Network and database administrator: FS would need a full-time network anddatabase administrator to run the system. Salary, including benefits, for askilled person is $200,000 per year.
Option 2: Using ERP Through an Application Service Provider
The other option is to use an ASP to deliver ERP software. Estimated costs for this optionare as follows:
● PCs: FS still estimates that it must purchase 10 new PCs because many moreusers will now be accessing the computer system. Each PC costs $1,500, fora total of $15,000.
● Maintenance on PCs: The maintenance contract on all the PCs at FS costs$600 per month, or $7,200 yearly.
● Software through the ASP: The monthly cost of delivering ERP software to FSover the Web is $33,333, or $400,000 yearly.
● Training: Training of FS employees is provided by the ASP as part of themonthly software fee.
Make a recommendation to FS. Which option should FS choose—purchase the SAPsoftware and computers outright, or use an ASP? Set up a spreadsheet that will add allthe costs of each option. In each scenario, you must deal with the net present value (NPV)of money.
NPV is a way to figure out whether an investment is profitable, or in this case, to com-pare outlay of funds from one method to another. NPV can be calculated over a number ofyears; in our case, we need a five-year outlay of funds for the ERP project. The syntaxof NPV is =NPV (hurdle rate percentage, range of values) in an Excel spreadsheet. The val-ues in the range can be positive or negative numbers. In our case, they are all outflows, butwe can work with them as positive numbers. The hurdle rate is the rate of discount overthe period. The hurdle rate is the minimum acceptable rate of return on a project that acompany will accept.
Your spreadsheet should begin like the one shown in Figure 8-3 (with years continu-ing through 2012). Assume payments are made throughout the year, as opposed to lumpsums at the beginning of the year.
Chapter 8
222
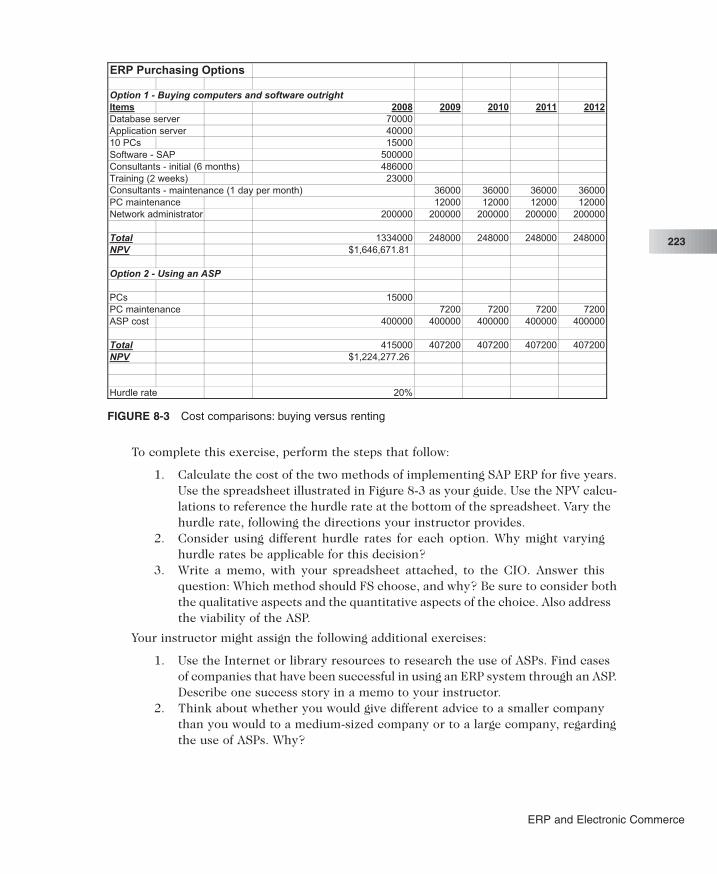
To complete this exercise, perform the steps that follow:
1. Calculate the cost of the two methods of implementing SAP ERP for five years.Use the spreadsheet illustrated in Figure 8-3 as your guide. Use the NPV calcu-lations to reference the hurdle rate at the bottom of the spreadsheet. Vary thehurdle rate, following the directions your instructor provides.
2. Consider using different hurdle rates for each option. Why might varyinghurdle rates be applicable for this decision?
3. Write a memo, with your spreadsheet attached, to the CIO. Answer thisquestion: Which method should FS choose, and why? Be sure to consider boththe qualitative aspects and the quantitative aspects of the choice. Also addressthe viability of the ASP.
Your instructor might assign the following additional exercises:
1. Use the Internet or library resources to research the use of ASPs. Find casesof companies that have been successful in using an ERP system through an ASP.Describe one success story in a memo to your instructor.
2. Think about whether you would give different advice to a smaller companythan you would to a medium-sized company or to a large company, regardingthe use of ASPs. Why?
FIGURE 8-3 Cost comparisons: buying versus renting
ERP and Electronic Commerce
223
N E T W E A V E R
E-commerce is driving companies to connect their business applications, such as ERP, tothe Internet to provide data sharing between companies. The combination of software toolsthat lets various programs within an organization communicate with other applications iscalled Web services. Whereas an application service provider (ASP) delivers softwareover the Web, Web services connect various software applications over the Web. Not sur-prisingly, ERP companies are trying to stake out their territory in this new and lucrativefield. SAP has invested a lot of time, money, and energy into its Web services platform,NetWeaver. NetWeaver, like other Web services products, allows various vendor applica-tions to share data.
Companies are warming to the idea of Web services, also known as SOA, or service-oriented architecture. Information Age’s Effective IT research report has found that 50 per-cent of enterprises have some sort of SOA strategy. One benefit of adopting SOA is theability to add new applications, quickly making the organization more responsive. SOA alsorelies on open standards, allowing easier integration of software and offering the poten-tial to reuse computer code, which would reduce the time and cost of implementing newsystems. This aspect of SOA is certainly enticing, compared with traditional systems thatare often cumbersome and time-consuming to implement. However, implementing SOA isnot easy. The IT analyst group Ovum reports that one in five U.S. companies implement-ing SOA have experienced “unexpected complexity.”
The return on an SOA investment is often difficult to determine. According to a studypublished by Nucleus Research, only 37 percent of 106 organizations polled claimed thattheir SOA projects had a positive ROI. Respondents indicated that the main benefit ofSOA was the ability to reuse computer code.
NetWeaver Tools and CapabilitiesSAP’s NetWeaver is a collection of components that support business transactions over theInternet. Included are modules named Enterprise Portal, Mobile Infrastructure, BusinessIntelligence, Master Data Management, and Exchange Infrastructure.
The Enterprise Portal also goes by the name mySAP.com. It gives users complete access,or a portal, to all their work on a single screen, using links to all major aspects of their jobs.A portal is a customizable Web site that serves as a home base from which users navi-gate the Web. The Enterprise Portal acts as a central access point to a company’s intra-net, operating through a secure link on a browser. For example, a user in the Financedepartment could set up Enterprise Portal with links to SAP ERP financial transactions,as well as links to financial metrics for the company, stock market indices, e-mail, a calen-dar, and other information important for that person’s job.
The advantage of having a personalized portal is its efficiency. A user only has to logon to one system to get all the information needed to perform a job. Without a portal, usersoften have to log on to multiple systems, such as an ERP system, industry exchanges, orsuppliers’ sites. Transferring information between systems is frequently difficult. With theEnterprise Portal, all information is available through the Web services provided byNetWeaver. All the important links are presented in one screen, and transferring data is sim-plified by the ability to “drag-and-relate” data from one area to another.
Chapter 8
224

Mobile Infrastructure is another module of NetWeaver. It allows users to access andwork with data through mobile devices such as PDAs, cell phones, and pagers. Mobile Infra-structure provides remote access to data within the SAP system and other data con-tained within a company’s information system. The benefits are obvious. A salespersoncould use her PDA to see a customer’s historical order information while in the middleof a sales visit at the customer’s office. Connecting SAP and VoiceObjects AG adds voicecapability to NetWeaver, allowing users to enter data to the SAP CRM system using voicecommands from their cell phones. Linking the SAP and VoiceObjects AG systems can bedone without middleware or any changes to the software.
Another facet of NetWeaver is Business Intelligence (BI), which incorporates a datawarehouse and data mining tools. BI can be delivered in a personalized manner with Enter-prise Portal. It integrates information from various sources and processes, both within andoutside of the firm. BI works with any database management software and any operat-ing system that is running NetWeaver. Datamonitor predicts that the market for businessintelligence software will double by 2012, reaching $8 billion in revenue. In 2007, SAPacquired Business Objects, and Oracle acquired Hyperion; the bought-out firms are bothproviders of BI software.
A N O T H E R L O O K
BI at Rohm and Haas
Rohm and Haas, a specialty chemicals company, employs over 16,000 people in 100 dif-ferent locations in 27 different countries. The company expanded rapidly from 1998 to2006, almost doubling in size through 45 acquisitions and divestitures. At that point, thecompany had 300 different IT systems and was generating 600 different reports. The com-pany sorely needed Business Intelligence to get the reporting situation under control.
Rohm and Haas had begun an SAP implementation. The company developed a datawarehouse that now generates BI reports. Previously, employees downloaded data into aspreadsheet to produce reports for upper management. Now employees prepare the samereports using dashboards, consolidated interfaces providing quick access to various soft-ware components. Employees access the dashboards through NetWeaver.
Rohm and Haas developed key performance indicators (KPIs) to incorporate withinthe dashboards. KPIs measure the state of the organization. For example, a gross profit KPIis one indicator of success. With the new dashboard system, a manager looking at thegross profit KPI can drill down to further levels of detail behind problems and opportunities.
Rohm and Haas is using three dashboards: a financial-based KPI dashboard forexecutives; a sales, standard gross profit, and volume KPI-oriented dashboard called thePulse, which is for a wider range of users; and the Reporting and Analysis Toolkit. ThePulse is the most heavily used of the three dashboards because of its ability to comparedaily sales to the month-to-date sales and compare both daily and month-to-date sales tobudgeted sales. Users can also view these data broken down by business. Figure 8-4 showssome of the reports available through the executive dashboard.
continued
ERP and Electronic Commerce
225

The success of the system is in its usage. The dashboard system is used by4,100 employees, including Rohm and Hass CEO and president Raj Gupta, who uses itevery day. The dashboards are allowing employees to be more proactive rather than reac-tive in their decision making.
Question:
1. Choose an industry that interests you, such as financial services. What are theKPIs for a company in that industry? How can those KPIs be measured?
Another NetWeaver feature, Master Data Management, provides data consistency withina company’s SAP system. For example, at Fitter Snacker, the two sales groups, Direct andWholesale, might have had different numbering systems for common customers. MasterData Management would ensure that the customer numbers are the same. The groceryindustry could save $25 billion to $50 billion if suppliers could synchronize their data, suchas product numbers, with retail outlets. NetWeaver allows this seamless Web interface toensure proper data synchronization.
NetWeaver’s Exchange Infrastructure allows different applications to share data. Byadhering to the standard of the Exchange Infrastructure, companies don’t have to write codeto enable different applications to transmit data. For example, using Exchange Infrastruc-ture, a business can keep its current EDI system and seamlessly integrate that with itsERP system. SAP’s Web Application Server, the development environment that is the foun-dation of NetWeaver, gives Exchange Infrastructure its customizability.
FIGURE 8-4 Rohm and Haas executive dashboard
Chapter 8
226
Many nonusers of NetWeaver are confused as to what it is. SAP admits that the con-cept of tying applications together is not easy to explain in a few sentences in a market-ing brochure. In response to this confusion, SAP has sponsored the SAP NetWeaver forDummies publication and is also providing information sessions for its customers aroundthe world.
NetWeaver at Work for Fitter SnackerNow we will examine how NetWeaver could help Fitter Snacker. Assume that the two topsalespeople, Amy Sanchez and Donald Brown, are busy selling NRG bars directly to cus-tomers and to distributors. Amy works from home. She logs on to the SAP system with herlaptop computer, using the SAP GUI. She doesn’t know much about the SAP system, nordoes she have to. She needs to know how to place customer orders and check on theirstatus. When Amy goes on a sales call, she brings her notepad and calculator with her to jotdown orders and quotes. When she returns home, she plugs those numbers into the SAPsystem and confirms her quotes. Amy would like to have some additional information onhow salespeople in other regions are doing and what mix of bars they are promoting, butshe doesn’t know how to access any of that information. She also would like to see if thereare new ways to market to her customers.
Donald Brown is also a salesperson, but he deals with distributors. He has been cho-sen to be a tester for the new NetWeaver SAP server. Every day, Donald comes into the officeand logs on to his Enterprise Portal, which was tailored for his job. He sees figures from histop 10 customers, data on production and inventory of bars, the current stock quote forFitter Snacker on the NASDAQ exchange, the current market price for oats, wheat germ,and honey, his e-mail, and the local weather report. Today, Donald will make an impor-tant sales call for a regional grocery chain. He grabs his wireless PDA and some extra busi-ness cards, and heads out the door. During lunch with the purchasing agent for the grocerychain, Donald is able to check up-to-the-minute details on current sales orders and canconfirm promises to ship additional bars next week, thanks to SAP’s Mobile Infrastructure.Back at the office, Donald calls up the Business Intelligence module in NetWeaver. Fromthere, he can run a few reports to find out which snack bars are currently selling betternationwide, grouped by region and time of year. He can also analyze snack bar sales usingdata mining, to find sales patterns that can help him plan future sales calls.
Exercise 8.3
1. After reading about the features of SAP’s NetWeaver and looking at how AmySanchez and Donald Brown perform their duties at Fitter Snacker, try to con-vince Fitter Snacker’s CEO to implement NetWeaver. Write a memo to theCEO outlining your arguments.
2. The CEO is impressed with your work but has asked you for an ROI (returnon investment) analysis. How do you begin doing that? What numbers do youneed, and who are the people you would have to interview to get thosenumbers?
ERP and Electronic Commerce
227
D U E T
Microsoft and SAP have been working on a software product, Duet, intended to let com-panies access SAP data and processes using the familiar Microsoft Office interface. The goalof the project is to expand and simplify the adoption of SAP ERP by making workers moreefficient. While the Duet product has numerous advantages, it also brings its ownchallenges. Companies must be using a relatively current version of SAP ERP, and must runMicrosoft server software as well. Some Duet features require the company to be usingother SAP products, such as NetWeaver and CRM.
A challenge for the Duet product is the growing competition between SAP and Microsoftin the ERP software market. Microsoft is moving its ERP software product, MicrosoftDynamics, to large companies while SAP continues to develop software products aimed atsmaller companies. This situation, in which the two software companies are cooperatingin some areas and competing fiercely in others, has been termed “co-opetition.” Some ana-lysts believe that the competitive-cooperative relationship will benefit customers by makeit easier for more users to access ERP data.
A C C E S S I N G E R P S Y S T E M S O V E R T H EI N T E R N E T
In addition to the standard GUI that is part of every ERP system, ERP vendors now offeraccess to their systems through a Web browser such as Microsoft Internet Explorer orNetscape Navigator. Users and systems administrators find it much more efficient toaccess their ERP systems through the browser; this method avoids the time-consuminginstallation of the GUI. This method of accessing ERP systems usually appeals to a com-pany’s IT staff as well, since the company does not need to distribute the GUI software tohundreds or thousands of users.
The University of Delaware’s new PeopleSoft HR system was originally accessed througha PeopleSoft GUI. Since the University of Delaware processes most of its HR requests usingforms on the Web, PeopleSoft agreed to create access to the system through a Web browser.Users can log on to the university’s PeopleSoft system from home or from a remote office, as longas they have a computer with an Internet connection and Web browser. They do not have tobe in their own offices to perform their jobs. System administrators at the university alsofind that software upgrades are much simpler to manage. Only the software on the server needsto be upgraded—there is no special software installed on user PCs.
X M L
Extensible Markup Language, shortened to XML, is the new programming language of theInternet. XML uses tags that define the data contained within them. Similar to data typesassigned to records in a database, XML tags apply specific meaning to the data within a Webpage. XML-coded data can go directly from a Web page into a database without having topass through middleware or, worse yet, be rekeyed into the system. In comparison, mostInternet pages are written in Hypertext Markup Language, or HTML. HTML specifies onlyhow your information will look (by assigning text styles, coloring, placement of graphics,and so on) when viewed through a browser.
Chapter 8
228

XML users can create their own tags. Many companies are working together to createindustry-specific tags to use in conducting e-commerce with each other. Fitter Snackercould keep its raw material records in XML format for easier transfer from suppliers’systems. An example of an FS XML document is shown in Figure 8-5. The customizedtags in the document describe, or define, the data much as a database would. The ingredi-ents honey and oats are defined as descriptions of an item.
Another example of the benefits of XML can be found in the insurance industry. Oftenin insurance, data must be passed between different documents. Sometimes the docu-ments are from different companies. With XML, data are tagged and flow into those dispar-ate documents without any additional processing. Every person involved in the chain ofevents—insurance brokers, insurance companies, underwriters, and insurance agents—canstreamline their paper processing with XML.
ERP systems are now ready to accept data in XML format. Using XML, companies cantransfer data from their Web sites (data such as order information) directly into their ERPsystems. This approach streamlines data entry, reduces errors, and reduces server loads.
XML is also very attractive to smaller companies. Small companies often transfer dataover telephone lines or using fax machines. Using XML makes electronic data transfermuch more affordable. Without XML, a company might receive text-formatted data over theInternet. The data need to be converted from the text format to a database record—apotentially time-consuming and expensive process. Using XML tags to define the data wouldeliminate the conversion requirement.
Opening tag in XML
Closing tag in XML
FIGURE 8-5 Fitter Snacker document in XML
ERP and Electronic Commerce
229

A N O T H E R L O O K
XML, ERP, and E-Commerce
Occidental Chemical Corporation, a subsidiary of Occidental Petroleum, uses SAP for itschemicals and resins business. When OxyChem linked its SAP system with a custom-er’s SAP system, both companies realized tremendous customer service benefits. Oxy-Chem has since embarked on a mission to link its SAP system with all of its customers.OxyChem has 5,000 customers of varying size in different industries. The company formedan internal team, which included customers, to study the project. The strategy they devel-oped was to offer four different methods to integrate the systems.
The first method offers an XML-based ERP system-to-ERP system linkage betweenOxyChem and the customer. Once the two systems are linked, OxyChem can check thecustomer’s ERP system to find out when it is becoming low on various raw materials. Pur-chase orders are automatically generated and orders flow efficiently.
The second method uses physical probes inside the customer’s raw materialcontainers. Using a Web interface and sales forecasts, the system automatically sends a pur-chase order in XML directly into OxyChem’s SAP system.
In the third method, customers go to the ChemConnect chemical trading site (whichyou learned about earlier in this chapter) to order chemicals from OxyChem. Theseorders are created in XML, so they can flow directly into the SAP system at OxyChem.
The last, and most popular, method is an OxyChem-owned Web portal that allows cus-tomers to place orders directly with OxyChem. The company originally thought this por-tal would be used only by its smaller customers, but customers of all sizes use it.
Of course, OxyChem still maintains a call center for those customers that do not wantto order by computer.
Questions:
1. Why did OxyChem give customers a choice in how to integrate their systems?
2. List the benefits of linking a manufacturer’s ERP system with a customer’s ERPsystem.
3. Draw a process map (see Chapter 7 for details on process mapping) to depictthe flow of information from a manufacturing plant using a chemical fromOxyChem. Show the process of requesting and then filling the order.
R A D I O F R E Q U E N C Y I D E N T I F I C A T I O NT E C H N O L O G Y
Radio frequency identification technology, known commonly as RFID, is becoming anefficient way of tracking items through a supply chain. An RFID device is a small pack-age, or tag, that includes a microprocessor and an antenna, and can be attached toproducts. The location of an item with an RFID tag can be determined using an RFID reader,which emits radio waves and receives signals back from the tag. The reader is also some-times called an interrogator because it “interrogates” the tag. Since microprocessors con-tinue to become more powerful and less expensive, according to Moore’s Law (discussedin Chapter 2), RFID technology has reached a point where it is inexpensive enough to be
Chapter 8
230

cost-effective. Today, most materials are tracked using bar codes and bar-code readers. Bar-code labels can degrade in bad weather, and an employee has to point a bar-code readerat the bar code to read it. RFID technology does not need this line-of-sight connection, andcan withstand most environmental stresses.
Wal-Mart is in the process of implementing an RFID system for its supply chain. Sup-pliers are shipping pallets of goods to Wal-Mart marked with RFIDs. Wal-Mart reads theRFID tags on cases and pallets when inventory enters a stockroom, when those cases of pal-lets go to the floor, and, ultimately, when empty cases are discarded. Much of the data col-lected during RFID reads is passed on to Retail Link, Wal-Mart’s Web-based software thatlets its thousands of buyers and suppliers check inventory, sales, and more. In 2007, Wal-Mart was still in the midst of bringing its suppliers on board with the technology, which wastaking longer than anticipated, with only 600 of the 20,000 suppliers using the RFIDs by theend of the year. Wal-Mart shifted its focus to the use of RFIDs in the stores, rather than inthe distribution centers. Goods coming from the warehouse have RFIDs and are scannedupon arrival at the store; the tags are not used for items on the shelves. Wal-Mart employ-ees also scan tags on discarded boxes to determine stock levels. The suppliers to Wal-Mart who have adopted the RFID technology do not see any return on investment exceptkeeping the Wal-Mart account. Wal-Mart does admit that the RFID project has not met itsgoals. In fact, some industry observers speculate that Wal-Mart became distracted with theRFID initiative, losing focus on new products and relationships with customers.
Pharmaceutical firms are also working toward adopting RFID technology, to complywith upcoming FDA regulations that would require track-and-trace technology on all drugpackages to prevent counterfeiting. Johnson & Johnson uses RFID technology to keeptrack of heart stents. Stents have a three-month shelf life, so managing inventory is time-sensitive, but the stents need to be available at the hospital for emergency heart surgeries.Since each stent is worth about $2,500, it pays for the company to keep track of every stent.Johnson & Johnson can read the data remotely and deliver stents to hospitals that arein need.
Companies involved in manufacturing and selling RFID technology, including IBM,claim that their customers’ projects experience a return on the RFID investment in less than18 months. Consumer goods companies, with their large numbers of customers, are espe-cially interested in applying this new technology, so they can track products better asthey move through the supply chain. The British retail giant Marks & Spencer has been tag-ging items in one pilot store. To avoid privacy concerns (such as tracking the wearer of agarment), the RFIDs are easily detachable. Eddie Dodd, the chief technology officer ofBritish Telecom’s Auto-ID services, which provides the RFID readers to Marks & Spencer,says, “RFID undoubtedly gives you clear visibility into what’s happening to your supplychain with a degree of accuracy.” Another U.K. giant, the food chain Tesco, piloted RFIDswith the goal of integrating the technology on the individual item level, but recently scaledback its RFID plans. Tesco is now placing RFIDs on roll cages (which hold items such asmilk) and pallets.
Procter & Gamble is using RFID technology to collect information about the sales ofits products. The company uses its RFID-gathered data on fluctuations in sales of Pam-pers and Luvs diapers to help manage its supply chain processes. Although P&G sells dis-posable diapers to a population that is fairly constant, a slight change in the number ofdiapers sold at stores can be amplified by traditional supply chain planning processes,
ERP and Electronic Commerce
231

causing large fluctuations in demand throughout the supply chain, a phenomenon knownas the bullwhip effect. There are two primary reasons that the bullwhip effect occurs.First, the relatively smooth daily demand for products gets aggregated into occasional largerorders from stores to distribution centers. The stores and distributors then aggregate theselarge orders into even larger and less frequent orders to the manufacturer. The secondsource of demand fluctuation is the human behavior that results from the potential for adelay in receiving a product. Like people waiting for an elevator who repeatedly push the callbutton in an attempt to speed the elevator’s arrival, companies sometimes place multipleorders for a product when they suspect a potential shortage or delay, only to cancel the addi-tional orders when the deliveries begin to arrive. The bullwhip effect has been under-stood for a long time. The only way to alleviate this problem is to have better informationfor planning, which is what RFID technology promises to provide. To figure out how manyunsold diapers are in a particular store, someone has to either count all the packages on theshelf and in the back room, or use a bar-code reader and scan them. RFID tags eliminatethe manual counting process. Determining the number of items in inventory in a buildingbecomes automatic. With RFID, real-time inventory data are always available. RFID tagsstore detailed data, such as production lot number and production date, which provideseven more benefit when items have an expiration date or are subject to recall, likeFitter Snacker’s line of NRG bars.
SAP’s ERP software is RFID-ready. Along with partner company Infineon Technologies AG,SAP provides tools to easily link RFIDs to back-office systems. Through NetWeaver, SAP canintegrate RFID data into both SAP and non-SAP applications.
Chapter 8
232

Chapter Summary
● E-commerce is transforming the way companies do business. Business-to-consumere-commerce can streamline a company’s ordering operations and record informationabout customers that can be used to customize sales and promotional activities, mak-ing the company more competitive.
● Business-to-business e-commerce is changing the way companies buy and sell goods.New forms of procurement such as auctions, reverse auctions, and tradingexchanges—all with dynamic pricing—are replacing the traditional intermediary.
● ERP is an essential component for all forms of e-commerce. An integrated informationsystem is required to provide speed and consistency in transaction processing and otherback-office operations.
● Application service providers (ASPs) are allowing companies to use ERP without a largeinitial investment, making ERP systems available to smaller companies. There are risksassociated with using an ASP, however, and the decision to buy or lease must beweighed carefully.
● Web services, or service-oriented architecture, offers a combination of software tools thatlets various programs within an organization communicate with other applications.
● SAP’s Web services platform is NetWeaver, which includes tools for seamless connec-tivity of diverse applications through the World Wide Web. NetWeaver also includes mod-ules such as Business Intelligence, Mobile Infrastructure, and Master DataManagement.
● Users of ERP systems often access those systems through a Web browser, rather thanthe ERP systems’ graphical user interface (GUI). Using a Web browser rather than a GUIprogram simplifies the software maintenance task.
● XML, Extensible Markup Language, defines data on a Web page. ERP systems are usingXML to integrate systems between suppliers and customers for easy data transfer.
● RFID devices, or radio frequency identification devices, are used in tracking items intransit. RFIDs are particularly useful in supply chain processes for shipping and receiv-ing cases and pallets of items. ERP vendors are developing the capability to incorpo-rate RFID technology into ERP software.
Key Terms
Application service provider (ASP)
Back-office processing
Bullwhip effect
Business-to-business (B2B)
Business-to-consumer (B2C)
Commodity
Denial of service (DoS)
Electronic data interchange (EDI)
Electronic marketplace
Exchange
Extensible Markup Language (XML)
Internet-based procurement
Portal
Radio frequency identification (RFID)
Reverse auction
Value-added network (VAN)
Web services
ERP and Electronic Commerce
233

Exercises
1. Assume you have just graduated and you land a job at Fitter Snacker as its new purchas-ing agent. The person you replaced has just retired after 35 years in the job. You are eagerto put to use some of the skills you learned at school, especially the work you did on B2Be-commerce. Write a memo to your new boss, the vice president of Supply Chain Man-agement, on the virtues of e-commerce and why Fitter Snacker should now do Internetprocurement.
2. Define application service provider. Do some research on the Web about current opinionsof using ASPs.Try to find some examples of success and failure stories. Under what circum-stances do you think using an ASP makes sense?
3. Go to the library and check out several publications about NetWeaver. Choose one aspectof NetWeaver and write a paper describing its functionality.
4. RFID technology is changing rapidly. Assume you have landed a summer job in the produc-tion department at Fitter Snacker. One of your jobs is to brief the entire team on the statusof RFIDs. Create a PowerPoint presentation that brings the FS crew up to speed on thisemerging technology.
5. Using the library or Internet sources, write an update on the status of FDA legislation sur-rounding RFID packaging on drugs. Are there any privacy concerns?
For Further Study and Research
Angwin, Julia. “Top Online Chemical Exchange Is an Unlikely Success Story.” The Wall StreetJournal, January 8, 2004.
Barrett, Larry. “Who Will Win the SAP, Oracle Battle?” ASPnews.com, August 28, 2007.http://www.aspnews.com/trends/article.php/3696666.
Bradshaw, Tim. “RFID suits M&S.” Information Age, June 19, 2006. http://www.information-age.com/briefing_room/old_briefing_rooms2/information_management/implementation/rfid_suits_marks.
eMarketer.com. “Europe E-Commerce to Grow Fourfold from 2003 to 2006.” July 2, 2003.“ERP+ERP=B2B.” Integrated Solutions, July 2002.Fox, Pimm. “Private exchanges drive B2B success.” Computerworld, May 7, 2001.
http://www.itworld.com/Tech/3478/CWD010507STO60197.Franke, Jon. “Microsoft’s latest ERP push: What does it mean for SAP, Duet?” SearchSAP.com,
March 21, 2007.Gaskin, James E. “XML Comes of Age.” InternetWeek.com, April 3, 2000.Herm, Marcus. “XML - An opportunity for small and medium-sized enterprises.” XML - The Site,
http://www.softwareag.com/xml/library/herm.htm.Kollmann, Tobias. “Measuring the Acceptance of Electronic Marketplaces: A Study Based on a
Used-car Trading Site.” Journal of Computer-Mediated Communication 6, no. 2 (January2001). http://jcmc.indiana.edu/vol6/issue2/kollmann.html.
Konicki, Steve, and Rick Whiting. “Let’s Keep This Private.” Information Week, July 30, 2001.Maxcer, Chris. “Rohm and Haas: Dashboards to the Rescue.” SAP NetWeaver Magazine,
Fall 2007.McDougall, Paul. “Closing the Last Supply Gap.” Information Week, November 8, 2004.
Chapter 8
234

Mooraj, Hussain. “Pharma RFID Adoption - Retail All Over Again?” RFID Update.com,May 8, 2006. http://www.rfidupdate.com/articles/index.php?id=1112.
SAP Solution Brief: Exchange Infrastructure. http://www.sap.com/platform/netweaver/pdf/BWP_SB_ExchangeInfrastructure.pdf
SAP Solution Brief: SAP Master Data Management. http://www.sap.com/search/index.epx?q1=Solution%20Brief%3A%20SAP%20Master%20Data%20Management
Sullivan, Laurie. “Fast Track to Success.” Information Week, June 21, 2004.———. “IBM Takes RFID Services to Midsize Companies.” Information Week,
September 20, 2004.———. “Wal-Mart’s Way.” Information Week, September 27, 2004.Surowiecki, James. “EZ Does It.” The New Yorker, September 8, 2003.Swabey, Pete. “Most SOA projects bring no ROI.” Information Age, September 6, 2007.———. “Structural hazard.” Information Age, March 19, 2007.Vamosi, Robert. “Botnets for sale.” CNET.com, March 23, 2007. http://reviews.cnet.com/
4520-3513_7-6719515-1.html?tag=feat.2.“VoiceObjects Technology to be Integrated in SAP NetWeaver Phone Application Server
Technology to Enable Voice-Driven Telephone Access to SAP Applications.”VoiceObjects.com, Press Release, March 13, 2007. http://www.voiceobjects.com/en/news/2007/031307.html.
Waigum, Thomas “How Wal-Mart Lost Its Technology Edge.” CIO, October 4, 2007.Weier, Mary Hayes. “Wal-Mart Rethinks RFID.” Information Week, March 26, 2007.Westervelt, Robert. “Duet: SAP customers see success, challenges ahead.” SearchSAP.com,
August 8, 2006.Williams, Kathy. “How Secure Is E-Commerce?” Strategic Finance (March 2000): 23.Woods, Dan, and Jeffrey Word. SAP NetWeaver for Dummies. Indianapolis, Indiana: Wiley
Publishing, Inc., 2004.
ERP and Electronic Commerce
235

This page intentionally left blank

GLOSSARY
Accounting and Finance (A/F) A functionalarea of business that is responsible for record-ing data about transactions, including sales,raw material purchases, payroll, and receipt ofcash from customers.
Accounts receivable Accounting informationthat records money a customer owes for thegoods received.
Activity-based costing An advanced form ofinventory cost accounting in which overheadcosts are assigned to products, based on themanufacturing activities that gave rise tothe costs.
Advanced Business Application Programming(ABAP) SAP ERP internal programminglanguage.
Application service provider (ASP) Abusiness that delivers software applications tocompanies over a network. Sometimes thatnetwork is the Internet.
Archive Permanently stored data.
Asset Management (AM) module A modulein SAP ERP that helps a company to managefixed-asset purchases (plant and machinery)and related depreciation.
Audit trail Linked set of document numbersrelated to an order.
Back office processing The processing ofsales orders through a company’s marketing,manufacturing, shipping, and accountingsystems.
Balance sheet This summary of a company’saccount balances includes cash held, amountsowed to the company by customers, the cost ofinventory on hand to be sold, long-term assets
such as buildings, amounts owed to vendors,amounts owed to creditors, and amounts thatthe owners have invested in the company.
Best practices The application of the best,most efficient ways in which business pro-cesses should be handled.
Bill of material (BOM) The “recipe” listingthe materials (including quantities) needed tomake a product.
Bullwhip effect Large fluctuations in demandthroughout the supply chain caused by a slightchange in the number of products sold.
Business function Business activities withina functional area of operation.
Business process A collection of activitiesthat takes one or more kinds of input and cre-ates an output that is of value to a customer.Creating the output might involve activitiesfrom different functional areas.
Business process innovation (BPI) The pro-cess of improving processes.
Business process reengineering A qualityimprovement philosophy that recommends radi-cal change to achieve radical improvements.
Business-to-business (B2B) Communicationand sales between manufacturers, wholesalers,retailers, and suppliers. This communicationcan occur using both EDI and the Internet.
Business-to-consumer (B2C) Communica-tion and sales between businesses and the buy-ing public. Popularly, but incorrectly, thoughtof as the most common form of e-commerce.
Capacity The amount of an item that can beproduced.

Cash-to-cash cycle time The time from pay-ing suppliers for raw materials to collectingcash from the customer (used in supply-chainmanagement metrics).
Client-server architecture Data stored in acentral computer (a server) are downloaded toa local PC (a client of the server) where dataare processed. Historically, client-server archi-tecture replaced many companies’ mainframe-based architecture.
Commodity An item that is widely availableat a standard level of quality.
Condition technique A SAP control mecha-nism that accommodates the various ways thatcompanies offer price discounts.
Continuous improvement A quality improve-ment philosophy that prescribes systematicand repeated improvement efforts.
Controlling (CO) module A module in SAPERP that is used for internal managementpurposes. The software assigns a company’smanufacturing costs to products and to costcenters, facilitating cost analysis.
Cost variance The difference between actualcosts and standard costs.
Currency translation Converting financial-statement account balances expressed in onecurrency into balances expressed in anothercurrency.
Customer master data Central databasetables in SAP ERP that store permanent dataabout each customer. Master data are used bymany SAP ERP modules.
Customer relationship management (CRM)software A variety of different software toolsthat use data from a company’s ERP system toenhance the company’s relationships with itscustomers. CRM software allows theseactivities: segmenting customers, one-to-onemarketing, sales-force automation (SFA), sales-campaign management, marketing encyclope-dias, and call-center automation.
Data mining The statistical and logicalanalysis of large sets of transaction data, look-ing for patterns that can aid decision makingand improve customer sales and customerservice. Data mining is often done with data ina data warehouse.
Data warehouse A database, separate from acompany’s operational database, that containssubsets of data from the company’s ERPsystem. Users analyze and manipulate data inthe warehouse. Thus, they do not interferewith the workings of the database that is usedto record the company’s transactions.
Database management system (DBMS) Thetechnology that stores database records in anorganized fashion and allows easy retrieval ofthe data.
Delivery In SAP, release of the documentsthat a warehouse uses to pick, pack, and shiporders.
Denial-of-service (DOS) attack A securityattack on a Web site or Web server in whichattackers block access to the Web-based ser-vice through a variety of means.
Deployment flowcharting (swimlaneflowcharting) A type of flowchart thatdepicts team members across the top, witheach process step aligned vertically under theemployee or team working on it.
Development (DEV) system In a SAP systemlandscape, one of three separate SAP systems;DEV is used to develop configuration settingsfor the system using ABAP code.
Direct costs Costs in a finished product thatcan be estimated fairly accurately.
Document flow The linked set of documentnumbers related to an order; an “audit trail.”
Drill down The ability to view the detailsbehind a summary of information.
Dynamic process modeling A method ofevaluating process changes before they areimplemented by putting into motion a basic
Glossary
238
process flowchart using computer simulationtechniques to facilitate the evaluation of pro-posed process changes.
Electronic commerce (e-commerce) Thebuying and selling of goods and services overthe Internet.
Electronic data interchange (EDI) Acomputer-to-computer transfer of standardbusiness documents that allows companies tohandle the purchasing process electronically,avoiding the cost and delays resulting frompaper-based systems.
Electronic marketplace A gathering place forbuyers and sellers on the Internet.
Enterprise Resource Planning (ERP) ERPsystems help to manage business processessuch as marketing, production, purchasing,and accounting in an integrated way. ERP doesthis by recording all transactions in a commondatabase that is used by information systemsthroughout the company and by providingshared management-reporting tools.
Error log A record of discrepancies thatoccur during a payroll run.
Event process chain (EPC) A graphic modelof a business process that uses only twosymbols: events and functions.
Exchange A type of B2B electronic market-place that focuses on a single industry.
Extensible markup language (XML) AnInternet programming language that uses tagsthat define the data contained within them.
Financial accounting The documenting of alltransactions of a company that have an impacton the financial state of the firm. The docu-mented transactions form the basis for reports,or financial statements, for external partiesand agencies.
Financial Accounting (FI) module A modulein SAP ERP that records transactions in thegeneral ledger accounts and generates financialstatements for external reporting purposes.
Flowchart Any graphical representation of themovement or flow of concrete or abstract items.
Functional areas of operation A categoriza-tion of business activities, including marketing,sales, production, and accounting.
Gap analysis An assessment of disparitiesbetween an organization’s current situationand its long-term goals.
General ledger A traditional record ofaccounting.
Hierarchical modeling The ability to flexiblydescribe a business process in greater or lessdetail depending on the task at hand.
Human capital management (HCM) Anotherterm for Human Resources that describe thetasks associated with managing a company’sworkforce.
Human resources (HR) A functional area ofbusiness that manages recruiting, training,evaluation, and compensation of employees.
Human Resources (HR) module A modulein SAP ERP that facilitates employee recruit-ing, hiring, training, and payroll and benefitsprocessing.
Income statement A financial statement thatshows a company’s profit or loss for a periodof time.
Indirect costs Overhead items that are diffi-cult to associate with a specific product.
Information system (IS) The computers,people, procedures, and software that store,organize, and deliver information.
Initial fill rate The percentage of the orderthat the supplier provided in the first shipmentto the manufacturer or retailer (used in supply-chain management metrics).
Initial order lead time The time needed forthe supplier to fill an order (used in supply-chain management metrics).
Integrated information system An informa-tion system that allows sharing of commondata throughout an organization. ERP systems
Glossary
239
are integrated systems because all operationaldata are located in a central database, wherethey can be accessed by users throughout anorganization.
Intercompany transaction A transaction thatoccurs between a company and its subsidiary.
Internet-based procurement The use ofInternet technologies for procurementactivities.
Job A generic description of an employee’swork responsibilities or the position that theperson holds.
Lead-time The cumulative time required fora supplier to receive and process an order, takethe material out of stock, package it, load it ona truck, and deliver it to the manufacturer.
Legacy system An IS that is already in exist-ence prior to installation of an ERP system.
Lot sizing The process for determining pur-chase and production order quantities.
Managerial accounting Accounting thatdeals with determining the costs and profitabil-ity of the company’s activities.
Marketing and sales (M/S) The functionalarea of business that is responsible for develop-ing products, determining pricing, promotingproducts to customers, and taking customers’orders.
Master production schedule (MPS) Theproduction plan for finished goods.
Materials Management (MM) A module inSAP ERP that manages the acquisition of rawmaterials from suppliers (purchasing) and thesubsequent handling and storage of raw materi-als, work in process, and finished goods.
Material Master Data Central databasetables in SAP ERP that store relatively perma-nent data about materials. These data are usedby SD, MM, and other SAP ERP modules.
Materials Requirements Planning (MRP) Aproduction-scheduling methodology thatdetermines the timing and quantity of
production and purchase-order releases to meeta master production schedule. This process usesthe bill of material, lot-size data, and materiallead-times.
Metrics Measurements of performance;discussed in this book in relation to the effectsof supply-chain management efforts.
Modules Individual programs that can bepurchased, installed, and run separately, but allextract data from the common database.
MRP Record The standard way of showingthe Manufacturing Requirements Planningprocess on paper.
On-demand The practice of CRM softwareand computer equipment residing with theCRM provider.
On-time performance A measure of howoften a supplier meets agreed-upon deliverydates (used in supply-chain managementmetrics).
Open architecture Software that allows inte-gration with third-party software. SAP ERP isan example of open-architecture software. Theterm can also be applied to hardware products.
Organizational change management Thesupervision of human behavior aspects of orga-nizational change.
Organizational structure The method usedin SAP ERP to define the relationships betweenorganizational groups such as companies,plants, storage locations, sales divisions, anddistribution channels.
Overhead A company’s cost of operations,such as the costs for factory utilities, generalfactory labor, factory management, storage,insurance, and other manufacturing-relatedactivities. Overhead is often called an indirectcost of production.
Payroll run The process of determining eachemployee’s pay.
Person The unique individual who holds aposition.
Glossary
240
Plant Maintenance (PM) module A modulein SAP ERP that allows planning for preventivemaintenance of plant machinery and managingmaintenance resources, so equipment break-downs are minimized.
Portal A customizable Web site that serves asa home base from which users navigate the Web.
Position A job that might exist in more thanone department. For example, the administra-tion assistant position might be required in theWholesale Department as well as in Inside Sales.
Process boundary In process mapping, adefinition of those activities to be included inthe process, and what is considered part of theenvironment.
Process mapping A type of flowcharting thatspecifically represent pictorially the activitiesoccurring within an existing business process.
Product cost variant The procedure fordeveloping a product cost analysis.
Production Planning (PP) module A modulein SAP ERP that maintains productioninformation; production is planned and sched-uled, and actual production activities arerecorded.
Production (PROD) system In a SAP systemlandscape, one of three separate SAP systems;the actual system that the company uses torun its business processes.
Profit and loss (P&L) statement A recordthat shows a company’s sales, cost of sales, andthe profit or loss for a period of time.
Project System (PS) module A module inSAP ERP that allows planning for and controlover new R&D, construction, and marketingprojects. This module allows for costs to be col-lected against a project budget, and it can beused to manage the implementation of ERP itself.
Qualifications Skills or abilities associatedwith a specific employee.
Quality circles A quality improvement tech-nique in which employees in a department
have regular team meetings to discuss prob-lems and collaboratively develop solutions.
Quality assurance (QAS) system In a SAPsystem landscape, one of three separate SAPsystems; the system where testing is done.
Quality Management (QM) module A mod-ule in SAP ERP that helps to plan and recordquality-control activities, such as productinspections and material certifications.
R/3 The first integrated information systemreleased by German software vendor SAP in1992; now called SAP ERP. This ERP systemcontains the following main modules, which canbe implemented as a group or selectively: Salesand Distribution (SD), Materials Management(MM), Production Planning (PP), Quality Man-agement (QM), Plant Maintenance (PM), HumanResources (HR), Financial Accounting (FI), Con-trolling (CO), Asset Management (AM), ProjectSystem (PS), Workflow (WF), and Industry Solu-tions (IS).
Radio frequency identification (RFID) Atracking technology that uses a small package,or tag, device that includes a microprocessorand antenna that can be attached to products.The location of an item with an RFID tag canbe determined using an RFID reader, whichemits radio waves and receives signals backfrom the tag.
Raw data Data on sales, manufacturing, andother operations that have not been analyzed.
Remuneration elements The part of anemployee’s pay include the base pay, bonuses,gratuities, overtime, sick pay and vacationallowances that the employee has earnedduring the pay period.
Repetitive manufacturing A manufacturingenvironment in which production lines areswitched from one product to another similarproduct.
Requirements Skills or abilities associatedwith a position.
Glossary
241

Return on investment (ROI) A ratio calcu-lated by dividing the value of the project’s ben-efits by the value of the project’s cost.
Reverse auction An auction that featuresone buyer and many sellers.
Rough cut planning A common term inmanufacturing for aggregate planning.
Sales and Distribution (SD) module A mod-ule in SAP ERP that records sales orders andscheduled deliveries.
Safety stock Extra raw material and packag-ing kept available to help avoid stockouts.
Sales forecast A company’s estimate offuture product demand, which is the amount ofa product that customers will want to buy.
SAP ERP ERP software produced by SAP;previous versions were known as R/3 andmySAP ERP.
Scalability Information systems are deemed“scalable” if their capacity can be extended byadding servers to the network, rather thanreplacing the entire system. Scalability is acharacteristic of client-server networks, butusually not of mainframe-based systems.
Scope creep The unplanned expansion of aproject’s goals and objectives, causing theproject to go over time and over budget, as wellas increasing the risk of an unsuccessfulimplementation.
Service-oriented architecture (SOA) Soft-ware that enables systems to exchange datawithout complicated software links, also calledWeb services.
Short list Up to three top candidates for aposition, each of whom will be interviewed.
Silo An unintegrated information systemconfiguration in which individual businessfunctional areas each have their own hardware,software, and methods of processing data andinformation.
Software modules See “modules.”
Standard cost The expected cost of manu-facturing a product during a particular period.Standard costs for a product are established by(1) studying historical cost patterns in a com-pany and (2) taking into account the effects ofcurrent manufacturing changes.
Statutory and voluntary deductions Pay-check withholdings that include taxes (federal,state, local, Social Security, and Medicare),company loans, and benefit contributions.
Stockout A manufacturing shortfall thatoccurs when raw materials or packaging run out.
Succession planning Outlining of the strat-egy for replacing key employees when theyleave the company.
Supply chain All of the activities that occurbetween the growing or mining of raw materi-als and the appearance of finished products onthe store shelf.
Supply Chain Management (SCM) Sharinglong-range production schedules between amanufacturer and its suppliers, so raw materi-als can be ordered and delivered in a timelymanner, thus avoiding stock-outs or excessinventory.
Tasks The assigned responsibilities related toa specific job.
Tolerance group Ranges that define limits onthe dollar value of business transactions thatan employee can process.
Transport directory A special data file loca-tion on the DEV server that stores changes tothe SAP system landscape.
Value added An increase in a product’s orservice’s value, from a customer’s perspective.
Value-added network (VAN) An EDI serviceprovider. Companies acquire EDI service bysubscribing to a VAN’s EDI network.
Value analysis Analysis of each activity in aprocess for determining the value the activityadds to the product or service.
Glossary
242

Web services A combination of softwaretools that lets various programs within an orga-nization communicate with other applications.
Workflow (WF) A set of tools in SAP ERPthat can be used to automate any of the activi-ties in SAP ERP. It can perform task-flowanalysis and then prompt employees (bye-mail) if they need to take action.
Workflow tasks In SAP ERP, links betweenwork and various transactions. These links caninclude basic information, notes, and docu-ments, as well as direct links to businesstransactions.
Glossary
243

This page intentionally left blank

INDEX
A
ABAP (Advanced Business ApplicationProgramming)
described, 35, 200e-commerce and, 219
ABC (activity-based costing), 132–133Aberdeen Research, 173accounting. See also A/F (Accounting and
Finance)activities, 118–122Enron and, 138–141Human Resources departments and, 168inconsistent recordkeeping and, 127–128inventory costing systems and, 128–133management reporting and, 136–138overview, 117–155process modeling and, 181–183providing production data to, 105–107sales order process and, 49–53, 64SCM and, 81subsidiaries and, 133–135
accounts receivable entries, 122Acquiring phase, 69–70activity-based costing (ABC), 132–133Advanced Business Application
Programming (ABAP)described, 35, 200e-commerce and, 219
Advanced Planner and Optimizer module. SeeAPO (Advanced Planner and Optimizer) module
advertising, 72. See also marketingA/F (Accounting and Finance). See also
accountingdescribed, 2–3, 11–12functional areas of operation and, 8–9inputs, 12outputs, 12small businesses and, 7
aggregate production plans, 82–83All-in-One (SAP), 199AM (Asset Management) module, 28, 122Amazon.com, 214AMR Research, 39, 109, 112, 142analysis tools, 137–138AND connector, 186, 188APO (Advanced Planner and Optimizer) module,
41, 68
application servers, 220, 226. See also serversapplication service providers (ASPs)
advantages of, 218–219described, 217disadvantages of, 219e-commerce and, 217–223Web services and, 224
applications. See softwareApplied Materials, 35archiving, 142–143areas of operation, functional
described, 2–6information systems and, 8–14small businesses and, 6–8
ARIS (Architecture of Integrated InformationSystem) toolset, 184–185, 194, 195
Arthur Anderson, 138, 139, 140, 142ASAP (Accelerated SAP), 32ASPs (application service providers)
advantages of, 218–219described, 217disadvantages of, 219e-commerce and, 217–223Web services and, 224
assemble-to-order approach, 79Asset Management. See AM (Asset
Management) moduleATP (Available-to-Promise) capability, 41, 55, 68auctions, Internet
described, 214–215reverse, 214
audit trails, 61, 136–137Available-to-Promise capability. See ATP
(Available-to-Promise) capability
B
B2B (business-to-business) e-commerce. See alsoe-commerce
described, 212–213exchanges and, 213–214
B2C (business-to-consumer) e-commerce, 212.See also e-commerce
back-office systemsdescribed, 214e-commerce and, 214, 216, 232RFID technology and, 232
balance sheets, 118–119, 121bandwidth, 219bankruptcy, 138–141baseball, 166Basell, 134, 135Baxter, J. Clifford, 140Bell, Charles H., 173best practices, 31Big Bang approach, to implementation, 37bill of material. See BOM (bill of material)Black & Decker, 162Boehme, Alan, 173, 174Boeing Corporation, 33, 165BOM (bill of material)
costing systems and, 130, 131described, 97–98
Booz Allen Hamilton, 111Boston Red Sox, 166BPI (business process innovation), 194BPR (business process reengineering), 194Brigham Young University, 166British Petroleum PLC, 213British Telecom, 231Brown, Donald, 227browsers, 34, 41–42, 218, 228bullwhip effect, 232Business Blueprint phase, 201–203Business ByDesign (SAP), 220business functions
described, 4overview, 2–16
Business Intelligence module, 224, 225Business One (SAP), 198Business Process Improvement (Harrington), 193business process(es). See also process
improvement; process mapping; processmodeling
boundaries, 181–182described, 2, 3–6functional areas of operation and, 2–6innovation (BPI), 194overview, 2–16reengineering (BPR), 194sample, 3–6small businesses and, 6–8
Business Workplace, 196–198business-driven strategies, 111BW (Business Warehouse) module, 32–33, 68,
84, 138
C
Cadbury, 32call centers, 66, 72
Campaign Execution Activity Management, 71Canada, 135, 140Canadian Imperial Bank of Commerce, 140Cantalupo, James, 173cash-to-cash cycle time, 110Caterpillar Logistics, 111CATS (Cross Application Time Sheets), 170cell phones, 225Champy, James, 194chemConnect, 213–214, 230CIA (Central Intelligence Agency), 26Cisco, 109Citigroup, 140Cleveland State University, 40client-server architecture. See also servers
described, 20SAP R/3 and, 24–25
CO (Controlling) module, 29, 122Coca-Cola, 173, 199COGM (cost of goods manufactured), 130–131COGS (cost of goods sold), 130–131Colgate-Palmolive, 6commodity, 214communication problems, 80computer simulation, 194condition technique, 62consultants, choosing, 33Contact Channels, 70continuous improvement, 194Controlling module, 170Corporate Executive Board, 162Cost-per-Hire (CpII) Staffing Metrics Survey, 163Craigslist, 42credit management
overview, 122–127procedures, 124
CRM (Customer Relationship Management), 33,41, 225
activities, core, 66benefits of, 71cost of, 71described, 65e-commerce and, 225, 228on-demand, 65, 72overview, 65–72as a strategy, 72
cross-selling, 66currency translation, 134–135customer master data, 59customer service. See also CRM (Customer Rela-
tionship Management)accounting and, 136–137document flow for, 136–137
cycle time, cash-to-cash, 110
Index
246
D
datamining, 225warehouses, 225
database(s). See also DBMSs (database manage-ment systems)
accounting and, 121–122, 136–137administrators, 222CRM and, 66–71e-commerce and, 220, 222, 228sales order process and, 52, 56–58servers, 220
Datamonitor, 225DBMSs (database management systems), 20. See
also databasesdecision-making, 122–127Del Monte Foods, 38delivery, use of the term, 55Dell Computers, 32Deloitte & Touche LLP, 37Deloitte Consulting, 37demand management, 84, 95–96deployment flowcharting, 184DeRodes, Bob, 38detailed scheduling, 83–84DEV (Development) system, 204–205DI (Direct Input) system, 171direct costs, 128disaggregation process, 93–94discrimination, 164–165Distribution Channel, 59document flow, 61–62, 136–137Dodd, Eddie, 231domestic partners, 174–175DoS (denial of service) attacks, 214. See also
securityDow Chemical, 35, 166drill down, 137, 146Drucker, Peter, 175DSA (Diversity Salary Analysis), 165Duet, 32, 228Duffield, David, 25Dunn, Jeri, 38dunning letters, 53Dynamic CRM (Microsoft), 65dynamic process modeling, 193–194
E
e-commerce. See also InternetASPs and, 217–223B2B (business-to-business), 212–214B2C (business-to-consumer), 212background, 212–215
back-office systems and, 214, 216, 232GUIs and, 218, 227, 228Internet-based procurement and, 213–214overview, 211–235RFID technology and, 230–232security and, 214, 219servers and, 214, 220–221, 226–227XML and, 228–230
EDI (electronic data interchange)described, 21, 103, 109–110, 212–213Internet-based procurement and, 213NetWeaver and, 226
electronic marketplace, 213–214Ellison, Larry, 26employee turnover, 163–164Enron, 23, 138–141Enterprise Portal module, 224Enterprise Resource Planning. See ERP (Enter-
prise Resource Planning)EPC (Event Process Chain) diagrams, 184–192Epsilon Products Company, 214Equal Employment Opportunity Commission,
164–165ERP (Enterprise Resource Planning). See also
specific subjectsbenefits of, 33–34, 200continuing evolution of, 39–42cost of, 34, 200described, 2development of, 17–46management’s impetus to adopt, 21–23manufacturing roots of, 20–21new directions in, 25–29packages, purchasing, 34–35questions about, 34–39significance of, 33–34
error logs, 170e-Synergy (SAP), 32eToys.com, 215Europe, 199Exchange Infrastructure module, 224, 226exchanges, 213–214Exclusive OR (XOR) connector, 186, 188–189expectation management, 111expense report process, 181–195Extensible Markup Language (XML)
described, 228e-commerce and, 211–212, 228–230
Exxon Mobile Corporation, 213
F
family and medical leave, 174FASB (Financial Accounting Standards
Board), 118Fastow, Andrew, 138, 139, 140
Index
247
FDA (Food and Drug Administration), 231FedEx Corporation, 11, 35FI (Financial Accounting) module, 29, 122FIFO (First In First Out) method, 134Final Preparation phase, 201–203financial accounting. See also accounting
described, 118financial transparency and, 146–148standards, 139
Fink, Ronald, 139FinListics, 109flowcharts
deployment, 184described, 180process modeling and, 180–181
FMLA (Family and Medical Leave Act), 174Ford Motor Company, 111forecasts, sales, 7, 89–90
described, 84–85SCM and, 83, 84, 86
Forrester Research, 65Fortune 500 companies, 32, 109, 198FoxMeyer, 32Fuji Xerox, 171–172functional areas of operation
described, 2–6information systems and, 8–14small businesses and, 6–8
FXIS (Fuji Xerox Information Services), 171–172
G
Gartner Research, 38Gates, Bill, 39general ledger, 122General Motors, 22, 199global
integration, 33planning initiatives, 112–113
Global Crossing, 140Go Live and Support phase, 201–203, 205goods receipt screen, 106Google Maps, 42GoreTex, 36government. See also legislation
CIA (Central Intelligence Agency), 26Equal Employment Opportunity Commission,
164–165FDA (Food and Drug Administration), 231Labor Department, 165SEC (Securities and Exchange Commission),
118, 138, 139, 140Great Plains (Microsoft), 32, 198gross profit KPI, 225
GUI (graphical user interface)ASPs and, 218e-commerce and, 218, 227, 228
H
Hammer, Michael, 23, 194hardware, development, 19–20Harmon, Melinda, 140Harringon, James, 193Harvard Business Review, 35Harvard Mark I computer, 39HCM (human capital management), 157,
162, 174Hector, Hans-Werner, 23Hershey Foods, 37Hewlett-Packard, 110hierarchical modeling, 183–184hiring, 160–161, 162–165Home Depot, 36, 38, 39, 162Hopp, Dietmar, 23, 24HR (Human Resources) module, 28–29, 122,
166–174. See also human resourcesdescribed, 2–3, 13–14functional areas of operation and, 9
HTML (HyperText Markup Language), 228human resources. See also HR (Human
Resources) modulehiring process and, 160–165inputs, 14interviewing process and, 160–161outputs, 14overview, 157–177PeopleSoft and, 25problems with, 159–165recruiting process and, 159–160SCM and, 11small businesses and, 8
I
i2 software, 112, 113IBM (International Business Machines), 23, 25,
196, 214IBP (Integrated Business Planning), 92implementation tools, 201–203Implementation Roadmap, 201–203income statements. See P&L (profit and loss)
statementsindustrial credit management, 122–123Infineon Technologies AG, 232Information Age, 224
Index
248
information systems. See IS (informationsystems)
Information Week, 111initial fill rate, 110initial order lead time, 110integrated information systems, 4–6. See also IS
(information systems)Integrated Business Planning. See IBP (Integrated
Business Planning)International Business Machines. See IBM (Inter-
national Business Machines)Internet, 39, 41–42, 72. See also e-commerce
accessing ERP systems over, 228ASPs and, 217–220auctions, 214–215-based procurement, 213–214
Internet Explorer (Microsoft), 39, 228. See alsoWeb browsers
interviewing process, 160–161inventory
accounting and, 137costing systems, inaccurate, 128–133safety stock, 86SCM and, 77–78, 80–84, 86, 87–89sourcing, 55
IS (information systems)described, 3evolution of, 18–23functional areas of operation and, 8–14integrated, 4–6
iTunes, 42
J
J.D. Edwards, 25, 199job, use of the term, 167–168Johnson & Johnson, 231JPMorgan, 140Juniper Networks, 173, 174
K
Kellogg Company, 91–92Kimberly-Clark, 204KLM, 6Kmart, 35Knight, Phil, 112Knoa Experience and Performance Manager, 204
L
labor costs, 81, 130–132Labor Department, 165
Lambeth, Tim, 109–110Lay, Ken, 140lead times, 97–100learning period acceptance, 111legacy systems, 25, 29, 203legislation. See also Sarbanes-Oxley Act
FMLA (Family and Medical Leave Act), 174human resources and, 13implications of, for ERP systems, 141–148
LIS (Logistics Information System) tool, 84, 138long-term incentives, administration of, 175lot sizing, 97–100Lotus software, 196
M
mainframes, 23–24major-league baseball, 166make-to-order approach, 77–79, 97–98management
for global employees, 175by objectives (MBO), 175reporting, 136–138
managerial accounting, 120–121. See alsoaccounting
MAPICS, 199marketing. See also M/S (Marketing and Sales)
accounting and, 120, 123, 136CRM and, 66encyclopedias, 66Human Resources departments and, 168information systems, overview, 47–75one-to-one, 66
Marks & Spencer, 231Master Data Management module, 224, 226material master data, 59Materials Management group, 104–105Materials Management module, 27, 55, 121–122McDonald’s, 173McKesson Pharmaceutical, 33McKinsey & Company, 162Medicare, 170memory
mainframes and, 23Y2K problem and, 25
Mercia Software, 199metrics, 110Michigan State University, 166Microsoft, 39, 65
Duet, 32, 228e-commerce and, 228Dynamics, 32Great Plains, 32, 198Office, 228
Index
249
Outlook, 196Windows NT, 24
middleware, 228midsized companies, 32–33, 199–200Miner, Bob, 26Mobile Infrastructure module, 224, 225, 227modules (listed by name)
AM (Asset Management) module, 28, 122APO (Advanced Planner and Optimizer) mod-
ule, 41, 68Business Intelligence module, 224, 225BW (Business Warehouse) module, 32–33, 68,
84, 138CO (Controlling) module, 29, 122Controlling module, 170Enterprise Portal module, 224Exchange Infrastructure module, 224, 226FI (Financial Accounting) module, 29, 122HR (Human Resources) module, 28–29, 122,
166–174Master Data Management module, 224, 226Materials Management module, 27, 55,
121–122Mobile Infrastructure module, 224, 225, 227Payroll module, 170, 175PM (Plan Maintenance) module, 28PP (Production Planning) module, 131–132,
170PS (Project System) module, 28QM (Quality Management) module, 27Sales and Distribution module, 54–55SD (Sales and Distribution module), 27, 87,
121Workflow (WF) module, 29
Monk, Ellen, 134–135Moore, Gordon, 19Moore’s Law, 19, 230Moquin, Danny, 173, 174MPS (master production schedule), 95–96MRP (material requirements planning), 84,
96–100described, 20–21list, 100–103records, 98, 100
M/S (Marketing and Sales). See also marketingbusiness processes and, 6–8described, 2–3functional areas of operation and, 6–9MRP and, 20–21overview, 47–75SCM and, 80, 81small businesses and, 6–8
mySAP, 26
N
NASDAQ, 227NB Power, 135Nestlé USA, 36, 38net present value (NPV), 222–223Netherlands, 134Netscape Navigator, 39, 228. See also Web
browsersNetWeaver (SAP), 29, 32, 33, 211, 228
capabilities, 224–227described, 41–42Home Depot and, 39RFID technology and, 232SOA and, 42tools, 224–227Whirlpool and, 42
network administrators, 222New Brunswick, 135Nike, 112, 113Nova Chemicals, 194–195NPV (net present value), 222–223
O
Oates, Ed, 26Occidental Chemical Corporation, 230OCM (organizational change management), 201OFCCP (Office of Federal Contract Compliance
Programs), 165Office (Microsoft), 228on-demand CRM, 65, 72on-time performance, 110open architecture, 24–25OR connector, 186–189Oracle ERP, 25, 199
on-demand access and, 65overview, 26ROI and, 36
Oracle Financials, 26Oracle Human Resources, 26Oracle Manufacturing, 26Oracle Market Management, 26Oracle Project Systems, 26Oracle Supply Chain Management, 26order entry screen, 56–62order process
accounting and, 124–127credit management and, 124–127discount pricing and, 62–64order filling and, 51–52
Index
250
overview, 47–75payments and, 53, 55problems with, 49–64returns and, 53sale quotations and, 50–51standard orders, 56–64
organizationalcharts, 167structures, 2, 49, 59
Outlook (Microsoft), 196Owens Corning, 32
P
pagers, 225P&L (profit and loss) statement, 119–121payroll
for global employees, 175runs, 170
Payroll module, 170, 175PCAOB (Public Company Accounting Oversight
Board), 141PDAs (personal digital assistants), 225, 227Peachtree, 199Peerstone Research, 36PeopleSoft, 35, 37, 166, 174, 199
e-commerce and, 228overview, 25universities and, 40
performancemeasurement, 71on-time, 110
person, use of the term, 167–168personnel development, 172–174Personnel Cost Planning tool, 175Pinkie, George, 165Plattner, Ilasso, 23PM (Plan Maintenance) module, 28portals, 224position, use of the term, 167–168PP (Production Planning) module, 131–132, 170.
See also productionPractice of Management, The (Drucker), 175pre-sales activities, 54pricing
discount, 62–64dynamic, 214e-commerce and, 213–214
process(es). See also process improvement; pro-cess mapping; process modeling
boundaries, 181–182described, 2, 3–6functional areas of operation and, 2–6innovation (BPI), 194overview, 2–16reengineering (BPR), 194
sample, 3–6small businesses and, 6–8
process improvementevaluating, 193–194overview, 179, 192–195
process mappingdescribed, 180–183extensions of, 183–184
process modelingEPC diagrams and, 184–192overview, 179–192
processors, 19Procter & Gamble, 173, 231–232PROD (Production) system, 204–205product
cost variant, 132profitability analysis, 127–135
production. See also PP (ProductionPlanning) module
management, 77–114overview, 78–82planning process, 7, 82–107problems, 80–82sequences, 79–80SCM and, 77–114
Profile Generator, 144Projection Preparation phase, 201–203Prospecting phase, 69–70PS (Project System) module, 28purchase order (PO) numbers, 60purchasing, 60, 81, 83, 84, 100, 103Purdue University, 166
Q
QAS (Quality Assurance) system, 204–205QM (Quality Management) module, 27qualifications, use of the term, 172quality circles, 194
R
R/3 (SAP), 23–31radio frequency identification devices. See RFIDs
(radio frequency identification devices)Realization phase, 201–203recruiting process, 159–160reengineering. See BPR (business process
reengineering)Reengineering the Corporation: A Manifesto for
Business Revolution (Champy and Hammer),23, 194
remuneration elements, 170repetitive manufacturing, 104–105requirements, 172
Index
251
response time, 219Retail Link software, 231Retaining phase, 69–70Retek, 199return on investment. See ROI (return on
investment)returned material authorization. See RMA
(returned material authorization)reverse auctions, 214. See also auctions, InternetRFID (radio frequency identification) technology,
38, 106described, 230e-commerce and, 230–232
RHR International, 162risk management, 139RMA (returned material authorization), 53Rohm and Haas (company), 225ROI (return on investment), 36, 37, 227rough-cut planning, 87–90
S
sabermetrics, 166safety stock, 10, 86Sage Software, 199Sales and Distribution module, 54–55sales and operations planning (SOA), 84, 85–94sales campaign management, 66sales force automation, 66sales forecasts, 7, 89–90
described, 84–85SCM and, 83, 84, 86
Sales Information System tool, 138sales order process
accounting and, 124–127credit management and, 124–127discount pricing and, 62–64order filling and, 51–52overview, 47–75payments and, 53, 55problems with, 49–64returns and, 53sale quotations and, 50–51standard orders, 56–64
Salesforce.com, 72Sanchez, Amy, 227SAP ERP. See also SAP modules (listed by name)
4.7 Enterprise system, 56–64accounting and, 105–107All-in-One, 32archiving and, 142–143credit management and, 124–127CRM software, 66–71described, 26–29ECC (Enterprise Central Component), 27features of, 31
financial transparency and, 146–148implementation tools, 201–203management reporting and, 136–138market leadership of, 23MRP and, 100–103production planning and, 83–84software implementation, 29–31tolerance groups and, 145user authorizations and, 144–145Whirlpool and, 5–6workflow tools, 195–198
SAP modules (listed by name)AM (Asset Management) module, 28, 122APO (Advanced Planner and Optimizer)
module, 41, 68Business Intelligence module, 224, 225BW (Business Warehouse) module, 32–33, 68,
84, 138CO (Controlling) module, 29, 122Controlling module, 170Enterprise Portal module, 224Exchange Infrastructure module, 224, 226FI (Financial Accounting) module, 29, 122HR (Human Resources) module, 28–29, 122,
166–174Master Data Management module, 224, 226Materials Management module, 27, 55,
121–122Mobile Infrastructure module, 224, 225, 227Payroll module, 170, 175PM (Plan Maintenance) module, 28PP (Production Planning) module,
131–132, 170PS (Project System) module, 28QM (Quality Management) module, 27Sales and Distribution module, 54–55SD (Sales and Distribution module), 27,
87, 121Workflow (WF) module, 29
Sarbanes-Oxley Act, 23, 175implications of, for ERP systems, 141–148key features of, 140–141long-term incentives and, 175Title IV, 141
scalability, 20scheduling
detailed, 104–105SCM and, 104–105
SCM (Supply Chain Management)A/F and, 12described, 2–3, 9–11, 41development of, 21functional areas of operation and, 8–11measures of success, 110overview, 77–115small businesses and, 7, 8suppliers and, 107–113
scope creep, 203SD (Sales and Distribution module), 27, 87, 121
Index
252

Sears, 36SEC (Securities and Exchange Commission), 118,
138, 139, 140security
ASPs and, 219DoS (denial of service) attacks and, 214e-commerce and, 214, 219servers and, 214
SEM (Strategic Enterprise Management), 41servers. See also client-server architecture
application, 220, 226database, 220e-commerce and, 214, 220–221, 226–227security and, 214
service(s)-oriented architecture (SOA), 42, 224Web, 42, 224
Servicing phase, 69–70Sezer, Esat, 5SFA (sales force automation), 66shareholders, 140short lists, 160Sibel, 199silos, 18simulation, computer, 194SIS (Sales Information System) tool, 138Skilling, Jeffrey, 138, 140Skinner, Jim, 173Sloan, Alfred P., 22small businesses, 6–8, 199–200SOA (service-oriented architecture), 42, 224Social Security, 170Society for American Baseball Research, 166Society for Human Resource Management, 163software
changing markets and, 32–33development, 19–20, 23–31e-commerce and, 221–222implementation, 29–31inflexible, 35modules, 24–25rights, 221–222
Software Development Laboratories (SDL), 26Solution Manager (SAP), 201–203SOP (sales and operations planning), 84, 85–94Source Overview screen, 103Standard & Poor’s, 109standard costs, 81, 129Stanford University, 40Staples, 110statutory and voluntary deductions, 170Steele, Gordon, 113Stock/Requirements List, 93–94, 100–103Styling example, 21–22subsidiaries, companies with, 133–135success, measures of, 110
succession planning, 172–174Sullivan, Maureen, 134suppliers, 107–113supply chain, 108–110Supply Chain Management (SCM)
A/F and, 12described, 2–3, 9–11, 41development of, 21functional areas of operation and, 8–11measures of success, 110overview, 77–115small businesses and, 7, 8suppliers and, 107–113
surveys, 111system landscape concept, 204–205
T
Target, 38, 166tasks
implementation, 201–203use of the term, 167–169workflow, 195–198
taxation, 34Tesco, 231Timberland, 162time management, 170, 174tolerance groups, 30–31, 145Toro, 36Toyota, 34track-and-trace technology, 231training, 172–174, 221–222transport directory, 204travel management, 171–172Tschira, Klaus, 23
U
UCC (University Competency Centers), 219–220universities, 40–41, 219–220, 228University Alliance (SAP), 219–220University of Delaware, 40, 219–220, 228University of Massachusetts, 40UNIX, 24UPS (United Parcel Service), 11up-selling, 66user authorizations, 144–145
V
vacation requests, 196–197value added, use of the term, 192. See also VANs
(value-added networks)
Index
253

value analysis, 192Vanguard Petroleum Corporation, 214VANs (value-added networks)
described, 212–213EDI and, 212–213
vendors, choosing, 33Viacom, 162Voice Objects AG, 225Volkswagen, 214voluntary deductions, 170Volvo Construction Equipment, 199
W
Wal-Mart, 35, 38, 164, 231Web Application Server (SAP), 226Web browsers, 34, 41–42, 218, 228Web services, 42, 224Web-based promotion, 71Wellenreuther, Claus, 23Wheeler, John, 194Whirlpool, 5, 42Windows NT (Microsoft), 24
Workflow Builder, 196Workflow (WF) module, 29workflow tools
described, 195–198tasks, 195–198
WorldCom, 23, 140
X
Xerox, 173XML (Extensible Markup Language)
described, 228e-commerce and, 211–212, 228–230
Y
Y2K (Year 2000) problem, 25, 198
Z
Zhang, Ivy, 142
Index
254