miro holecy global cto for transportation 31st may 2017
TRANSCRIPT

MiroHolecyGlobalCTOforTransportation
31st May2017

https://www.youtube.com/watch?v=K564rXrlZbc

TogetherforSaferRoadsDemonstration– CityofAtlanta,Georgia,USA
ImprovingRoadSafetyThroughAnalytics
Collision Risk Forecasting Alerts & Root Cause Analysis
1. Data Aggregation and Visibility: summarize collision findings from multiple data sources
2. Root Cause Identification: Determine the root causes that impact collision risk levels across the three dimensions. Examples include weather, traffic, infrastructure, driver profiles and neighborhood characteristics
3. Forecast Risk Indices/Warning Alerts: Develop models that predict risk levels for collisions locally through geospatial clustering models
Atlanta PoliceOfficers use warning alerts to understand
high risk collision areas
\
Traffic ControlTraffic engineers / IOC
managers will make road and traffic
changes to control vehicle throughput
Work Order and Inventory
Police Reports
911 Calls Fire and EMS Response
Census Data
Transit
Weather
Demographics
Geo-Spatial Cluster A: Low residential population, high traffic, frequent events
Risk Indices:•Rates of collisions per day•Severity of collisions•…
…
• Upcoming concert• Forecast of heavy rain
Construction
InclementWeather
Events
Root Causes
Example UsersUse Cases
5
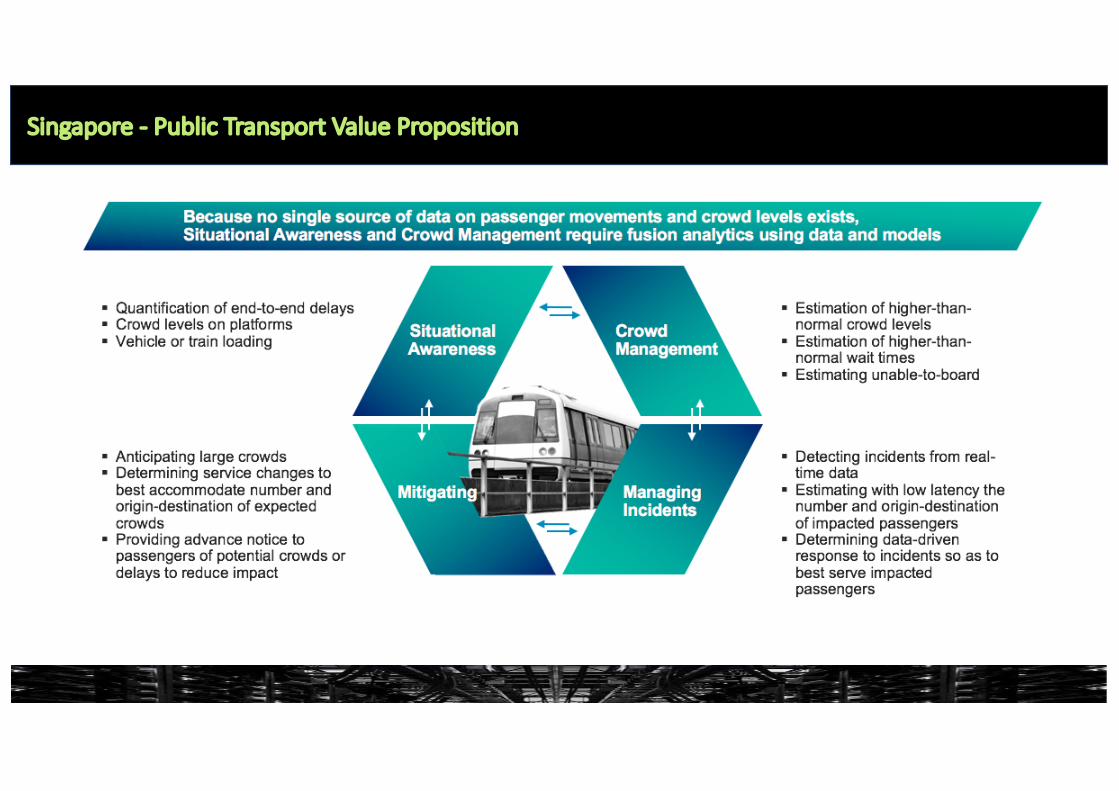
Singapore- PublicTransportValueProposition

Singapore– TransitEventManagementSolution

Singapore– TransitEventManagementSolution
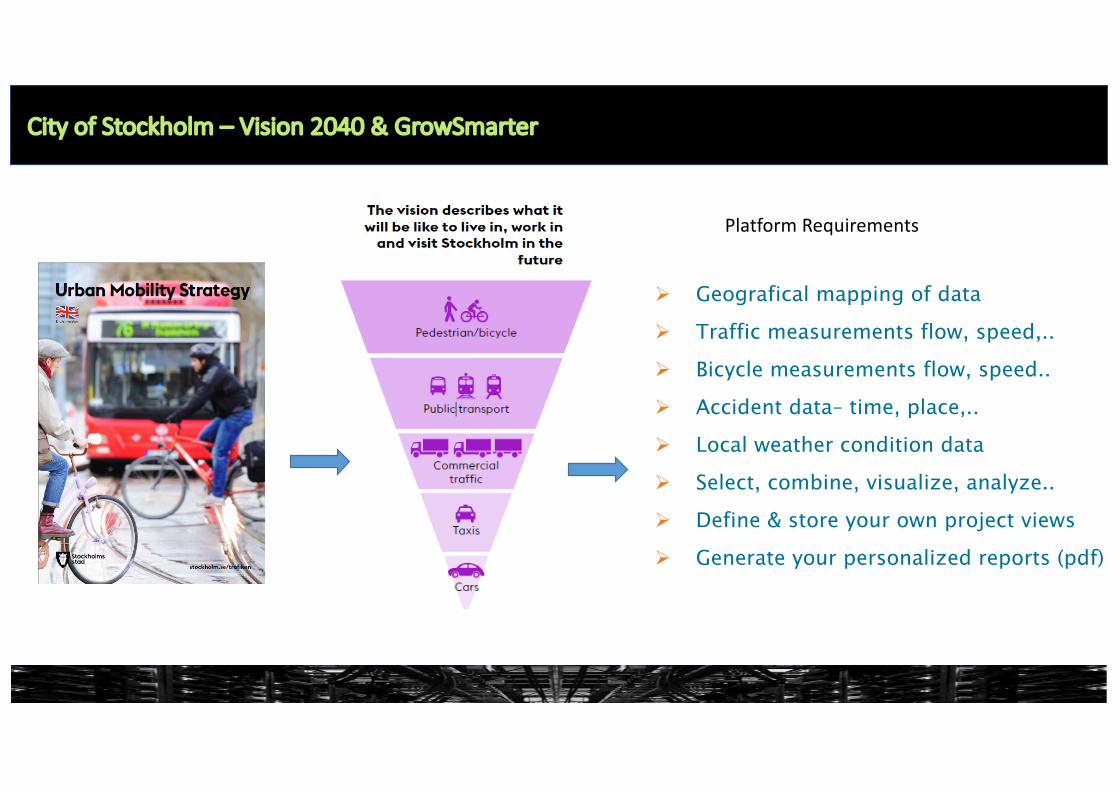
CityofStockholm– Vision2040&GrowSmarter
Ø Geografical mapping of data
Ø Traffic measurements flow, speed,..
Ø Bicycle measurements flow, speed..
Ø Accident data– time, place,..
Ø Local weather condition data
Ø Select, combine, visualize, analyze..
Ø Define & store your own project views
Ø Generate your personalized reports (pdf)
PlatformRequirements
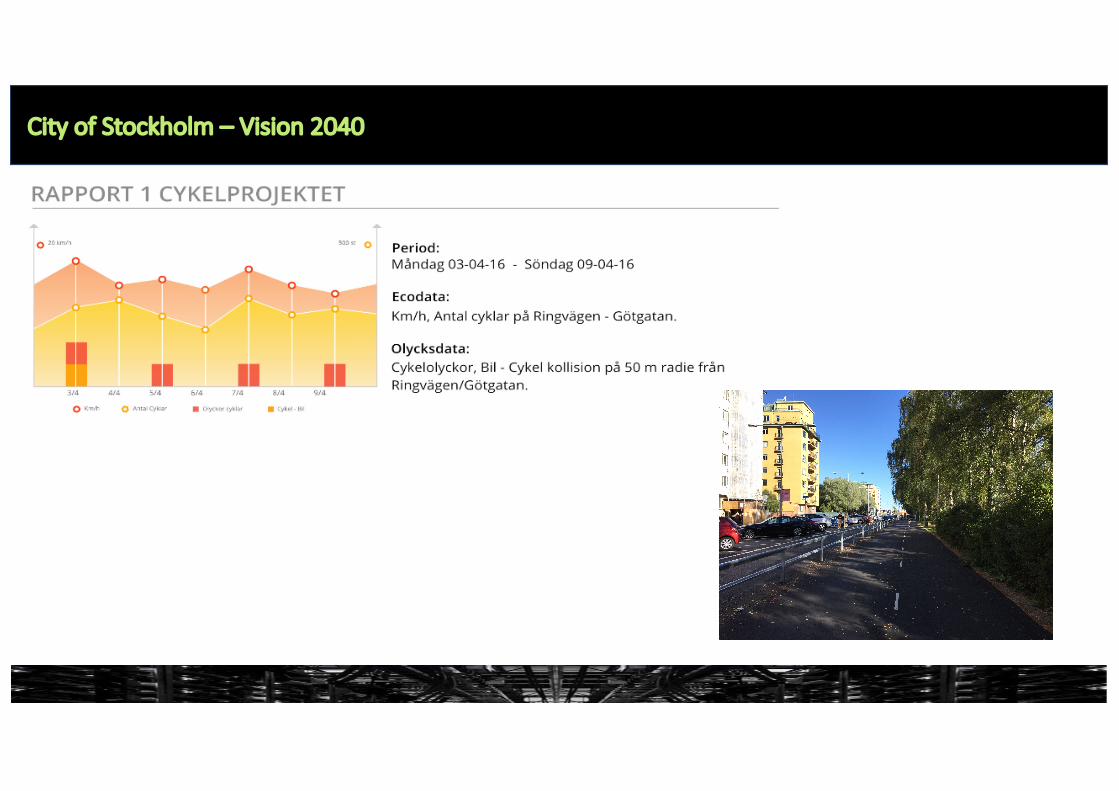
CityofStockholm– Vision2040

Co-created Methods
16
Thankyou!
Twitter@miroholecy