mips 2017- scoring: explanation and estimation transforming clinical practices initiative and the...
TRANSCRIPT

CMS Transforming Clinical Practices Initiative and
The Southern New England Practice Transformation Network (SNE PTN)
MIPS 2017- Scoring: Explanation and Estimation 2/7/2017 and 2/10/2017
2

Determine eligibility status
Pick Your Pace for the 2017 Transition Year
Choose to report as an individual or a group
Review available data submission methods
Visit the QPP website shopping cart and select measures for Quality and Improvement Activities
Confirm your EHR’s certification year and review associated Objectives and Measures
Review
2
Adapted from: CMS. “The Merit-based Incentive Program.” November 2016. PowerPoint presentation
Explain the scoring methods proposed for the Quality, Cost, Improvement Activities, and Advancing Care Information performance categories for the 2017 Transition Year
Apply the scoring methodology to a test practice example and calculate a MIPS performance score
Interpret the resultant MIPS performance score with respect to proposed payment adjustment categories
Agenda
3
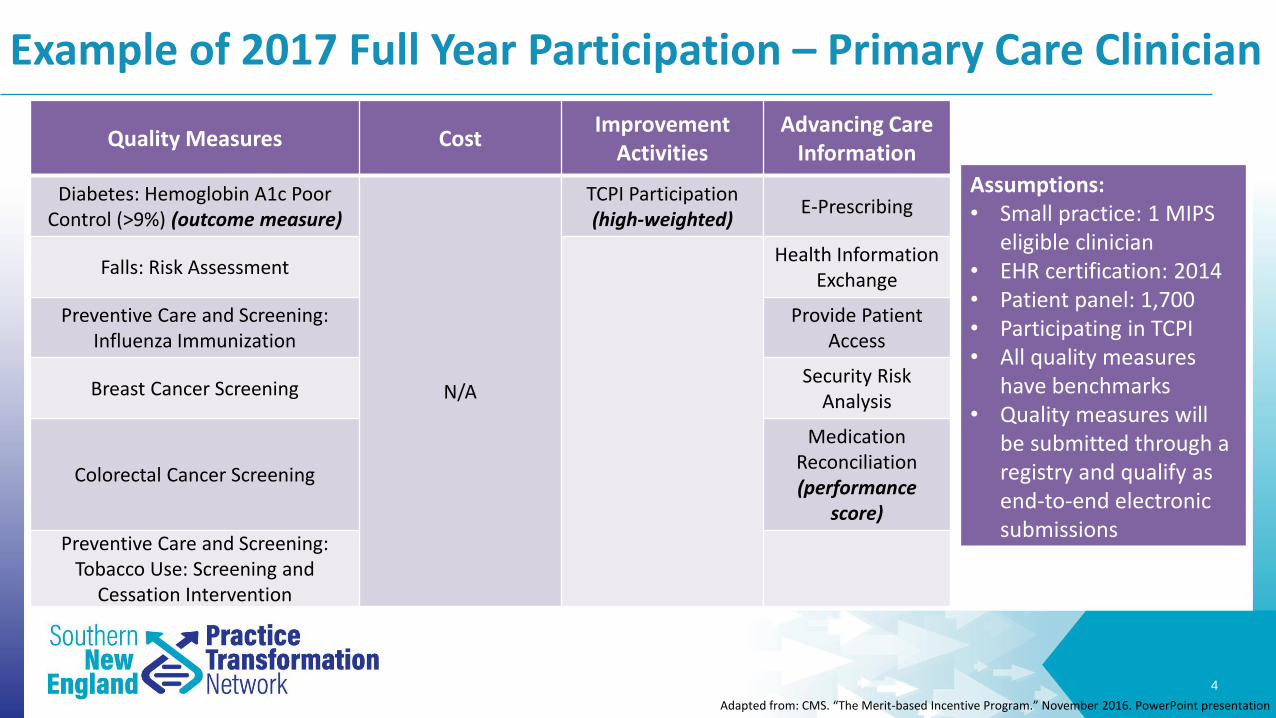
Example of 2017 Full Year Participation – Primary Care Clinician
4
Quality Measures CostImprovement
ActivitiesAdvancing Care
Information
Diabetes: Hemoglobin A1c Poor Control (>9%) (outcome measure)
N/A
TCPI Participation (high-weighted)
E-Prescribing
Falls: Risk AssessmentHealth Information
Exchange
Preventive Care and Screening: Influenza Immunization
Provide Patient Access
Breast Cancer ScreeningSecurity Risk
Analysis
Colorectal Cancer Screening
Medication Reconciliation (performance
score)
Preventive Care and Screening: Tobacco Use: Screening and
Cessation Intervention
Assumptions: • Small practice: 1 MIPS
eligible clinician• EHR certification: 2014• Patient panel: 1,700• Participating in TCPI • All quality measures
have benchmarks• Quality measures will
be submitted through a registry and qualify as end-to-end electronic submissions
Adapted from: CMS. “The Merit-based Incentive Program.” November 2016. PowerPoint presentation

Performance Category: Quality Measures (60%)
• Not submitting performance data for a measure will receive 0 points
• If no benchmark exists or case volume is not met – measure will receive 3 points
• Clinicians receive 3 to 10 points on each quality measure based on performance against benchmarks– Must also have sufficient case volume (≥
20) AND
– Data completeness met (50% of possible data submitted)
5
Adapted from: CMS. “The Merit-based Incentive Program.” November 2016. PowerPoint presentation

Performance Category: Quality Measures (60%)
6
Source: CMS. “2017 Quality Benchmarks.” December 29, 2016.
• Benchmarks presented in deciles, points awarded within each decile
• Separate benchmarks for the different data submission methods
Decile Number of Points Assigned for 2017 MIPS Performance Period
Below Decile 3Decile 3Decile 4Decile 5Decile 6Decile 7Decile 8Decile 9
Decile 10
3 points3 – 3.9 points4 – 4.9 points5 – 5.9 points6 – 6.9 points7 – 7.9 points8 – 8.9 points9 – 9.9 points
10 points
Topped out measures: performance rates historically have been high and may be scored differently in future years.

• Bonus points are available for either of the following:
1. Submitting an additional high-priority measure
o 2 points for each additional outcome and patient experience measure
o 1 point for each additional high-priority measure
2. Using CEHRT to submit measures to registries or CMS
o 1 point for submitting electronically end-to-end
Performance Category: Quality Measures (60%)
7
Adapted from: CMS. “The Merit-based Incentive Program.” November 2016. PowerPoint presentation

Performance Category: Quality Measures (60%)
8
DescriptionHigh
Priority (Y/N)
OutcomeMeasure
(Y/N)
Case Minimum Met (Y/N)
Points Based on
Performance
Total Possible Points
Bonus Points for High Priority
Bonus Points for
CEHRT
Diabetes: Hemoglobin A1c Poor Control (>9%)
Y Y Y 4 10 0 (required) 1
Falls: Risk Assessment Y N Y 3 10 1 1
Preventive Care and Screening: Influenza Immunization
N N Y 8 10 0 1
Breast Cancer Screening N N Y 7 10 0 1
Colorectal Cancer Screening N N Y 6 10 0 1
Preventive Care and Screening: Tobacco Use: Screening and Cessation Intervention
N N Y 9 10 0 1
Total Points 37 60 1 6
Total Quality Performance Category Score =(Points earned on required 6 quality measures) + (bonus points)
Maximum number of points(37+1+6)/60 = 73 points

Performance Category: Cost (0%)
• No reporting requirement –assessed through Medicare claims data
• CMS will provide feedback on how you performed in 2017 but it will not affect your 2019 payment adjustment
9
Source: CMS. “The Merit-based Incentive Program.” November 2016. PowerPoint presentation

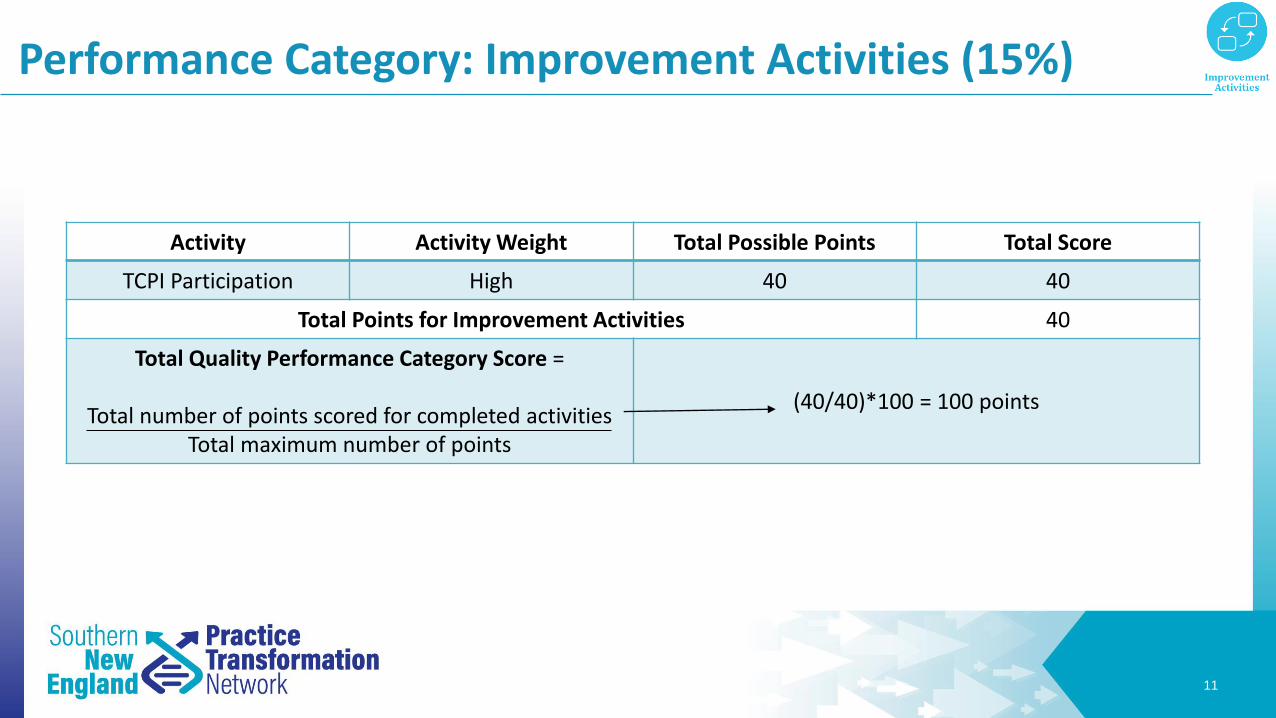
Performance Category: Improvement Activities (15%)
10
• 92 improvement activities are available
• Total points available = 40
– Small, rural, underserved practices• Medium Weight Activity = 20 points
• High Weight Activity = 40 points
– Large practices• Medium Weight Activity = 10 points
• High Weight Activity = 20 points
– Participants in certified PCMH = 40 points
Source: CMS. “The Merit-based Incentive Program.” November 2016. PowerPoint presentation
Performance Category: Improvement Activities (15%)
11
Activity Activity Weight Total Possible Points Total Score
TCPI Participation High 40 40
Total Points for Improvement Activities 40
Total Quality Performance Category Score =
Total number of points scored for completed activitiesTotal maximum number of points
(40/40)*100 = 100 points

• Can earn up to 155% but score will be capped at 100%
• Base Score = 50%– Required to receive a score in this category
– Submit yes/no and ≥ 1 in numerator
• Performance Score = Up to 90%– Based on performance rate for each measure
• Bonus Score = Up to 15%– 5% bonus for reporting to one of four Public
Health and Clinical Data Registry reporting measures
– 10% for using CEHRT to report certain improvement activities
12
Performance Category: Advancing Care Information (25%)
Source: CMS. “The Merit-based Incentive Program.” November 2016. PowerPoint presentation

Performance Category: Advancing Care Information (25%)
13
Adapted From: CMS. “The Merit-based Incentive Program.” November 2016. PowerPoint presentation

14
Performance Category: Advancing Care Information (25%)Measure Type Measure Name Met (Y/N) Score Relative Weight Total Score
Base Score
e-Prescribing Y
100% 50% 50%Health Information Exchange Y
Provide Patient Access Y
Security Risk Analysis Y
Performance Score Medication Reconciliation Completed for 1500/1700
patients**9% - 9%
Total Advancing Care Information Performance Category Score(Base Score) + (Performance Score) + (Bonus Score) = 50% + 9% + 0%
59%
**To calculate the performance score divide the numerator by the denominator to get the measures performance rate. Cross reference the performance rate with the table to the left to determine your percentage score 1500/1700 = 0.88 * 100 = 88 9%
Performance Rates for Each Measure Worth Up to 10%
Performance Rate 1-10 = 1%Performance Rate 11-20 = 2%Performance Rate 21-30 = 3%Performance Rate 31-40 = 4%Performance Rate 41-50 = 5%
Performance Rate 51-60 = 6%Performance Rate 61-70 = 7%Performance Rate 71-80 = 8%Performance Rate 81-90 = 9%Performance Rate 91-100 = 10%
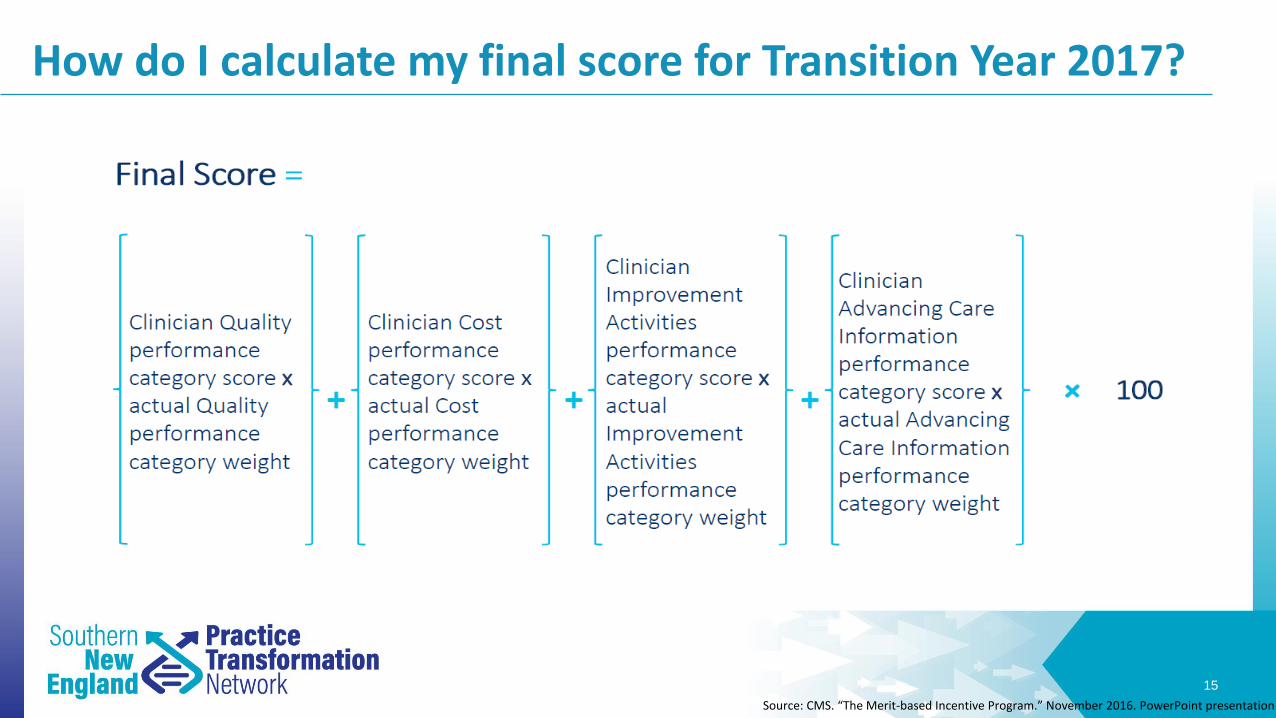
How do I calculate my final score for Transition Year 2017?
15
Source: CMS. “The Merit-based Incentive Program.” November 2016. PowerPoint presentation

How do I calculate my final score for Transition Year 2017?
Performance Category
Performance Category Score
or Rate
Category Weight
Estimated Points Earned
Quality 73 60% 43.8
Cost 0 0% 0
Improvement Activities
100 15% 15
Advancing Care Information
59 25% 14.8
Estimated MIPS Final Score
Estimated MIPS Final Score =43.8 + 0 + 15 + 14.8
73.6
16
Final Score
Payment Adjustment
≥ 70 points
• Positive adjustment• Eligible for exceptional
performance bonus –minimum of additional
0.5%
4 – 69 points
• Positive adjustment• Not eligible for exceptional
performance bonus
3 points
• Neutral payment adjustment
0 points
• Negative payment adjustment of -4%
• 0 points = does not participate
Adapted from: CMS. “Quality Payment Program Final Rule MLN Connects Call.” November 2016. PowerPoint presentation

Determine eligibility status
Pick Your Pace for the 2017 Transition Year
Choose to report as an individual or a group
Review available data submission methods
Visit the QPP website shopping cart and select measures for Quality and Improvement Activities
Confirm your EHR’s certification year and review associated Objectives and Measures
Apply the scoring methodology for the 4 performance categories
Interpret the final calculated score
Summary
17
Adapted from: CMS. “The Merit-based Incentive Program.” November 2016. PowerPoint presentation


Appendix
19
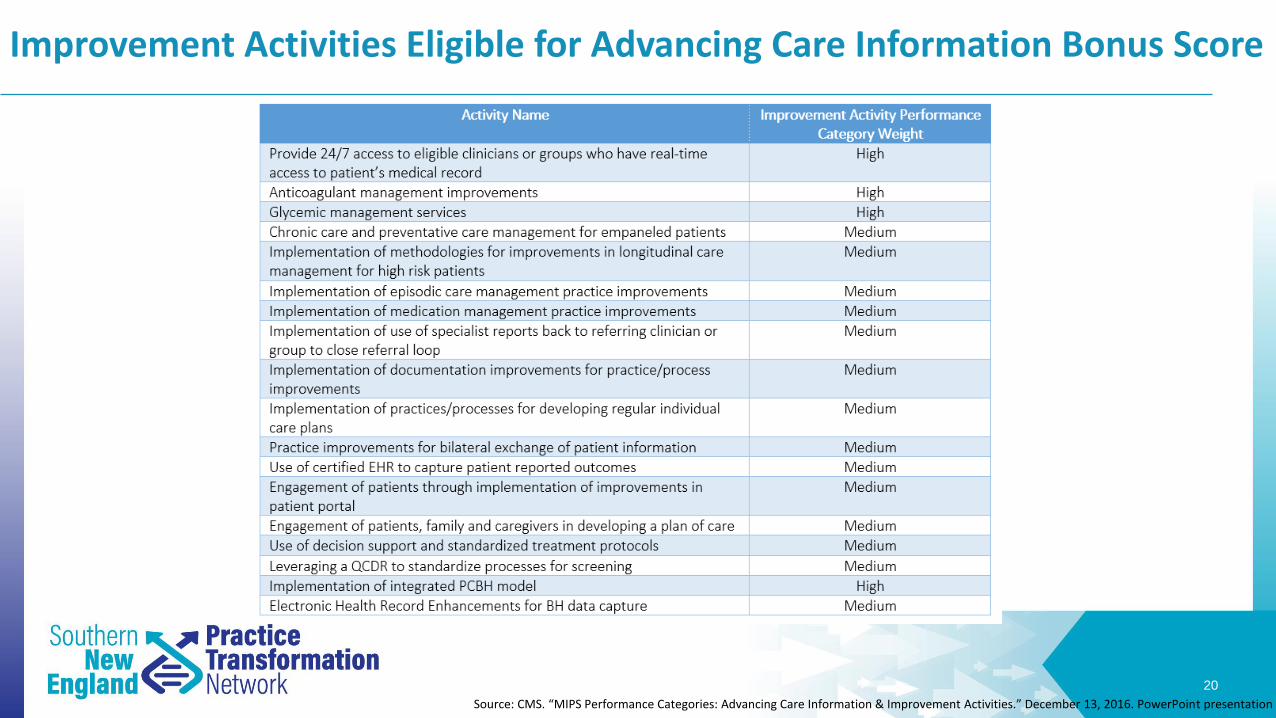
Improvement Activities Eligible for Advancing Care Information Bonus Score
20
Source: CMS. “MIPS Performance Categories: Advancing Care Information & Improvement Activities.” December 13, 2016. PowerPoint presentation