minutes of the education achievement council … of the education achievement council meeting...
TRANSCRIPT

Minutes of the Education Achievement Council October 22, 2015 ▪ 1
Minutes of the Education Achievement Council Meeting
October 22, 2015
BE IT REMEMBERED, that the Education Achievement Council (EAC) met in the Mississippi Institutions of Higher Learning Board Room in Jackson, Mississippi at 11:00 a.m. on October 22, 2015.
Council Members Present:
Mr. Milton Anderson, President, Mississippi Association of Proprietary Schools Dr. Kim Benton, representing Dr. Carey Wright, State Superintendent, Mississippi Department of Education Dr. Jim Borsig, President, Mississippi University for Women Dr. Glenn Boyce, Commissioner, Institutions of Higher Learning Mr. Lee Bush, Chair, Mississippi Community College Board Dr. William Bynum, President, Mississippi Valley State University, via teleconference Mr. David Case, representing Dr. Billy Stewart, President, East Central Community College Chairman Herb Frierson, Chairman, House of Representatives Appropriations Committee Dr. Deborah Gilbert, Interim Executive Director, Mississippi Community College Board Ms. Jane Hulon, representing Dr. Ronnie Nettles, President, Copiah-Lincoln Community College Chairman John Moore, Chairman, House of Representatives Education Committee Chairman John Polk, Chairman, Senate Universities and Colleges Committee Ms. Vickie Powell, representing Blake Wilson, President and CEO, Mississippi Economic Council Mr. C.D. Smith, Trustee, Institutions of Higher Learning, via teleconference Dr. Jesse Smith, President, Jones County Junior College
Council Members Absent:
Dr. Rodney Bennett, President, University of Southern Mississippi Chairman Eugene Clarke, Chairman, Senate Appropriations Committee Mr. Chip Crane, Board Member, Mississippi Community College Board Mr. Tom Duff, Trustee, Institutions of Higher Learning Dr. Harold Fisher, Executive Director, Mississippi Association of Independent Colleges and Universities Mr. Michael Jordan, Director, Division of Professional Development Mississippi Department of Mental Health Dr. John Kelley, Chairman, Mississippi Board of Education Chairman Nolan Mettetal, Chairman, House of Representatives Universities and Colleges Committee Dr. Laurie Smith, Education Policy Advisor, Office of Governor Phil Bryant Chairman Gray Tollison, Chairman, Senate Education Committee
Others Present:
Mr. Eric Atchison, Director of System Analysis and Research, Institutions of Higher Learning Ms. Caron Blanton, Director of Communications, Institutions of Higher Learning Dr. David Brooking, Director of Student Success Center, Mississippi University for Women

Minutes of the Education Achievement Council October 22, 2015 ▪ 2
Ms. Menia Dykes, Director of Accreditation, Institutions of Higher Learning Mr. Raul Fletes, Assistant Executive Director for Research and Effectiveness, Mississippi Community College Board Ms. Kim Gallaspy, Director of Legislative Services, Institutions of Higher Learning Ms. Mitzi Gendron, Director of Database Management, Institutions of Higher Learning Dr. Joan Haynes, Associate Executive Director for Academic and Student Affairs, Mississippi Community College Board Ms. Ercilla Hendrix, Economic Planner, Institutions of Higher Learning Dr. Susan Lee, Interim Associate Commissioner for Academic and Student Affairs, Institutions of Higher Learning Ms. Clotee Lewis, Coordinator of Public Affairs, Institutions of Higher Learning Dr. Shawn Mackey, Associate Executive Director for Workforce, Career and Technical Education, Mississippi Community College Board Dr. Jean Massey, Associate Superintendent, Mississippi Department of Education Mr. Kell Smith, Communications Director, Mississippi Community College Board Dr. Mark Taylor, Dean of Academic Affairs, Jones County Junior College Dr. Casey Turnage, Director of P-20 Initiatives and Enrollment Management, Institutions of Higher Learning Ms. Kim Verneuille, Director of Proprietary Schools, Mississippi Community College Board Mr. Lee Weiskopf, Policy Adviser, Office of Lt. Governor Tate Reeves
I. Welcome
Dr. Jesse Smith welcomed participants to the meeting and invited everyone to introduce themselves.
II. Approval of Minutes
Dr. Jim Borsig presented the minutes for approval. Chairman John Polk moved that the minutes be approved as presented. Dr. Glenn Boyce seconded the motion. The motion carried.
III. Report from meetings with nSPARC and Mississippi Association of Independent Colleges and Universities
Dr. Borsig provided a report from the meeting he and Dr. Smith had with Dr. Mimmo Parisi and the staff of nSPARC about the six year graduation rate report. The purpose of the report is to provide a clear picture of all credentials awarded in Mississippi. They discussed having nSPARC produce this report on an annual basis for the Education Achievement Council. The Council will have to define all of the parameters of the report and link nSPARC to the National Student Clearinghouse to identify students who transfer out of state.
Dr. Smith explained that as the EAC has gone about its work to develop an accurate measure of the number of degrees awarded, they realized there were missing pieces from the private institutions and proprietary schools. He and Dr. Borsig met with the Mississippi Association of Independent Colleges and Universities. They are supportive of adding their completion data to the public sector data. It will be included in next year’s report.

Minutes of the Education Achievement Council October 22, 2015 ▪ 3
IV. ACT Report on Condition of College and Career Readiness
Dr. Kim Benton presented an overview of the ACT and the plans for using the test going forward. This year, approximately 29,000 students took the ACT in their junior year. Information on student performance on the ACT will help inform instruction, planning and allocation of resources. MDE goal is for students to reach the benchmarks in English, math, reading and science, so that students can enter directly into credit-bearing courses at colleges and universities.
Dr. Jean Massey presented the results of the 2015 test taken by juniors. This is the first year that all juniors have taken the test. It is administered in March of the junior year. Results are returned before the end of the school year so that Principals, Counselors and Curriculum Coordinators can plan to help students improve as needed in the senior year.
A copy of the presentation is attached to these minutes.
V. Dual Credit/Dual Enrollment Report
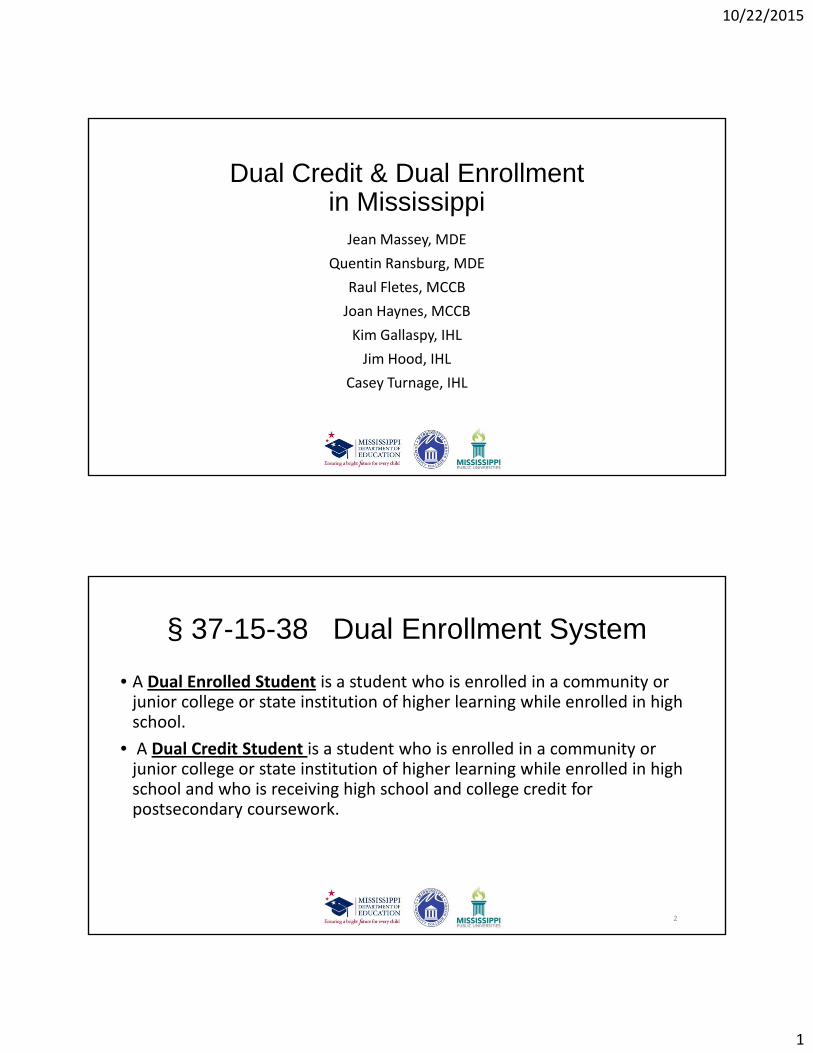
Dr. Casey Turnage explained the differences between dual enrollment and dual credit and the eligibility criteria to participate in both. She also described the responsibilities of the college/university and the local high school.
Dr. Jean Massey described the accountability model and its role in the increase in the number of students enrolled in dual credit programs. She presented headcount numbers for dual credit programs.
Mr. Raul Fletes presented Community College dual enrollment numbers including overall enrollment, enrollment by type of course – academic, technical or career; and the number of courses taken per student.
Dr. Jim Hood presented dual enrollment by high school sector. He also discussed challenges in analyzing data due to lack of access to private school data. Reporting of Social Security numbers is not required for students in MDE records, so matching to IHL and MCCB data is a challenge.
Chairman Moore asked if there is a reason why numbers are not greater in communities where colleges and universities are located. Dr. Massey noted that Rankin County has aggressively implemented policies to support dual enrollment/dual credit. They offer many courses during the school day taught by teachers who are already employed by the school district. Students have much greater access to dual enrollment/dual credit than other schools, so their participation rate is much higher.
Dr. Joan Haynes discussed next steps. Work will continue on matching MDE, MCCB and IHL data to identify the number of students who are enrolled in dual credit vs. dual enrollment. Information about the cost structure will be collected to better understand the differences in the cost of dual enrollment/dual credit by school.
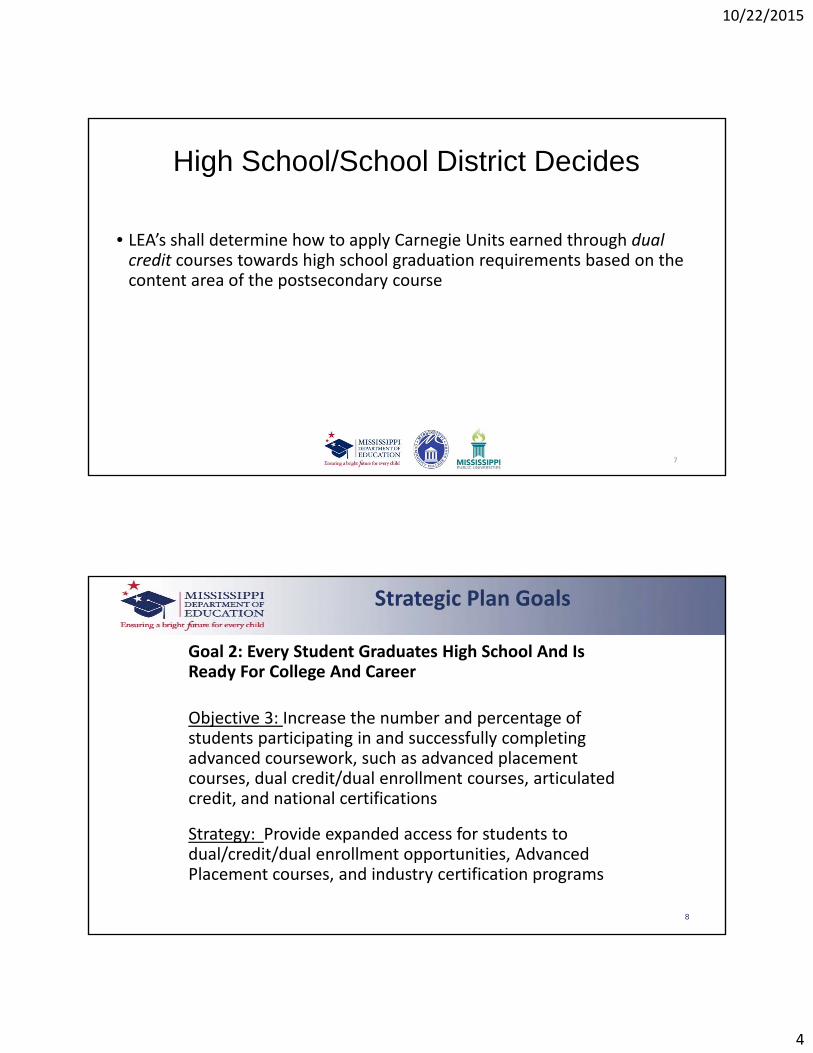
Dr. Haynes also discussed a recommendation that if state dollars are going to be set aside to support dual credit, the courses should be mapped back to the student’s academic map so that the courses apply toward their degree.

Minutes of the Education Achievement Council October 22, 2015 ▪ 4
Dr. Smith noted that dual credit/dual enrollment numbers are increasing at a rapid rate. All three sectors are working together to help students progress.
A copy of the presentation is attached to these minutes.
VI. Update from Non-financial Barriers Study Committee
Dr. Borsig gave a brief update on the work of the committee. Examining “good housekeeping” measures that help non-traditional students access and navigate colleges and universities. Looking at what can be done with prior-learning assessment and competency based learning and also course delivery methods that are more accessible to adult learners. Look at general education-type degrees that could be an on-ramp to non-traditional students who have some college.
Dr. Smith discussed looking at non-financial barriers that keep adult students from earning degrees. Dr. Hood’s research shows about 19,000 students who are over 25 had 30 or more hours. About 6,000 had 90 hours. Baseline numbers that will be a starting point to explore further by adding in MCCB data.
Committee will identify barriers and recommend best practices.
VII. Adoption of Annual Report Cards
Dr. Deborah Gilbert discussed the process of preparing the community college report cards. Data has been submitted to nSPARC and the request has been send to the SLDS Board to prepare the report. They expect to have them completed by the end of November.
Dr. Borsig asked Dr. Jim Hood to present the IHL report cards. Dr. Hood said the report cards have been reviewed by the IHL institutional research offices, chief academic officers and university presidents. They are ready for approval by the Council.
Chairman Moore moved approval of the IHL Report Cards. Lee Bush seconded the motion. The motion carried.
A copy of the IHL 2013-14 report cards is attached to these minutes.
VIII. Proposed 2016 Meeting Dates
The Education Achievement Council is scheduled to meet on the following dates in 2016: January 28 April 28 August 25 October 27 All meetings will begin at 11:00 a.m. in the IHL Board Room
IX. Other Business
Dr. Borsig discussed the longitudinal report prepared to show three years of changes in degree/credential production. Dr. Sean Mackey discussed stackable credentials and how community colleges are adopting

Minutes of the Education Achievement Council October 22, 2015 ▪ 5
policies to offer more programs where students can earn credentials of value. This accounts for differences in the community college numbers. A copy of the report is attached to these minutes.
X. Adjourn There being no further business, the meeting was adjourned.
1
Mississippi
ACT Preliminary Results for Juniors 2015
Education Achievement CouncilOctober 22, 2015
• Overview of the ACT
• Alignment with Board Goals and Post‐Secondary
Requirements
• Junior Class ACT results for 2014‐15
• State and District Strategies for Improvement
Discussion Topics

2
• Curriculum based assessment designed to measure the skills high school teachers teach and what instructors of entry‐level college courses expect
• Designed as a predictive measure, not as a content performance measure
• College admissions and placement test
• Primary components
– English, Math, Reading and Science Tests
– College Readiness Benchmark Scores
– Career Interest Inventory
– Course Patterns
What is the ACT?
All Students Proficient and Showing Growth in All Assessed Areas
Every Student Graduates High School and is Ready for College and Career
Every Child Has Access to a High-Quality Early Childhood Program
Every School Has Effective Teachers and Leaders
Every Community Effectively Using a World-Class Data System to Improve Student Outcomes
Mississippi Board of Education Strategic Plan Goals

3
Changes of model
Accountability Model
Reading Math OtherSubjects
Four YearGraduation
Rate
Acceleration College Readiness
Proficiency Proficiency Science Proficiency
All Student Rate
ParticipationProficiency
ACT
Growth All Students
Growth All Students
U.S. History Proficiency
70/30 Y160/40 Y250/50 Y3
Math 22 andReading 22
OrEnglish 18
Growth Lowest 25%
Growth Lowest 25%
Y1 15‐16Y2 16‐17Y3 17‐18
ACT College Benchmark Scores
College Readiness Benchmark Scores – A benchmark score is the minimum score needed on an ACT subject‐area test to indicate a 50% chance of obtaining a B or higher or about a 75% chance of obtaining a C or higher in the corresponding credit‐bearing college courses, which include English Composition, Algebra, Social Sciences and Biology.

4
ACT Sub‐scores less than the following require students to enroll in developmental education courses at both Community Colleges and Institutions of Higher Learning (IHL)
• English – 17
• Math – 19
Developmental Education
Mississippi College Admission
IHL POLICY 602BFull admission will be granted to the following:
(1) All students completing the College Preparatory Curriculum (CPC) with a minimum of a 3.20 high school GPA on the CPC; or
(2) All students completing the College Preparatory Curriculum (CPC) with
(a) a minimum of a 2.50 high school GPA on the CPC or a class rank in the top 50%, and (b) a score of
16 or higher on the ACT (Composite); or
(3) All students completing the College Preparatory Curriculum (CPC) with
(a) a minimum of a 2.00 high school GPA on the CPC and (b) a score of 18 or higher on the ACT (Composite)

5
ACT Statewide Preliminary Score Report for
Juniors 2014‐15
Year One ACT Composite Scoring Trends

6
Average ACT Score by Ethnicity
Percentage Juniors Meeting ACT Benchmarks

7
Gender Comparison
Score Ranges
8
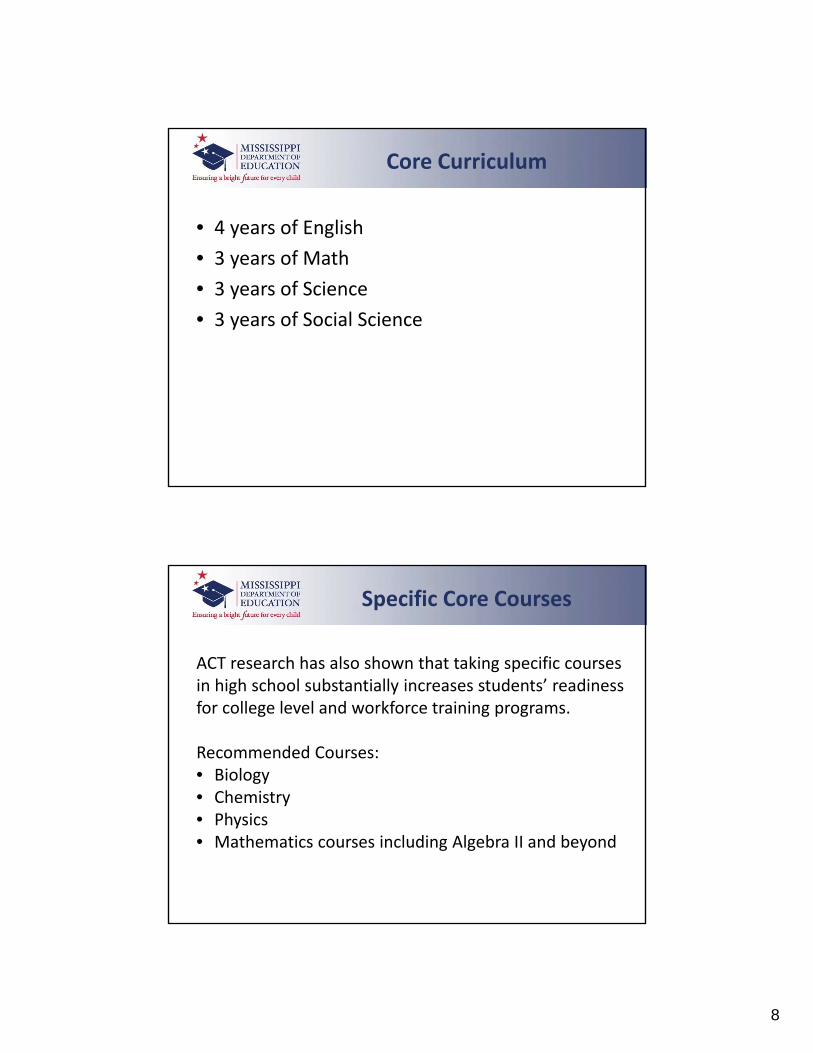
• 4 years of English
• 3 years of Math
• 3 years of Science
• 3 years of Social Science
Core Curriculum
ACT research has also shown that taking specific courses in high school substantially increases students’ readiness for college level and workforce training programs.
Recommended Courses:• Biology• Chemistry • Physics• Mathematics courses including Algebra II and beyond
Specific Core Courses

9
Core vs Non‐Core Course Completion
Course Patterns

10
Course Completion by Subgroups
Career Planning

11
Regional Trainings for District Administrative Teams
Team Members‐ Principals, Counselors, Curriculum Coordinators
Sessions will focus on how to use ACT data to:
– Determine senior year placement
– Evaluate rigor of classroom instruction
– Examine course taking sequences
– Assess achievement gaps among sub‐groups
– Proper use of Test‐Prep courses
– Coordination of middle and high school initiatives
– Determine student weaknesses and strengths around the ACT PLAN and ACT EXPLORE
– Implementation of SREB Math and Literacy Readiness
Improving ACT Scores in the State
• Offered only to Seniors who have an ACT sub‐score ranging from 15‐18
• Teachers must meet endorsement requirements
• To meet IHL postsecondary developmental requirements students must earn an 80 or above
• Acceptance by Community Colleges pending
• Readiness course meets:
– Carnegie Unit math graduation requirements– Carnegie Unit English graduation requirements– College Prep Curriculum IHL admission requirements
Mississippi’s SREB Readiness Courses

12
• Middle School Principal and Counselor Professional Development
• Pre‐AP and AP Expansion Efforts
• Dual Credit Opportunities
• SREB Senior Year Math Readiness Course
• SREB Senior Year Literacy Readiness Course
• Literacy Across the Content Areas Training for Teachers
• ACT Test‐Prep Instructional Practices
• Regional Professional Development Opportunities provided by ACT
Improving ACT Scores in the State
Dr. Kim Benton
Chief Academic Officer
Jean Massey
Executive Director, Office of Secondary Education
Program Contacts
10/22/2015
1
Dual Credit & Dual Enrollmentin Mississippi
Jean Massey MDEJean Massey, MDE
Quentin Ransburg, MDE
Raul Fletes, MCCB
Joan Haynes, MCCB
Kim Gallaspy, IHL
Jim Hood IHLJim Hood, IHL
Casey Turnage, IHL
§ 37-15-38 Dual Enrollment System
• A Dual Enrolled Student is a student who is enrolled in a community or ll f h h l h l ll d h hjunior college or state institution of higher learning while enrolled in high
school.
• A Dual Credit Student is a student who is enrolled in a community or junior college or state institution of higher learning while enrolled in high school and who is receiving high school and college credit for postsecondary coursework.p y
2

10/22/2015
2
• Dual Enroll course work appears on college transcript only
§ 37-15-38 Dual Enrollment System
• Dual Enroll – course work appears on college transcript only
• Dual Credit – course work appears on college transcript and high school transcript (credit in both places)
3
Option 1
• Minimum overall GPA of 3 0 on a 4 0 scale on all high school courses
CJC & IHL Academic Eligibility Criteria
• Minimum overall GPA of 3.0 on a 4.0 scale on all high school courses
and
• Successful completion of 14 core high school units and/or junior status
and
• Written recommendation from school principal or guidance counselor
4

10/22/2015
3
CJC & IHL Academic Eligibility CriteriaOption 2
Mi i ll GPA f 3 0 4 0 l ll hi h h l• Minimum overall GPA of 3.0 on a 4.0 scale on all high school courses
and
• A minimum composite ACT score of 30 or the equivalent SAT score
and
• Written recommendation from school principal or guidance counselor
5
College or University Decides
• Course pre‐requisites
• Placement (for college‐readiness)
• Instructor
• Teaching site
• Teaching schedule
• Tuition & fees (sometimes negotiable)
6
10/22/2015
4
High School/School District Decides
• LEA’s shall determine how to apply Carnegie Units earned through dual• LEA’s shall determine how to apply Carnegie Units earned through dual credit courses towards high school graduation requirements based on the content area of the postsecondary course
7
Goal 2: Every Student Graduates High School And Is Ready For College And Career
Strategic Plan Goals
Objective 3: Increase the number and percentage of students participating in and successfully completing advanced coursework, such as advanced placement courses, dual credit/dual enrollment courses, articulated credit, and national certifications
Strategy: Provide expanded access for students to dual/credit/dual enrollment opportunities, Advanced Placement courses, and industry certification programs
8

10/22/2015
5
Changes of model
Accountability Model
Reading Math OtherSubjects
Four YearGraduation
R t
Acceleration College Readiness
Rate
Proficiency Proficiency Science Proficiency
All Student Rate
ParticipationProficiency
ACT
Growth All Students
Growth All Students
U.S. History Proficiency
70/30 Y160/40 Y250/50 Y3
Math 22 andReading 22
OrEnglish 18
Growth Lowest 25%
Growth Lowest 25%
Y1 15-16Y2 16-17Y3 17-18
9
School DistrictDual Credit Numbers
• Student Headcounts from• Student Headcounts from • 2012‐13
• 2013‐14
• 2014‐15
10

10/22/2015
6
School District and High School Dual Credit Numbers
• Student Headcounts from• Student Headcounts from • 2012‐13
• 2013‐14
• 2014‐15
11
Dual Credit & Dual Enrollment
Enrollment DataAY2013 – AY2015
10/22/2015
7
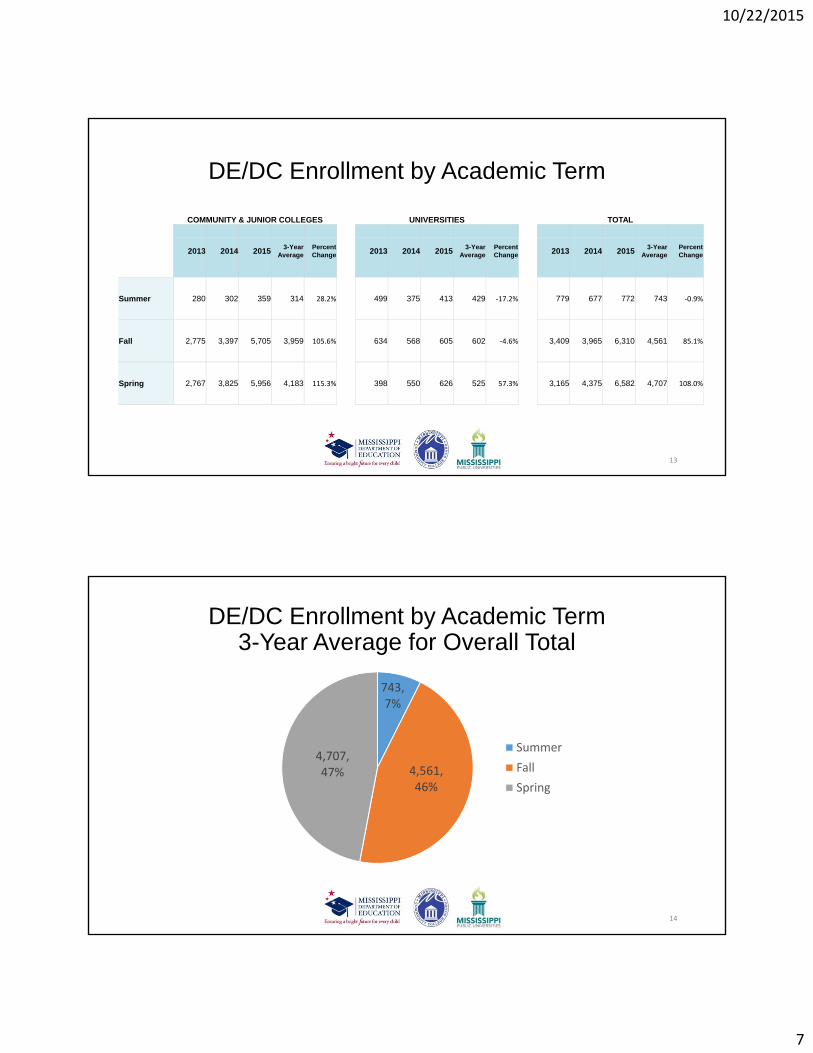
DE/DC Enrollment by Academic Term
COMMUNITY & JUNIOR COLLEGES UNIVERSITIES TOTAL
2013 2014 20153-Year
AveragePercent Change 2013 2014 2015
3-Year Average
Percent Change 2013 2014 2015
3-Year Average
Percent Change
Summer 280 302 359 314 28.2% 499 375 413 429 ‐17.2% 779 677 772 743 ‐0.9%
Fall 2,775 3,397 5,705 3,959 105.6% 634 568 605 602 ‐4.6% 3,409 3,965 6,310 4,561 85.1%
Spring 2,767 3,825 5,956 4,183 115.3% 398 550 626 525 57.3% 3,165 4,375 6,582 4,707 108.0%
13
DE/DC Enrollment by Academic Term3-Year Average for Overall Total
743, 7%
4,561, 46%
4,707, 47%
Summer
Fall
Spring
14

10/22/2015
8
DE/DC Enrollment by Course Type
COMMUNITY & JUNIOR COLLEGES UNIVERSITIES TOTAL
2013 2014 20153-Year
AveragePercent Change 2013 2014 2015
3-Year Average
Percent Change 2013 2014 2015
3-Year Average
Percent Change
Academic 9,121 11,339 17,761 12,740 94.7% 1,531 1,493 1,644 1,556 7.4% 10,652 12,832 19,405 14,296 82.2%
Technical 110 91 250 150 127.3% -- -- -- -- -- 110 91 250 150 127.3%
Career 139 149 125 138 ‐10.1% -- -- -- -- -- 139 149 125 138 ‐10.1%
All 9 370 11 579 18 136 13 028 93 6% 1 531 1 493 1 644 1 556 7 4% 10 901 13 072 19 780 14 584 81 5%All 9,370 11,579 18,136 13,028 93.6% 1,531 1,493 1,644 1,556 7.4% 10,901 13,072 19,780 14,584 81.5%
Note: University enrollment is limited to the Academic course type.
15
DE/DC Enrollment by Course Type3-Year Average for Overall Total
150, 1% 138, 1%
14 296 98%
Academic
Technical
14,296, 98% Career
16

10/22/2015
9
Number of DE/DC Classes Taken per Student
COMMUNITY & JUNIOR COLLEGES UNIVERSITIES TOTAL
2013 2014 20153-Year
AveragePercent Change 2013 2014 2015
3-Year Average
Percent Change 2013 2014 2015
3-Year Average
Percent Change
Classes Taken
9,370 11,579 18,136 13,028 93.6% 1,531 1,493 1,644 1,556 7.4% 10,901 13,072 19,780 14,584 81.5%
Students 4,103 5,194 8,083 5,793 97.0% 770 732 803 768 4.3% 4,873 5,926 8,886 6,562 82.4%
Classes per Student
2.3 2.2 2.2 2.2 2.0 2.0 2.0 2.0 2.2 2.2 2.2 2.2
17
DE/DC Enrollment by Academic DisciplineCOMMUNITY & JUNIOR COLLEGES UNIVERSITIES TOTAL
2013 2014 20153-Year
AveragePercent Change 2013 2014 2015
3-Year Average
Percent Change 2013 2014 2015
3-Year Average
Percent Change
Biology 1,224 1,211 1,930 1,455 57.7% 109 83 78 90 ‐28.4% 1,333 1,294 2,008 1,545 50.6%
Business 0 0 0 0 0.0% 17 25 45 29 164.7% 17 25 45 29 164.7%
Chemistry 0 0 0 0 0.0% 75 91 29 65 ‐61.3% 75 91 29 65 ‐61.3%
College Skills 253 252 223 243 ‐11.9% 0 0 0 0 0.0% 253 252 223 243 ‐11.9%
English 2,860 4,099 7,296 4,752 155.1% 436 511 643 530 47.5% 3,296 4,610 7,939 5,282 140.9%
History 831 1,041 1,683 1,185 102.5% 104 125 143 124 37.5% 935 1,166 1,826 1,309 95.3%
Languages 0 0 0 0 0.0% 78 55 84 72 7.7% 78 55 84 72 7.7%
Math 2,445 2,842 4,105 3,131 67.9% 334 284 267 295 ‐20.1% 2,779 3,126 4,372 3,426 57.3%
Nursing 74 53 35 54 ‐52.7% 0 0 0 0 0.0% 74 53 35 54 ‐52.7%
Psychology 377 419 528 441 40.1% 50 17 67 45 34.0% 427 436 595 486 39.3%
Speech 189 288 350 276 85.2% 63 45 46 51 ‐27.0% 252 333 396 327 57.1%
Other 1,117 1,374 1,986 1,492 77.8% 265 257 242 255 ‐8.7% 1,382 1,631 2,228 1,747 61.2%
18

10/22/2015
10
DE/DC Enrollment by Academic Discipline3-Year Average for Overall Total
3,426
5,282
Math
English
72
243
327
486
1,309
1,545
1,747
Languages
College Skills
Speech
Psychology
History
Biology
Other
29
54
65
72
Business
Nursing
Chemistry
Languages
19
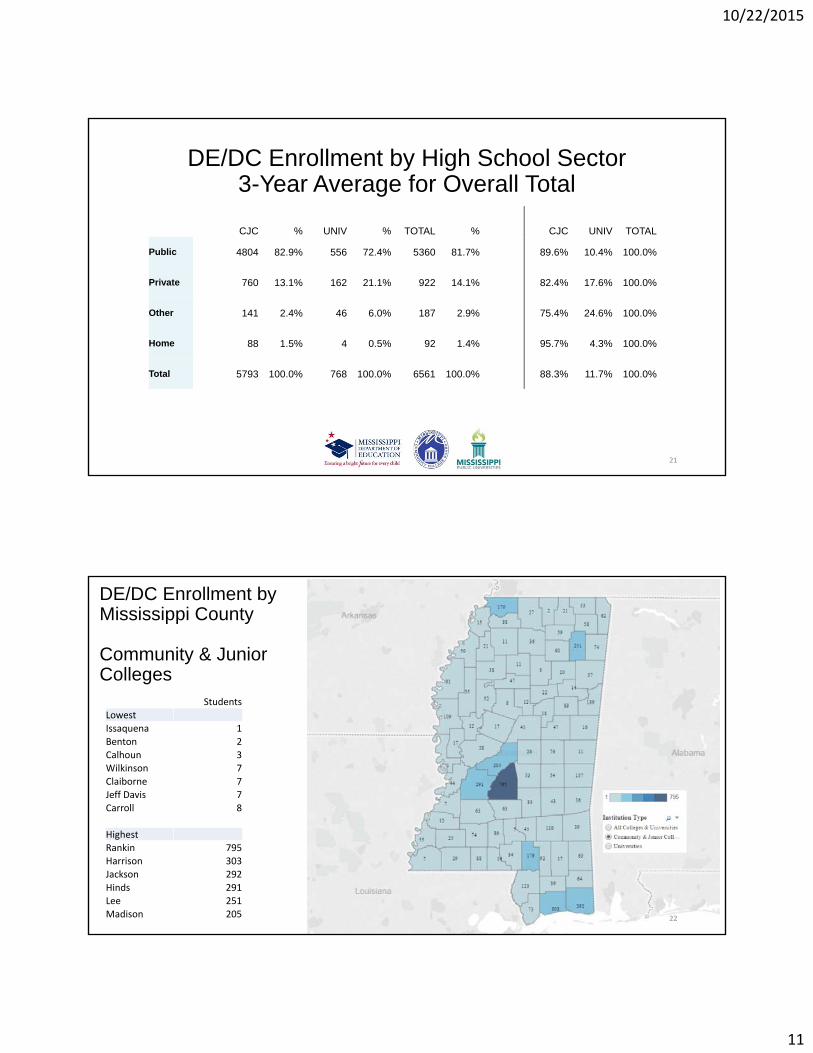
DE/DC Enrollment by High School Sector
COMMUNITY & JUNIOR COLLEGES UNIVERSITIES TOTAL
2013 2014 20153‐Year
AveragePercent Change
2013 2014 20153‐Year
AveragePercent Change
2013 2014 20153‐Year
AveragePercent Change
Public 3,234 4,269 6,910 4,804 113.7% 593 533 543 556 ‐8.4% 3,827 4,802 7,453 5,360 94.7%
Private 660 715 905 760 37.1% 140 140 207 162 47.9% 800 855 1,112 922 39.0%
Other 139 119 166 141 19.4% 36 56 45 46 25.0% 175 175 211 187 20.6%
H 70 91 102 88 45 7% 1 3 8 4 700 0% 71 94 110 92 54 9%Home 70 91 102 88 45.7% 1 3 8 4 700.0% 71 94 110 92 54.9%
Total 4,103 5,194 8,083 5,793 97.0% 770 732 803 768 4.3% 4,873 5,926 8,886 6,561 82.4%
20
10/22/2015
11
DE/DC Enrollment by High School Sector3-Year Average for Overall Total
CJC % UNIV % TOTAL % CJC UNIV TOTAL
Public 4804 82.9% 556 72.4% 5360 81.7% 89.6% 10.4% 100.0%
Private 760 13.1% 162 21.1% 922 14.1% 82.4% 17.6% 100.0%
Other 141 2.4% 46 6.0% 187 2.9% 75.4% 24.6% 100.0%
Home 88 1.5% 4 0.5% 92 1.4% 95.7% 4.3% 100.0%
Total 5793 100.0% 768 100.0% 6561 100.0% 88.3% 11.7% 100.0%
21
DE/DC Enrollment by Mississippi County
Community & Junior Colleges
StudentsLowest
Issaquena 1Benton 2Calhoun 3Wilkinson 7
Claiborne 7Jeff Davis 7Carroll 8
HighestRankin 795Harrison 303Jackson 292
Hinds 291Lee 251Madison 205 22

10/22/2015
12
DE/DC Enrollment by Mississippi County
Universities
StudentsLowestLowest Issaquena 0Kemper 0Sharkey 0Walthall 0Franklin 0Choctaw <1Scott <1Greene <1
HighestWashington 67Lee 50Bolivar 49Oktibbeha 40Desoto 36Lowndes 36Leflore 32 23
DE/DC Enrollment by Mississippi County
Total Combined
StudentsLLowest Issaquena 1Benton 3Wilkinson 8Jeff Davis 8Claiborne 9Calhoun 9
HighestHighestRankin 809Harrison 332Hinds 314Jackson 307Lee 301Madison 222Desoto 214 24

10/22/2015
13
Limitations of Data (currently)
• Dual Credit and Dual Enrollment cannot be completely t d d t i t h l d tseparated due to private school data
• Dual Credit can be determined for public high schools by matching with MDE data
• MDE uses a unique student identifier in their MSIS which will reduce matching accuracy
• Data on private postsecondary institutions is not available
25
Next Steps
• Match K‐12, MCCB, and IHL data (MOU in progress)
• Gather information about cost structures (Survey high schools)
• Recommend – If state dollars are going to be put into Dual Credit then the courses should be on student’s academic mapthe courses should be on student s academic map
26

Alcorn State University 1000 ASU Drive • Alcorn State, MS 39096 1‐800‐222‐6790 www.alcorn.edu
This Institution University System Average
Number Percent Number Percent
Student Enrollment
Total Headcount Enrollment Undergraduate Graduate & Professional
4,356 3,539 817
81.2% 18.8%
11,745 9,079 2,666
77.3% 22.7%
Total Full‐Time Equivalent (FTE) Enrollment Undergraduate Graduate & Professional
3,382 2,939 443
86.9% 13.1%
9,327 7,668 1,660
82.2% 17.8%
New Undergraduate Students (Percent of Total Undergraduates) Entering Freshmen Entering Transfers ‐ MS Community Colleges Entering Transfers ‐ All Other Institutions
977 606 202 169
27.6% 17.1% 5.7% 4.8%
2,666 1,459 843 364
29.4% 16.1% 9.3% 4.0%
Undergraduate Enrollment in High‐Need Disciplines Science, Technology, Engineering, Mathematics (STEM) Education (Including Non‐Teaching Areas) Nursing (All Undergraduate Levels)
956 167 179
27.0% 4.7% 5.1%
2,079 1,084 622
22.9% 11.9% 6.9%
Degrees Awarded
Undergraduate Degrees per 100 Undergraduate FTE Enrollment 15.1 ‐‐ 20.4 ‐‐
Total Degrees Awarded Certificate Associate Baccalaureate Graduate and Professional
588 0 54 404 130
0.0% 9.2% 68.7% 22.1%
2,086 11 12
1,502 561
0.5% 0.6% 72.0% 26.9%
Tuition and Financial Aid
Undergraduate Tuition (Fall and Spring terms) $6,108 ‐‐ $6,263 ‐‐ Room (Double Occupancy) and Board (Average Meal Plan) $7,804 ‐‐ $7,057 ‐‐
Total Undergraduate Scholarship and Financial Aid Dollars (in Millions) Average Financial Aid Award per Undergraduate Student Percent of Undergraduate Students Receiving Financial Aid Percent of Undergraduate Students Receiving Pell Grants
$20.9 $7,668
‐‐ ‐‐
‐‐ ‐‐
86% 77%
$42.1 $6,981
‐‐ ‐‐
‐‐ ‐‐
76% 43%
College Readiness
Average ACT Score of Entering Freshmen, Fall 2013 18.1 ‐‐ 22.4 ‐‐
Students Enrolled in One or More Intermediate Courses, Fall 2013 Students Enrolled in intermediate math during first year Students Enrolled in intermediate English/reading during first year Students Enrolled in both math and English/reading during first year
502 129 145 228
25.7% 28.9% 45.4%
419 202 96 121
48.2% 22.9% 28.9%
Fall 2011 intermediate math students completing math gateway course within 2 years Fall 2011 intermediate English students completing English gateway course within 2 years
‐‐ ‐‐
34.4% 56.5%
‐‐ ‐‐
44.1% 59.4%
Student Progress
Percent of full‐time students completing 24 credit hours within one academic year Percent of part‐time students completing 12 credit hours within one academic year
‐‐ ‐‐
60.2% 45.9%
‐‐ ‐‐
72.1% 48.7%
Percent of hours completed after one academic year, Fall 2013 through Summer 2014 Entering Freshmen Entering Transfers – All Institutions All Undergraduate Students
‐‐ ‐‐ ‐‐
83.0% 85.7% 81.4%
‐‐ ‐‐ ‐‐
87.3% 85.9% 89.5%
One‐Year Retention Rates for Entering Full‐Time Freshmen, Fall 2012 returning in Fall 2013
‐‐ 68.4% ‐‐ 77.3%
Student Graduation Rates
First‐time, full‐time Freshman Cohort, Fall 2006 540 1,064 Cohort students graduating within 4 years (100% of normal time) Cohort students graduating within 6 years (150% of normal time) Cohort students graduating within 8 years (200% of normal time)
79 170 184
14.6% 31.5% 34.1%
299 538 576
28.1% 50.5% 54.1%
Other University Variables
External Research Dollars – All Sources (in Millions), FY2013‐14 $14.1 ‐‐ $50.0 ‐‐ Student –Faculty Ratio, Fall 2013 17:1 ‐‐ 16:1 ‐‐ Percent of Full‐Time Instructional Faculty with Terminal Degree, Fall 2013 69.1% ‐‐ 77.7% ‐‐
2013‐14INSTITUTIONAL PROFILE

Delta State University 1003 West Sunflower Road • Cleveland, MS 38733 1‐800‐GOTO‐DSU www.deltastate.edu
This Institution University System Average
Number Percent Number Percent
Student Enrollment
Total Headcount Enrollment Undergraduate Graduate & Professional
6,121 3,059 3,062
50.0% 50.0%
11,745 9,079 2,666
77.3% 22.7%
Total Full‐Time Equivalent (FTE) Enrollment Undergraduate Graduate & Professional
3,718 2,410 1,308
64.8% 35.2%
9,327 7,668 1,660
82.2% 17.8%
New Undergraduate Students (Percent of Total Undergraduates) Entering Freshmen Entering Transfers ‐ MS Community Colleges Entering Transfers ‐ All Other Institutions
1,190 418 526 246
38.9% 13.7% 17.2% 8.0%
2,666 1,459 843 364
29.4% 16.1% 9.3% 4.0%
Undergraduate Enrollment in High‐Need Disciplines Science, Technology, Engineering, Mathematics (STEM) Education (Including Non‐Teaching Areas) Nursing (All Undergraduate Levels)
324 608 95
10.6% 19.9% 3.1%
2,079 1,084 622
22.9% 11.9% 6.9%
Degrees Awarded
Undergraduate Degrees per 100 Undergraduate FTE Enrollment 17.7 ‐‐ 20.4 ‐‐
Total Degrees Awarded Certificate Associate Baccalaureate Graduate and Professional
808 0 0
438 370
0.0% 0.0% 54.2% 45.8%
2,086 11 12
1,502 561
0.5% 0.6% 72.0% 26.9%
Tuition and Financial Aid
Undergraduate Tuition (Fall and Spring terms) $6,012 ‐‐ $6,263 ‐‐ Room (Double Occupancy) and Board (Average Meal Plan) $6,204 ‐‐ $7,057 ‐‐
Total Undergraduate Scholarship and Financial Aid Dollars (in Millions) Average Financial Aid Award per Undergraduate Student Percent of Undergraduate Students Receiving Financial Aid Percent of Undergraduate Students Receiving Pell Grants
$10.3 $5,296
‐‐ ‐‐
‐‐ ‐‐
74% 45%
$42.1 $6,981
‐‐ ‐‐
‐‐ ‐‐
76% 43%
College Readiness
Average ACT Score of Entering Freshmen, Fall 2013 20.3 ‐‐ 22.4 ‐‐
Students Enrolled in One or More Intermediate Courses, Fall 2013 Students Enrolled in intermediate math during first year Students Enrolled in intermediate English/reading during first year Students Enrolled in both math and English/reading during first year
140 44 48 48
31.4% 34.3% 34.3%
419 202 96 121
48.2% 22.9% 28.9%
Fall 2011 intermediate math students completing math gateway course within 2 years Fall 2011 intermediate English students completing English gateway course within 2 years
‐‐ ‐‐
22.4% 52.5%
‐‐ ‐‐
44.1% 59.4%
Student Progress
Percent of full‐time students completing 24 credit hours within one academic year Percent of part‐time students completing 12 credit hours within one academic year
‐‐ ‐‐
68.8% 23.6%
‐‐ ‐‐
72.1% 48.7%
Percent of hours completed after one academic year, Fall 2013 through Summer 2014 Entering Freshmen Entering Transfers – All Institutions All Undergraduate Students
‐‐ ‐‐ ‐‐
74.8% 83.0% 85.1%
‐‐ ‐‐ ‐‐
87.3% 85.9% 89.5%
One‐Year Retention Rates for Entering Full‐Time Freshmen, Fall 2012 returning in Fall 2013
‐‐ 66.1% ‐‐ 77.3%
Student Graduation Rates
First‐time, full‐time Freshman Cohort, Fall 2006 468 1,064 Cohort students graduating within 4 years (100% of normal time) Cohort students graduating within 6 years (150% of normal time) Cohort students graduating within 8 years (200% of normal time)
85 173 187
18.2% 37.0% 40.0%
299 538 576
28.1% 50.5% 54.1%
Other University Variables
External Research Dollars – All Sources (in Millions), FY2013‐14 $4.3 ‐‐ $50.0 ‐‐ Student –Faculty Ratio, Fall 2013 18:1 ‐‐ 16:1 ‐‐ Percent of Full‐Time Instructional Faculty with Terminal Degree, Fall 2013 65.6% ‐‐ 77.7% ‐‐
2013‐14INSTITUTIONAL PROFILE

Jackson State University 1400 Lynch Street • Jackson, MS 39217 1‐800‐848‐6817 www.jsums.edu
This Institution University System Average
Number Percent Number Percent
Student Enrollment
Total Headcount Enrollment Undergraduate Graduate & Professional
10,753 8,040 2,713
74.8% 25.2%
11,745 9,079 2,666
77.3% 22.7%
Total Full‐Time Equivalent (FTE) Enrollment Undergraduate Graduate & Professional
8,159 6,639 1,520
81.4% 18.6%
9,327 7,668 1,660
82.2% 17.8%
New Undergraduate Students (Percent of Total Undergraduates) Entering Freshmen Entering Transfers ‐ MS Community Colleges Entering Transfers ‐ All Other Institutions
2,237 1,190 649 398
27.8% 14.8% 8.1% 5.0%
2,666 1,459 843 364
29.4% 16.1% 9.3% 4.0%
Undergraduate Enrollment in High‐Need Disciplines Science, Technology, Engineering, Mathematics (STEM) Education (Including Non‐Teaching Areas) Nursing (All Undergraduate Levels)
1,967 1,541 ‐‐
24.5% 19.2% ‐‐
2,079 1,084 622
22.9% 11.9% 6.9%
Degrees Awarded
Undergraduate Degrees per 100 Undergraduate FTE Enrollment 17.4 ‐‐ 20.4 ‐‐
Total Degrees Awarded Certificate Associate Baccalaureate Graduate and Professional
1,605 0 0
1,093 512
0.0% 0.0% 68.1% 31.9%
2,086 11 12
1,502 561
0.5% 0.6% 72.0% 26.9%
Tuition and Financial Aid
Undergraduate Tuition (Fall and Spring terms) $6,348 ‐‐ $6,263 ‐‐ Room (Double Occupancy) and Board (Average Meal Plan) $7,391 ‐‐ $7,057 ‐‐
Total Undergraduate Scholarship and Financial Aid Dollars (in Millions) Average Financial Aid Award per Undergraduate Student Percent of Undergraduate Students Receiving Financial Aid Percent of Undergraduate Students Receiving Pell Grants
$39.7 $7,246
‐‐ ‐‐
‐‐ ‐‐
79% 66%
$42.1 $6,981
‐‐ ‐‐
‐‐ ‐‐
76% 43%
College Readiness
Average ACT Score of Entering Freshmen, Fall 2013 19.0 ‐‐ 22.4 ‐‐
Students Enrolled in One or More Intermediate Courses, Fall 2013 Students Enrolled in intermediate math during first year Students Enrolled in intermediate English/reading during first year Students Enrolled in both math and English/reading during first year
660 215 207 238
32.6% 31.4% 36.1%
419 202 96 121
48.2% 22.9% 28.9%
Fall 2011 intermediate math students completing math gateway course within 2 years Fall 2011 intermediate English students completing English gateway course within 2 years
‐‐ ‐‐
46.3% 68.2%
‐‐ ‐‐
44.1% 59.4%
Student Progress
Percent of full‐time students completing 24 credit hours within one academic year Percent of part‐time students completing 12 credit hours within one academic year
‐‐ ‐‐
60.2% 58.3%
‐‐ ‐‐
72.1% 48.7%
Percent of hours completed after one academic year, Fall 2013 through Summer 2014 Entering Freshmen Entering Transfers – All Institutions All Undergraduate Students
‐‐ ‐‐ ‐‐
81.1% 79.3% 81.2%
‐‐ ‐‐ ‐‐
87.3% 85.9% 89.5%
One‐Year Retention Rates for Entering Full‐Time Freshmen, Fall 2012 returning in Fall 2013
‐‐ 75.5% ‐‐ 77.3%
Student Graduation Rates
First‐time, full‐time Freshman Cohort, Fall 2006 889 1,064 Cohort students graduating within 4 years (100% of normal time) Cohort students graduating within 6 years (150% of normal time) Cohort students graduating within 8 years (200% of normal time)
191 401 483
21.5% 45.1% 54.3%
299 538 576
28.1% 50.5% 54.1%
Other University Variables
External Research Dollars – All Sources (in Millions), FY2013‐14 $28.4 ‐‐ $50.0 ‐‐ Student –Faculty Ratio, Fall 2013 15:1 ‐‐ 16:1 ‐‐ Percent of Full‐Time Instructional Faculty with Terminal Degree, Fall 2013 79.5% ‐‐ 77.7% ‐‐
2013‐14INSTITUTIONAL PROFILE

Mississippi State University P.O. Box 9700 • Mississippi State, MS 39762 1‐662‐325‐2224 www.msstate.edu
This Institution University System Average
Number Percent Number Percent
Student Enrollment
Total Headcount Enrollment Undergraduate Graduate & Professional
22,950 18,220 4,730
79.4% 20.6%
11,745 9,079 2,666
77.3% 22.7%
Total Full‐Time Equivalent (FTE) Enrollment Undergraduate Graduate & Professional
18,725 15,613 3,112
83.4% 16.6%
9,327 7,668 1,660
82.2% 17.8%
New Undergraduate Students (Percent of Total Undergraduates) Entering Freshmen Entering Transfers ‐ MS Community Colleges Entering Transfers ‐ All Other Institutions
5,262 3,221 1,505 536
28.9% 17.7% 8.3% 2.9%
2,666 1,459 843 364
29.4% 16.1% 9.3% 4.0%
Undergraduate Enrollment in High‐Need Disciplines Science, Technology, Engineering, Mathematics (STEM) Education (Including Non‐Teaching Areas) Nursing (All Undergraduate Levels)
6,423 3,049 ‐‐
35.3% 16.7% ‐‐
2,079 1,084 622
22.9% 11.9% 6.9%
Degrees Awarded
Undergraduate Degrees per 100 Undergraduate FTE Enrollment 21.0 ‐‐ 20.4 ‐‐
Total Degrees Awarded Certificate Associate Baccalaureate Graduate and Professional
4,315 0 0
3,255 1,060
0.0% 0.0% 75.4% 24.6%
2,086 11 12
1,502 561
0.5% 0.6% 72.0% 26.9%
Tuition and Financial Aid
Undergraduate Tuition (Fall and Spring terms) $6,672 ‐‐ $6,263 ‐‐ Room (Double Occupancy) and Board (Average Meal Plan) $7,370 ‐‐ $7,057 ‐‐
Total Undergraduate Scholarship and Financial Aid Dollars (in Millions) Average Financial Aid Award per Undergraduate Student Percent of Undergraduate Students Receiving Financial Aid Percent of Undergraduate Students Receiving Pell Grants
$91.0 $7,155
‐‐ ‐‐
‐‐ ‐‐
78% 33%
$42.1 $6,981
‐‐ ‐‐
‐‐ ‐‐
76% 43%
College Readiness
Average ACT Score of Entering Freshmen, Fall 2013 23.9 ‐‐ 22.4 ‐‐
Students Enrolled in One or More Intermediate Courses, Fall 2013 Students Enrolled in intermediate math during first year Students Enrolled in intermediate English/reading during first year Students Enrolled in both math and English/reading during first year
345 180 118 47
52.2% 34.2% 13.6%
419 202 96 121
48.2% 22.9% 28.9%
Fall 2011 intermediate math students completing math gateway course within 2 years Fall 2011 intermediate English students completing English gateway course within 2 years
‐‐ ‐‐
61.0% 51.7%
‐‐ ‐‐
44.1% 59.4%
Student Progress
Percent of full‐time students completing 24 credit hours within one academic year Percent of part‐time students completing 12 credit hours within one academic year
‐‐ ‐‐
75.2% 56.8%
‐‐ ‐‐
72.1% 48.7%
Percent of hours completed after one academic year, Fall 2013 through Summer 2014 Entering Freshmen Entering Transfers – All Institutions All Undergraduate Students
‐‐ ‐‐ ‐‐
89.7% 89.3% 93.2%
‐‐ ‐‐ ‐‐
87.3% 85.9% 89.5%
One‐Year Retention Rates for Entering Full‐Time Freshmen, Fall 2012 returning in Fall 2013
‐‐ 78.5% ‐‐ 77.3%
Student Graduation Rates
First‐time, full‐time Freshman Cohort, Fall 2006 1,897 1,064 Cohort students graduating within 4 years (100% of normal time) Cohort students graduating within 6 years (150% of normal time) Cohort students graduating within 8 years (200% of normal time)
575 1,097 1,173
30.3% 57.8% 61.8%
299 538 576
28.1% 50.5% 54.1%
Other University Variables
External Research Dollars – All Sources (in Millions), FY2013‐14 $142.9 ‐‐ $50.0 ‐‐ Student –Faculty Ratio, Fall 2013 19:1 ‐‐ 16:1 ‐‐ Percent of Full‐Time Instructional Faculty with Terminal Degree, Fall 2013 79.8% ‐‐ 77.7% ‐‐
2013‐14INSTITUTIONAL PROFILE
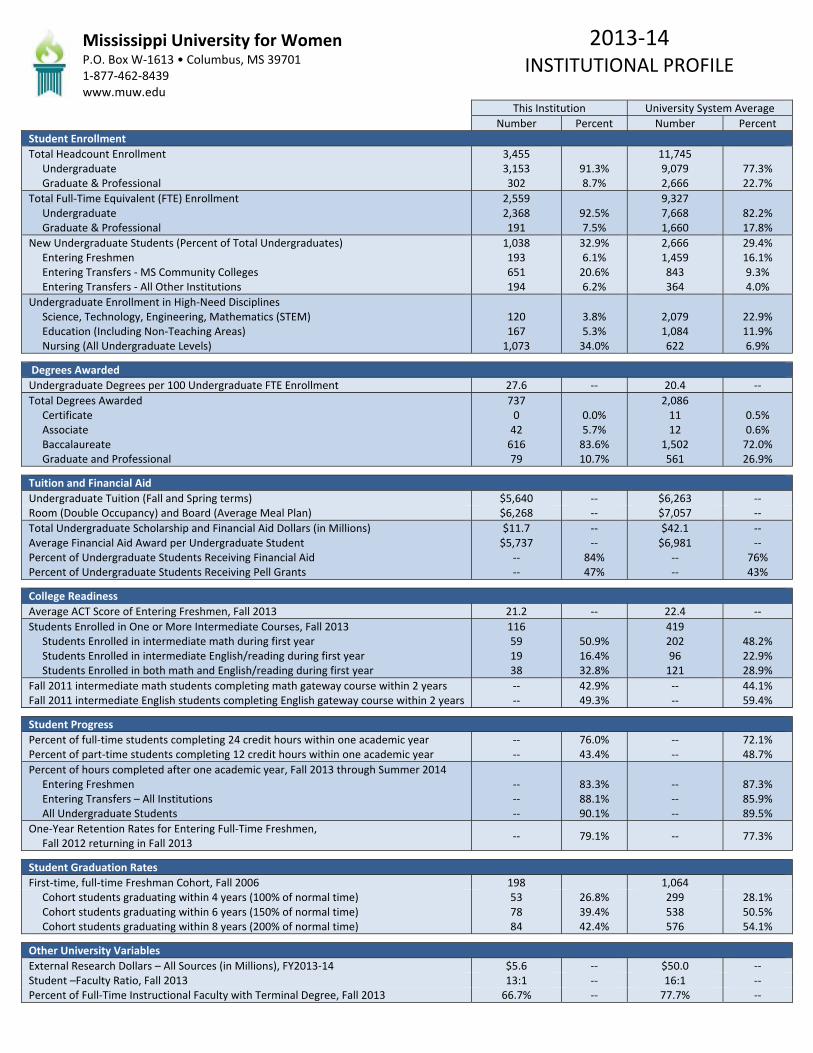
Mississippi University for Women P.O. Box W‐1613 • Columbus, MS 39701 1‐877‐462‐8439 www.muw.edu
This Institution University System Average
Number Percent Number Percent
Student Enrollment
Total Headcount Enrollment Undergraduate Graduate & Professional
3,455 3,153 302
91.3% 8.7%
11,745 9,079 2,666
77.3% 22.7%
Total Full‐Time Equivalent (FTE) Enrollment Undergraduate Graduate & Professional
2,559 2,368 191
92.5% 7.5%
9,327 7,668 1,660
82.2% 17.8%
New Undergraduate Students (Percent of Total Undergraduates) Entering Freshmen Entering Transfers ‐ MS Community Colleges Entering Transfers ‐ All Other Institutions
1,038 193 651 194
32.9% 6.1% 20.6% 6.2%
2,666 1,459 843 364
29.4% 16.1% 9.3% 4.0%
Undergraduate Enrollment in High‐Need Disciplines Science, Technology, Engineering, Mathematics (STEM) Education (Including Non‐Teaching Areas) Nursing (All Undergraduate Levels)
120 167 1,073
3.8% 5.3% 34.0%
2,079 1,084 622
22.9% 11.9% 6.9%
Degrees Awarded
Undergraduate Degrees per 100 Undergraduate FTE Enrollment 27.6 ‐‐ 20.4 ‐‐
Total Degrees Awarded Certificate Associate Baccalaureate Graduate and Professional
737 0 42 616 79
0.0% 5.7% 83.6% 10.7%
2,086 11 12
1,502 561
0.5% 0.6% 72.0% 26.9%
Tuition and Financial Aid
Undergraduate Tuition (Fall and Spring terms) $5,640 ‐‐ $6,263 ‐‐ Room (Double Occupancy) and Board (Average Meal Plan) $6,268 ‐‐ $7,057 ‐‐
Total Undergraduate Scholarship and Financial Aid Dollars (in Millions) Average Financial Aid Award per Undergraduate Student Percent of Undergraduate Students Receiving Financial Aid Percent of Undergraduate Students Receiving Pell Grants
$11.7 $5,737
‐‐ ‐‐
‐‐ ‐‐
84% 47%
$42.1 $6,981
‐‐ ‐‐
‐‐ ‐‐
76% 43%
College Readiness
Average ACT Score of Entering Freshmen, Fall 2013 21.2 ‐‐ 22.4 ‐‐
Students Enrolled in One or More Intermediate Courses, Fall 2013 Students Enrolled in intermediate math during first year Students Enrolled in intermediate English/reading during first year Students Enrolled in both math and English/reading during first year
116 59 19 38
50.9% 16.4% 32.8%
419 202 96 121
48.2% 22.9% 28.9%
Fall 2011 intermediate math students completing math gateway course within 2 years Fall 2011 intermediate English students completing English gateway course within 2 years
‐‐ ‐‐
42.9% 49.3%
‐‐ ‐‐
44.1% 59.4%
Student Progress
Percent of full‐time students completing 24 credit hours within one academic year Percent of part‐time students completing 12 credit hours within one academic year
‐‐ ‐‐
76.0% 43.4%
‐‐ ‐‐
72.1% 48.7%
Percent of hours completed after one academic year, Fall 2013 through Summer 2014 Entering Freshmen Entering Transfers – All Institutions All Undergraduate Students
‐‐ ‐‐ ‐‐
83.3% 88.1% 90.1%
‐‐ ‐‐ ‐‐
87.3% 85.9% 89.5%
One‐Year Retention Rates for Entering Full‐Time Freshmen, Fall 2012 returning in Fall 2013
‐‐ 79.1% ‐‐ 77.3%
Student Graduation Rates
First‐time, full‐time Freshman Cohort, Fall 2006 198 1,064 Cohort students graduating within 4 years (100% of normal time) Cohort students graduating within 6 years (150% of normal time) Cohort students graduating within 8 years (200% of normal time)
53 78 84
26.8% 39.4% 42.4%
299 538 576
28.1% 50.5% 54.1%
Other University Variables
External Research Dollars – All Sources (in Millions), FY2013‐14 $5.6 ‐‐ $50.0 ‐‐ Student –Faculty Ratio, Fall 2013 13:1 ‐‐ 16:1 ‐‐ Percent of Full‐Time Instructional Faculty with Terminal Degree, Fall 2013 66.7% ‐‐ 77.7% ‐‐
2013‐14INSTITUTIONAL PROFILE

Mississippi Valley State University 14000 Highway 82 West • Itta Bena, MS 38941 1‐800‐844‐6885 www.mvsu.edu
This Institution University System Average
Number Percent Number Percent
Student Enrollment
Total Headcount Enrollment Undergraduate Graduate & Professional
2,593 2,262 331
87.2% 12.8%
11,745 9,079 2,666
77.3% 22.7%
Total Full‐Time Equivalent (FTE) Enrollment Undergraduate Graduate & Professional
2,075 1,884 191
90.8% 9.2%
9,327 7,668 1,660
82.2% 17.8%
New Undergraduate Students (Percent of Total Undergraduates) Entering Freshmen Entering Transfers ‐ MS Community Colleges Entering Transfers ‐ All Other Institutions
819 575 128 116
36.2% 25.4% 5.7% 5.1%
2,666 1,459 843 364
29.4% 16.1% 9.3% 4.0%
Undergraduate Enrollment in High‐Need Disciplines Science, Technology, Engineering, Mathematics (STEM) Education (Including Non‐Teaching Areas) Nursing (All Undergraduate Levels)
451 599 ‐‐
19.9% 26.5% ‐‐
2,079 1,084 622
22.9% 11.9% 6.9%
Degrees Awarded
Undergraduate Degrees per 100 Undergraduate FTE Enrollment 19.1 ‐‐ 20.4 ‐‐
Total Degrees Awarded Certificate Associate Baccalaureate Graduate and Professional
456 0 0
386 70
0.0% 0.0% 84.6% 15.4%
2,086 11 12
1,502 561
0.5% 0.6% 72.0% 26.9%
Tuition and Financial Aid
Undergraduate Tuition (Fall and Spring terms) $5,916 ‐‐ $6,263 ‐‐ Room (Double Occupancy) and Board (Average Meal Plan) $7,072 ‐‐ $7,057 ‐‐
Total Undergraduate Scholarship and Financial Aid Dollars (in Millions) Average Financial Aid Award per Undergraduate Student Percent of Undergraduate Students Receiving Financial Aid Percent of Undergraduate Students Receiving Pell Grants
$15.7 $8,816
‐‐ ‐‐
‐‐ ‐‐
92% 77%
$42.1 $6,981
‐‐ ‐‐
‐‐ ‐‐
76% 43%
College Readiness
Average ACT Score of Entering Freshmen, Fall 2013 17.1 ‐‐ 22.4 ‐‐
Students Enrolled in One or More Intermediate Courses, Fall 2013 Students Enrolled in intermediate math during first year Students Enrolled in intermediate English/reading during first year Students Enrolled in both math and English/reading during first year
345 195 43 107
56.5% 12.5% 31.0%
419 202 96 121
48.2% 22.9% 28.9%
Fall 2011 intermediate math students completing math gateway course within 2 years Fall 2011 intermediate English students completing English gateway course within 2 years
‐‐ ‐‐
28.6% 48.8%
‐‐ ‐‐
44.1% 59.4%
Student Progress
Percent of full‐time students completing 24 credit hours within one academic year Percent of part‐time students completing 12 credit hours within one academic year
‐‐ ‐‐
61.9% 42.9%
‐‐ ‐‐
72.1% 48.7%
Percent of hours completed after one academic year, Fall 2013 through Summer 2014 Entering Freshmen Entering Transfers – All Institutions All Undergraduate Students
‐‐ ‐‐ ‐‐
74.4% 79.2% 80.9%
‐‐ ‐‐ ‐‐
87.3% 85.9% 89.5%
One‐Year Retention Rates for Entering Full‐Time Freshmen, Fall 2012 returning in Fall 2013
‐‐ 53.0% ‐‐ 77.3%
Student Graduation Rates
First‐time, full‐time Freshman Cohort, Fall 2006 443 1,064 Cohort students graduating within 4 years (100% of normal time) Cohort students graduating within 6 years (150% of normal time) Cohort students graduating within 8 years (200% of normal time)
55 99 115
12.4% 22.3% 26.0%
299 538 576
28.1% 50.5% 54.1%
Other University Variables
External Research Dollars – All Sources (in Millions), FY2013‐14 $6.5 ‐‐ $50.0 ‐‐ Student –Faculty Ratio, Fall 2013 13:1 ‐‐ 16:1 ‐‐ Percent of Full‐Time Instructional Faculty with Terminal Degree, Fall 2013 71.2% ‐‐ 77.7% ‐‐
2013‐14INSTITUTIONAL PROFILE

University of Mississippi P.O. Box 1848 • University, MS 38677 1‐800‐653‐6477 www.olemiss.edu
This Institution University System Average
Number Percent Number Percent
Student Enrollment
Total Headcount Enrollment * Undergraduate Graduate & Professional
25,682 19,930 5,752
77.6% 22.4%
11,745 9,079 2,666
77.3% 22.7%
Total Full‐Time Equivalent (FTE) Enrollment * Undergraduate Graduate & Professional
21,582 17,486 4,096
81.0% 19.0%
9,327 7,668 1,660
82.2% 17.8%
New Undergraduate Students (Percent of Total Undergraduates)* Entering Freshmen Entering Transfers ‐ MS Community Colleges Entering Transfers ‐ All Other Institutions
5,704 3,677 1,396 631
28.6% 18.4% 7.0% 3.2%
2,666 1,459 843 364
29.4% 16.1% 9.3% 4.0%
Undergraduate Enrollment in High‐Need Disciplines * Science, Technology, Engineering, Mathematics (STEM) Education (Including Non‐Teaching Areas) Nursing (All Undergraduate Levels)
3,767 1,186 504
18.9% 6.0% 2.5%
2,079 1,084 622
22.9% 11.9% 6.9%
Degrees Awarded
Undergraduate Degrees per 100 Undergraduate FTE Enrollment * 21.0 ‐‐ 20.4 ‐‐
Total Degrees Awarded * Certificate Associate Baccalaureate Graduate and Professional
4,824 16 0
3,395 1,413
0.3% 0.0% 70.4% 29.3%
2,086 11 12
1,502 561
0.5% 0.6% 72.0% 26.9%
Tuition and Financial Aid
Undergraduate Tuition (Fall and Spring terms) $6,660 ‐‐ $6,263 ‐‐ Room (Double Occupancy) and Board (Average Meal Plan) $7,137 ‐‐ $7,057 ‐‐
Total Undergraduate Scholarship and Financial Aid Dollars (in Millions) * Average Financial Aid Award per Undergraduate Student * Percent of Undergraduate Students Receiving Financial Aid * Percent of Undergraduate Students Receiving Pell Grants *
$89.1 $7,572
‐‐ ‐‐
‐‐ ‐‐
68% 28%
$42.1 $6,981
‐‐ ‐‐
‐‐ ‐‐
76% 43%
College Readiness
Average ACT Score of Entering Freshmen, Fall 2013 24.1 ‐‐ 22.4 ‐‐
Students Enrolled in One or More Intermediate Courses, Fall 2013 Students Enrolled in intermediate math during first year Students Enrolled in intermediate English/reading during first year Students Enrolled in both math and English/reading during first year
296 137 100 59
46.3% 33.8% 19.9%
419 202 96 121
48.2% 22.9% 28.9%
Fall 2011 intermediate math students completing math gateway course within 2 years Fall 2011 intermediate English students completing English gateway course within 2 years
‐‐ ‐‐
50.6% 67.9%
‐‐ ‐‐
44.1% 59.4%
Student Progress
Percent of full‐time students completing 24 credit hours within one academic year Percent of part‐time students completing 12 credit hours within one academic year
‐‐ ‐‐
78.1% 46.4%
‐‐ ‐‐
72.1% 48.7%
Percent of hours completed after one academic year, Fall 2013 through Summer 2014 Entering Freshmen Entering Transfers – All Institutions All Undergraduate Students
‐‐ ‐‐ ‐‐
93.0% 87.6% 92.1%
‐‐ ‐‐ ‐‐
87.3% 85.9% 89.5%
One‐Year Retention Rates for Entering Full‐Time Freshmen, Fall 2012 returning in Fall 2013
‐‐ 85.6% ‐‐ 77.3%
Student Graduation Rates
First‐time, full‐time Freshman Cohort, Fall 2006 2,519 1,064 Cohort students graduating within 4 years (100% of normal time) Cohort students graduating within 6 years (150% of normal time) Cohort students graduating within 8 years (200% of normal time)
939 1,511 1,571
37.3% 60.0% 62.4%
299 538 576
28.1% 50.5% 54.1%
Other University Variables
External Research Dollars – All Sources (in Millions), FY2013‐14* $139.3 ‐‐ $50.0 ‐‐ Student –Faculty Ratio, Fall 2013 19:1 ‐‐ 16:1 ‐‐ Percent of Full‐Time Instructional Faculty with Terminal Degree, Fall 2013 81.8% ‐‐ 77.7% ‐‐
*figures include University of Mississippi Medical Center.
2013‐14INSTITUTIONAL PROFILE

University of Southern Mississippi 118 College Drive • Hattiesburg, MS 39406 1‐601‐266‐1000 www.usm.edu
This Institution University System Average
Number Percent Number Percent
Student Enrollment
Total Headcount Enrollment Undergraduate Graduate & Professional
18,051 14,431 3,620
79.9% 20.1%
11,745 9,079 2,666
77.3% 22.7%
Total Full‐Time Equivalent (FTE) Enrollment Undergraduate Graduate & Professional
14,416 12,001 2,415
83.2% 16.8%
9,327 7,668 1,660
82.2% 17.8%
New Undergraduate Students (Percent of Total Undergraduates) Entering Freshmen Entering Transfers ‐ MS Community Colleges Entering Transfers ‐ All Other Institutions
4,103 1,795 1,690 618
28.4% 12.4% 11.7% 4.3%
2,666 1,459 843 364
29.4% 16.1% 9.3% 4.0%
Undergraduate Enrollment in High‐Need Disciplines Science, Technology, Engineering, Mathematics (STEM) Education (Including Non‐Teaching Areas) Nursing (All Undergraduate Levels)
2,624 1,351 1,260
18.2% 9.4% 8.7%
2,079 1,084 622
22.9% 11.9% 6.9%
Degrees Awarded
Undergraduate Degrees per 100 Undergraduate FTE Enrollment 21.1 ‐‐ 20.4 ‐‐
Total Degrees Awarded Certificate Associate Baccalaureate Graduate and Professional
3,347 68 0
2,425 854
2.0% 0.0% 72.5% 25.5%
2,086 11 12
1,502 561
0.5% 0.6% 72.0% 26.9%
Tuition and Financial Aid
Undergraduate Tuition (Fall and Spring terms) $6,744 ‐‐ $6,263 ‐‐ Room (Double Occupancy) and Board (Average Meal Plan) $7,207 ‐‐ $7,057 ‐‐
Total Undergraduate Scholarship and Financial Aid Dollars (in Millions) Average Financial Aid Award per Undergraduate Student Percent of Undergraduate Students Receiving Financial Aid Percent of Undergraduate Students Receiving Pell Grants
$58.7 $5,969
‐‐ ‐‐
‐‐ ‐‐
79% 49%
$42.1 $6,981
‐‐ ‐‐
‐‐ ‐‐
76% 43%
College Readiness
Average ACT Score of Entering Freshmen, Fall 2013 22.0 ‐‐ 22.4 ‐‐
Students Enrolled in One or More Intermediate Courses, Fall 2013 Students Enrolled in intermediate math during first year Students Enrolled in intermediate English/reading during first year Students Enrolled in both math and English/reading during first year
947 655 89 203
69.2% 9.4% 21.4%
419 202 96 121
48.2% 22.9% 28.9%
Fall 2011 intermediate math students completing math gateway course within 2 years Fall 2011 intermediate English students completing English gateway course within 2 years
‐‐ ‐‐
36.0% 62.7%
‐‐ ‐‐
44.1% 59.4%
Student Progress
Percent of full‐time students completing 24 credit hours within one academic year Percent of part‐time students completing 12 credit hours within one academic year
‐‐ ‐‐
69.4% 48.3%
‐‐ ‐‐
72.1% 48.7%
Percent of hours completed after one academic year, Fall 2013 through Summer 2014 Entering Freshmen Entering Transfers – All Institutions All Undergraduate Students
‐‐ ‐‐ ‐‐
87.0% 85.9% 89.5%
‐‐ ‐‐ ‐‐
87.3% 85.9% 89.5%
One‐Year Retention Rates for Entering Full‐Time Freshmen, Fall 2012 returning in Fall 2013
‐‐ 71.6% ‐‐ 77.3%
Student Graduation Rates
First‐time, full‐time Freshman Cohort, Fall 2006 1,561 1,064 Cohort students graduating within 4 years (100% of normal time) Cohort students graduating within 6 years (150% of normal time) Cohort students graduating within 8 years (200% of normal time)
416 773 812
26.6% 49.5% 52.0%
299 538 576
28.1% 50.5% 54.1%
Other University Variables
External Research Dollars – All Sources (in Millions), FY2013‐14 $58.8 ‐‐ $50.0 ‐‐ Student –Faculty Ratio, Fall 2013 17:1 ‐‐ 16:1 ‐‐ Percent of Full‐Time Instructional Faculty with Terminal Degree, Fall 2013 77.2% ‐‐ 77.7% ‐‐
2013‐14INSTITUTIONAL PROFILE

Metric Explanations
Academic Year 2013‐14 (AY2013‐14) – The Institutional Profile is for the 2013‐14 academic year and includes the Summer 2013, Fall 2013, and Spring 2014 terms. Some reporting terms may vary depending on the length of time for each metric.
University System Average – The university system average is based on eight institutions and includes the Medical Center with the University of Mississippi in most instances. Figures including UMMC data are denoted with an asterisk (*).
Total Headcount Enrollment – Total headcount enrollment figures are unduplicated for the academic year. Academic level for enrollment is based on the last term of attendance for the year. [Source: IHLMIS]
Total Full‐Time Equivalent (FTE) Enrollment – Total full‐time equivalent enrollment figures are based on undergraduate and graduate credit hour activity over a 12‐month period. Calculation uses a trailing summer in accordance with IPEDS. [Source: Federal IPEDS]
Entering Freshmen – Entering freshmen figures are based on an unduplicated count of entering freshmen at any point during the academic year. [Source: IHLMIS]
Entering Transfers – Entering transfer figures are based on an unduplicated count of entering transfer students at any point during the academic year from Mississippi’s community colleges and all other postsecondary institutions. [Source: IHLMIS]
Science, Technology, Engineering, Mathematics (STEM) Enrollment – STEM enrollment includes the number of undergraduate students majoring in science, technology, engineering, and mathematics as defined by the National Science Foundation (NSF). A complete listing of the NSF‐STEM majors can be found at http://www.ice.gov/doclib/sevis/pdf/stem‐list.pdf [Source: IHLMIS]
Education (Including Non‐Teaching Areas) and Nursing Enrollment (All Undergraduate Levels) Enrollment ‐ Education enrollment includes the number of undergraduate students majoring in any education discipline according to the 13 CIP code. This includes teaching and non‐teaching education majors. Nursing enrollment includes the number of undergraduate students majoring in any nursing discipline. [Source: IHLMIS]
Undergraduate Degrees per 100 Undergraduate FTE Enrollment – Figures indicate the number of undergraduate degrees awarded per 100 undergraduate FTE students. Undergraduate degrees include certificates, associates, and baccalaureate degrees. Undergraduate FTE is based on an four‐year average of annual undergraduate FTE figures. [Source: Degrees – IHLMIS; Student FTE – Federal IPEDS]
Undergraduate Tuition, Room, and Board – Tuition figures represent undergraduate resident tuition for both the fall and spring terms. Room rates reflect double occupancy rates (most common) and Board rates reflect average meal plan. [Source: IHL Finance & Admin]
Financial Aid – Total undergraduate scholarship and financial aid figures include state, federal, institutional, and all other forms of financial aid known by the reporting institution. Average financial aid award per student is based on the total amount of financial aid divided by the number of eligible students. Percent of undergraduates receiving aid is based on institutional federal financial aid cohorts. [Source: Federal IPEDS]
Intermediate Enrollment – It should be noted that institutions have varying academic policies regarding intermediate enrollment. Intermediate enrollment includes the number of students taking one or more Intermediate courses. Figures are based on Fall 2011 data and exclude the Academic Support Lab. Gateway courses for Mathematics include College Algebra, Elementary Statistics or equivalent courses. Gateway courses for English include Composition, Writing, or equivalent courses. [Source: IHLMIS]
Student Progress – Full‐time status includes students taking 12 or more hours during the fall term while part‐time students include students taking less than 12 hours during the fall term. Students earning zero credit hours for the entire academic year were excluded from the metric since most were not enrolled for the entire academic year. [Source: IHLMIS]
Retention Rates – Retention rates reflect the percentage of first‐time, full‐time entering freshmen during the Fall 2012 term who return for the Fall 2013 term. [Source: Federal IPEDS]
Graduate Rates – Graduation rates reflect the percentage of first‐time, full‐time freshmen during the Fall 2006 term who graduated at 4‐year (100% of normal time), 6‐year (150% of normal time), and 8‐year (200% of normal time) intervals. [Source: Federal IPEDS]
Student‐Faculty Ratio – Student‐faculty ratios are based on 12‐month student FTE enrollment and FTE instructional faculty. [Source: Federal IPEDS]
Instructional Faculty with Terminal Degree – Figures represent the percentage of full‐time instructional faculty with a terminal or first‐professional degree. Terminal degrees include master’s degrees in fine arts (M.F.A.), social work (M.S.W.) and library science (M.L.S.). [Source: IHLMIS]
2013‐14INSTITUTIONAL PROFILE

EDUCATION ACHIEVEMENT COUNCIL
CREDENTIAL AND DEGREE PRODUCTION BY SECTOR, AY2012 THROUGH AY2014
SECTOR CERT ASSOC BACH GRAD TOTAL CERT ASSOC BACH GRAD TOTAL CERT ASSOC BACH GRAD TOTAL CERT ASSOC BACH GRAD TOTAL
Public Four‐Year 4 70 11,214 4,601 15,889 41 60 11,696 4,524 16,321 51 96 12,012 4,522 16,681 1175.0% 37.1% 7.1% ‐1.7% 5.0%
Private Four‐Year 4 61 2,302 1,525 3,892 6 55 2,370 1,664 4,095 8 58 2,247 1,702 4,015 100.0% ‐4.9% ‐2.4% 3.2%
Public Two‐Year 2,874 12,235 0 0 15,109 2,835 11,493 0 0 14,328 4,403 11,990 0 0 16,393 53.2% ‐2.0% 8.5%
Proprietary Four‐Year 0 0 0 2 2 0 8 10 16 34 0 6 7 12 25 500.0% 1150.0%
Proprietary Two‐Year 1,528 630 0 0 2,158 813 524 0 0 1,337 851 490 0 0 1,341 ‐44.3% ‐22.2% ‐37.9%
Proprietary Less Than Two‐Year 898 0 0 0 898 1,429 0 0 0 1,429 1,540 0 0 0 1,540 71.5% 71.5%
TOTALS 5,308 12,996 13,516 6,128 37,948 5,124 12,140 14,076 6,204 37,544 6,853 12,640 14,266 6,236 39,995 29.1% ‐2.7% 5.5% 1.8% 5.4%
SECTOR CERT ASSOC BACH GRAD TOTAL CERT ASSOC BACH GRAD TOTAL CERT ASSOC BACH GRAD TOTAL CERT ASSOC BACH GRAD TOTAL
Public Four‐Year Institutions
Alcorn State University 0 22 380 161 563 0 13 352 141 506 0 54 404 130 588 145.5% 6.3% ‐19.3% 4.4%
Delta State University 0 0 504 276 780 0 0 490 308 798 0 0 438 370 808 ‐13.1% 34.1% 3.6%
Jackson State University 0 0 1,064 495 1,559 0 0 946 539 1,485 0 0 1,093 512 1,605 2.7% 3.4% 3.0%
Mississippi State University 0 0 2,922 1,088 4,010 0 0 3,215 1,043 4,258 0 0 3,255 1,060 4,315 11.4% ‐2.6% 7.6%
Mississippi University for Women 0 48 569 97 714 0 47 688 86 821 0 42 616 80 738 ‐12.5% 8.3% ‐17.5% 3.4%
Mississippi Valley State University 0 0 345 128 473 0 0 366 89 455 0 0 386 70 456 11.9% ‐45.3% ‐3.6%
University of Mississippi 4 0 2,910 1,393 4,307 6 0 3,136 1,437 4,579 4 0 3,395 1,425 4,824 0.0% 16.7% 2.3% 12.0%
University of Southern Mississipp 0 0 2,520 963 3,483 35 0 2,503 881 3,419 47 0 2,425 875 3,347 ‐3.8% ‐9.1% ‐3.9%
TOTALS 4 70 11,214 4,601 15,889 41 60 11,696 4,524 16,321 51 96 12,012 4,522 16,681 1175.0% 37.1% 7.1% ‐1.7% 5.0%
Private Four‐Year Institutions
Belhaven University 3 27 462 192 684 5 27 475 255 762 6 35 498 299 838 100.0% 29.6% 7.8% 55.7% 22.5%
Blue Mountain College 0 0 116 11 127 0 0 128 11 139 0 0 104 7 111 ‐10.3% ‐36.4% ‐12.6%
Millsaps College 0 0 212 52 264 0 0 202 51 253 0 0 191 44 235 ‐9.9% ‐15.4% ‐11.0%
Mississippi College 1 0 650 725 1,376 1 0 662 762 1,425 2 0 614 749 1,365 100.0% ‐5.5% 3.3% ‐0.8%
Rust College 0 7 111 0 118 0 16 138 0 154 0 5 103 0 108 ‐28.6% ‐7.2% ‐8.5%
Southeastern Baptist College 0 24 2 0 26 0 5 7 0 12 0 13 4 0 17 ‐45.8% 100.0% ‐34.6%
Tougaloo College 0 3 167 0 170 0 7 135 0 142 0 5 153 0 158 66.7% ‐8.4% ‐7.1%
Wesley Biblical Seminary 0 0 0 18 18 0 0 0 28 28 0 0 0 13 13 ‐27.8% ‐27.8%
William Carey University 0 0 582 527 1,109 0 0 623 557 1,180 0 0 580 590 1,170 ‐0.3% 12.0% 5.5%
TOTALS 4 61 2,302 1,525 3,892 6 55 2,370 1,664 4,095 8 58 2,247 1,702 4,015 100.0% ‐4.9% ‐2.4% 11.6% 3.2%
Public Two‐Year Institutions
Coahoma Community College 144 303 0 0 447 100 245 0 0 345 92 259 0 0 351 ‐36.1% ‐14.5% ‐21.5%
Copiah‐Lincoln Community Colleg 181 686 0 0 867 165 633 0 0 798 156 717 0 0 873 ‐13.8% 4.5% 0.7%
East Central Community College 65 358 0 0 423 61 322 0 0 383 76 343 0 0 419 16.9% ‐4.2% ‐0.9%
East Mississippi Community Colle 162 780 0 0 942 159 608 0 0 767 205 695 0 0 900 26.5% ‐10.9% ‐4.5%
Hinds Community College 647 1,412 0 0 2,059 620 1,498 0 0 2,118 1,169 1,541 0 0 2,710 80.7% 9.1% 31.6%
Holmes Community College 115 1,018 0 0 1,133 193 1,103 0 0 1,296 164 962 0 0 1,126 42.6% ‐5.5% ‐0.6%
Itawamba Community College 94 1,458 0 0 1,552 101 1,170 0 0 1,271 96 1,179 0 0 1,275 2.1% ‐19.1% ‐17.8%
Jones County Junior College 235 768 0 0 1,003 217 694 0 0 911 231 746 0 0 977 ‐1.7% ‐2.9% ‐2.6%
Meridian Community College 243 654 0 0 897 240 667 0 0 907 255 617 0 0 872 4.9% ‐5.7% ‐2.8%
Mississippi Delta Community Coll 120 441 0 0 561 120 360 0 0 480 101 432 0 0 533 ‐15.8% ‐2.0% ‐5.0%
Mississippi Gulf Coast Community 208 1,795 0 0 2,003 191 1,754 0 0 1,945 1,223 1,877 0 0 3,100 488.0% 4.6% 54.8%
Northeast Mississippi Community 67 580 0 0 647 47 586 0 0 633 85 568 0 0 653 26.9% ‐2.1% 0.9%
AY2012 AY2013 AY2014 PERCENT CHANGE
AY2012 AY2013 AY2014 PERCENT CHANGE

EDUCATION ACHIEVEMENT COUNCIL
CREDENTIAL AND DEGREE PRODUCTION BY SECTOR, AY2012 THROUGH AY2014
SECTOR CERT ASSOC BACH GRAD TOTAL CERT ASSOC BACH GRAD TOTAL CERT ASSOC BACH GRAD TOTAL CERT ASSOC BACH GRAD TOTAL
AY2012 AY2013 AY2014 PERCENT CHANGE
Northwest Mississippi Communit 187 1,076 0 0 1,263 255 914 0 0 1,169 225 937 0 0 1,162 20.3% ‐12.9% ‐8.0%
Pearl River Community College 251 598 0 0 849 247 601 0 0 848 204 776 0 0 980 ‐18.7% 29.8% 15.4%
Southwest Mississippi Communit 155 308 0 0 463 119 338 0 0 457 121 341 0 0 462 ‐21.9% 10.7% ‐0.2%
TOTALS 2,874 12,235 0 0 15,109 2,835 11,493 0 0 14,328 4,403 11,990 0 0 16,393 53.2% ‐2.0% 8.5%
Proprietary Four‐Year Institutions
Strayer University‐Mississippi 0 0 0 2 2 0 8 9 16 33 0 6 5 11 22 450.0% 1000.0%
University of Phoenix‐Mississippi 0 0 0 0 0 0 0 1 0 1 0 0 2 1 3 N/A
TOTALS 0 0 0 2 2 0 8 10 16 34 0 6 7 12 25 500.0% 1150.0%
Proprietary Two‐Year Institutions
Academy of Hair Design‐Grenada 39 0 0 0 39 26 0 0 0 26 18 0 0 0 18 ‐53.8% ‐53.8%
Academy of Hair Design‐Jackson 57 0 0 0 57 50 0 0 0 50 49 0 0 0 49 ‐14.0% ‐14.0%
Academy of Hair Design‐Pearl 56 0 0 0 56 36 0 0 0 36 31 0 0 0 31 ‐44.6% ‐44.6%
Antonelli College‐Hattiesburg 4 125 0 0 129 3 120 0 0 123 15 126 0 0 141 275.0% 0.8% 9.3%
Antonelli College‐Jackson 4 173 0 0 177 5 197 0 0 202 36 172 0 0 208 800.0% ‐0.6% 17.5%
Blue Cliff College‐Gulfport 250 0 0 0 250 187 12 0 0 199 247 7 0 0 254 ‐1.2% 1.6%
Corinth Academy of Cosmetology 50 0 0 0 50 58 0 0 0 58 56 0 0 0 56 12.0% 12.0%
Day Spa Career College 27 0 0 0 27 29 0 0 0 29 21 0 0 0 21 ‐22.2% ‐22.2%
Delta Beauty College 27 0 0 0 27 26 0 0 0 26 23 0 0 0 23 ‐14.8% ‐14.8%
ITT Technical Institute‐Madison 0 50 0 0 50 0 66 0 0 66 0 37 0 0 37 ‐26.0% ‐26.0%
KC's School of Hair Design 28 0 0 0 28 39 0 0 0 39 46 0 0 0 46 64.3% 64.3%
Miller‐Motte Technical College‐G 0 0 0 0 0 32 7 0 0 39 37 53 0 0 90 N/A
The Academy of Hair Design Six 59 0 0 0 59 54 0 0 0 54 35 0 0 0 35 ‐40.7% ‐40.7%
Virginia College‐Biloxi 99 136 0 0 235 111 104 0 0 215 101 82 0 0 183 2.0% ‐39.7% ‐22.1%
Virginia College‐Jackson 828 146 0 0 974 157 18 0 0 175 136 13 0 0 149 ‐83.6% ‐91.1% ‐84.7%
TOTALS 1,528 630 0 0 2,158 813 524 0 0 1,337 851 490 0 0 1,341 ‐44.3% ‐22.2% ‐37.9%
Proprietary Less Than Two‐Year Institutions
Chris Beauty College 56 0 0 0 56 61 0 0 0 61 68 0 0 0 68 21.4% 21.4%
Creations College of Cosmetology 22 0 0 0 22 15 0 0 0 15 14 0 0 0 14 ‐36.4% ‐36.4%
Delta Technical College 429 0 0 0 429 552 0 0 0 552 606 0 0 0 606 41.3% 41.3%
Fosters Cosmetology College 6 0 0 0 6 14 0 0 0 14 27 0 0 0 27 350.0% 350.0%
Healing Touch Career College 34 0 0 0 34 56 0 0 0 56 158 0 0 0 158 364.7% 364.7%
Infinity Career College‐Carthage 82 0 0 0 82 137 0 0 0 137 51 0 0 0 51 ‐37.8% ‐37.8%
Infinity Career College‐Gulfport 36 0 0 0 36 20 0 0 0 20 30 0 0 0 30 ‐16.7% ‐16.7%
Magnolia College of Cosmetology 107 0 0 0 107 106 0 0 0 106 92 0 0 0 92 ‐14.0% ‐14.0%
Midwest Technical Institute‐Ridge 2 0 0 0 2 349 0 0 0 349 384 0 0 0 384 19100.0% 19100.0%
Mississippi College of Beauty Cult 41 0 0 0 41 45 0 0 0 45 29 0 0 0 29 ‐29.3% ‐29.3%
Miss Institute of Aesthetics Nails 66 0 0 0 66 43 0 0 0 43 61 0 0 0 61 ‐7.6% ‐7.6%
Traxlers School of Hair 17 0 0 0 17 31 0 0 0 31 20 0 0 0 20 17.6% 17.6%
TOTALS 898 0 0 0 898 1,429 0 0 0 1,429 1,540 0 0 0 1,540 71.5% 71.5%
Source: IPEDS College Navigator, www.nces.ed.gov/ipeds, October 2015.