minsc workshop finn engstrøm / global production development€¦ · · 2013-11-05minsc workshop...
TRANSCRIPT

Where is the oil coming from 18.06.2013
MINSC Workshop
Finn Engstrøm / Global Production Development

Where does the oil come from?

Or does oil come from big underground oil pools ?

Most oil is comes from tiny pore spaces in rocks deep below the surface of the earth But • How did the oil got trapped in
the tiny pore spaces, • How do we find where the oil
is deep below the surface of the earth
• How do we get it up
Actually …

Sourcerock/Kitchen
Migration Route
Trap
Reservoir
Petroleum System Components

Source Rock : Generates Hydrocarbons which migrate through a Migration Route: until stopped in a Trap: that includes Reservoir Rock: of sufficient porosity and permeability to store significant volumes and allow production at a reasonable rate.
115°C
175°C
Simple Petroleum System

Chalk Reservoirs
Jurassic Source Rocks
Oil Migration
But things take time – long time

Oil and gas are formed by the thermal cracking of organic compounds buried in fine-grained rocks.
Algae = Wood =
Hydrogen rich = Oil-prone
Hydrogen poor = Gas-prone
Types of Petroleum

Pressure Cooker
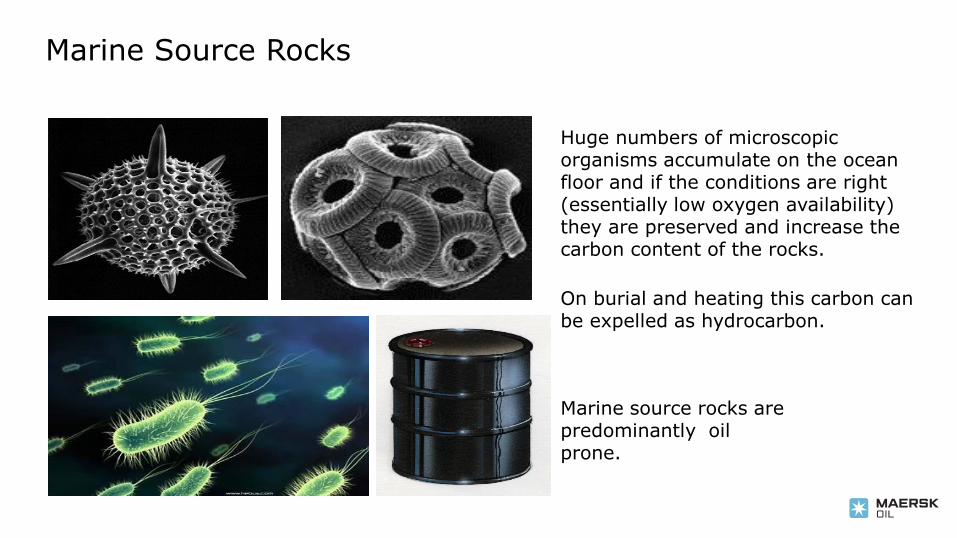
Huge numbers of microscopic organisms accumulate on the ocean floor and if the conditions are right (essentially low oxygen availability) they are preserved and increase the carbon content of the rocks.
On burial and heating this carbon can be expelled as hydrocarbon.
Marine source rocks are predominantly oil prone.
Marine Source Rocks

Restricted basin into which the Kimmeridge Clay source rock is deposited
Late Jurassic

The Kimmeridge Shale contain so much kerogene that it may burn
Kimmeridge Shale

Lena Delta, Siberia
Organic material preserved in swamp areas due to low oxygen content
The same setting in the Carboniferous produced much of the worlds abundant coal deposits
Produces a predominantly gas prone source rock
Terrestrial source rocks – responsible for many gas fields

With burial over time, increasing temperature and pressure
causes source rocks to generate and expel hydrocarbons
Temperature
De
pth
Imm
atu
re
Oil
Gas
This is often referred to as a source “kitchen” or a “charge system”
Source systems: Generation and Expulsion

Imm
atu
re
Oil
Gas
Temperature
De
pth
This is a dynamic process and is complicated by continuing subsidence and burial
A unit of rock will progressively pass through
the immature, oil mature and gas mature
“windows”
Source systems: Generation and Expulsion

Imm
atu
re
Oil
Gas
Temperature
De
pth
And generate hydrocarbons of increasing “maturity”: •Heavy oil •Light oil •Gas condensate •Dry gas
Increasing “oAPI”
Source systems: Generation and Expulsion

• Oil is generated in a source rock (kitchen)
• Oil Migrates upwards by buoyancy/pressure differences over time - drop by drop or slug by slug through a carrier bed (migration route)
• Until it is stopped by a ”seal” and the oil is collected in a reservoir rock
Kitchen
Carrier bed
Seal
Oil Reservoir
This takes time – Long Time
Oil Migration

Trap occurs after charge Trap occurs before charge
Migration & Trap

Or they can be stratigraphic: And can contain oil and gas:
With a corresponding Gas-Oil Contact (GOC)
Migration & Trap

Spill Point Spill Point
Seal Rock (Mudstone)
Reservoir Rock (Sandstone) Migration from
‘Kitchen’
1) Early Generation
2) Late Generation
Gas displaces all oil
Gas beginning to displace oil
Displaced oil accumulates
Migration – a dynamic entity

Possible Source rocks
Lower Miocene – Tamar reservoirs
Oil window
Gas window
Peak oil expulsion
Overmature
Possible gas leakage
S
S
S
Messinian evaporites
Eratosthenes high
Base Pliocene
Base Messinian
Base Middle Miocene
Base Miocene
Near Eocene
Senonian unc.
Top Middle Jurassic
Oligocene LST - turbidites
Detachment layer; over-pressured shale
Oil Migration
Lower Creta and Upper Creta clastics
Gas Migration
Palaeogene LST - turbidites
Present day 80°C
Tentative Stratigraphy
Eastern Mediterranean

Reservoir
Zagros Fold-belt, Iran
Represents the focus of migration and the accumulation. These can be structural, stratigraphic or a combination of the two
Seals – prevent further migration
Gas Oil
Water
Anticlinal trap
The trap

Salt Dome Fault
Unconformity
Pinchout
Anticline
Hydrocarbon Trap Types

Reservoirs are rocks with porosity and permeability
The Reservoir

Good Porosity = Lots of Space for Petroleum
Pores – the spaces between
grains (blue)
Reservoir Sandstone

Chalk Reservoir

Typical Sandstone/Shale Reservoir
• Permeability contrast between reservoir rock and non reservoir rock is significant
• Few and well defined rock types
• Short transition zones
• OWC = FWL
• Sh = (0; (1-Swir); Sor(w)f)
• Reservoir is in equilibrium
Typical Chalk Reservoir
• Permeability contrast between reservoir
rock and non reservoir rock is limited
• Continuous rock types
• Long transition zones
• FWL much deeper than OWC
• Sh = (0 -> (1-Swir) or ~ Sor(w)f)
• Reservoir is not in equilibrium
Chalk and Other Rock Types: petrophysical characteristics

Carbonate reservoirs can have primary porosity
(derived at deposition) or secondary porosity
(created after deposition by dissolution or
fracturing)
Carbonate Reservoirs

From Ron Blakely website: http://jan.ucc.nau.edu/~rcb7/
Many of the reservoirs for Danish fields were deposited at this time
Late Cretaceous reconstruction

Late Cretaceous chalk seas

Last day of the Cretaceous – a bad day for dinosaurs…
Cretaceous – Tertiary boundary Contains high amounts of Iridium – an element very rare in the Earth’s crust but abundant in meteorites

Stevns Klint, Denmark Møns Klint, Denmark
North Sea Outcrop Carbonate Examples

Much of the gas on the NW Shelf is reservoired in
rocks deposited in fluvial to deltaic settings.
Braided river
Meandering river
Deltas
Typical Triassic and Jurassic reservoirs of the North Sea

Sands – reservoir rock
Coals – source rock
Triassic gas fields of the north sea (eg Statfjord)

These parameters
can have a big
impact upon
economics
Porosity
Pe
rme
ab
ilit
y
10% 0% 20% 30%
10mD
0mD
100mD
1000mD
Reservoir systems

Scale of the operations
Acquiring a marine 3D survey
Seismic data – visualising the subsurface

CDP (Common Depth Point)
Near to far offsets
All data for a single CDP is staked into a gather.
Marine Seismic Acquisition

Herlev Hospital 120 m
Seismic Resolution

Two Way Time ms (1,000 ms = 1 second)
Seismic display – colour variable density

3D Seismic volume

Skjold
Dan Halfdan
Nana-1XP MFF-19C
Halfdan Porosity from seismic inversion

Why do we Drill… • To test a concept. • To gather information. • To add reserves. • To fulfil commitments.
Drilling a well

The fluid circulated around the hole is called drilling mud.
The mud: •Lubricates the bit •Carries the samples to the surface • Is balanced to the pressure of the rock formation
Drilling rig

Semi-submersible rig
Drill ship
Ca $1/2m per day
Max water depth ca
1500m
Ca $1m per day
Min water depth ca 500m
Offshore drilling

Drilling proceeds by drilling a section of hole and then casing this off to prevent collapse and to allow the mud weight to be increased as drilling further. The circulation of mud in the hole brings samples to the surface and is calculated to be an adequate pressure to stop formation fluids flowing into the hole in an uncontrolled manner.
Drilling and casing the hole

Gas
Oil Water
Directional Drilling

Drill Floor Samples collected on the shakers
Drilling – How Do We Know Where We Are?
Core (Diamond) Bit Core Cuttings Rock bit

Coring
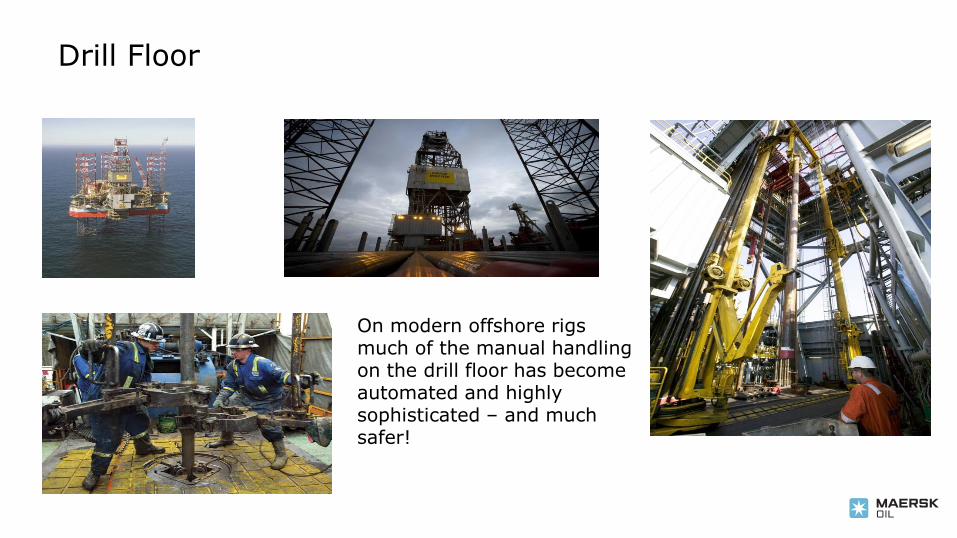
On modern offshore rigs much of the manual handling on the drill floor has become automated and highly sophisticated – and much safer!
Drill Floor

A suite of logs provides us with invaluable direct and indirect information on the well: • Lithologies • Fluids • Formation pressures • Rock samples • Fluid samples
Logging the hole

Sharp-based shoreface
Sunrise-1 GR
15 m
Desert Member shoreface (Book Cliffs, Utah, USA)
Sharp-based shoreface Unit 2
Sunset-1 Sunrise-2
13 m
21 km SW NE
Depositional dip
Unit 2: Sharp-based Shoreface Most Likely model Logging

• Combining Log, Core & Test data.
• Determines the hydrocarbon in place.
Density, neutron logs – help determine lithology, porosity and fluids.
Resistivity helps determine fluids
Caliper and Gamma – helps determine lithology
Well Evaluation

Drill cuttings Logging while
Drilling
RHO
Bottom
RHO
Top
Low Density
formation
High Density formation
HZ
LF
TC
AB
DC
22
.4 Nano-fossils
Micro-fossils
Bio-steering
Data collection for steering of the well inside the reservoir

Dan was discovered in 1971, first Danish oil and gas field on stream, production started in 1972 Halfdan was discovered in 1998 and put on production in 1999 Illustration shows underground topography and well pattern.
Dan and Halfdan Field Development

Discoveries pass through: • Appraisal • Development • Production • Abandonment It can be many years from discover
to production. This affects the value of the opportunity (time value of money)
Exploration is a long term and
expensive business but is the life-blood of an oil company.

• Microscopic Sweep Efficiency (RF-micro)
• How large fraction of the local STOIIP is produced
• Controlled by microscopic recovery process
• Macroscopic Sweep Efficiency (RF-macro)
• How large fraction of the reservoir is affected by the microscopic recovery process(es)
• Controlled by the volumetric effect of the microscopic recovery processes and number/location of wells
• Total Recovery Factor (RF)
• RF = RF-micro x RF-macro
Microscopic & Macroscopic – Sweep Efficiency

• Pressure depletion of oil above bubble point RF = 2-5%
• Solution gas drive in oil leg below bubble point RF = 5-10%
limited by gas fingering
secondary gas cap formation is very limited
• Primary gas cap expansion RF =3-4%
Limited by gas cusping
• Aquifer expansion
RF < 5%
limited by low permeability of chalk aquifer
Risk of water coning
• Plastic chalk compaction
RF = 0-(30)%,
but only in very high porosity chalk reservoirs.
Primary recovery

• Simple Gas Injection: Limited recovery in chalk due to:
• Gas channelling from injector to producer through fractures
• Gas fingering through matrix
• No formation of a secondary gas gap
• Limited imbibition of gas in fractures into matrix
Low RF-macro
• Water injection: Good recovery in chalk due to:
• Relatively stable displacement (near piston-like displacement)
• Easy to control fracturing => potential of high injection pressure
• High potential oil displacement fraction
Potential High RF-macro
Secondary recovery

Oil is pushed towards
the oil producer by
injected water
10 μm
Simplified chalk reservoir Chalk reservoir analog
”Stevns Klint”
Detailed picture
of chalk
Complex reservoir
architecture μm-size grains and
pores
Oil production from chalk reservoirs with water injection

60
Analytical models Reservoir Models
Maximise areal sweep

61
Monitor areal sweep
4D Seismic (2D) 4D Seismic (3D)

Fast water flood - Fracture Aligned Sweep Technology

• 1972: Dan was discovered and developed using vertical wells
• 1987: Maersk Oil was one of the first oil companies drilling long
reach horizontal well
• 1988: Maersk Oil was one of the first oil companies to start
water injection
• 1994: Well spacing was reduced and high rate injection was
increasing and accelerating recovery
• 1999: Development of the Dan West Flank was started
• Dan recovery is approaching 35%
0
5
10
15
20
25
30
35
40
1970 1980 1990 2000 2010
Year
Rec
over
y Fa
ctor
(%)
0
20
40
60
80
100
120
140
160
Oil
Rat
e (1
000
stb/
d)
Recovery Factor
Oil Rate
Vert
ical
Wells
HR W
I under
Gas
Cap
Wate
r In
jection
(WI)
Horizonta
l W
ells
Hig
h
Rate
(H
R)
WI
Dan Experience

• Often stable displacement
• Displace oil saturation down to water-flood remaining oil saturation where water-flood works. The exact value of Sor(w)f as recorded in water-flooded
zones still somewhat disputed due to petrophysical interpretation problems
• Cause gradually increasing water-cuts when flood-fronts break-through along horizontal wells
Oil Recovery vs Porosity
Maastrichtian Chalk
0
0.1
0.2
0.3
0.4
0.5
0.6
0.7
0.8
0.9
1
0 0.1 0.2 0.3 0.4 0.5
Total Porosity ( )
Oil
Rec
over
y (
)
Normal Grain Size
Water flood experience

• Injection of misciple fluids (CO2, Rich HC-gas etc.)
• Injected fluids tends to dissolve the oil volume left by e.g. water flooding
• Injection of alternating fluids (WAG ……)
• Injection of pulses of different fluid (e.g. water-gas-water-gas) tends to reduce Sor(w)f due to 3-phase relative permeability effects
• Microbiological Enhanced Oil Recovery (MEOR)
• MEOR works typically by microbiological activity create biofilms that plug the rock and divert injected fluids
• MEOR-technique is not used in chalk
• Fire flooding
• Injection of air into a reservoir may allow the oil in a reservoir to ignite (even in a waterflooded zone) and burn. The burn-front vapourize all the fluids that condense after cooling ahead of the burn front.
• Potentially very effecient process
• NanoChalk
• Works potentially by re-crystalizing the chalk and thus releasing the trapped oil-droplets after a water flood plus enahncing the permeability.
• Etc.
Macroscopic sweep efficiency of all tertiary
recovery methods are in general poor
Tertiary Recovery Efficiency/Chalk Typically reduction of Sor(w)f

Separation of oil, gas and water
Oil Pipeline to shore
Gas pipeline
Oil Water Gas
Production and Utilisation of Oil and Gas

Jack-up rig during towage, with legs elevated
Jack-up rig in position, with legs on seabed and hull elevated
New oil and gas wells are drilled by mobile (jack-up) drilling rigs


Completion of Horizontal Wells
TD TD


Plastics
Pharmaceuticals
Cosmetics
synthetic fibres
detergents, solvents
Fertilizers
Agricultural products
Petrochemical Products
Resins
Paints
Dyes
Detergents
Water repellents
Explosives…….

Thank you