minnesota’s prevailing wage: an evaluation of the rate ... · “reasonable methods” to collect...
TRANSCRIPT
Minnesota’s Prevailing Wage: An Evaluation of the Rate-Setting Process
February 2018

Acknowledgements
The research in this report was prepared in accordance with a contract with the Construction Education Foundation of Minnesota. MCFE is solely responsible for this publication’s content.
About the Minnesota Center for Fiscal Excellence
The Minnesota Center for Fiscal Excellence was founded in 1926 to promote sound tax policy, efficient spending, and accountable government. We pursue this mission by
educating and informing Minnesotans about sound fiscal policy;
providing state and local policy makers with objective, non-partisan research about the impacts of tax and spending policies; and
advocating for the adoption of policies reflecting principles of fiscal excellence MCFE generally defers from taking positions on levels of government taxation and spending believing that citizens, through their elected officials, are responsible for determining the level of government they are willing to support with their tax dollars. Instead, MCFE seeks to ensure that revenues raised to support government adhere to good tax policy principles and that the spending supported by these revenues accomplishes its purpose in an efficient, transparent, and accountable manner. The Center is a non-profit, non-partisan group supported by membership dues. For information about membership, call (651) 224-7477, or visit www.fiscalexcellence.org.

Table of Contents
I. EXECUTIVE SUMMARY ............................................................................................................ 1
II. INTRODUCTION .......................................................................................................................... 5
III. FINDINGS ...................................................................................................................................... 7
IV. CONCLUSIONS .......................................................................................................................... 17
V. RECOMMENDATIONS ............................................................................................................. 21
VI. APPENDIX A: METHODOLOGY ............................................................................................ 23
Data Sources .................................................................................................................................. 23 Records Removed From Analysis .................................................................................................. 24
VII. APPENDIX B: LIST OF JOB CLASSES ANALYZED IN REPORT .................................... 27
VIII. APPENDIX C: COUNTIES BY METROPOLITAN STATISTICAL AREA AND MICROPOLITAN STATISTICAL AREA ............................................................................... 31
For information contact: Minnesota Center for Fiscal Excellence 85 E. Seventh Place, Suite 250 St. Paul, MN 55101 Phone: 651-224-7477 email: [email protected] Website: http://www.fiscalexcellence.org

Minnesota’s Prevailing Wage: An Evaluation of the Rate-Setting Process
1
I. Executive Summary
Since its inception, Minnesota’s prevailing wage law has been a source of policy controversy and political sensitivity. In 2006, legislators directed the Office of the Legislative Auditor (OLA) to examine the state’s prevailing wage requirement which included an evaluation of the foundation of the program – the method used to set prevailing wages in Minnesota. The OLA’s 2007 report concluded the state used “reasonable methods” to collect data for the purpose of setting prevailing wages. However, this conclusion came with several significant qualifications and caveats questioning the robustness of the methods employed and the representative nature of the results stemming from it.
The purpose of this report is to revisit and reevaluate the prevailing wage rate setting process ten years after the 2007 OLA evaluation. We study and report on raw survey data reported to the Department of Labor and Industry from nonresidential commercial construction dated April 1, 2015 through May 31, 2016. Using this data, we explore the degree to which rate setting relies on importing from other areas. We also estimate how prevailing wage rates could change under alternative calculation methods.
Based on this examination, we generate findings and conclusions with respect to how well the current rate setting process actually delivers on the legislative intent of Minnesota’s prevailing wage law and the extent to which issues flagged by the OLA ten years ago continue to persist.
Findings
1. Only a little more than a quarter of all possible state prevailing wage rates were set using own-county survey data from the current year – a decline from 33% as reported by the OLA in its review of 2005 prevailing wage rates. Imported rates from other counties accounted for over half of all possible prevailing wage rates. Current own-county survey data is two and a half times more likely to be the source for setting rates in the seven-county metro area than in the rest of the state.
2. The minority of prevailing wage rates that were able to be set using current own-county data were concentrated in a very small subset of job groups. Just 13 of 59 job groups accounted for over half of the prevailing wages set using current own-county survey data. At the other end of the spectrum, no survey data was submitted anywhere in the state of Minnesota for five job groups.
3. The vast majority of prevailing wage rates we studied were collectively bargained rates. Statewide, DLI can set 5,133 prevailing wage rates for commercial construction projects – one rate for 59 job groups in each of the state’s 87 counties. During the period we studied, survey data was returned for 1,419 of these job groups. In 86% of these instances, DLI identified the prevailing wage rate the survey data generated as a collectively bargained (union) rate. In the over 2,600 job groups where a prevailing wage rate was set with data imported from other counties, 69% of the prevailing wage rates were identified as

Minnesota Center for Fiscal Excellence
2
union rates. In total, 75% of the prevailing wage rates set with data from this survey period were union rates. While there is no other survey specific to nonresidential construction workers, data from the U.S. Census Bureau’s Current Population Survey indicates the proportion of total private-sector construction workers in Minnesota covered by a collective bargaining agreement was 31.6% in 2015 and 37.2% in 2016 – the two calendar years that overlap with the time period this report studies.
4. A very small number of individuals often set the prevailing wage rate, even in populous counties. Of the 1,419 job groups for which survey data was returned, nearly one in five had the prevailing wage rate set by one person working on one project. The influence small numbers of individuals can have is compounded by the fact that surveys are returned on a project-by-project basis. Since an individual may work on multiple projects, any individual’s wage data may be submitted for calculation purposes multiple times. This is especially influential when using the mode as a means of setting the prevailing wage. For example, in the data we examined, ten individuals effectively set the prevailing wage rate for roofers for all of Hennepin County.
5. Importing wages from adjacent counties frequently results in wage importation from locations featuring significantly different demographic and economic characteristics. 61% of the prevailing wage rates imported into rural counties came mostly or entirely from counties that were part of a micropolitan or metropolitan area.
6. In practice, methodological changes in the way the state calculates prevailing wage rates would have little impact on those rates. Under current law, Minnesota uses a modal calculation to determine prevailing wage rates. Our analysis of the survey data indicates that the average equals the mode in nearly half of the 1,419 job groups for which survey data was returned. In 85% of the observations, the differential between the average and the mode is within plus or minus 5%, suggesting that a change to an average calculation would have a relatively small effect. The effect of changing to alternative methods (median, majority/average, etc.) is even smaller. However, there is evidence alternative calculation methods would have a bigger impact in rural Minnesota compared to the seven-county metro.
Conclusions
1. The state’s prevailing wage system is biased toward supporting union labor rates. In its 2007 report, the OLA identified over two-thirds of commercial construction prevailing wage rates that were set using current survey data as union rates. All the aspects of the prevailing wage determination process that the OLA concluded “could lead to overrepresentation of union wages among reported wages” – use of the mode to generate the rate, greater union reporting frequency, and the use of historical data – continue to exist.
We find three-quarters of the prevailing wage rates set with current survey data during this period were union rates. Moreover, our analysis of prevailing
Minnesota’s Prevailing Wage: An Evaluation of the Rate-Setting Process
3
wage determinations under alternative calculation methods offers further evidence that union rates continue to have a disproportionate influence in setting prevailing wage rates. Alternative calculation methods (average, median, etc.) should capture the diversity of wages and benefits that exist among all commercial construction contractors in the state. Yet prevailing wage rates calculated under these alternative methods resulted in little or no change to established rates in the majority of circumstances.
2. The OLA’s primary recommendation with respect to improving the rate determination process – improving the survey response rate to obtain data more representative of compensation rates for private commercial construction work in Minnesota – is extremely difficult to accomplish. The use of the mode, which determines prevailing wages by the frequency of occurrence in total compensation matched to the penny, disadvantages non-union firms with far less homogenous compensation structures. Other disincentives to improving survey response rates among non-union firms include more limited ability to report wage and benefit data, privacy concerns, and human resource management designs which conflict with the highly prescriptive and discrete job classification system on which the current survey design is constructed.
3. We cannot determine whether current practices actually achieve the stated policy intent of Minnesota’s prevailing wage law – “ensuring comparable wages paid for similar work in the community as a whole”. Survey design and response issues, implications of project based reporting, the ability for multiple submissions of individual data, and inherent issues pertaining to data importing suggest any confidence in the idea that prevailing wage rates are an accurate reflection of local labor compensation is misplaced.
Recommendations
Minnesota’s current prevailing wage determination process serves appearances far more than substance. The survey process and accompanying rules create a perception of rigorous, evidence-based policy where rigor is lacking and evidence is fraught with self-selection bias.
We recommend the following
1. The state reengineer the survey process to make it “firm based” rather than “project based”. Among many advantages, it would capture the spirit and intent of the state’s prevailing wage statute by ensuring that prevailing wage rates are based on the overall wage and benefit structures of local employers.
2. As part of this reengineering, the state should switch to using a majority-average method to calculate the prevailing wage, in which the mode would be used to set the wage if it represents a majority of responses and an average of all responses would be used otherwise. Since these methodological changes in the survey process will result in firms submitting “average” wages for each relevant job group, it is even more likely that a

Minnesota Center for Fiscal Excellence
4
handful of firms with uniform pay scales would have great influence over the rate-setting process if a modal-only calculation continues to be used. Hybrid calculation methods such as these are used by the federal government and commonly among states, and this method would ensure that competing notions of “prevailing wage” (the single rate reported most often versus an average rate) both factor into the calculations.

Minnesota’s Prevailing Wage: An Evaluation of the Rate-Setting Process
5
II. INTRODUCTION
“It is in the public interest that public buildings and other public works be constructed and maintained by the best means and highest quality of labor reasonably available and that persons working on public works be compensated according to the real value of the services they perform. It is therefore the policy of this state that wages of laborers, workers, and mechanics on projects financed in whole or part by state funds should be comparable to wages paid for similar work in the community as a whole.”
Minnesota Statutes, Chapter 177, Section 41
The statutory language of Minnesota’s prevailing wage law captures the reasons why the law remains both very popular and very controversial. Few would argue with the statement of public interest and intent behind the statute. But determining and quantifying the “real value” of someone’s labor is a challenging task demanding the use of imprecise and abstract concepts such as “comparable wages,” “similar work,” and “in the community as a whole.”
In 2006 legislators directed the Office of the Legislative Auditor (OLA) to examine Minnesota’s prevailing wage requirement. This included an evaluation of the method used to set prevailing wage rates in Minnesota – a survey by the Department of Labor and Industry (DLI), which, at that time, included over 14,000 potential respondents (contractors and other interested parties). The OLA’s 2007 evaluation report1 concluded the DLI, “uses reasonable methods to collect wage and benefit information for the purpose of setting prevailing wage rates.” However, this conclusion did not come without some important qualifications and caveats:
• The OLA concluded it was not possible to determine if DLI survey results were representative of the non-residential construction industry
• The OLA found that the survey response rate appeared “to be low” • The OLA concluded the method used to calculate prevailing wage rates may
sometime result in rates that are not representative of wages and benefits paid for non residential construction work
• The OLA found that although most prevailing wage rates are set in accordance with state laws and rules, some rates were incorrectly set due to computer programming and other errors.
The OLA’s conclusion about the continuing efficacy of the rate-setting method employed was essentially compelled by the lack of any better approach. Or as the OLA stated, “Although we have some concerns about the wage data collected by the survey, there is not an alternative source of construction wage data that is clearly better than the data collected by the Department of Labor and Industry.”
That’s a pragmatic conclusion. However, if the issues and concerns flagged by the OLA persist or have worsened, at some point the conclusion that the
1 Prevailing Wages. Program Evaluation Division, Office of the Legislative Auditor, State of Minnesota. February 2007.

Minnesota Center for Fiscal Excellence
6
“reasonableness” of current rate setting outweighs any problems and issues arising out of the methodology employed can legitimately be called into question.
In this report we revisit and expand upon analytical pieces pertaining to the prevailing wage rate-setting process the OLA identified in its 2007 evaluation of prevailing wage in Minnesota. Specifically:
• We examine and report on raw survey data from projects completed in 2015-2016.
• We explored the degree to which rate setting relies on importing rates from other areas.
• We use the raw survey data to estimate how prevailing wage rates would change under different prevailing wage calculation scenarios.
Our analysis is based on two data sources. The first is the complete set of prevailing wage survey returns covering nonresidential commercial construction projects in the state dated April 1, 2015 through May 31, 2016. Survey returns were provided in 87 Excel files, one for each county in Minnesota and in total contained 50,272 individual records relating to these construction projects. The second group of files provided summary data from these prevailing wage survey records, and also organized by 87 county-specific Excel files. Appendix A describes the methodology employed and the specific types of information files provided.
Our examination generates findings and conclusions with respect to how well the current rate setting process actually delivers on the legislative intent of Minnesota’s prevailing wage law and the extent to which issues flagged by the OLA ten years ago continue to persist. We conclude with a discussion of the policy implications from our findings.

Minnesota’s Prevailing Wage: An Evaluation of the Rate-Setting Process
7
III. Findings
The foundation of the process used to certify (“set”) prevailing wage rates is a survey of “interested persons” (primarily contractors and unions) to obtain data on wage and fringe benefit rates paid to workers on nonresidential construction projects where the estimated total cost of completing the project is $2,500 or more.2 The survey design includes three important features:
1) The survey focuses on “projects” rather than employers. The survey does not gather information on a county-by-county basis about the wages and benefit employers located in each county pay employees who work on nonresidential construction projects. Instead, the survey gathers information on the wages and benefits paid to employees working at each individual job site – making survey project-based and not employer- or firm-based..
2) A “project” is defined by specific contracts, not the finished construction. The state has designed the survey process so that multiple contractors working on a project may each submit a survey reflecting their own work. Likewise, an individual contractor with multiple contracts for different stages of a construction project may report each individual contract as a separate “project.”
3) The survey is voluntary. The survey does not use random sampling with follow-up of non-respondents, as is generally the case for government survey projects.3 Participation in the state’s prevailing wage survey is completely voluntary. Moreover, since the survey is based on projects, which would need to be identified in real time, DLI would be hard-pressed to contact non-respondents even if state law mandated that it try to.
Our analysis is based on the survey results for the 59 job groups4 that pertain to nonresidential construction projects, as listed in Minnesota Rules 5200.1100, subp. 2, 2a, 3a, 4, and 5. With each job group having a prevailing wage rate in each of Minnesota’s 87 counties, this creates 5,133 total job groups for which prevailing wage rates can be set.
It is important to keep three features of the rate-setting process in mind. First, the administrative rules prohibit DLI from using own-county survey data to set prevailing wage rates unless data has been submitted for two or more projects.5 For the survey period we worked with, four counties did not meet that threshold: Lake of the Woods, Lincoln, Sibley, and Traverse. Second, in cases where no survey data is returned for a job group in a county, DLI will set the rate using data from an adjacent county or
2 Minnesota Rules 2017, 5200.1035, subp. 2. 3 See for example, the U.S. Census Bureau’s American Community Survey or its Survey of Income and Program Participation. 4 In most circumstances, the terms “job group” and “job class” are synonymous. However, for purposes of setting prevailing wage rates DLI condenses 50 job classes for commercial power equipment operators into 8 job groups and 16 job classes for truck drivers are into 4 job groups. Therefore, we use the term “job group” throughout the report except when specifically referencing the individual job classes. 5 Minnesota Rules 2017, 5200.1035 subp. 2, item A.
Minnesota Center for Fiscal Excellence
8
counties if possible, or else by other means – often using historical information.6 Third, DLI takes additional steps if the department determines that the prevailing wage generated by the survey data (either own-county data or imported data) is a collectively bargained rate. If that is the case, DLI staff will certify the current union rate for that job group in that county, regardless of what the prevailing wage generated by the survey data might be, so long as they have that information.7
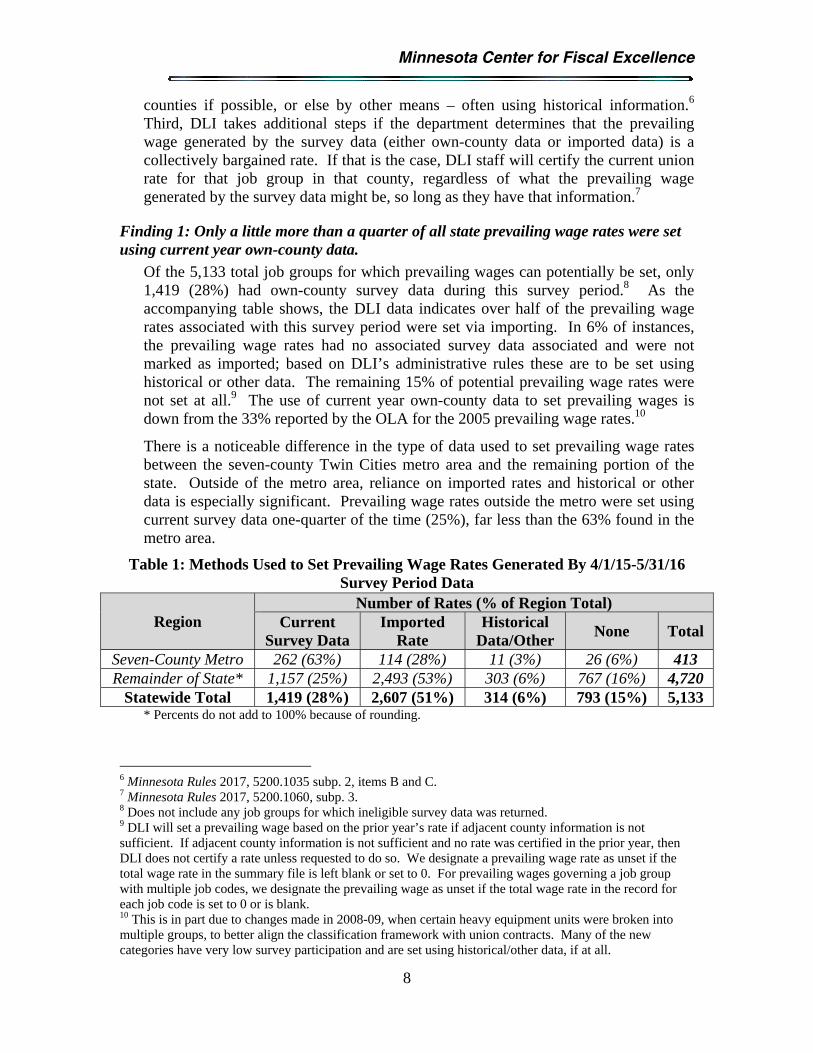
Finding 1: Only a little more than a quarter of all state prevailing wage rates were set using current year own-county data.
Of the 5,133 total job groups for which prevailing wages can potentially be set, only 1,419 (28%) had own-county survey data during this survey period.8 As the accompanying table shows, the DLI data indicates over half of the prevailing wage rates associated with this survey period were set via importing. In 6% of instances, the prevailing wage rates had no associated survey data associated and were not marked as imported; based on DLI’s administrative rules these are to be set using historical or other data. The remaining 15% of potential prevailing wage rates were not set at all.9 The use of current year own-county data to set prevailing wages is down from the 33% reported by the OLA for the 2005 prevailing wage rates.10
There is a noticeable difference in the type of data used to set prevailing wage rates between the seven-county Twin Cities metro area and the remaining portion of the state. Outside of the metro area, reliance on imported rates and historical or other data is especially significant. Prevailing wage rates outside the metro were set using current survey data one-quarter of the time (25%), far less than the 63% found in the metro area.
Table 1: Methods Used to Set Prevailing Wage Rates Generated By 4/1/15-5/31/16 Survey Period Data
Region Number of Rates (% of Region Total)
Current Survey Data
Imported Rate
Historical Data/Other
None Total
Seven-County Metro 262 (63%) 114 (28%) 11 (3%) 26 (6%) 413 Remainder of State* 1,157 (25%) 2,493 (53%) 303 (6%) 767 (16%) 4,720
Statewide Total 1,419 (28%) 2,607 (51%) 314 (6%) 793 (15%) 5,133 * Percents do not add to 100% because of rounding.
6 Minnesota Rules 2017, 5200.1035 subp. 2, items B and C. 7 Minnesota Rules 2017, 5200.1060, subp. 3. 8 Does not include any job groups for which ineligible survey data was returned. 9 DLI will set a prevailing wage based on the prior year’s rate if adjacent county information is not sufficient. If adjacent county information is not sufficient and no rate was certified in the prior year, then DLI does not certify a rate unless requested to do so. We designate a prevailing wage rate as unset if the total wage rate in the summary file is left blank or set to 0. For prevailing wages governing a job group with multiple job codes, we designate the prevailing wage as unset if the total wage rate in the record for each job code is set to 0 or is blank. 10 This is in part due to changes made in 2008-09, when certain heavy equipment units were broken into multiple groups, to better align the classification framework with union contracts. Many of the new categories have very low survey participation and are set using historical/other data, if at all.

Minnesota’s Prevailing Wage: An Evaluation of the Rate-Setting Process
9
Finding 2: Those prevailing wage rates that were able to be set using own-county survey data were concentrated in a very small number of job groups.
As Table 2 indicates, just 13 job groups account for over half of the 1,419 prevailing wage rates that could be set during the period using current survey data. In only seven job groups (electrician, sheet metal worker, skilled laborer, carpenter, common laborer, pipefitter/steamfitter, and plumber) could current survey data be used to establish prevailing wage rates in two-thirds or more of Minnesota counties.
Table 2: Job Groups With Prevailing Wage Rate Set Using Survey Data in 40 or More Counties
Job Group Number of Counties Where
Survey Data Set Rate Electricians 74 Sheet Metal Workers 74 Skilled Laborers 68 Carpenters 65 Common Laborers 62 Pipefitters – Steamfitters 62 Plumbers 58 Bricklayers 56 Painters 55 Heating & Frost Insulators 53 Power Equipment Operators Group 5 48 Roofers/Waterproofers 41 Drywall Tapers 41
At the other end of the spectrum, for three job groups prevailing wage rates were set using survey data in only two counties; for another three job groups rates were set using survey data in one county; and in the case of 5 job groups, no survey data was submitted anywhere in Minnesota.
Finding 3: Collectively bargained prevailing wage rates predominate throughout the state
In its 2007 report, the OLA identified over two-thirds of commercial construction prevailing wage rates as being set using current own-county or adjacent-county data as union rates.11 Roughly ten years later, union rates appear to be even more prevalent. Using the data in the summary files, we find that 75% of the commercial construction prevailing wage rates set using these survey returns are union rates. There are differences between the rates that are set directly from survey data and rates that are set via importing. Rates set with own-county survey responses were found to be union rates 86% of the time, while rates set using imported data were union rates in 69% of instances.
11 Prevailing Wages. Program Evaluation Division, Office of the Legislative Auditor, State of Minnesota. February 2007. Table 1.2 (calculations by MCFE)

Minnesota Center for Fiscal Excellence
10
Table 3 shows our findings broken down by both region and type of data used to generate the prevailing wage. As the table indicates, prevailing wages set with current data are more likely to be union rates in the seven-county metro (89% of the time) than in the rest of the state (73% of the time). However, this difference is largely driven by rates set directly with survey data. The proportion of union rates in the prevailing wage rates set using imported data is relatively equal between the two regions.
Table 3: Number and Proportion of Prevailing Wage Rates Determined to be Collectively Bargained, by Region and Source for Rates
Own-County Survey Data
Imported Data
Combined
Seven-County Metro 253 (97% of total) 81 (71% of total) 334 (89% of total) Remainder of State 963 (83% of total) 1,713 (69% of total) 2,676 (73% of total) Statewide Total 1,216 (86% of total) 1,794 (69% of total) 3,010 (75% of total)
Overall, the proportion of nonresidential construction employees in Minnesota covered by a collective bargaining agreement is likely to be somewhat smaller than 75%. While there is no other survey specific to nonresidential construction workers, data from the U.S. Census Bureau’s Current Population Survey indicates the proportion of total private-sector construction workers in Minnesota covered by a collective bargaining agreement was 31.6% in 2015 and 37.2% in 2016 – the two calendar years that overlap with the time period this report studies.12
Finding 4: A very small number of individuals often determine a prevailing wage rate, even in populous counties.
The rules governing the rate-setting process requires that a minimum of two projects be reported from a county in order to set any prevailing wage rates for that county using survey data.13 However, beyond that, there are no minimum requirements for setting rates using survey data. In fact, the data indicates that a small number of individuals often set prevailing wage rates.
We found that of the 1,419 prevailing wage rates that could be set using current county survey data, 251 of those rates – 18% – had one data point (i.e., one person working on one project). Most of these rates (228) were located outside the seven-county metro, and were most common in the elevator constructor and several power equipment operator job groups. However, there were very few job groups that did not have at least one instance of a record being set using one data point.
In another 414 cases, (29% of all rates set using survey data), we found that although there were multiple records submitted, all the employees for whom records were submitted had identical compensation rates, to the penny. In many cases, this can be attributed to the fact that all the employees submitted worked on the same project. But in other cases, this involves multiple employees on multiple projects.
12 Data taken from Union Membership and Coverage Database, constructed by Barry T. Hirsch and David A. Macpherson; available at www.unionstats.com 13 Minnesota Rules 2017, 5200.1035, subp. 2, item A.
Minnesota’s Prevailing Wage: An Evaluation of the Rate-Setting Process
11
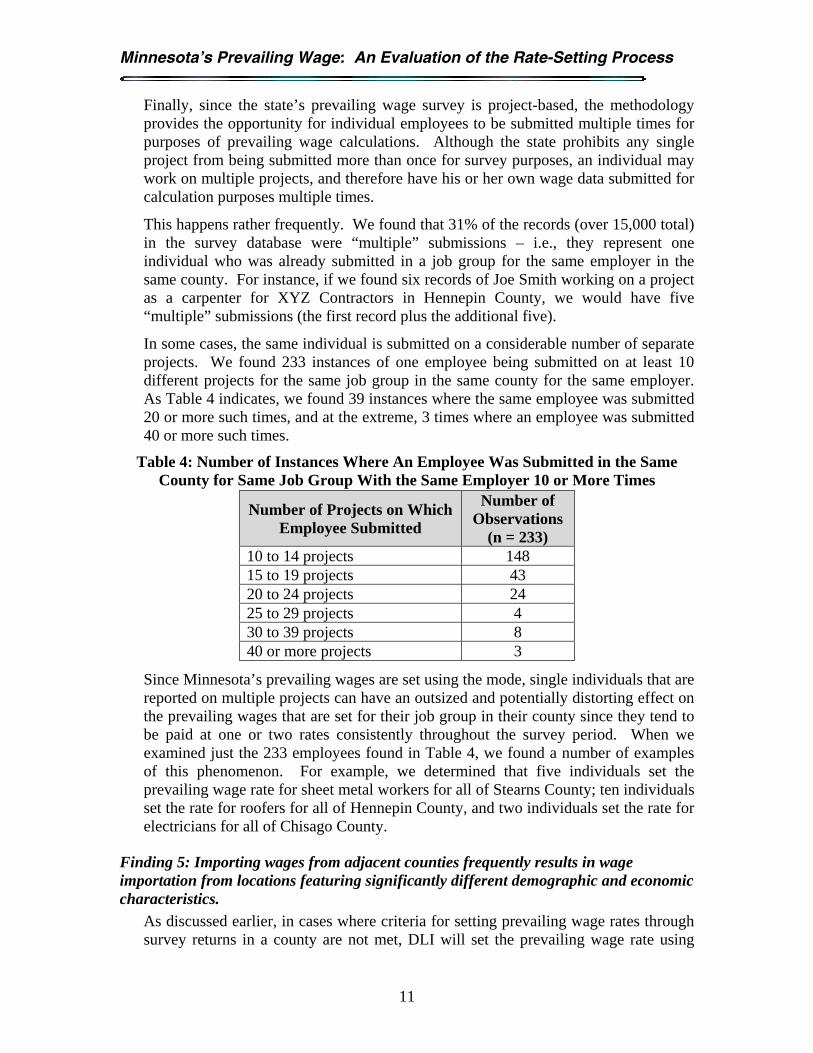
Finally, since the state’s prevailing wage survey is project-based, the methodology provides the opportunity for individual employees to be submitted multiple times for purposes of prevailing wage calculations. Although the state prohibits any single project from being submitted more than once for survey purposes, an individual may work on multiple projects, and therefore have his or her own wage data submitted for calculation purposes multiple times.
This happens rather frequently. We found that 31% of the records (over 15,000 total) in the survey database were “multiple” submissions – i.e., they represent one individual who was already submitted in a job group for the same employer in the same county. For instance, if we found six records of Joe Smith working on a project as a carpenter for XYZ Contractors in Hennepin County, we would have five “multiple” submissions (the first record plus the additional five).
In some cases, the same individual is submitted on a considerable number of separate projects. We found 233 instances of one employee being submitted on at least 10 different projects for the same job group in the same county for the same employer. As Table 4 indicates, we found 39 instances where the same employee was submitted 20 or more such times, and at the extreme, 3 times where an employee was submitted 40 or more such times.
Table 4: Number of Instances Where An Employee Was Submitted in the Same County for Same Job Group With the Same Employer 10 or More Times
Number of Projects on Which Employee Submitted
Number of Observations
(n = 233) 10 to 14 projects 148 15 to 19 projects 43 20 to 24 projects 24 25 to 29 projects 4 30 to 39 projects 8 40 or more projects 3
Since Minnesota’s prevailing wages are set using the mode, single individuals that are reported on multiple projects can have an outsized and potentially distorting effect on the prevailing wages that are set for their job group in their county since they tend to be paid at one or two rates consistently throughout the survey period. When we examined just the 233 employees found in Table 4, we found a number of examples of this phenomenon. For example, we determined that five individuals set the prevailing wage rate for sheet metal workers for all of Stearns County; ten individuals set the rate for roofers for all of Hennepin County, and two individuals set the rate for electricians for all of Chisago County.
Finding 5: Importing wages from adjacent counties frequently results in wage importation from locations featuring significantly different demographic and economic characteristics.
As discussed earlier, in cases where criteria for setting prevailing wage rates through survey returns in a county are not met, DLI will set the prevailing wage rate using

Minnesota Center for Fiscal Excellence
12
data from an adjacent county or counties if possible. Embedded in this methodology is the assumption that simple geography is a reasonable proxy for “community” as articulated in the state’s prevailing wage statute. However, neighboring counties can differ dramatically with respect to demographic and economic characteristics.
To examine how often prevailing wage rates might be imported into a dissimilar county, we segregated Minnesota’s 87 counties into four groups with similar demographic and economic characteristics. Our categorization is based on the federal Office of Management and Budget’s designation of Metropolitan Statistical Areas (MSA) and Micropolitan Statistical Areas (mSA)14. OMB provides the following definitions for both types of areas:
Metropolitan Statistical Areas have at least one urbanized area of 50,000 or more population, plus adjacent territory that has a high degree of social and economic integration with the core as measured by commuting ties. Micropolitan Statistical Areas have at least one urban cluster of at least 10,000 but less than 50,000 population, plus adjacent territory that has a high degree of social and economic integration with the core as measured by commuting ties.
OMB identifies eight Metropolitan Statistical Areas and 18 Micropolitan Statistical Areas that are partially or fully located in Minnesota. We placed Minnesota counties into the appropriate categories yielding the following results:
Twin Cities MSA (14 counties) Other Minnesota MSAs (13 counties) Minnesota Micropolitan Statistical Areas – generally regional or subregional
centers (19 counties) Remainder of state – “Rural areas” (41 counties)
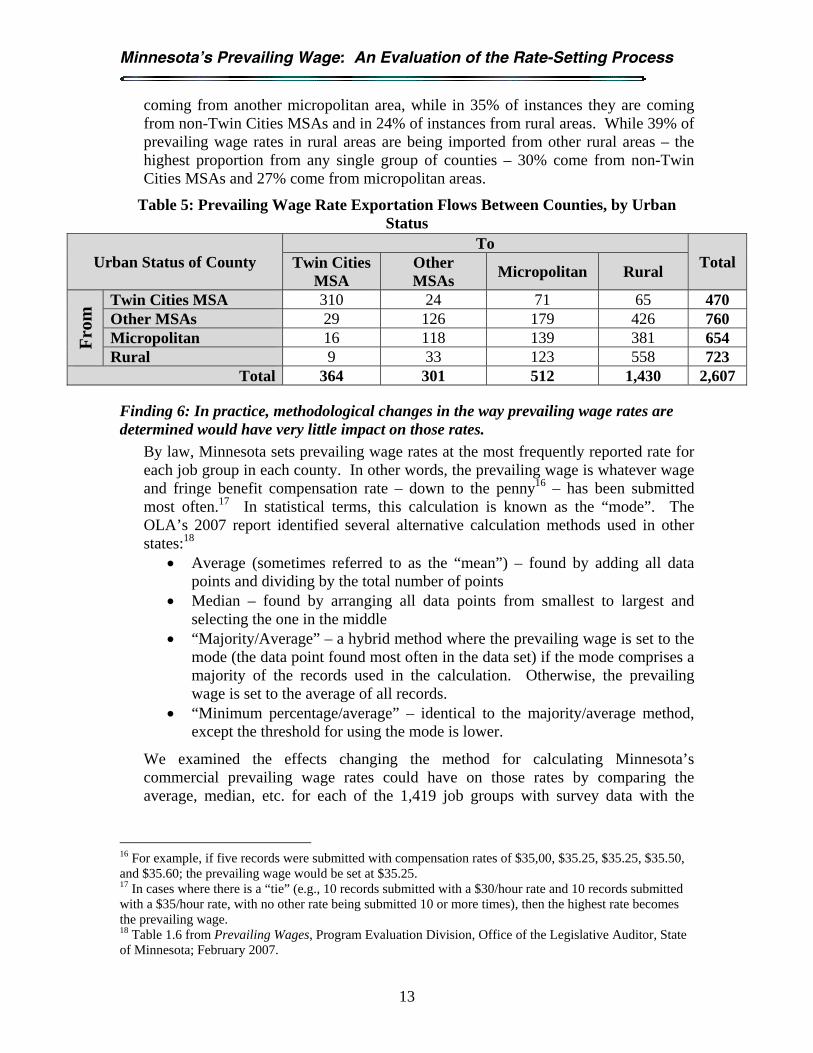
We identified 2,607 prevailing wage rates in the summary files that were generated using imported data.15 Table 5 shows how these rates flow among these groups of counties. For counties in an MSA, rates generally tended to be imported from other counties within an MSA (usually the same MSA, unless another MSA is adjacent) or from a micropolitan county. As the table indicates, roughly 85% of the rates imported into Twin Cities MSA counties came from other Twin Cities MSA counties. 42% of the rates for other MSAs statewide came from counties in an MSA, while 39% came from adjoining micropolitan areas.
However, micropolitan and rural areas tend to import rates from a more diverse set of areas. Only 27% of prevailing wage rates imported into a micropolitan area are
14 OMB. Bulletin No. 17-01, August 15, 2017. 15 The DLI data indicates whether any individual prevailing wage rate was set with imported data by identifying a county from which data was imported. However, the data does not immediately indicate the number of counties from which data was imported. Based on discussions with persons knowledgeable with the administrative processes used to set the prevailing wage rates, we determined that the county referenced in the data is either 1) the sole county from which data was taken, or 2) the county which provided the most data used to set the rate. Additional analysis might provide a more complete analysis of the importing flows; but such an effort is beyond the resources provided for this report.
Minnesota’s Prevailing Wage: An Evaluation of the Rate-Setting Process
13
coming from another micropolitan area, while in 35% of instances they are coming from non-Twin Cities MSAs and in 24% of instances from rural areas. While 39% of prevailing wage rates in rural areas are being imported from other rural areas – the highest proportion from any single group of counties – 30% come from non-Twin Cities MSAs and 27% come from micropolitan areas.
Table 5: Prevailing Wage Rate Exportation Flows Between Counties, by Urban Status
Urban Status of County To
Total Twin Cities MSA
Other MSAs
Micropolitan Rural
Fro
m Twin Cities MSA 310 24 71 65 470
Other MSAs 29 126 179 426 760 Micropolitan 16 118 139 381 654 Rural 9 33 123 558 723
Total 364 301 512 1,430 2,607
Finding 6: In practice, methodological changes in the way prevailing wage rates are determined would have very little impact on those rates.
By law, Minnesota sets prevailing wage rates at the most frequently reported rate for each job group in each county. In other words, the prevailing wage is whatever wage and fringe benefit compensation rate – down to the penny16 – has been submitted most often.17 In statistical terms, this calculation is known as the “mode”. The OLA’s 2007 report identified several alternative calculation methods used in other states:18
Average (sometimes referred to as the “mean”) – found by adding all data points and dividing by the total number of points
Median – found by arranging all data points from smallest to largest and selecting the one in the middle
“Majority/Average” – a hybrid method where the prevailing wage is set to the mode (the data point found most often in the data set) if the mode comprises a majority of the records used in the calculation. Otherwise, the prevailing wage is set to the average of all records.
“Minimum percentage/average” – identical to the majority/average method, except the threshold for using the mode is lower.
We examined the effects changing the method for calculating Minnesota’s commercial prevailing wage rates could have on those rates by comparing the average, median, etc. for each of the 1,419 job groups with survey data with the
16 For example, if five records were submitted with compensation rates of $35,00, $35.25, $35.25, $35.50, and $35.60; the prevailing wage would be set at $35.25. 17 In cases where there is a “tie” (e.g., 10 records submitted with a $30/hour rate and 10 records submitted with a $35/hour rate, with no other rate being submitted 10 or more times), then the highest rate becomes the prevailing wage. 18 Table 1.6 from Prevailing Wages, Program Evaluation Division, Office of the Legislative Auditor, State of Minnesota; February 2007.

Minnesota Center for Fiscal Excellence
14
mode.19 Understanding that when the survey data generates a collectively bargained rate the actual prevailing wage may differ from the database-generated mode, this nevertheless provides an estimate of what effect changing the calculation method might have on prevailing wages.
Table 6 shows the most influential change: switching from a modal calculation to a simple average. Yet, as the table indicates, in nearly half of instances, there was absolutely no difference between the average and mode for those job groups because all of those groups either 1) have one data point (survey record), or 2) have multiple data points that are all identical. In all these instances, the calculation method is irrelevant, since all the identified alternative methods will yield the same result. In 18% of instances, changing the simple average was higher than the mode; while in 35% of instances the mode was higher than the average. However, in most cases the change is relatively small – in 85% of the observations the difference between the two is within plus or minus 5%.
Table 6: Average Relative to Mode for Job Groups with Survey Data, by Range Differential,
Average vs. Mode # Observations
(n = 1,419) % of Total
Over 10% increase 26 2% 5% to 10% increase 21 1% 0% to 5% increase 209 15% No change 666 47% 0% to 5% decrease 327 23% 5% to 10% decrease 46 3% Over 10% decrease 124 9%
The effect of changing to other alternative calculation methods is even smaller. Table 7 shows the impact of changing from the current modal calculation to: a median calculation, a majority/average calculation, and a 30%/average calculation. Under all three alternative methods, there is no difference between the alternative method and the mode in the vast majority of instances: 85% unchanged between mode and median, 86% unchanged between mode and majority/average, and 95% unchanged between mode and 30%/majority calculation20. In those instances where there is a difference, the alternative method generates a smaller number three to four times as often, depending on the method employed.
19 Note that the OLA’s 2007 report included an analysis of the effect of alternative calculation methods. Our results are not strictly comparable to theirs since different reporting patterns will result in different numbers of rates for which this analysis can be performed. In its report, the OLA estimated that a majority/average method would yield the same prevailing wage in 70% of instances, with 22% of wages lower and 8% higher; a median method would yield the same prevailing wage in over three-quarters of instances; a 30% mode/median method would yield the same prevailing wage in 90% of instances, and using the 75th percentile of wages reported would yield the same prevailing wage in 82% of instances. The report did not provide information on the distribution of changed rates for the last three alternate methods. 20 Where the rate is set equal to the mode if the mode comprises at least 30% of total records submitted; otherwise an average is computed.

Minnesota’s Prevailing Wage: An Evaluation of the Rate-Setting Process
15
Table 7: Selected Alternative Calculation Methods Relative to Mode for Job Groups with Survey Data, by Range
Differential, Selected Method
vs. Mode
Median Majority/Average 30%/Average
# Obs % of Total
# Obs % of Total
# Obs % of Total
Over 10% increase 13 1% 15 1% 9 1% 5% to 10% increase 5 <1% 9 1% 2 <1% 0% to 5% increase 25 2% 32 2% 4 <1% No change 1,207 85% 1,220 86% 1,355 95% 0% to 5% decrease 78 5% 56 4% 8 1% 5% to 10% decrease 15 1% 13 1% 4 <1% Over 10% decrease 76 5% 74 5% 37 3% Note: Total number of observations (individual prevailing wage rate calculations) is 1,419.
There is some evidence of geographical differences in switching to an alternative calculation method. As Table 8 indicates, the average and mode are the same in only one-third of the job groups in the seven-county metro, with the average lower roughly half of the time and higher in about 20% of instances. In the remainder of the state, half of the job groups – a much higher proportion than in the metro – generate an identical average and mode, with the average lower than the mode in about one-third of instances and higher that the mode in the remaining 17% of job groups.
Table 8: Average Relative to Mode for Job Groups with Survey Data, by Range, Seven-County Metro vs Remainder of State
Range of Change Seven-County Metro Remainder of State
# Observations % of Total # Observations % of Total Over 10% increase 1 <1% 25 2% 5% to 10% increase 0 0% 21 2% 0% to 5% increase 55 21% 154 13% No change 84 32% 582 50% 0% to 5% decrease 115 44% 212 18% 5% to 10% decrease 2 1% 44 4% Over 10% decrease 5 2% 119 10% Note: Total number of observations (individual prevailing wage rate calculations) is 1,419.

Minnesota Center for Fiscal Excellence
16
THIS PAGE INTENTIONALLY BLANK

Minnesota’s Prevailing Wage: An Evaluation of the Rate-Setting Process
17
IV. Conclusions
1. The state’s prevailing wage system design is biased toward supporting union labor rates.
In its 2007 report, the OLA identified over two-thirds (69%) of commercial construction prevailing wage rates set using current own-county or adjacent-county data as union rates. In this data set, we identify 75% of all rates set using current own-county or adjacent-county data as union rates. In many respects this is not surprising, given that all the aspects of the prevailing wage survey process that the OLA concluded, “could lead to overrepresentation of union wages among reported wages” continue to exist:
Use of mode. By requiring an exact “to the penny” match of employee wage and benefits in setting the “prevailing wage”, the uniformity derived though collectively bargained rates offers a considerable reporting advantage over non-unionized labor.
Greater reporting frequency. Wage information can be reported to DLI by either contractors or interested third parties. In its 2007 report, the OLA found about half the commercial survey responses came from entities other than contractors – and these responses come primarily from unions
Use of historical data. Our analysis shows 6% of rates were set without using either current survey data or imported data from adjacent counties. In these cases, historical information is generally used to set the prevailing wage rate.21 As the OLA report noted,” using past prevailing wages reinforces collectively bargained rates.”
Our analysis of prevailing wage determinations under alternative calculation methods offers additional support for the argument that union rates have a disproportionate influence in setting prevailing wages. If the data being used to calculate prevailing wage rates were capturing the diversity of wages and benefits that undoubtedly exists among all commercial construction contractors across the state, we would expect that alternative calculation methods would have a noticeable impact on prevailing wage rates. Instead, we find that for the 1,419 job groups for which we have own-county survey data, the raw data generates a median, majority/average, and 30%/majority that is equal to the mode 85% of the time. The average is equal to the mode in roughly half of the instances, and differs from the mode by more than 5% (plus or minus) only 15% of the time.
2. The OLA’s primary recommendation with respect to improving the rate determination process – improving the survey response rate to obtain data more representative of compensation rates for private commercial construction work in Minnesota – is extremely difficult to accomplish.
The difficulty in obtaining information from a larger population and broader cross section of commercial construction activity is partly structural. The use of the mode,
21 Minnesota Rules 2017, 5200.1035, subp. 2, item D.
Minnesota Center for Fiscal Excellence
18
which determines “prevailing wages” by the frequency of occurrence of total compensation rates matched to the penny, continues to be a major disincentive in having wage surveys completed and returned. The diversity of wage and benefit packages among “merit shop” contractors makes it difficult to justify the time, effort, and expense of submitting survey forms since their far less homogenous compensation structures are much less likely to set the prevailing wage rate than union rates, which are shared across a variety of employers.
However, based on information from commercial construction contractors, even if this attitudinal barrier could be overcome, other issues present major challenges for increasing survey response rates:
Even though state law allows trade associations to submit data on behalf of contractors, it is not practical to expect trade associations to do so since they do not have the same access to employee wage and benefit data to which unions have lawful access.
Wage survey data is public, and some contractors do not want their employees’ names, wages, and benefits made public for others, including competitors, to see.
The highly specified and discrete job classification system on which prevailing wages are determined can itself be a disincentive to return the survey and frequently conflicts with the human resource management designs many contractors want to employ. From discussions with industry representatives, efficiency and flexibility in workforce management conflicts with the premise and constructs behind existing prevailing wage law. For example, skill acquisition and development could result in someone working multiple job groups on the same project (for example, performing both carpentry, laborer, and bricklayer work). Each employee on a project can only be submitted once for a project, and only for the job group in which he or she worked the greatest number of hours.22 For employers who prefer to allow employees to work in multiple job groups, determining how to comply with the legal requirements for completing the survey can be much more challenging than for an employer who adheres to a more strictly regimented work environment
3. We cannot determine whether current practices actually achieve the stated policy intent of Minnesota’s prevailing wage law – “ensuring comparable wages paid for similar work in the community as a whole”.
Minnesota’s prevailing wage law creates the appearance of a robust process to achieve its policy purpose. However, on closer inspection, it is clear any confidence that prevailing rates are a true reflection of local labor compensation may be misplaced, given the following factors that policymakers have designed into the system:
The current system of project-based reporting plus voluntary survey participation enables a few individuals – and in many cases a single individual
22 Minn. Rules 5200.1060, subp. 2, item D.

Minnesota’s Prevailing Wage: An Evaluation of the Rate-Setting Process
19
– to determine the prevailing wage for a job group for an entire county. In this case, the prevailing wage will reflect local labor compensation only if the individual being submitted is representative of all labor in the county that is qualified to work on nonresidential construction in that particular job group.
As noted earlier in the report, half of the prevailing wages set using this series of survey data were imported from adjacent counties. Prevailing wage rates set using imported data reflect local labor compensation levels only if two conditions are satisfied. First, that there are, in fact, no laborers present in the county that are qualified to work on nonresidential construction in the designated job group – and that it is not the case that any such laborers simply failed to work on a project in the county that was reported to DLI. Second, that the wage and fringe benefit costs being imported reflect local conditions. However, rates are routinely imported into counties from other areas that have dissimilar demographic and economic characteristics – most notably the 60% of rural prevailing wage rates that are imported for micropolitan or metropolitan areas.
Minnesota Center for Fiscal Excellence
20
THIS PAGE INTENTIONALLY BLANK

Minnesota’s Prevailing Wage: An Evaluation of the Rate-Setting Process
21
V. Recommendations
Our analysis finds little evidence that the methods by which prevailing wages are established are any more robust than they were ten years ago. Rather, we find concerns flagged by the Office of the Legislative Auditor at that time persist today. Moreover, we conclude it remains impossible to determine if the resulting administrative process delivers on the law’s stated legislative purpose.
The 2007 OLA report discussed two potential alternatives to the current survey method – use of the Occupational Employment Statistics survey conducted by the state’s Department of Employment and Economic Development in conjunction with the federal Department of Labor, or adoption of federal prevailing wage rates in lieu of survey results. The OLA concluded that serious shortcomings associated with both options outweighed any advantages.
The OLA report also identified two potential tweaks to the existing survey process specifically to try to make the survey results more representative of industry-wide compensation rates: 1) excluding data from projects that were subject to the state’s prevailing wage law; and 2) prohibiting unions from submitting wage and benefit information. However, the OLA concluded such actions could reduce the amount of wage and benefit information sent to DLI, making it more difficult for the department to set prevailing wage rates.
As a result, the OLA’s sole information gathering-related recommendation focused on obtaining higher survey response rates through better outreach – public information campaigns, follow up mailings, and networking with trades, chambers and related interest groups. However, as our second conclusion highlighted, even employing the most aggressive outreach and communication campaigns is unlikely to adequately address the practical and attitudinal barriers affecting survey returns, especially among “merit shops.”
More fundamentally, determining how successful these strategies are will never be feasible because the survey universe – commercial projects in the state exceeding the statutory $2,500 or $25,000 thresholds – is practicably unknowable. This points to the fundamental weakness of the existing survey design – surveying projects – and the advantage of an alternative approach that we recommend the state adopt – surveying contractor firms.
Surveying employers would offer several distinct advantages over the existing method for establishing prevailing wages:
A defined population of firms offers the opportunity to design a survey that uses probability sampling that would generate results that can be used to draw inferences about the overall population of eligible employees using statistical methods.
It would eliminate skewed results arising from the multiple counts of the same individual.
It would better capture and reflect the spirit and intent of the state’s prevailing wage statute – ensuring prevailing wage rates are “comparable to wages paid

Minnesota Center for Fiscal Excellence
22
for similar work in the community as a whole” – by making certain that rates are based on wage and benefit structures of county-based employers.
Reengineering the prevailing wage survey process around employers would undoubtedly require an investment of time, effort, and dollars to address various implementation issues including survey methodology and data privacy concerns. Moreover, as part of these methodological changes, policymakers would also need to work with stakeholders to determine a process to ensure that the survey captures only compensation data for those employees who are qualified to work on noncommercial construction projects.
Since methodological changes to the survey process will result in firms submitting “average” wages for each relevant job group, it is even more likely that a handful of firms with uniform pay scales would have great influence over the rate-setting process if a modal-only calculation continues to be used. Therefore, in conjunction with these methodological changes, we recommend that the state switch to using a majority-average method to calculate the prevailing wage, in which the mode would be used to set the wage if it represents a majority of responses and an average of all responses would be used otherwise. Hybrid calculation methods like this are commonly used across the country in setting prevailing wage rates, as both the federal government and a plurality of states with prevailing wage laws use either a majority-average calculation or some other system where the mode is paired with another calculation method and used only if it represents some minimum percentage of total responses. Moving to a majority-average system also ensures that competing notions of “prevailing wage” (the single wage rate reported more often than any other versus an average wage rate) both factor into the calculations – ensuring some linkage between reporting frequency and a central tendency.
If the state is committed both to the legislative intent expressed in state prevailing wage law and the most robust possible implementation of this idea, these changes are crucial.

Minnesota’s Prevailing Wage: An Evaluation of the Rate-Setting Process
23
VI. Appendix A: Methodology
Data Sources
The Minnesota Department of Labor and Industry (DLI) administers the state’s prevailing wage laws. Associated Builders and Contractors provided data from DLI for the prevailing wage survey covering projects dated April 1, 2015 through May 31, 2016. Two related sets of data were provided. One set contained the complete survey returns for the period, with 50,272 individual records relating to nonresidential commercial construction projects. The data was provided in 87 Excel files, one for each county in Minnesota. Each record provides data on one individual working on one project and provides information on the following:
County where project was located Labor class and group category in which work was performed First and last name of individual Wage rate, fringe rate, and total compensation rate Employer Project name and project date Unique identifier (which allows individual surveys to be identified) Whether the contractor performing the work or a union submitted the record Whether the submission was made via the internet or paper Whether DLI discarded the record for prevailing wage calculation purposes
The second group of files provided summary data on the prevailing wages calculated using this set of prevailing wage records, and also came in 87 individual Excel files. Among the information these files provided was:
The prevailing wage for each labor class and job group, with wage and fringe components.
Whether the prevailing wage was generated from same-county data; or if not, the county from which the majority of the data used in the calculations was taken.
The number of returns with the total compensation rate equal to the rate set as the prevailing wage.
Whether or not the prevailing wage generated from the survey returns (including those generated using imported data, when appropriate) were identified as a collectively bargained rate.
The report studies 59 job groups that pertain to nonresidential commercial construction projects, as listed in Minnesota Rules 5200.1100, subp. 2, 2a, 3a, 4, and 5.
Note that for purposes of power equipment operators and truck drivers, we studied job groups instead of the various labor classes that make up these groups since DLI reports prevailing wages by job group for these types of workers. See Appendix A for a complete list of the job classes analyzed in this report. This report does not examine job groups that are specific to highway and heavy construction; mostly because of the small number of survey records (292 in total, from 27 counties).
Minnesota Center for Fiscal Excellence
24
We did discuss the datasets with people familiar with DLI’s prevailing wage survey process. The field providing information on the county from which the data was taken requires some explanation. In cases where local survey data was used to set the prevailing wage rate, that field is set equal to the county of interest. In cases where the prevailing wage was imported from an adjacent county, that field is set equal to an adjacent county. However, DLI may import a prevailing wage using data from multiple adjacent counties. The datasets did not allow us to immediately determine whether the county referenced was the only county from which data was taken, or whether it was the county which provided the highest proportion of data used to calculate the prevailing wage rates.
Records Removed From Analysis
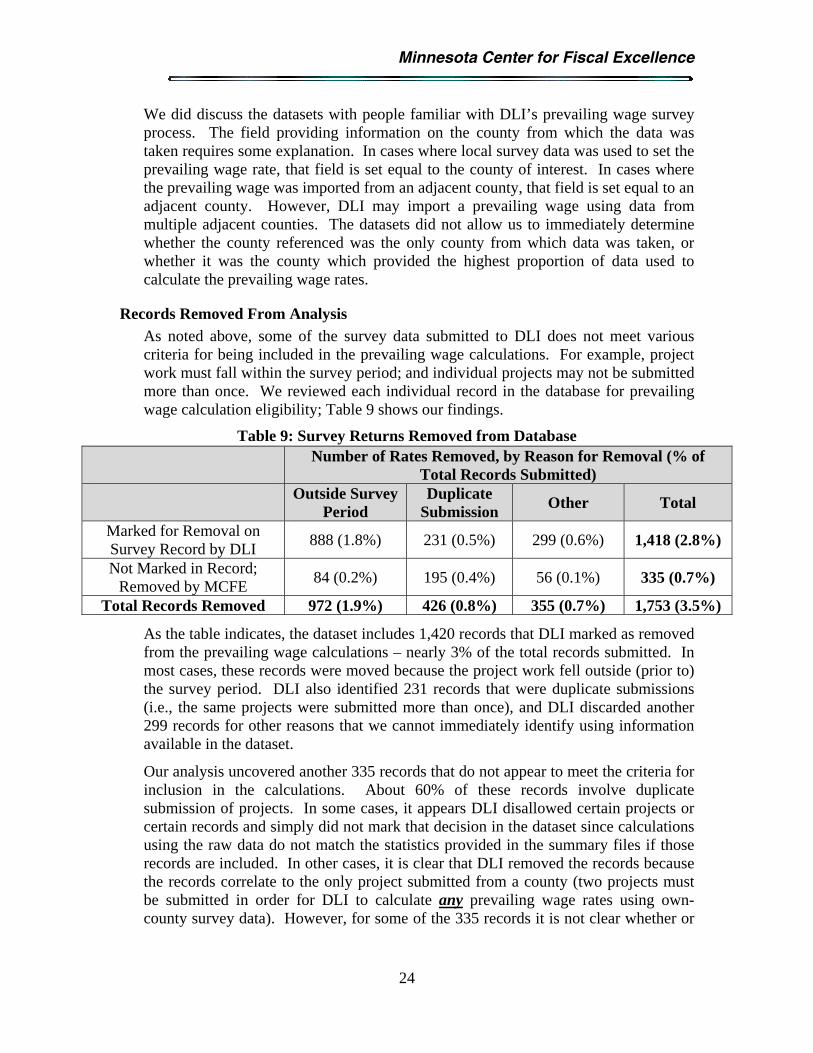
As noted above, some of the survey data submitted to DLI does not meet various criteria for being included in the prevailing wage calculations. For example, project work must fall within the survey period; and individual projects may not be submitted more than once. We reviewed each individual record in the database for prevailing wage calculation eligibility; Table 9 shows our findings.
Table 9: Survey Returns Removed from Database Number of Rates Removed, by Reason for Removal (% of
Total Records Submitted) Outside Survey
Period Duplicate
Submission Other Total
Marked for Removal on Survey Record by DLI
888 (1.8%) 231 (0.5%) 299 (0.6%) 1,418 (2.8%)
Not Marked in Record; Removed by MCFE
84 (0.2%) 195 (0.4%) 56 (0.1%) 335 (0.7%)
Total Records Removed 972 (1.9%) 426 (0.8%) 355 (0.7%) 1,753 (3.5%)
As the table indicates, the dataset includes 1,420 records that DLI marked as removed from the prevailing wage calculations – nearly 3% of the total records submitted. In most cases, these records were moved because the project work fell outside (prior to) the survey period. DLI also identified 231 records that were duplicate submissions (i.e., the same projects were submitted more than once), and DLI discarded another 299 records for other reasons that we cannot immediately identify using information available in the dataset.
Our analysis uncovered another 335 records that do not appear to meet the criteria for inclusion in the calculations. About 60% of these records involve duplicate submission of projects. In some cases, it appears DLI disallowed certain projects or certain records and simply did not mark that decision in the dataset since calculations using the raw data do not match the statistics provided in the summary files if those records are included. In other cases, it is clear that DLI removed the records because the records correlate to the only project submitted from a county (two projects must be submitted in order for DLI to calculate any prevailing wage rates using own-county survey data). However, for some of the 335 records it is not clear whether or

Minnesota’s Prevailing Wage: An Evaluation of the Rate-Setting Process
25
not DLI actually removed them from the dataset. For purposes of our analysis, we removed all 335 of these records.
After removing these 1,753 records, the dataset contained 48,519 records with which we worked. Of the 1,419 modes these records generated, 1,404 matched the summary file – i.e., that they yielded the same amount using the same number of records. In 15 cases (1% of the time), the survey records did not match the summary data. In 8 instances, the mode calculated from the survey data did not match the mode presented in the summary data. Further investigation suggests that these discrepancies are the result of data entry errors. In 7 instances, the modes matched between the two sets of files, but the number of records purported to be at the mode differed between the survey data and summary file. In most cases the difference is one or two records, and the discrepancies do not materially affect the report’s findings.
We attempted to identify the total number of projects this database includes. However, it became apparent that such an effort was beyond our capabilities – mostly because many projects require multiple contractors. Individual contractors can and do use different names for the same project, and it proved impossible to determine whether and how the roughly 8,000 unique project names we identified relate to each other.

Minnesota Center for Fiscal Excellence
26
THIS PAGE INTENTIONALLY BLANK

Minnesota’s Prevailing Wage: An Evaluation of the Rate-Setting Process
27
VII. Appendix B: List of Job Classes Analyzed in Report
Code # Job Class
Laborers 101 Laborer, common (general labor work) 102 Laborer, skilled (assisting skilled craft journeyman) 103 Laborer, Landscaping (gardener, sod layer and nursery operator) 104 Flag person 105 Watch person 106 Blaster 107 Pipelayer (water, sewer and gas) 108 Tunnel miner 109 Underground and open ditch laborer (eight feet below starting grade level) 110 Survey field technician (operate total station, GPS receiver, level, rod or
range poles, steel tape measurement; mark and drive stakes; hand or power digging for and identification of markers or monuments; perform and check calculations; review and understand construction plans and land survey materials).
111 Traffic control person (temporary signage) 112 Quality control tester (field and covered off-site facilities; testing of
aggregate, asphalt, and concrete materials); limited to MN DOT highway and heavy construction projects where the MN DOT has retained quality assurance professionals to review and interpret the results of quality control testers’ services provided by the contractor.
Special Equipment 201 Articulated Hauler 202 Boom truck 203 Landscaping equipment, includes hydro seeder or mulcher, sod roller,
farm tractor with attachment specifically seeding, sodding, or plant, and two-framed forklift (excluding front, posit-track, and skid steer loaders), no earthwork or grading for elevations.
204 Off-road truck 205 Pavement marking or marking removal equipment (one or two person
operators); self-propelled truck or trailer mounted units.
Commercial Power Equipment Operators – Group 1 501 Helicopter pilot 502 Tower crane 250 feet and over 503 Truck crawler crane with 200 feet of boom and over, including jib
Commercial Power Equipment Operators – Group 2 504 Concrete pump with 50 meters/164 feet of boom or over 505 Pile driving when three drums in use 506 Tower crane 200 feet and over 507 Truck or crawler crane with 150 feet of boom up to and not including 200
feet, including jib

Minnesota Center for Fiscal Excellence
28
Commercial Power Equipment Operators – Group 3 508 All-terrain vehicle cranes 509 Concrete pump 32-49 meters/102-164 feet 510 Derrick (guy and stiffleg) 511 Stationary tower crane 200 feet and over measured from boom foot pin 512 Self-erecting tower crane 100 feet and over measured from boom foot pin 513 Traveling tower crane 514 Truck or crawler crane up to and not including 150 feet of boom,
including jib
Commercial Power Equipment Operators – Group 4 515 Crawler backhoe including attachments 516 Fireperson, chief boiler license 517 Hoist engineer (three drums or more) 518 Locomotive 519 Overhead crane (inside building perimeter) 520 Tractor – boom type
Commercial Power Equipment Operators – Group 5 521 Air compressor 450 CFM or over (two or more machines) 522 Concrete mixer 523 Concrete pump up to 31 meters/101 feet of boom 524 Drill rigs, heavy rotary or churn or cable drill when used for caisson for
elevator or building construction 525 Forklift 526 Front end, posi-track, and skid steer type loaders one cubic yard and over,
including attachments 527 Hoist engineer (one or two drums) 528 Mechanic-welder (on power equipment) 529 Power plant (10 KW and over or multiples equal to 100KW and over) 530 Pump operator and/or conveyor (two or more machines) 531 Self-erecting tower crane under 100 feet measured from boom foot pin 532 Straddle carrier 533 Tractor over D2 534 Well point pump
Commercial Power Equipment Operators – Group 6 535 Concrete batch plant 536 Fireperson, first class boiler license 537 Front end, posi-track, and skid steer type loaders up to one cubic yard,
including attachments 538 Gunite machine 539 Tractor operator D2 or similar size 540 Trenching machine (sewer, water, gas) excludes walk behind trencher
Commercial Power Equipment Operators – Group 7 541 Air compressor 600 CFM or over 542 Brakeperson

Minnesota’s Prevailing Wage: An Evaluation of the Rate-Setting Process
29
543 Concrete pump/pumpcrete or complaco type 544 Fireperson, temporary heat second class boiler license 545 Oiler (power shovel, crane, truck crane, dragline, crushers and milling
machines, or other similar power equipment) 546 Pick up sweeper (one cubic yard hopper capacity) 547 Pump and/or conveyor
Commercial Power Equipment Operators – Group 8 548 Elevator operator 549 Greaser 550 Mechanical space heater (temporary heat no boiler license required)
Truck Drivers – Group 1 601 Mechanic – welder 602 Tractor trailer driver 603 Truck driver (hauling machinery including operation of hand and power
operated winches)
Truck Drivers – Group 2 604 Four or more axle unit, straight body truck
Truck Drivers – Group 3 605 Bituminous distributor driver 606 Bituminous distributor (one person operation) 607 Three axle units
Truck Drivers – Group 4 608 Bituminous distributor spray operator (rear and oiler) 609 Dump person 610 Greaser 611 Pilot car driver 612 Rubber-tired, self-propelled packer under 8 tons 613 Two axle unit 614 Slurry operator 615 Tank truck helper (gas, oil, road oil, and water) 616 Tractor operator, under 50 h.p.
Special Crafts 701 Heating and frost insulators 702 Boilermakers 703 Bricklayers 704 Carpenters 705 Carpet Layers (Linoleum) 706 Cement Masons 707 Electricians 708 Elevator constructors 709 Glaziers 710 Lathers 711 Ground person

Minnesota Center for Fiscal Excellence
30
712 Ironworkers 713 Lineman 714 Millwright 715 Painters (including hand brushed, hand sprayed, and the taping of
pavement markings) 716 Piledriver (including vibratory driver or extractor for piling and sheeting
operations) 717 Pipefitters – steamfitters 718 Plasterers 719 Plumbers 720 Roofer 721 Sheet metal workers 722 Sprinkler fitters 723 Terrazzo workers 724 Tile setters 725 Tile finishers (The scope of work of a tile finisher is not as broad as tile
setter. The finisher work includes mixing grout, grouting, and surfacing all types of tile, cutting tile, and sealing surfaces. Tile setters set the tile, repair and patch tile, lay out the work, and install substrates; install showers, counter tops, floors, and steps; lay quarry tile; install ceilings, mantels, hearths, swimming pools, domes, columns and arches; and perform other work not performed by tile finishers.)
726 Drywall taper 727 Wiring system technician 728 Wiring systems installer 729 Asbestos Abatement worker 730 Sign Erector Source: Prevailing Wage Survey: Survey Period April 3, 2017 – June 2, 2017, Minnesota Department of Labor and Industry.

Minnesota’s Prevailing Wage: An Evaluation of the Rate-Setting Process
31
VIII. Appendix C: Counties by Metropolitan Statistical Area and Micropolitan Statistical Area
Metropolitan Statistical Areas
Minneapolis-St. Paul-Bloomington: Anoka Carver Chisago Dakota Hennepin Isanti Le Sueur Mille Lacs Ramsey Scott Sherburne Sibley Washington Wright
Duluth: Carlton St. Louis
Fargo: Clay
Grand Forks: Polk
La Crosse-Onalaska: Houston
Mankato-North Mankato: Blue Earth Nicollet
Rochester: Dodge Fillmore Olmsted Wabasha
St. Cloud: Benton Stearns
Micropolitan Statistical Areas Albert Lea:
Freeborn
Alexandria: Douglas
Austin: Mower
Bemidji: Cass Crow Wing
Fairmont: Martin
Faribault-Northfield: Rice
Fergus Falls: Ottertail
Grand Rapids: Itasca
Hutchinson: McLeod
Marshall: Lyon
New Ulm: Brown
Owatonna: Steele
Red Wing: Goodhue

Minnesota Center for Fiscal Excellence
32
Wahpeton: Wilkin
Willmar: Kandiyohi
Winona: Winona
Worthington: Nobles