minnesota’s agricultural statistics … · greg kimmet christy meyer miste salmon kerry siekmann...
TRANSCRIPT

������� ����
��� ��
����������
����
�������
�����
���������
� �����
�������� �������
�������
���� �� ���
����
��������
�!�����
���
����
������ "�����#��
$���
���
%����
���� ���� ��&���
��'�
(���
��
)�
����
� �''�(
*����(���������
���������
������ � �������������
��������
���������
��������
������������
�������� #���
��������
�����
������
������ �
������
������
���� �
���&����������
�����
��&��
�������
��������
���(
����
+�����
���������
������
����
� ����
+���
�����'����,
���
������������
��������
���(���
��'������
���� ������(���
����
������ -�����
���������
��������
��������
���(�
���
.��
��� ��
����
����
�����
����� /����� /�������
�������������
��������
%���
$��� �
%����
���
"������
��(�� /�������
�����
������
���������
��������
����
����
#�&����
�������
����(�
�����
�����
����
����(���
�� ������
MINNESOTA’S AGRICULTURALSTATISTICS DISTRICTS
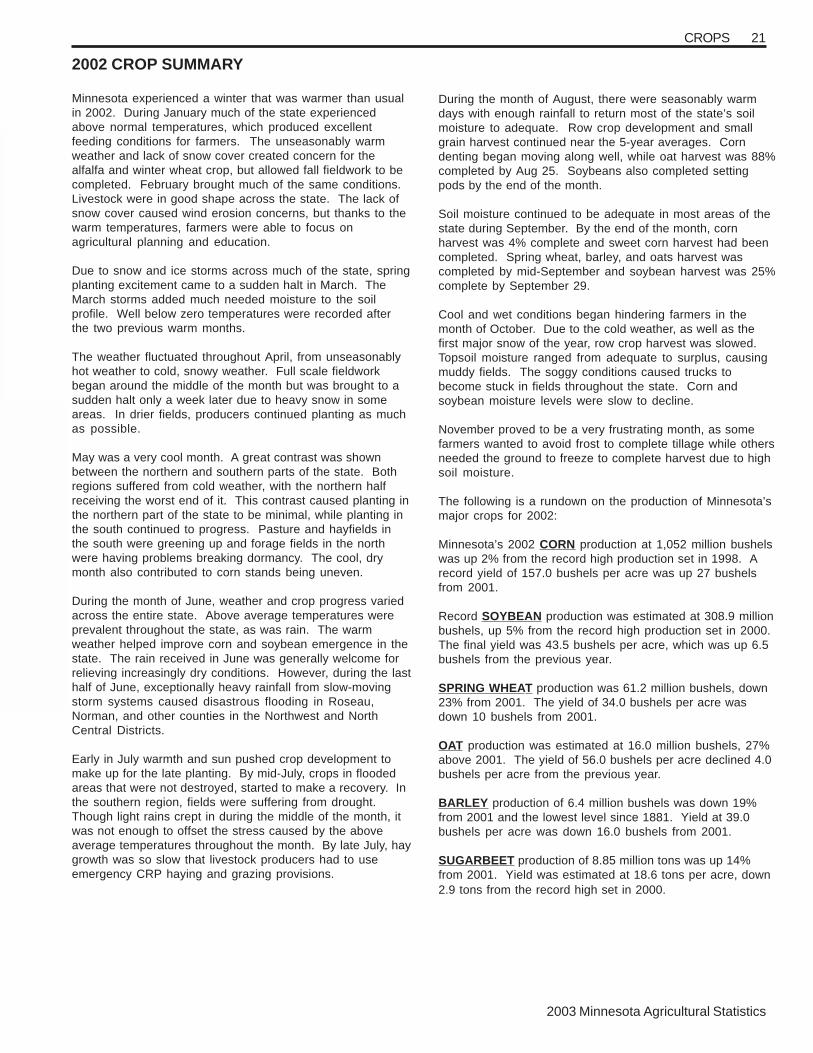
Photos were provided courtesy of the University of MinnesotaAgricultural Experiment Station, David Hansen;
USDA Photography Center, and USDA-ARS Image Gallery
This document is made available electronically by the Minnesota Legislative Reference Library as part of an ongoing digital archiving project. http://www.leg.state.mn.us/lrl/lrl.asp
Minnesota Agricultural Statistics 2003
Michael Hunst, State Statistician
George Howse, Deputy State Statistician
ADMINISTRATION Carolyn Hayes DATA MANAGEMENT Susan Doty Victoria Kitto COVER DESIGN Dawn Sunderland EDITOR Elizabeth Hart
ESTIMATES Chris Engen Greg Kimmet Christy Meyer Miste Salmon
Kerry Siekmann Wayne Stigge
Eileen Thurman Bob Waldera
Charles Walker
SURVEYS & LIST SAMPLING FRAME
Craig Anderson Nancy Anderson
Roger Binning Stephanie Brown
Kathy Culley Linda Lieder
Robert Purvis Craig Stahl
Phillip Stiens
FIELD INTERVIEWERS Grace Anderson - Newfolden John Anderson - Halstad Marjorie Anderson - Aurora Judith Antolick - Benson Elizabeth Barrett -Grand Forks, ND Paul Barrett - East Grand Forks Arlene Berdan - Winthrop Pauline Berndt - Pelican Rapids Richard Bishop - Dodge Center Bonnie Bock - Truman Barrie Breyfogle - Luverne Elizabeth Buck - Zumbrota Sylvia Vavra Burton - Harris Clifford Bussler - Brownton Leroy Christen - Paynesville Diane Corey - Herman DiAnne Dingmann - Litchfield John Donnay - Kimball Kenneth Eickhoff - Fountain Dorothy Eischens - Tracy Julie Erickson - Lamberton Lois Fennell - Danvers Eloise Finstad - Hanska
FIELD INTERVIEWERS (Continued) Timothy Fitcher - Lake Crystal
Bryce Gaudian - Hayward John Gilbertson - Puposky
Doris Graven - Dawson Sharon Groves - Cambridge
Theresa Gruba-Goad - Kettle River Mary Hofmann - Sedan
Edna Holmquist - Richville Marjorie Jackson - Grand Rapids
Norman Jensen - Faribault Odean Johnson - New Richland
Dawn Kellen - Clinton Judith Martin - Middle River Kevin McCrea - Mazeppa
Paulette Melby - Greenbush Mary Moehring - Blue Earth
Dennis Niemann - Lamberton Joyce Olson - Barrett
Karen Pearson - Cambridge Sandy Peterson - Dawson Audrey Plessner - Madison Bob Potter - Park Rapids Roxanne Potter - Windom
Carl Prischmann - Fergus Falls
FIELD INTERVIEWERS (Continued) Trudy Raak - Jasper
Linda Rader - Dilworth Verne Radloff - New Ulm
Lori Rollag - Gary Lorraine Rustad - McIntosh
Dean Schentzel - Alpha Karen Simon - Staples
Carol Skarsten - Benson Jeanette Sluis - Edgerton
Barbara Smith - Darwin Rick Wendorff - Fulda
Karen Wendroth - Richmond Rhea Lin West - Richville
Nancy Wettstein - Long Prairie
OFFICE INTERVIEWERS Josephine Gonzalez
Gloria Griffin Marguerite Harrington
John Kolar Erma McGuire
Sylvester Phillippi Eleanor Stafstrom
Minnesota Agricultural Statistics Service P.O. Box 7068, St. Paul, Minnesota 55107 Phone: (651) 296-2230 or 1-800-453-7502
http://www.nass.usda.gov/mn/ E-mail: [email protected]
The Minnesota Department of Agriculture is an equal opportunity employer.
Issued Cooperatively byU.S. Department of Agriculture National Agricultural Statistics Service Ron Bosecker, Administrator
Minnesota Department of Agriculture Gene Hugoson, Commissioner

TABLE OF CONTENTS
2003 Minnesota Agricultural Statistics
TABLE OF CONTENTS
GENERAL INFORMATION Foreword ..................................................................................1 State Rankings .........................................................................2 County Rankings ......................................................................3 Farm Numbers .........................................................................4 Exports .....................................................................................5 Land Values.......................................................................... 5-6 Cropland Cash Rents ...............................................................6 Cost of Production: Corn and Soybeans...............................................................7 Wheat and Barley ..................................................................8 Oats and Sugarbeets.............................................................9 Hogs ....................................................................................10 Cow-Calf ..............................................................................11 Milk ......................................................................................12 Farm Income ..........................................................................13 Cash Receipts from Farm Marketings ....................................14 Farm Balance Sheet ...............................................................15 Weather Summary..................................................................16 Median Frost Dates ................................................................17 Monthly Precipitation ..............................................................18 CROPS Planting and Harvesting Dates ......................................... 19-20 Crop Summary........................................................................21 Record Highs..........................................................................22 Historical Crop Data: Corn, Soybeans, Oats, Barley, Rye......................................23 Wheat, Flaxseed, Sugarbeets ..............................................24 Sunflowers, Canola, Hay......................................................25 Dry Edible Beans..................................................................26 Sweet Corn, Green Peas, Onions, Carrots, Apples..............27 Potatoes ..............................................................................28 Grain Storage Capacity ..........................................................28 Objective Yield Data for Corn, Soybeans, Spring Wheat........................................................................29 Floriculture..............................................................................30 Agricultural Chemical Usage: Corn .....................................................................................31 Soybeans.............................................................................32 Potatoes...............................................................................33 County Estimates: Corn............................................................................... 34-35 Corn for Silage............................................................... 36-37 Soybeans....................................................................... 38-39 All Wheat ....................................................................... 40-41 Spring Wheat................................................................. 42-43 Canola .................................................................................43 Oats ............................................................................... 44-45 All Hay ........................................................................... 46-47 Alfalfa Hay ..................................................................... 48-49 Barley and Barley Varieties ........................................... 50-51 Potatoes ..............................................................................52 Sugarbeets ..........................................................................53 Dry Edible Beans.................................................................54 All Sunflowers ......................................................................55 Oil Sunflowers......................................................................56 Flaxseed ..............................................................................56 Sweet Corn for Processing ..................................................57 Green Peas for Processing..................................................58
Grain and Hay Stocks.................................................... 59 Crop Marketings ............................................................ 60 Wild Rice ....................................................................... 61 Fertilizer Usage.............................................................. 61 Farm Labor .................................................................... 62 GEOGRAPHICAL DISTRIBUTION MAPS Corn and Soybeans....................................................... 63 Wheat and Hay.............................................................. 64 Cattle and Hogs............................................................. 65 Milk Cows and Sheep.................................................... 66 LIVESTOCK, DAIRY, POULTRY Livestock Summary ....................................................... 67 Operations by Size Groups............................................ 68 Production Records ....................................................... 69 Inventory and Values..................................................... 70 Cattle and Calves, Production and Income.................... 71 Cattle, Sheep County Estimates............................... 72-73 Beef Cows, Milk Cows County Estimates ................. 74-75 Sows Farrowed and Pig Crop........................................ 76 Hogs and Pigs ............................................................... 77 Hogs and Pigs County Estimates ............................. 78-79 Sheep, Lambs, and Wool .............................................. 80 Commercial Livestock Slaughter ................................... 81 Dairy Summary......................................................... 82-83 Milk Cows and Milk Production County Estimates.... 84-85 Dairy Farm Numbers by County .................................... 86 Poultry Summary ........................................................... 87 Poultry and Eggs, Production and Value .................. 88-89 Mink Pelt Production...................................................... 90 Honey Production and Value ......................................... 90 FARM PRICES RECEIVED BY FARMERS Crop Prices............................................................... 91-92 Livestock Prices........................................................ 93-94 Dairy Prices ................................................................... 95 Turkey and Egg Prices .................................................. 96 COUNTY HIGHLIGHTS Summary of County Statistics................................. 97-118 DATA PRODUCTS AND SERVICES Reports and Data from USDA/NASS........................... 119 INDEX .............................................................. 120-121
Foreword Over the years, one of the messages I’ve often shared with Minnesota farmers is that to maximize profitability, they need to constantly be looking for new ways to do things more efficiently and effectively. It’s not enough to continue running a business the same way it’s been run for decades. Times change, markets change, and in order to stay relevant, farmers need to keep pace. Running a farming business effectively requires having current and accurate information in order to make sound production and marketing decisions. Publications such as this Minnesota Agricultural Statistics book and the Census of Agriculture help give all of us better insight into agricultural trends. Estimates of crop and livestock production, farm income and expenses, farm numbers and land in farms, and many others, help the entire agricultural community plan for the future of Minnesota agriculture. I want to express my gratitude to all the farmers and agribusinesses that made this book possible by responding to surveys conducted by the Minnesota Agricultural Statistics Service. Gene Hugoson, Commissioner Minnesota Department of Agriculture Although Minnesota is a major producer of corn, soybeans, and spring wheat, farmers in the State also produce a wide variety of other crops. This year we are featuring on our cover many of the speciality crops grown in Minnesota. These crops are grown throughout the State, but especially in the Red River Valley of Northwestern Minnesota. We hope this publication will help tell the story of trends in Minnesota agriculture. If you need more information in a particular area, please let us know. Your ideas will help us improve this important service. E-mail us at [email protected] or call us at 1-800-453-7502. Also, visit our web site at www.nass.usda.gov/mn/. Michael Hunst, State Agricultural Statistician Minnesota Agricultural Statistics Service
FOREWORD 1
2003 Minnesota Agricultural Statistics

2003 Minnesota Agricultural Statistics
2 STATE RANKINGS
STATE RANKINGS: Minnesota’s Rank Among States 1/
Item 1� 2� 3� 4� 5� 6� 7� 8� 9� 10�
Cash Receipts, 2001� Total� CA TX IA NE KS MN NC IL FL WI Livestock & Livestock Products� TX CA NE IA KS NC WI MN GA AR Crops� CA IL IA FL TX MN WA NE IN NC Crop Production, 2002� Corn� IA IL MN NE IN WI SD KS MO OH Soybeans� IA IL MN IN NE MO OH SD AR ND All Wheat � KS ND WA MT OK ID TX MN OH NE Spring Wheat� ND MT MN ID WA SD OR CO UT WI Oats� MN WI IA ND TX PA SD MI OH NY Barley� ND ID MT WA CO MN CA WY PA AZ All Sunflowers� ND SD KS MN CO TX NE Dry Edible Beans� ND MI NE MN ID CA CO WA WY MT All Hay� TX CA MO KS MN NE IA ID KY WI All Potatoes� ID WA WI CO OR ND MN CA ME MI Sugarbeets� MN ID ND MI CA MT CO NE WY OR Flaxseed� ND MT MN SD Canola� ND MN Sweet Corn for Processing� WA MN WI OR IL Green Peas for Processing� MN WA WI OR NY Cultivated Wild Rice 2/� CA MN Livestock, Dairy, Poultry� Red Meat Production, 2002� NE IA KS TX IL MN CO NC IN WI Cattle/Calves, January 1, 2003 3/� TX KS NE OK CA MO SD IA WI CO Milk Cows, January 1, 2003� CA WI NY PA MN ID TX NM MI OH Cattle/Calves Marketed, 2002 4/� TX KS NE CO OK CA SD IA MO MT Cattle/Calves on Feed, Jan 1, 2003 3/� TX NE KS CO IA CA SD OK ID AZ Hogs & Pigs, December 1, 2002 5/� IA NC MN IL IN MO NE OK KS OH Pig Crop, 2002� NC IA MN IL MO NE OK IN KS OH Hogs Marketed, 2002� IA NC MN IL MO NE OK IN SD OH All Sheep & Lambs, Jan 1, 2003 6/� TX CA WY SD CO UT MT ID IA OR Lamb Crop, 2002 3/� TX WY SD MT CA UT ID IA CO OR All Chickens, December 1, 2002 3/� IA OH GA PA IN CA TX AR NC AL Eggs Produced, Dec 2001-Nov 2002 � IA OH PA CA IN GA TX AR MN NE Turkeys Raised, 2002 7/� NC MN AR MO VA CA IN PA SC IA Milk Production, 2002 � CA WI NY PA MN ID NM MI WA TX Dairy Products Manufactured, 2002� Total Cheese� WI CA NY ID MN PA IA OH SD WA American Cheese � WI CA MN ID WA IA OR NY SD OH Ice Cream� CA IN PA TX MN OH NY NC MI FL Mink Pelts Produced, 2001� WI UT MN OR ID WA IA SD PA OH Honey Produced, 2002� ND CA FL SD MN MT TX WI NY ID Agricultural Exports, Fiscal Year 2001� CA TX IA KS IL NE MN WA IN NC
1/ Rankings based on published data. 2/ Source: Minnesota Cultivated Wild Rice Council. 3/ Minnesota ranks 11th. 4/ Minnesota ranks 15th. 5/ MO and NE tied for 6th place. 6/ Minnesota ranks 13th. 7/ PA and SC tied for 8th place.
2003 Minnesota Agricultural Statistics
3COUNTY RANKINGS
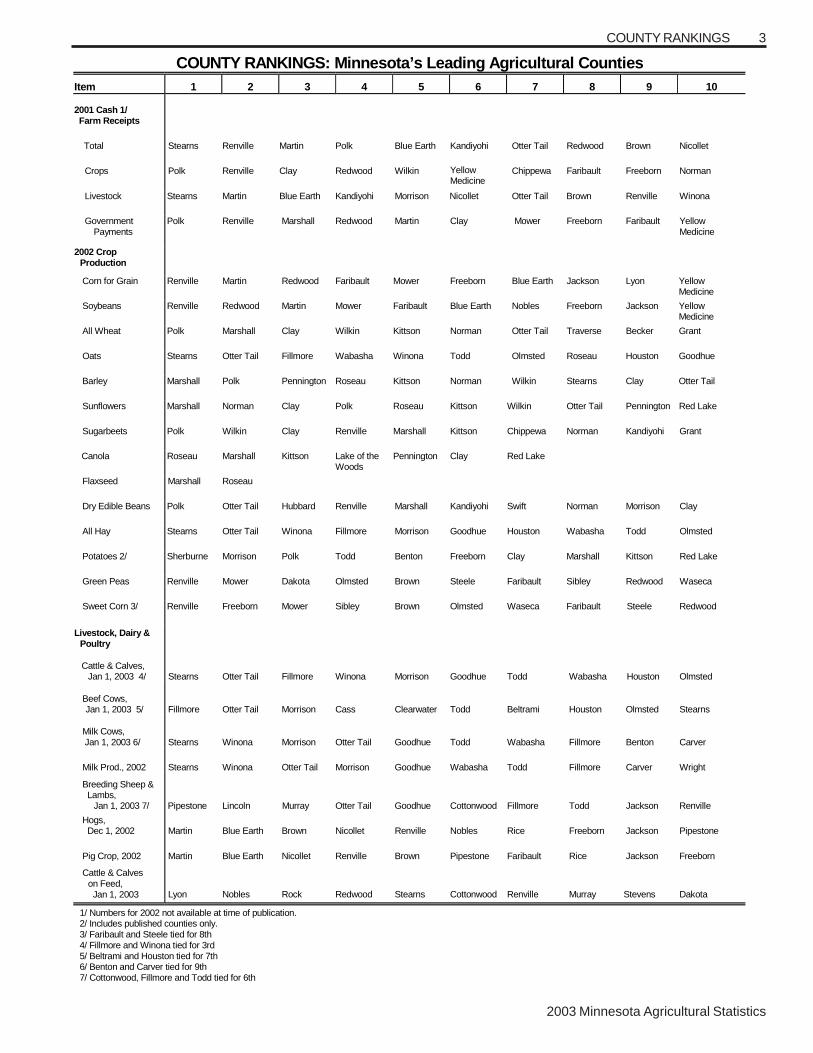
1/ Numbers for 2002 not available at time of publication. 2/ Includes published counties only. 3/ Faribault and Steele tied for 8th 4/ Fillmore and Winona tied for 3rd 5/ Beltrami and Houston tied for 7th 6/ Benton and Carver tied for 9th 7/ Cottonwood, Fillmore and Todd tied for 6th
COUNTY RANKINGS: Minnesota’s Leading Agricultural Counties
Item 1 2 3 4 5 6 7 8 9 10
2001 Cash 1/ Farm Receipts
Total Stearns Renville Martin Polk Blue Earth Kandiyohi Otter Tail Redwood Brown Nicollet
Crops Polk Renville Clay Redwood Wilkin Chippewa Faribault Freeborn Norman
Yellow Medicine
Livestock Stearns Martin Blue Earth Kandiyohi Morrison Nicollet Otter Tail Brown Renville Winona
Government Payments
Polk Renville Marshall Redwood Martin Clay Mower Freeborn Faribault Yellow Medicine
2002 Crop Production
Corn for Grain Renville Martin Redwood Faribault Mower Freeborn Blue Earth Jackson Lyon Yellow Medicine
Soybeans Renville Redwood Martin Mower Faribault Blue Earth Nobles Freeborn Jackson Yellow Medicine
All Wheat Polk Marshall Clay Wilkin Kittson Norman Otter Tail Traverse Becker Grant
Oats Stearns Otter Tail Fillmore Wabasha Winona Todd Olmsted Roseau Houston Goodhue Barley Marshall Polk Pennington Roseau Kittson Norman Wilkin Stearns Clay Otter Tail
Sunflowers Marshall Norman Clay Polk Roseau Kittson Wilkin Otter Tail Pennington Red Lake
Sugarbeets Polk Wilkin Clay Renville Marshall Kittson Chippewa Norman Kandiyohi Grant
Canola Roseau Marshall Kittson Pennington Clay Red Lake
Flaxseed Marshall Roseau
Lake of the Woods
Dry Edible Beans Polk Otter Tail Hubbard Renville Marshall Kandiyohi Swift Norman Morrison Clay
All Hay Stearns Otter Tail Winona Fillmore Morrison Goodhue Houston Wabasha Todd Olmsted
Potatoes 2/ Sherburne Morrison Polk Todd Benton Freeborn Clay Marshall Kittson Red Lake
Green Peas Renville Mower Dakota Olmsted Brown Steele Faribault Sibley Redwood Waseca
Sweet Corn 3/ Renville Freeborn Mower Sibley Brown Olmsted Waseca Faribault Steele Redwood
Livestock, Dairy & Poultry
Cattle & Calves, Jan 1, 2003 4/ Stearns Otter Tail Fillmore Winona Morrison Goodhue Todd Wabasha Houston Olmsted
Beef Cows, Jan 1, 2003 5/ Fillmore Otter Tail Morrison Cass Clearwater Todd Beltrami Houston Olmsted Stearns
Milk Cows, Jan 1, 2003 6/ Stearns Winona Morrison Otter Tail Goodhue Todd Wabasha Fillmore Benton Carver
Milk Prod., 2002 Stearns Winona Otter Tail Morrison Goodhue Wabasha Todd Fillmore Carver Wright
Breeding Sheep & Lambs, Jan 1, 2003 7/ Pipestone Lincoln Murray Otter Tail Goodhue Cottonwood Fillmore Todd Jackson Renville
Hogs, Dec 1, 2002 Martin Blue Earth Brown Nicollet Renville Nobles Rice Freeborn Jackson Pipestone
Pig Crop, 2002 Martin Blue Earth Nicollet Renville Brown Pipestone Faribault Rice Jackson Freeborn
Cattle & Calves on Feed, Jan 1, 2003 Lyon Nobles Rock Redwood Stearns Cottonwood Renville Murray Stevens Dakota
2003 Minnesota Agricultural Statistics
4 FARMS FARM NUMBERS NUMBER OF FARMS, LAND IN FARMS, AND
NUMBER OF FARMS: By Economic Sales Class
Minnesota, 1997-2002 $1,000- $10,000- $100,000 $100,000- $250,000- $500,000
Year $9,999 $99,999 & Over $249,999 $499,999 & Over Total
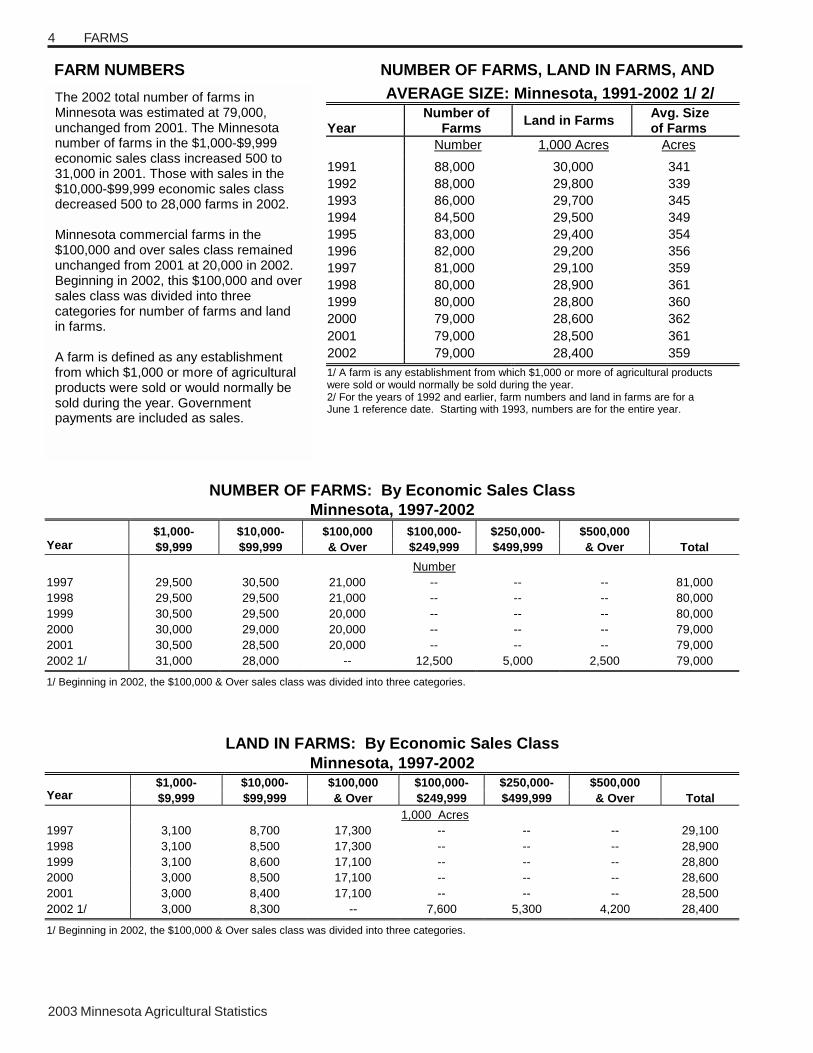
Number 1997 29,500 30,500 21,000 -- -- -- 81,000 1998 29,500 29,500 21,000 -- -- -- 80,000 1999 30,500 29,500 20,000 -- -- -- 80,000 2000 30,000 29,000 20,000 -- -- -- 79,000 2001 30,500 28,500 20,000 -- -- -- 79,000 2002 1/ 31,000 28,000 -- 12,500 5,000 2,500 79,000 1/ Beginning in 2002, the $100,000 & Over sales class was divided into three categories.
LAND IN FARMS: By Economic Sales Class
Minnesota, 1997-2002 $1,000- $10,000- $100,000 $100,000- $250,000- $500,000
Year $9,999 $99,999 & Over $249,999 $499,999 & Over Total 1,000 Acres 1997 3,100 8,700 17,300 -- -- -- 29,100 1998 3,100 8,500 17,300 -- -- -- 28,900 1999 3,100 8,600 17,100 -- -- -- 28,800 2000 3,000 8,500 17,100 -- -- -- 28,600 2001 3,000 8,400 17,100 -- -- -- 28,500 2002 1/ 3,000 8,300 -- 7,600 5,300 4,200 28,400 1/ Beginning in 2002, the $100,000 & Over sales class was divided into three categories.
AVERAGE SIZE: Minnesota, 1991-2002 1/ 2/ Year
Number of Farms Land in Farms Avg. Size
of Farms
Number 1,000 Acres Acres
1991 88,000 30,000 341 1992 88,000 29,800 339 1993 86,000 29,700 345 1994 84,500 29,500 349 1995 83,000 29,400 354 1996 82,000 29,200 356 1997 81,000 29,100 359 1998 80,000 28,900 361 1999 80,000 28,800 360 2000 79,000 28,600 362 2001 79,000 28,500 361 2002 79,000 28,400 359 1/ A farm is any establishment from which $1,000 or more of agricultural products were sold or would normally be sold during the year. 2/ For the years of 1992 and earlier, farm numbers and land in farms are for a June 1 reference date. Starting with 1993, numbers are for the entire year.
The 2002 total number of farms in Minnesota was estimated at 79,000, unchanged from 2001. The Minnesota number of farms in the $1,000-$9,999 economic sales class increased 500 to 31,000 in 2001. Those with sales in the $10,000-$99,999 economic sales class decreased 500 to 28,000 farms in 2002. Minnesota commercial farms in the $100,000 and over sales class remained unchanged from 2001 at 20,000 in 2002. Beginning in 2002, this $100,000 and over sales class was divided into three categories for number of farms and land in farms. A farm is defined as any establishment from which $1,000 or more of agricultural products were sold or would normally be sold during the year. Government payments are included as sales.
2003 Minnesota Agricultural Statistics
5EXPORTS AND LAND VALUES
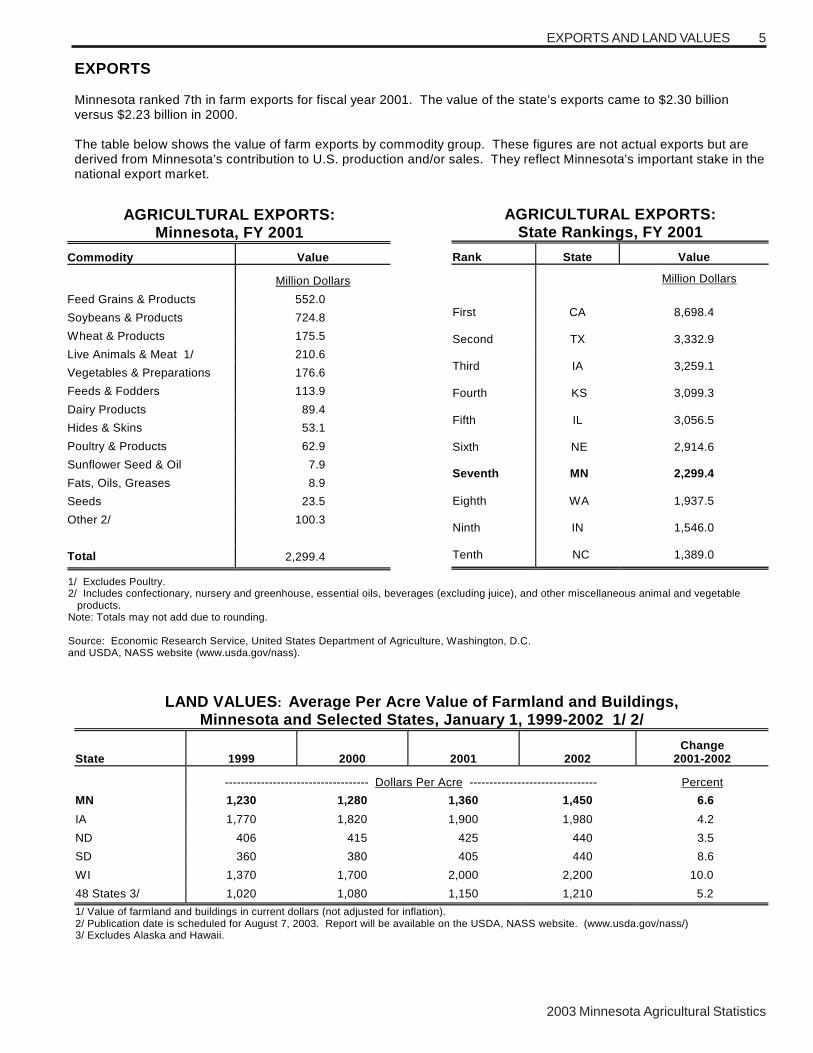
EXPORTS Minnesota ranked 7th in farm exports for fiscal year 2001. The value of the state’s exports came to $2.30 billion versus $2.23 billion in 2000. The table below shows the value of farm exports by commodity group. These figures are not actual exports but are derived from Minnesota’s contribution to U.S. production and/or sales. They reflect Minnesota’s important stake in the national export market.
1/ Excludes Poultry. 2/ Includes confectionary, nursery and greenhouse, essential oils, beverages (excluding juice), and other miscellaneous animal and vegetable products. Note: Totals may not add due to rounding. Source: Economic Research Service, United States Department of Agriculture, Washington, D.C. and USDA, NASS website (www.usda.gov/nass).
AGRICULTURAL EXPORTS: Minnesota, FY 2001
Commodity Value
Million Dollars
Feed Grains & Products 552.0
Soybeans & Products 724.8
Wheat & Products 175.5
Live Animals & Meat 1/ 210.6
Vegetables & Preparations 176.6
Feeds & Fodders 113.9
Dairy Products 89.4
Hides & Skins 53.1
Poultry & Products 62.9
Sunflower Seed & Oil 7.9
Fats, Oils, Greases 8.9
Seeds 23.5
Other 2/ 100.3
Total 2,299.4
AGRICULTURAL EXPORTS: State Rankings, FY 2001
Rank State Value
Million Dollars
First CA 8,698.4
Second TX 3,332.9
Third IA 3,259.1
Fourth KS 3,099.3
Fifth IL 3,056.5
Sixth NE 2,914.6
Seventh MN 2,299.4
Eighth WA 1,937.5
Ninth IN 1,546.0
Tenth NC 1,389.0
LAND VALUES: Average Per Acre Value of Farmland and Buildings,
Minnesota and Selected States, January 1, 1999-2002 1/ 2/
State 1999 2000 2001 2002 Change
2001-2002
------------------------------------ Dollars Per Acre -------------------------------- Percent
MN 1,230 1,280 1,360 1,450 6.6
IA 1,770 1,820 1,900 1,980 4.2
ND 406 415 425 440 3.5
SD 360 380 405 440 8.6
WI 1,370 1,700 2,000 2,200 10.0
48 States 3/ 1,020 1,080 1,150 1,210 5.2 1/ Value of farmland and buildings in current dollars (not adjusted for inflation). 2/ Publication date is scheduled for August 7, 2003. Report will be available on the USDA, NASS website. (www.usda.gov/nass/) 3/ Excludes Alaska and Hawaii.

2003 Minnesota Agricultural Statistics
6
LAND VALUES Each year, the Minnesota Department of Revenue compiles every farmland sale in the state into a single data set that includes sale price, parcel size, number of tillable acres, and other pertinent items. Statewide sales in 2002 totaled 1,788, an increase of 13.2 percent from the 2001 sales. The average acreage per sale in 2002 was 104 acres, compared with 117 acres in 2001. Average unadjusted sale price per acre was $1,414 in 2002, a decrease of $91 per acre from the 2001 average.
FARMLAND SALES: Number, Acres, and Price, Minnesota, 1998-2002 Price Per Acre
Sales Year Number of Sales Acres Sold Unadjusted
Average
Median
Number Acres -------- Dollars --------- 1998 2,491 271,848 1,214 1,096 1999 2,220 242,468 1,232 1,146 2000 2,245 252,460 1,346 1,229 2001 1,579 184,323 1,505 1,369 2002 1,788 186,434 1,414 1,499
FARMLAND SALES: Number, Acres, and Price, by District, Minnesota, 2002
Price Per Acre
Reporting District Number of Sales Acres Sold Unadjusted
Average
Median
Number Acres -------- Dollars --------- Northwest 283 45,950 595 578 North Central 55 6,351 686 817 Northeast 10 683 1,129 805 West Central 254 29,198 1,104 1,056 Central 413 33,862 1,869 1,713 East Central 135 8,605 2,166 2,136 Southwest 197 23,505 1,561 1,621 South Central 268 21,302 2,093 2,050 Southeast 173 16,978 2,106 1,624 Minnesota 1,788 186,434 1,414 1,499 Source: "Minnesota Agricultural Economist". Steven J. Taff, Department of Applied Economics, University of Minnesota. Internet Web Site (www.apec.umn.edu/faculty/staff/).
CROPLAND RENTED FOR CASH: Average Cash Rent Per Acres, Minnesota and Selected States, 1999-2002 1/ 2/
State
1999
2000
2001
2002 Change
2001-2002
--------------------------------------- Dollar Per Acre ----------------------------------------- Percent
MN 75.60 77.90 80.50 80.90 0.5 IA 112.00 115.00 117.00 120.00 2.6 ND 35.50 35.50 36.00 36.50 1.4 SD 38.00 39.80 40.00 42.00 5.0 WI 62.00 65.00 66.00 66.00 0.0 48 States 3/ 67.50 70.00 71.00 71.50 0.7 1/ Cash rent is in normal dollars (not adjusted for inflation). 2/ Publication date for 2003 data is scheduled for August 7, 2003. Report would be available on the USDA, NASS website (see page 119). 3/ Excludes Alaska and Hawaii.
LAND VALUES
2003 Minnesota Agricultural Statistics
7COST OF PRODUCTION
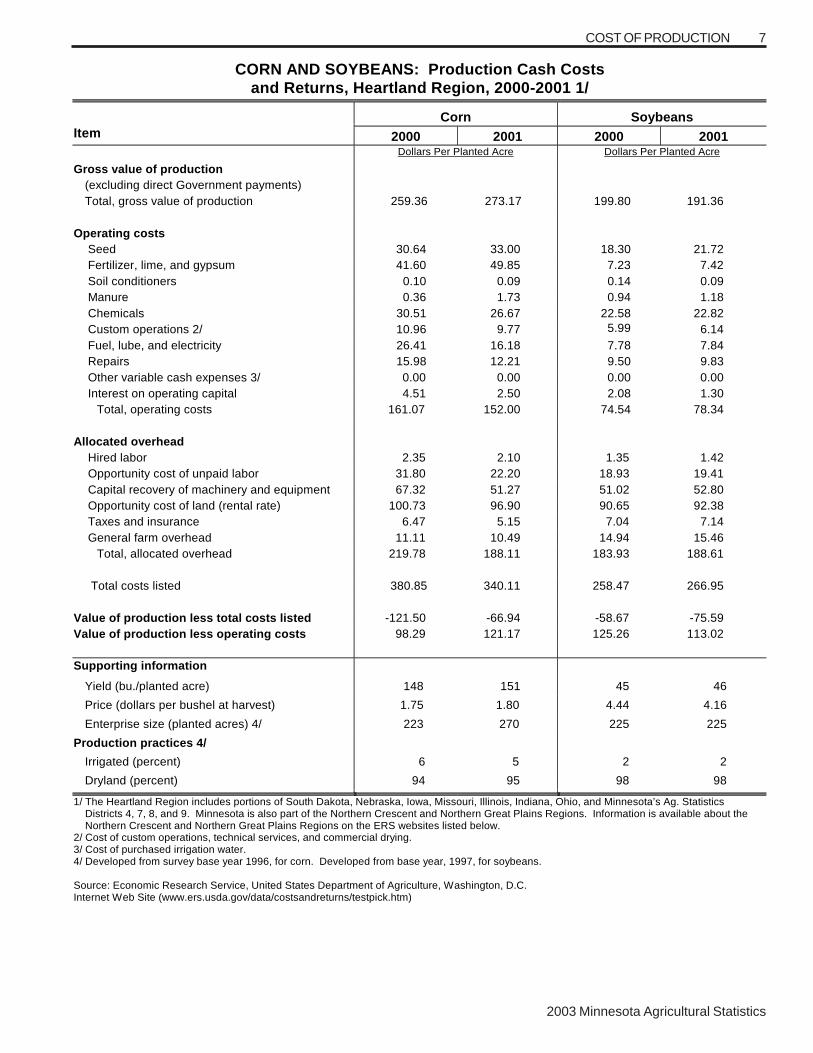
CORN AND SOYBEANS: Production Cash Costs and Returns, Heartland Region, 2000-2001 1/
Corn Soybeans Item
2000
2001
2000
2001
Dollars Per Planted Acre
Dollars Per Planted Acre Gross value of production
(excluding direct Government payments) Total, gross value of production 259.36 273.17 199.80 191.36
Operating costs Seed 30.64 33.00 18.30 21.72 Fertilizer, lime, and gypsum 41.60 49.85 7.23 7.42 Soil conditioners 0.10 0.09 0.14 0.09 Manure 0.36 1.73 0.94 1.18 Chemicals 30.51 26.67 22.58 22.82 Custom operations 2/ 10.96 9.77 5.99
6.14
Fuel, lube, and electricity 26.41 16.18 7.78 7.84 Repairs 15.98 12.21 9.50 9.83 Other variable cash expenses 3/ 0.00 0.00 0.00 0.00 Interest on operating capital 4.51 2.50 2.08 1.30
Total, operating costs 161.07 152.00 74.54 78.34 Allocated overhead
Hired labor 2.35 2.10 1.35 1.42 Opportunity cost of unpaid labor 31.80 22.20 18.93 19.41 Capital recovery of machinery and equipment 67.32 51.27 51.02 52.80 Opportunity cost of land (rental rate) 100.73 96.90 90.65 92.38 Taxes and insurance 6.47 5.15 7.04 7.14 General farm overhead 11.11 10.49 14.94 15.46
Total, allocated overhead 219.78 188.11 183.93 188.61
Total costs listed 380.85 340.11 258.47 266.95 Value of production less total costs listed -121.50 -66.94 -58.67 -75.59 Value of production less operating costs 98.29 121.17 125.26 113.02
Supporting information
Yield (bu./planted acre) 148 151 45 46
Price (dollars per bushel at harvest) 1.75 1.80 4.44 4.16
Enterprise size (planted acres) 4/ 223 270 225 225
Production practices 4/
Irrigated (percent) 6 5 2 2
Dryland (percent) 94 95 98 98
1/ The Heartland Region includes portions of South Dakota, Nebraska, Iowa, Missouri, Illinois, Indiana, Ohio, and Minnesota’s Ag. Statistics Districts 4, 7, 8, and 9. Minnesota is also part of the Northern Crescent and Northern Great Plains Regions. Information is available about the Northern Crescent and Northern Great Plains Regions on the ERS websites listed below. 2/ Cost of custom operations, technical services, and commercial drying. 3/ Cost of purchased irrigation water. 4/ Developed from survey base year 1996, for corn. Developed from base year, 1997, for soybeans. Source: Economic Research Service, United States Department of Agriculture, Washington, D.C. Internet Web Site (www.ers.usda.gov/data/costsandreturns/testpick.htm)

2003 Minnesota Agricultural Statistics
8 COST OF PRODUCTION
WHEAT: Production Cash Costs and Returns, Northern Plains Region, 1994-2001 1/ 2/ Item 1994 1995 1996 1997 1998 1999 2000 2001
Dollars per Planted Acre Gross value of production (excluding direct Government payments) Wheat 92.18 120.59 143.56 93.61 100.10 85.49 83.98 77.94 Wheat straw 0.60 0.51 0.60 0.74 1.74 1.42 1.67 1.85 Total, gross value of production 92.78 121.10 144.16 94.35 101.84 86.91 85.65 79.79 Cash expenses Seed 7.83 7.44 8.93 7.64 7.64 6.36 6.19 6.34 Fertilizer, lime, and gypsum 12.25 15.34 15.63 14.85 14.78 13.46 13.91 19.66 Chemicals 7.61 7.98 8.27 8.33 10.61 10.28 10.15 10.14 Custom operations 2.54 2.59 2.72 2.64 4.04 3.82 4.00 3.77 Fuel, lube, and electricity 5.82 5.99 7.12 6.74 4.25 4.16 6.06 6.03 Repairs 12.07 12.51 14.09 12.77 8.10 8.85 9.85 9.66 Hired labor 2.16 2.30 2.39 2.52 1.45 1.48 1.60 1.67 Other variable cash expenses 3/ 0.03 0.03 0.03 0.03 0.16 0.16 0.16 0.17 Total, variable cash expenses 50.31 54.18 59.18 55.52 51.03 48.57 51.92 57.44
. General farm overhead 4.18 5.45 4.54 5.35 6.32 6.42 6.49 6.76 Taxes and insurance 7.83 8.83 8.67 9.61 3.76 3.81 3.85 3.95 Interest 7.61 10.68 9.39 9.47 1.19 1.11 1.45 0.94 Total, fixed cash expenses 19.62 24.96 22.60 24.43 11.27 11.34 11.79 11.65
Total, cash expenses 69.93 79.14 81.78 79.95 62.04 59.91 63.71 69.09 Gross value of production less cash expenses 22.85 41.96 62.38 14.40 39.80 27.00 21.94 10.70 Harvest-period price (dollars/bu.) 3.31 4.31 4.86 3.81 2.91 2.68 2.50 2.66 Yield (bu./planted acre) 27.85 27.98 29.54 24.57 34.40 31.90 33.60 29.30 1/ Data for 1994-1997 refer to the Northern Plains Region which includes Minnesota, North Dakota, South Dakota, Montana, and Wyoming. 2/ Data for 1998 and later refer to the Northern Great Plains Region which includes North Dakota, South Dakota, and parts of Montana, Wyoming,
Nebraska and Minnesota. 3/ Cost of purchased irrigation water and baling. Source: Economic Research Service, United States Department of Agriculture, Washington, D.C.
Internet Web Site (www.ers.usda.gov/data/costsandreturns/testpick.htm)
BARLEY: Production Cash Costs and Returns, Northern Plains Region, 1994-2001 1/ Item 1994 1995 1996 1997 1998 1999 2000 2001
Dollars per Planted Acre Gross value of production (excluding direct Government payments) Barley 89.47 109.22 139.00 91.83 79.90 73.27 68.82 75.98 Barley straw 1.94 1.87 1.89 2.67 2.07 1.79 2.02 2.07 Total, gross value of production 91.41 111.09 140.89 94.50 81.97 75.06 70.84 78.05
Cash expenses Seed 5.22 5.72 7.63 6.77 6.30 5.73 5.84 5.84 Fertilizer, lime, and gypsum 13.47 16.77 17.11 16.68 14.49 13.52 13.80 18.15 Chemicals 7.29 7.69 7.86 7.97 8.11 8.14 7.77 7.93 Custom operations 3.09 3.46 3.41 3.39 3.49 3.68 3.64 3.77 Fuel, lube, and electricity 7.22 7.42 8.85 8.59 7.55 7.72 10.28 8.92 Repairs 12.69 13.04 15.21 13.87 14.08 14.25 14.91 15.02 Hired labor 3.55 3.80 3.98 4.40 4.50 4.65 4.88 5.23 Other variable cash expenses 2/ 0.81 0.86 0.98 1.04 1.06 1.32 1.14 1.32 Total, variable cash expenses 53.34 58.76 65.03 62.71 59.58 59.01 62.26 66.18
General farm overhead 6.11 7.27 7.28 7.58 6.07 5.77 5.82 6.01 Taxes and insurance 10.90 11.87 12.86 12.13 11.14 10.39 10.70 10.70 Interest 9.96 13.01 13.70 12.20 11.33 11.40 11.40 12.15 Total, fixed cash expenses 26.97 32.15 33.84 31.91 28.54 27.56 27.92 28.86
Total, cash expenses 80.31 90.91 98.87 94.62 88.12 86.57 90.18 95.04 Gross value of production less cash expenses 11.10 20.18 42.02 -0.12 -6.15 -11.51 -19.34 -16.99
Harvest-period price (dollars/bu.) 1.93 2.47 2.82 2.11 1.69 1.73 1.59 1.83 Yield (bu./planted acre) 46.36 44.22 49.29 43.52 47.28 42.35 43.28 41.52 1/ The Northern Plains Region which includes Minnesota, North Dakota, South Dakota, Montana, and Wyoming. 2/ Cost of purchased irrigation water and baling.
Source: Economic Research Service, United States Department of Agriculture, Washington, D.C. Internet Web Site (www.ers.usda.gov/data/costsandreturns/testpick.htm)

2003 Minnesota Agricultural Statistics
9COST OF PRODUCTION
OATS: Production Cash Costs and Returns, North Central Region, 1994-2001 1/ Item 1994 1995 1996 1997 1998 1999 2000 2001
Dollars per Planted Acre Gross value of production (excluding direct Government payments)
Oats 68.92 71.40 119.06 104.46 64.03 68.26 69.90 85.42 Oats straw 44.21 37.98 44.21 49.88 44.21 45.34 46.48 48.18 Total, gross value of production 113.13 109.38 163.27 154.34 108.24 113.60 116.38 133.60
Cash expenses Seed 9.29 8.91 9.67 10.10 9.72 9.02 8.30 8.23 Fertilizer, lime, and gypsum 16.71 20.61 20.12 20.09 19.10 17.90 18.24 21.16 Chemicals 1.15 1.19 1.26 1.27 1.27 1.26 1.25 1.27 Custom operations 2/ 6.08 5.69 5.75 5.71 5.73 5.75 5.76 5.82 Fuel, lube, and electricity 6.64 4.08 4.19 4.33 3.54 3.72 5.52 5.19 Repairs 9.61 8.03 6.50 7.63 7.10 6.70 6.57 6.69 Hired labor 1.64 1.58 1.73 1.81 1.91 2.00 2.18 2.17 Other variable cash expenses 3/ 1.63 1.40 1.63 1.84 1.63 1.67 1.71 1.78
Total, variable cash expenses 52.75 51.49 50.85 52.78 50.00 48.02 49.53 52.31
General farm overhead 4.58 4.83 4.52 5.31 5.01 5.08 5.21 5.38 Taxes and insurance 17.33 19.00 20.15 20.15 19.58 20.15 21.16 21.54 Interest 5.44 6.22 6.14 6.17 6.50 6.13 6.48 6.60 Total, fixed cash expenses 27.35 30.05 30.81 31.63 31.09 31.36 32.85 33.52 Total, cash expenses 80.10 81.54 81.66 84.41 81.09 79.38 82.38 85.83
Gross value of production less cash expenses 33.03 27.84 81.61 69.93 27.15 34.22 34.00 47.77 Harvest-period price (dollars/bu.) 1.23 1.28 2.02 1.62 1.09 1.10 1.02 1.32 Yield (bu./planted acre) 56.03 55.78 58.94 64.48 58.74 62.05 68.53 64.71 1/ The North Central Region includes Minnesota, Iowa, Wisconsin, Illinois, Michigan, and Ohio. 2/ Cost of custom operations and technical services. 3/ Cost of baling. Note: Survey base changed in 1994.
Source: Economic Research Service, United States Department of Agriculture, Washington, D.C. Internet Web Site (www.ers.usda.gov/data/costsandreturns/testpick.htm)
SUGARBEETS: Production Cash Costs and Returns, Red River Valley, 1994-2001 1/ Item 1994 1995 1996 1997 1998 1999 2000 2001
Dollars per Planted Acre Gross value of production Beets - gross value of production 852.36 685.85 851.03 697.50 733.42 739.11 723.06 624.60 Cash expenses Seed 39.89 41.15 42.91 44.81 46.39 45.55 44.89 45.01 Fertilizer 32.78 39.90 41.68 39.86 35.68 33.83 28.74 37.21 Chemicals 66.79 68.13 71.12 71.13 71.43 70.62 109.03 109.80 Custom operations 24.78 24.12 23.93 23.30 25.78 24.79 23.49 23.02 Fuel and lubrication 18.46 17.85 21.87 20.73 18.43 19.18 24.86 24.55 Repairs 29.87 28.93 29.37 31.53 33.53 34.38 32.52 34.59 Hired labor 66.12 69.33 77.02 83.06 86.06 84.88 51.76 55.21 Purchased irrigation water 0.04 0.04 0.04 0.05 0.05 0.04 0.06 0.06 Freight and dirt hauling charges 9.93 9.55 11.93 11.81 11.25 10.85 13.62 13.91 Miscellaneous 2/ 13.85 14.47 16.54 16.94 15.71 15.77 13.30 13.75 Hauling allowance (-) -9.50 -9.14 -11.39 -11.36 -10.75 -10.36 -10.34 -10.44 Total, variable cash expenses 293.01 304.33 325.02 331.86 333.56 329.53 331.93 346.67
General farm overhead 30.16 30.43 20.75 30.90 28.98 29.48 27.55 28.49 Taxes and insurance 35.88 39.36 33.23 39.24 40.39 40.76 14.57 12.59 Interest 41.90 45.83 32.88 41.99 48.63 49.59 8.38 4.96 Total, fixed cash expenses 107.94 115.62 86.86 112.13 118.00 119.83 50.50 46.04 Total, cash expenses 400.95 419.95 411.88 443.99 451.56 449.36 382.43 392.71 Gross value of production less cash expenses 451.41 265.90 439.15 253.51 281.86 289.75 340.63 231.89 Season-average price (dollars/ton) 41.66 38.38 46.76 38.43 35.21 37.16 35.10 35.09 Yield (net tons/planted acre) 20.46 17.87 18.20 18.15 20.83 19.89 20.60 17.80 1/ The Red River Valley includes Minnesota and eastern North Dakota. 2/ Includes costs deducted by the processor from the net payment and noncash benefits. Source: Economic Research Service, United States Department of Agriculture, Washington, D.C. Internet Web Site (www.ers.usda.gov/data/costsandreturns/testpick.htm)

2003 Minnesota Agricultural Statistics
10 COST OF PRODUCTION
HOG PRODUCTION: Farrow-to-Finish, Farrow-to-Feeder, Feeder Pig-to-Finish, Cash Costs and Returns, Heartland Region, 2001 1/
Item All Hog
Producers Farrow to
Finish Farrow to Feeder 2/
Feeder Pig to Finish
Dollars per Cwt Gain 3/ Gross value of production Market hogs 43.75 42.64 2.21 52.73 Feeder pigs 11.27 0.81 121.07 0.22 Cull stock 1.29 2.19 3.33 0.02 Breeding stock 0.50 0.20 0.33 0.02 Inventory change -0.36 -0.20 -5.50 0.68 Other income 4/ 1.89
5 1.81 1.52 2.05
Total gross value of production 58.34 47.45 122.96 55.72 Operating costs Feed
Grain 7.10 8.93 1.97 5.64 Protein sources 6.45 8.87 1.00 4.08 Complete mixes 7.74 4.66 25.23 9.06 Other feed items 5/ 0.23 0.37 0.23 0.08
Total feed costs 21.52 22.83 28.43 18.86 Other
Feeder pigs 14.30 0.08 0.76 31.97 Veterinary and medicine 1.22 1.63 2.91 0.55 Bedding and litter 0.04 0.04 0.05 0.02 Marketing 0.63 0.35 3.86 0.54 Custom services 0.32 0.28 0.31 0.40 Fuel, lube, and electricity 1.45 1.55 3.79 0.92 Repairs 0.92 1.26 1.16 0.43 Other operating costs 6/ 0.03 0.03 0.04 0.03 Interest on operating capital 0.68 0.47 0.70 0.91
Total operating costs 41.11 28.52 42.01 54.63 Allocated overhead
Hired labor 2.43 2.83 11.80 0.45 Opportunity cost of unpaid labor 5.84 7.51 7.86 3.38 Capital recovery of machinery and equipment 11.11 12.03 27.68 6.95 Opportunity cost of land (rental rate) 0.05 0.06 0.07 0.02 Taxes and insurance 0.50 0.54 0.95 0.38 General farm overhead 1.02 1.11 1.59 0.80
Total, allocated overhead 20.95 24.08 49.95 11.98 Total costs listed 62.06 52.60 91.96 66.61
Value of production less total costs listed -3.72 -5.15 31.00 -10.89 Value of production less operating costs 17.23 18.93 80.95 1.09 Supporting information Production arrangement (percent of production) 7/ Independent 72 99 22 49 Under contract 28 1 78 51 Size of operation (head sold/removed)
Market hogs 1,706 1,520 72 2,486 Feeder pigs 924 49 8,886 14 1/ The Heartland Region includes portions of South Dakota, Nebraska, Iowa, Missouri, Illinois, Indiana, Ohio, and Minnesota’s Ag. Statistics Districts 4, 7, 8, and 9. Minnesota is also part of the Northern Crescent and Northern Great Plains Regions. Information is available about the Northern Crescent and Northern Great Plains Regions on the ERS website. 2/ Farrow to Feeder data are for the United States (Heartland Region data are not available). 3/ Cwt gain = (cwt sold - cwt purchased) ÷ cwt inventory change. 4/ Value of manure production. 5/ Milk replacer, milk, milk by-products, antibiotics, and other medicated additives. 6/ Costs for odor control and fees, permits, licenses, and other regulatory costs. 7/ Developed from survey base year, 1998. Source: Economic Research Service, United States Department of Agriculture, Washington, D.C. Internet Web Site (www.ers.usda.gov/data/costsandreturns/testpick.htm) �

2003 Minnesota Agricultural Statistics
11
COW-CALF: Production Cash Costs and Returns, Heartland Region, 2000-2001 1/ Item 2000 2001
Dollars per Bred Cow Gross value of production
Steer calves 191.23 188.26 Heifer calves 129.55 127.54 Yearling steers 37.75 38.84 Yearling heifers 11.43 11.74 Other cattle 66.87 72.71
Total, gross value of production 441.36 443.39 Operating costs
Feeder cattle 25.64 26.39 Feed
Concentrates and other feed 24.76 26.23 Supplemental feed 30.65 35.19 Harvested forages 190.00 206.00 Cropland pasture 13.10 13.42 Private pasture 68.54 73.63 Public land 0.37 0.37 Total feed costs 327.42 354.84
Other Veterinary and medicine 41.64 39.24 Bedding and litter 1.22 1.32 Marketing 4.53 4.30 Custom operations 43.42 40.77 Fuel, lube, and electricity 16.19 16.18 Repairs 31.43 29.63 Interest on operating inputs 15.31 8.89
Total, variable operating costs 506.80 521.56 Allocated overhead
Hired labor 0.54 0.58 Opportunity cost of unpaid labor 200.12 205.55 Capital recovery cost of machinery and equipment 254.91 272.90 Opportunity cost of land 5.42 5.46 Taxes and insurance 43.78 44.13 General farm overhead 80.63 82.71
Total, allocated overhead 585.40 611.33
Total cost listed 1,092.20 1,132.89 Value of production less total costs listed -650.84 -689.50 Value of production less operating costs -65.44 -78.17 1/ The Heartland Region includes portions of South Dakota, Nebraska, Iowa, Missouri, Illinois, Indiana, Ohio, and Minnesota’s Ag. Statistics Districts 4, 7, 8, and 9. Minnesota is also part of the Northern Crescent and Northern Great Plains Regions. Information is available about the Northern Crescent and Northern Great Plains Regions on the ERS website listed below. Source: Economic Research Service, United States Department of Agriculture, Washington, D.C. Internet Web Site (www.ers.usda.gov/data/costsandreturns/testpick.htm)
COST OF PRODUCTION
2003 Minnesota Agricultural Statistics
12 COST OF PRODUCTION
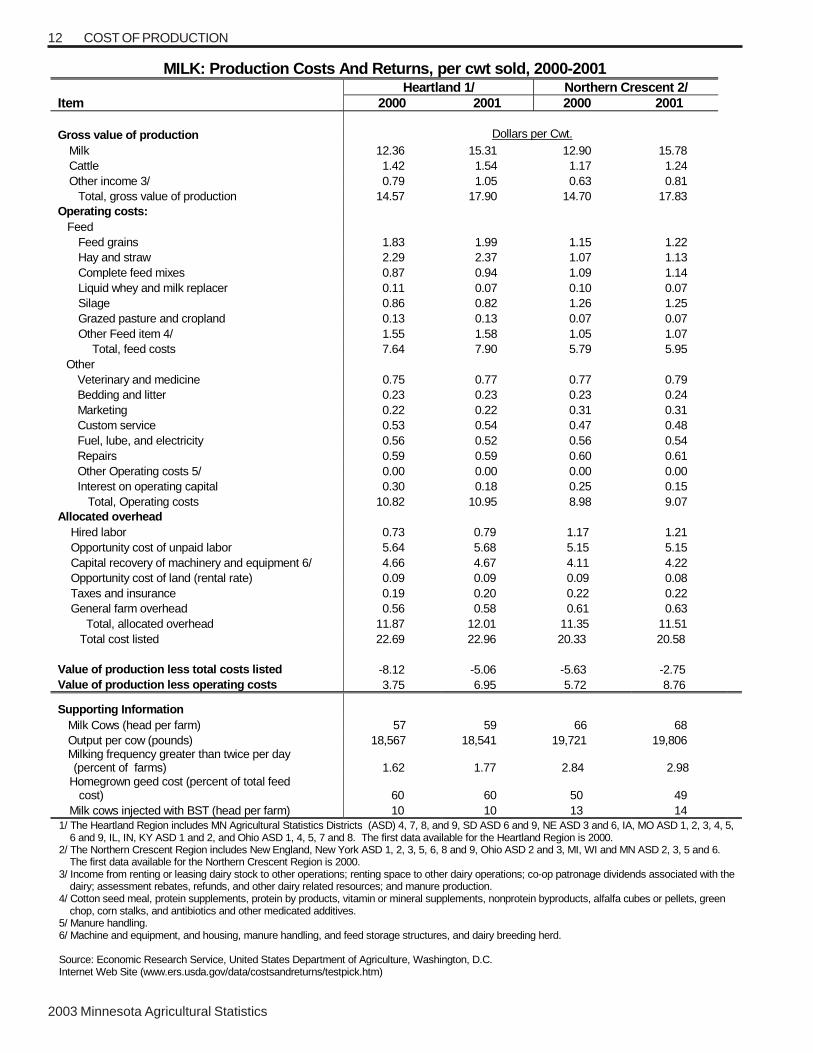
MILK: Production Costs And Returns, per cwt sold, 2000-2001 Heartland 1/ Northern Crescent 2/ Item 2000 2001 2000 2001 Gross value of production Dollars per Cwt.
Milk 12.36 15.31 12.90 15.78 Cattle 1.42 1.54 1.17 1.24 Other income 3/ 0.79 1.05 0.63 0.81
Total, gross value of production 14.57 17.90 14.70 17.83 Operating costs: Feed
Feed grains 1.83 1.99 1.15 1.22 Hay and straw 2.29 2.37 1.07 1.13 Complete feed mixes 0.87 0.94 1.09 1.14 Liquid whey and milk replacer 0.11 0.07 0.10 0.07 Silage 0.86 0.82 1.26 1.25 Grazed pasture and cropland 0.13 0.13 0.07 0.07 Other Feed item 4/ 1.55 1.58 1.05 1.07
Total, feed costs 7.64 7.90 5.79 5.95 Other
Veterinary and medicine 0.75 0.77 0.77 0.79 Bedding and litter 0.23 0.23 0.23 0.24 Marketing 0.22 0.22 0.31 0.31 Custom service 0.53 0.54 0.47 0.48 Fuel, lube, and electricity 0.56 0.52 0.56 0.54 Repairs 0.59 0.59 0.60 0.61 Other Operating costs 5/ 0.00 0.00 0.00 0.00 Interest on operating capital 0.30 0.18 0.25 0.15
Total, Operating costs 10.82 10.95 8.98 9.07 Allocated overhead
Hired labor 0.73 0.79 1.17 1.21 Opportunity cost of unpaid labor 5.64 5.68 5.15 5.15 Capital recovery of machinery and equipment 6/ 4.66 4.67 4.11 4.22 Opportunity cost of land (rental rate) 0.09 0.09 0.09 0.08 Taxes and insurance 0.19 0.20 0.22 0.22 General farm overhead 0.56 0.58 0.61 0.63
Total, allocated overhead 11.87 12.01 11.35 11.51 Total cost listed 22.69 22.96 20.33 20.58 Value of production less total costs listed -8.12 -5.06 -5.63 -2.75 Value of production less operating costs 3.75 6.95 5.72 8.76
Supporting Information Milk Cows (head per farm) 57 59 66 68 Output per cow (pounds) 18,567 18,541 19,721 19,806 Milking frequency greater than twice per day
(percent of farms) 1.62 1.77 2.84 2.98 Homegrown geed cost (percent of total feed cost) 60 60 50 49 Milk cows injected with BST (head per farm) 10 10 13 14
1/ The Heartland Region includes MN Agricultural Statistics Districts (ASD) 4, 7, 8, and 9, SD ASD 6 and 9, NE ASD 3 and 6, IA, MO ASD 1, 2, 3, 4, 5, 6 and 9, IL, IN, KY ASD 1 and 2, and Ohio ASD 1, 4, 5, 7 and 8. The first data available for the Heartland Region is 2000.
2/ The Northern Crescent Region includes New England, New York ASD 1, 2, 3, 5, 6, 8 and 9, Ohio ASD 2 and 3, MI, WI and MN ASD 2, 3, 5 and 6. The first data available for the Northern Crescent Region is 2000.
3/ Income from renting or leasing dairy stock to other operations; renting space to other dairy operations; co-op patronage dividends associated with the dairy; assessment rebates, refunds, and other dairy related resources; and manure production.
4/ Cotton seed meal, protein supplements, protein by products, vitamin or mineral supplements, nonprotein byproducts, alfalfa cubes or pellets, green chop, corn stalks, and antibiotics and other medicated additives.
5/ Manure handling. 6/ Machine and equipment, and housing, manure handling, and feed storage structures, and dairy breeding herd. Source: Economic Research Service, United States Department of Agriculture, Washington, D.C. Internet Web Site (www.ers.usda.gov/data/costsandreturns/testpick.htm)

2003 Minnesota Agricultural Statistics
13 FARM INCOME Net farm income received by Minnesota farmers in 2001 was down 47% from 2000. Total net farm income for 2001 was $695.5 million, compared to $1.30 billion in 2000. Total farm production expenses in 2001 were $9.04 billion, compared to $8.58 billion in 2000. The “average” Minnesota farm had gross farm income of $123,281 in 2001. However, expenses totaled $114,477, leaving the typical farm with $8,804 of net farm income in 2001, compared with $16,487 in 2000 and $15,410 in 1999.
FARM INCOME AND EXPENSES: Minnesota, 1997-2002 Year
Cash Receipts
From Farm Marketings
Government Payments
Noncash Income
1/
Farm Related Income
2/
Value of Inventory
Adjustment 3/
Total Gross Farm
Income
Total Farm Production Expenses
Total Net
Farm Income
Million Dollars
1997 8,069.0 417.0 416.7 457.0 32.8 9,392.5 8,638.7 753.8
1998 7,868.2 794.5 416.2 430.0 207.2 9,716.1 8,416.5 1,299.6
1999 6,999.0 1,409.9 427.3 414.4 108.4 9,359.0 8,126.2 1,232.8
2000 7,463.1 1,502.2 432.1 443.9 38.3 9,879.6 8,576.5 1,302.5
2001 4/ 8,101.9 1,242.1 444.2 656.5 (705.5) 9,739.2 9,043.7 695.5
2002 5/ 7,398.5
1/ Includes value of home consumption and housing. 2/ Includes income from custom work, machine hire, forest products, and other farm income. 3/ Estimated physical change in crops and livestock owned by farmers, valued at average prices prevailing during the year. 4/ Preliminary data. 5/ Data for 2002 not available at press time. When data are released, it will be put on the MN Agricultural Statistics Service home page at
www.nass.usda.gov/mn/ Note: Figures may not add due to rounding.
Source: Economic Research Service, United States Department of Agriculture, Washington, D.C.
AVERAGE PER FARM INCOME: Minnesota, 1997-2002 1/ Year
Number of Farms Gross Farm Income Farm Production Expenses
Net Farm Income
1,000 ------------------------------------- Dollars -------------------------------------------
1997 81.0 115,957 106,651 9,306
1998 80.0 121,451 105,206 16,245
1999 80.0 116,988 101,578 15,410
2000 79.0 125,058 108,563 16,495
2001 79.0 123,281 114,477 8,804
2002 2/ 79.0 1/ Farms having annual sales of ag products of $1,000 or more. 2/ Data for 2002 not available at press time. When data are released, it will be put on the MN Agricultural Statistics Service home page at
www.nass.usda gov/mn Note: Figures may not add due to rounding.
Source: Economic Research Service, United States Department of Agriculture, Washington, D.C.
MINNESOTA FARM INCOME AND PRODUCTION EXPENSES
0
2,000
4,000
6,000
8,000
10,000
12,000
1997 1998 1999 2000 2001Year
Mill
ion
Do
llars
Gross Farm Income Production ExpensesNet Farm Income
FARM INCOME
2003 Minnesota Agricultural Statistics
14 CASH RECEIPTS
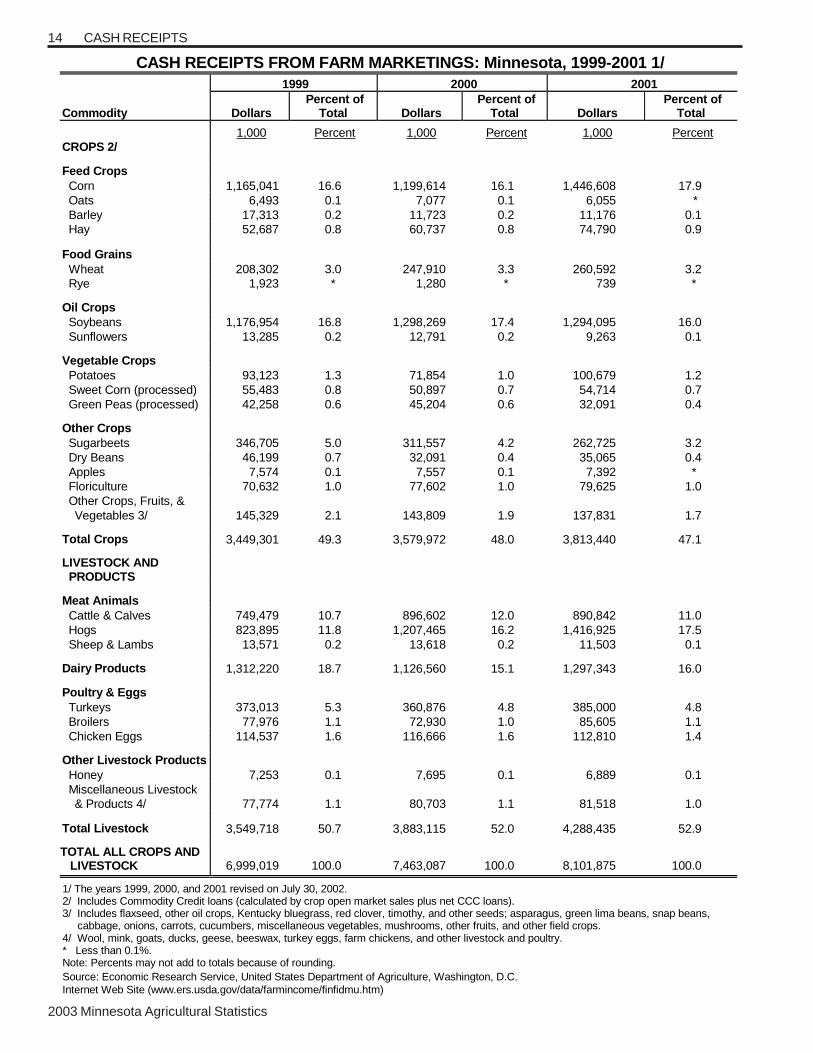
CASH RECEIPTS FROM FARM MARKETINGS: Minnesota, 1999-2001 1/ 1999 2000 2001
Commodity Dollars Percent of
Total Dollars Percent of
Total Dollars Percent of
Total
1,000 Percent 1,000 Percent 1,000 Percent CROPS 2/ Feed Crops Corn 1,165,041 16.6 1,199,614 16.1 1,446,608 17.9 Oats 6,493 0.1 7,077 0.1 6,055 * Barley 17,313 0.2 11,723 0.2 11,176 0.1 Hay 52,687 0.8 60,737 0.8 74,790 0.9 Food Grains Wheat 208,302 3.0 247,910 3.3 260,592 3.2 Rye 1,923 * 1,280 * 739 * Oil Crops Soybeans 1,176,954 16.8 1,298,269 17.4 1,294,095 16.0 Sunflowers 13,285 0.2 12,791 0.2 9,263 0.1 Vegetable Crops Potatoes 93,123 1.3 71,854 1.0 100,679 1.2 Sweet Corn (processed) 55,483 0.8 50,897 0.7 54,714 0.7 Green Peas (processed) 42,258 0.6 45,204 0.6 32,091 0.4 Other Crops Sugarbeets 346,705 5.0 311,557 4.2 262,725 3.2 Dry Beans 46,199 0.7 32,091 0.4 35,065 0.4 Apples 7,574 0.1 7,557 0.1 7,392 * Floriculture 70,632 1.0 77,602 1.0 79,625 1.0 Other Crops, Fruits, & Vegetables 3/ 145,329 2.1 143,809 1.9 137,831 1.7 Total Crops 3,449,301 49.3 3,579,972 48.0 3,813,440 47.1 LIVESTOCK AND PRODUCTS Meat Animals Cattle & Calves 749,479 10.7 896,602 12.0 890,842 11.0 Hogs 823,895 11.8 1,207,465 16.2 1,416,925 17.5 Sheep & Lambs 13,571 0.2 13,618 0.2 11,503 0.1 Dairy Products 1,312,220 18.7 1,126,560 15.1 1,297,343 16.0 Poultry & Eggs Turkeys 373,013 5.3 360,876 4.8 385,000 4.8 Broilers 77,976 1.1 72,930 1.0 85,605 1.1 Chicken Eggs 114,537 1.6 116,666 1.6 112,810 1.4 Other Livestock Products Honey 7,253 0.1 7,695 0.1 6,889 0.1 Miscellaneous Livestock & Products 4/ 77,774 1.1 80,703 1.1 81,518 1.0 Total Livestock 3,549,718 50.7 3,883,115 52.0 4,288,435 52.9 TOTAL ALL CROPS AND LIVESTOCK 6,999,019 100.0 7,463,087 100.0 8,101,875 100.0 1/ The years 1999, 2000, and 2001 revised on July 30, 2002. 2/ Includes Commodity Credit loans (calculated by crop open market sales plus net CCC loans). 3/ Includes flaxseed, other oil crops, Kentucky bluegrass, red clover, timothy, and other seeds; asparagus, green lima beans, snap beans, cabbage, onions, carrots, cucumbers, miscellaneous vegetables, mushrooms, other fruits, and other field crops. 4/ Wool, mink, goats, ducks, geese, beeswax, turkey eggs, farm chickens, and other livestock and poultry. * Less than 0.1%. Note: Percents may not add to totals because of rounding. Source: Economic Research Service, United States Department of Agriculture, Washington, D.C. Internet Web Site (www.ers.usda.gov/data/farmincome/finfidmu.htm)
2003 Minnesota Agricultural Statistics
15
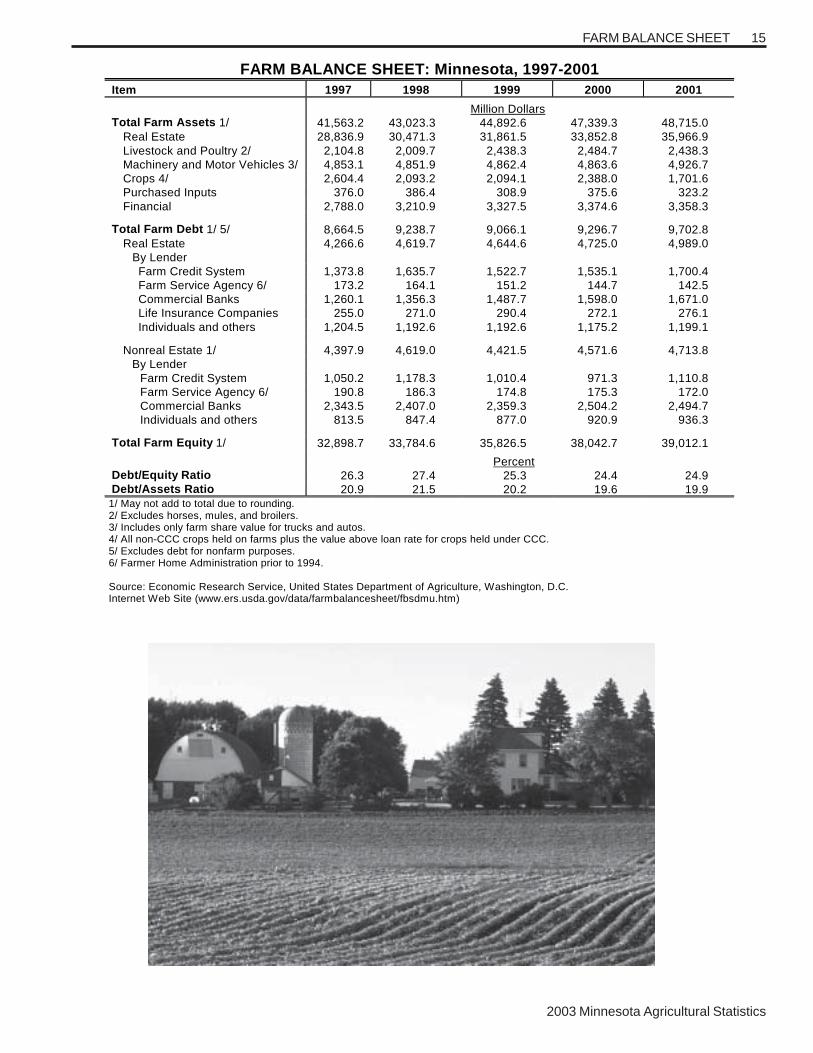
FARM BALANCE SHEET: Minnesota, 1997-2001 Item 1997 1998 1999 2000 2001
Million Dollars Total Farm Assets 1/ 41,563.2 43,023.3 44,892.6 47,339.3 48,715.0 Real Estate 28,836.9 30,471.3 31,861.5 33,852.8 35,966.9 Livestock and Poultry 2/ 2,104.8 2,009.7 2,438.3 2,484.7 2,438.3 Machinery and Motor Vehicles 3/ 4,853.1 4,851.9 4,862.4 4,863.6 4,926.7 Crops 4/ 2,604.4 2,093.2 2,094.1 2,388.0 1,701.6 Purchased Inputs 376.0 386.4 308.9 375.6 323.2 Financial 2,788.0 3,210.9 3,327.5 3,374.6 3,358.3 Total Farm Debt 1/ 5/ 8,664.5 9,238.7 9,066.1 9,296.7 9,702.8 Real Estate 4,266.6 4,619.7 4,644.6 4,725.0 4,989.0 By Lender Farm Credit System 1,373.8 1,635.7 1,522.7 1,535.1 1,700.4 Farm Service Agency 6/ 173.2 164.1 151.2 144.7 142.5 Commercial Banks 1,260.1 1,356.3 1,487.7 1,598.0 1,671.0 Life Insurance Companies 255.0 271.0 290.4 272.1 276.1 Individuals and others 1,204.5 1,192.6 1,192.6 1,175.2 1,199.1 Nonreal Estate 1/ 4,397.9 4,619.0 4,421.5 4,571.6 4,713.8 By Lender Farm Credit System 1,050.2 1,178.3 1,010.4 971.3 1,110.8 Farm Service Agency 6/ 190.8 186.3 174.8 175.3 172.0 Commercial Banks 2,343.5 2,407.0 2,359.3 2,504.2 2,494.7 Individuals and others 813.5 847.4 877.0 920.9 936.3 Total Farm Equity 1/ 32,898.7 33,784.6 35,826.5 38,042.7 39,012.1
Percent Debt/Equity Ratio 26.3 27.4 25.3 24.4 24.9 Debt/Assets Ratio 20.9 21.5 20.2 19.6 19.9
1/ May not add to total due to rounding. 2/ Excludes horses, mules, and broilers. 3/ Includes only farm share value for trucks and autos. 4/ All non-CCC crops held on farms plus the value above loan rate for crops held under CCC. 5/ Excludes debt for nonfarm purposes. 6/ Farmer Home Administration prior to 1994. Source: Economic Research Service, United States Department of Agriculture, Washington, D.C. Internet Web Site (www.ers.usda.gov/data/farmbalancesheet/fbsdmu.htm)
FARM BALANCE SHEET
2003 Minnesota Agricultural Statistics
16 WEATHER
2002 Climate Summary
January and February precipitation was generally below normal across much of Minnesota. January was dry and mild statewide. In February, exceptions to the dryness were found in some southeastern and central Minnesota counties. Late February snow depths were less than eight inches nearly everywhere in Minnesota. Large sections of northwestern and southern Minnesota reported less than two inches of snow cover.
March precipitation was generally near normal across much of Minnesota. After a three-month period lacking in significant snow events, March compensated for the shortfall by bringing three substantial snowstorms to Minnesota. In sharp contrast with a winter-long trend of unusually warm weather, March 2002 temperatures finished significantly below normal. Temperatures across the state were four to nine degrees lower than historical averages. In a unique juxtaposition, the March mean temperature was colder than any of the preceding winter months in many communities.
April precipitation was somewhat below normal in northern and western Minnesota and a little above normal in central, east central, and southeastern counties. May precipitation totals were generally below normal across Minnesota. In most locations, May precipitation fell short of the historical average by more than one half inch. May precipitation deficits were greater than one and a half inches in many northeastern, south central, and southeastern Minnesota communities.
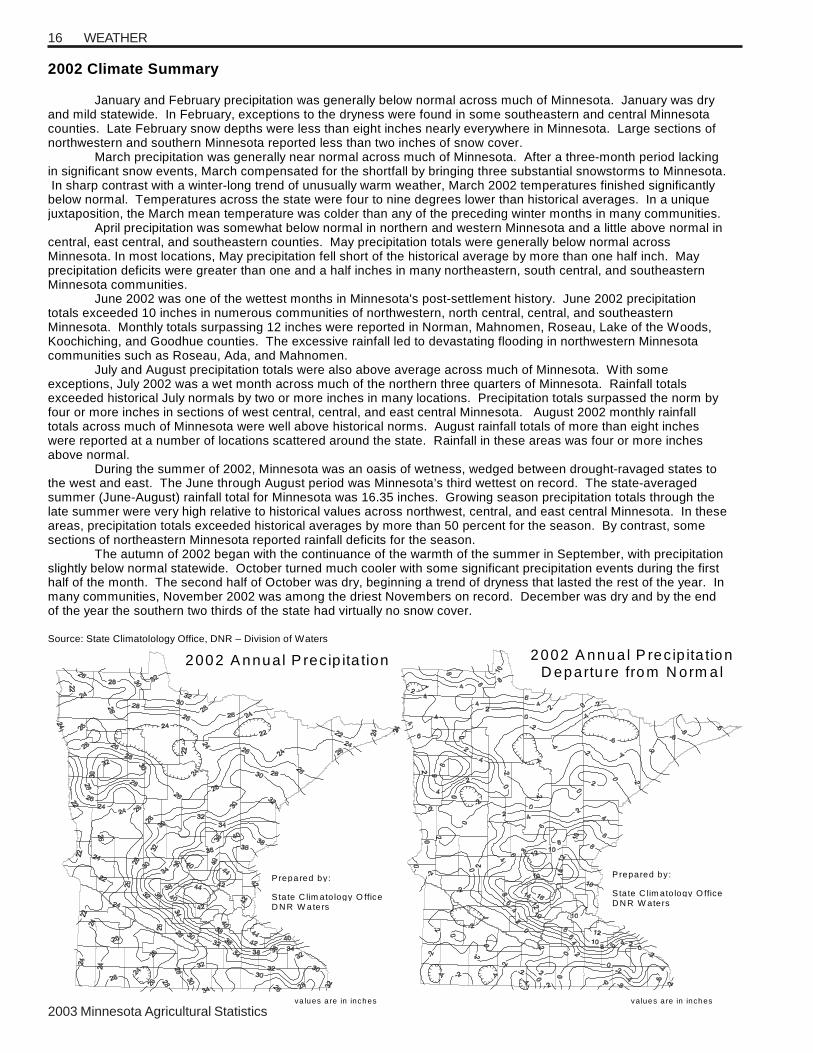
June 2002 was one of the wettest months in Minnesota's post-settlement history. June 2002 precipitation totals exceeded 10 inches in numerous communities of northwestern, north central, central, and southeastern Minnesota. Monthly totals surpassing 12 inches were reported in Norman, Mahnomen, Roseau, Lake of the Woods, Koochiching, and Goodhue counties. The excessive rainfall led to devastating flooding in northwestern Minnesota communities such as Roseau, Ada, and Mahnomen.
July and August precipitation totals were also above average across much of Minnesota. With some exceptions, July 2002 was a wet month across much of the northern three quarters of Minnesota. Rainfall totals exceeded historical July normals by two or more inches in many locations. Precipitation totals surpassed the norm by four or more inches in sections of west central, central, and east central Minnesota. August 2002 monthly rainfall totals across much of Minnesota were well above historical norms. August rainfall totals of more than eight inches were reported at a number of locations scattered around the state. Rainfall in these areas was four or more inches above normal.
During the summer of 2002, Minnesota was an oasis of wetness, wedged between drought-ravaged states to the west and east. The June through August period was Minnesota’s third wettest on record. The state-averaged summer (June-August) rainfall total for Minnesota was 16.35 inches. Growing season precipitation totals through the late summer were very high relative to historical values across northwest, central, and east central Minnesota. In these areas, precipitation totals exceeded historical averages by more than 50 percent for the season. By contrast, some sections of northeastern Minnesota reported rainfall deficits for the season.
The autumn of 2002 began with the continuance of the warmth of the summer in September, with precipitation slightly below normal statewide. October turned much cooler with some significant precipitation events during the first half of the month. The second half of October was dry, beginning a trend of dryness that lasted the rest of the year. In many communities, November 2002 was among the driest Novembers on record. December was dry and by the end of the year the southern two thirds of the state had virtually no snow cover. Source: State Climatolology Office, DNR – Division of Waters
2002 A nnual P recip ita tion
Prepared by:
S tate C lim ato logy O fficeD N R W aters
va lues a re in inches
2002 A nnua l P rec ip ita tionD epartu re from N orm a l
Prepared by:
S tate C lim ato logy O fficeD N R W aters
values a re in inches

2003 Minnesota Agricultural Statistics
17WEATHER
MEDIAN FROST DATES: Minnesota, Based on Averages from 1948-92
Average Date of Last
Temperature Occurrence
Average Date of First
Temperature Occurrence
Number of Days Between Average Last Spring and First Fall Occurrence of:
District and County Station 24oF 28oF 32oF 32oF 28oF 24oF 32oF 28oF 24oF
Northwest Norman Marshall Polk Becker Polk Kittson Clay Red Lake Roseau Roseau North Central Lake of the Woods Beltrami Koochiching Itasca Koochiching Hubbard Northeast St. Louis St. Louis Cook St. Louis West Central Douglas Swift Wilkin Yellow Medicine Otter Tail Lac Qui Parle Lac Qui Parle Stevens Traverse Central Sibley Scott Morrison Stearns Stearns Wadena Kandiyohi East Central Aitkin Crow Wing Pine Hennepin Mille Lacs Carlton Kanabec Washington Southwest Redwood Rock Lyon Pipestone Cottonwood South Central Freeborn Martin Rice Brown Waseca Faribault Southeast Mower Houston Dakota Fillmore Olmsted Winona Goodhue
Ada Argyle Crookston Detroit Lakes Fosston Hallock Moorhead Red Lake Falls Roseau Warroad Baudette Bemidji Big Falls Grand Rapids Int’l Falls Park Rapids Babbitt Duluth (Airport) Grand Marais Hibbing Alexandria Benson Campbell Canby Fergus Falls Madison Montevideo Morris Wheaton Gaylord Jordan Little Falls Melrose St. Cloud Wadena Willmar Aitkin Brainerd Hinckley Maple Plain Milaca Moose Lake Mora Stillwater Lamberton Luverne Marshall Pipestone Windom Albert Lea Fairmont Faribault New Ulm Waseca Winnebago Austin Caledonia Farmington Preston Rochester Winona Zumbrota
Apr 24 Apr 26 Apr 25 May 02 Apr 26 Apr 27 Apr 21 Apr 20 May 04 Apr 30
Apr 28 May 04 May 04 Apr 27 Apr 29 May 01
Apr 28 Apr 24 Apr 17 Apr 28
Apr 13 Apr 13 Apr 20 Apr 14 Apr 16 Apr 14 Apr 13 Apr 14 Apr 15
Apr 09 Apr 13 Apr 19 Apr 12 Apr 19 Apr 22 Apr 12
Apr 23 Apr 22 Apr 22 Apr 13 Apr 18 May 02 Apr 21 Apr 10
Apr 09 Apr 16 Apr 10 Apr 23 Apr 14
Apr 09 Apr 06 Apr 14 Apr 09 Apr 12 Apr 09
Apr 12 Apr 14 Apr 11 Apr 21 Apr 11 Apr 07 Apr 17
May 06 May 09 May 08 May 10 May 07 May 09 May 06 May 08 May 14 May 10
May 09 May 09 May 15 May 09 May 12 May 08
May 09 May 09 May 01 May 12
Apr 24 Apr 29 Apr 29 Apr 28 Apr 30 Apr 29 Apr 28 Apr 29 Apr 28
Apr 17 Apr 28 May 02 Apr 28 May 01 May 16 May 05
May 06 May 04 May 06 Apr 25 May 01 May 16 May 05 Apr 16
Apr 28 Apr 29 Apr 22 May 05 Apr 15
Apr 20 Apr 14 Apr 27 Apr 23 Apr 23 Apr 19
Apr 29 Apr 24 Apr 21 May 07 Apr 21 Apr 17 Apr 30
May 14 May 18 May 16 May 21 May 17 May 19 May 13 May 17 May 25 May 21
May 22 May 22 Jun 01 May 23 May 24 May 19
May 21 May 20 May 15 May 29
May 08 May 07 May 10 May 08 May 09 May 07 May 07 May 08 May 10
Apr 30 May 10 May 12 May 11 May 12 May 12 May 02
May 19 May 12 May 20 May 06 May 12 May 31 May 17 May 02
May 06 May 07 May 05 May 12 May 07
May 02 May 01 May 10 May 03 May 06 May 03
May 07 May 06 May 03 May 18 May 08 Apr 17 Apr 30
Sep 24 Sep 22 Sep 23 Sep 17 Sep 21 Sep 23 Sep 24 Sep 22 Sep 16 Sep 23
Sep 22 Sep 22 Sep 15 Sep 20 Sep 17 Sep 20
Sep 23 Sep 22 Sep 30 Sep 13
Oct 01 Sep 30 Sep 24 Oct 01 Sep 27 Sep 28 Sep 30 Sep 27 Sep 28
Oct 05 Sep 27 Sep 24 Sep 24 Sep 24 Sep 24 Oct 03
Sep 23 Sep 20 Sep 22 Oct 01 Sep 25 Sep 16 Sep 20 Oct 07
Sep 29 Sep 27 Oct 04 Sep 23 Sep 30
Oct 05 Oct 09 Sep 29 Sep 28 Oct 01 Oct 06
Sep 27 Sep 29 Oct 03 Sep 21 Sep 30 Oct 06 Sep 25
Oct 02 Sep 28 Sep 29 Sep 24 Sep 28 Oct 02 Oct 04 Sep 28 Sep 25 Sep 28
Sep 28 Sep 27 Sep 24 Sep 27 Sep 25 Sep 27
Oct 05 Oct 05 Oct 19 Sep 26
Oct 12 Oct 10 Oct 02 Oct 10 Oct 09 Oct 09 Oct 10 Oct 06 Oct 10
Oct 14 Oct 07 Oct 03 Oct 05 Oct 05 Oct 03 Oct 14
Sep 28 Oct 01 Sep 28 Oct 13 Oct 03 Sep 26 Oct 01 Oct 16
Oct 07 Oct 05 Oct 15 Oct 03 Oct 07
Oct 18 Oct 20 Oct 11 Oct 10 Oct 06 Oct 17
Oct 06 Oct 11 Oct 12 Sep 29 Oct 13 Oct 19 Oct 03
Oct 13 Oct 10 Oct 13 Oct 05 Oct 16 Oct 10 Oct 15 Oct 10 Oct 07 Oct 12
Oct 13 Oct 15 Oct 05 Oct 09 Oct 08 Oct 07
Oct 22 Oct 17 Oct 30 Oct 06
Oct 25 Oct 18 Oct 14 Oct 21 Oct 21 Oct 20 Oct 21 Oct 17 Oct 23
Oct 24 Oct 20 Oct 17 Oct 16 Oct 17 Oct 18 Oct 24
Oct 18 Oct 16 Oct 10 Oct 25 Oct 18 Oct 07 Oct 14 Nov 02
Oct 15 Oct 16 Oct 24 Oct 10 Oct 19
Oct 31 Oct 31 Oct 24 Oct 23 Oct 24 Oct 26
Oct 23 Oct 26 Oct 29 Oct 13 Oct 27 Oct 31 Oct 18
133 126 129 116 127 126 135 127 112 124
122 124 108 116 114 124
125 124 138 107
146 146 136 147 143 144 146 143 143
159 143 136 138 138 137 154
126 132 120 153 137 109 125 160
146 142 155 135 146
156 161 146 148 149 158
144 152 155 125 147 163 139
153 143 145 139 146 144 152 141 137 141
146 136 135 141 138 143
153 154 171 137
169 166 156 163 162 166 169 161 162
180 164 154 160 157 156 172
149 151 147 169 153 132 151 184
163 160 176 151 167
181 189 167 170 167 180
166 174 178 148 174 184 157
176 168 170 157 173 165 178 176 159 165
164 164 159 165 163 162
174 175 194 163
194 189 179 189 188 192 192 185 189
193 190 181 186 180 180 193
176 175 172 195 184 162 169 207
188 177 196 171 189
201 208 193 193 192 203
191 192 201 178 197 205 187
Source: State Climatology Office, DNR - Division of Waters

2003 Minnesota Agricultural Statistics
18 WEATHER
MONTHLY PRECIPITATION: by Selected Stations and Districts, Minnesota, 2002 Station Jan Feb Mar Apr May Jun Jul Aug Sep Oct Nov Dec 1/
Precipitation (Inches) Northwest Argyle .12 T .56 .89 2.58 6.35 3.16 9.45 3.06 .90 .17 Crookston M.03 M.07 M.49 1.26 1.90 6.55 3.69 9.41 1.48 1.25 .16 Moorhead M M M M M M M 2.29 M 1.55 M District Average .14 .10 .72 1.15 2.31 8.41 4.44 5.24 1.77 1.29 .23 District Normal .71 .48 .96 1.63 2.52 3.71 3.17 2.96 2.55 1.72 .82 North Central Grand Rapids .36 .28 1.51 1.42 1.66 5.97 4.18 5.98 2.01 2.45 .44 Int’l Falls .07 .04 .29 1.48 2.08 8.29 3.79 4.35 1.19 1.07 .22 Walker M1.28 .22 M.94 1.56 M 6.05 3.14 5.04 M 2.35 .08 District Average .26 .15 .86 1.52 2.21 7.29 4.14 4.77 1.71 1.75 .33 District Normal .78 .52 1.15 1.92 2.83 4.00 3.74 3.51 3.02 2.28 1.12 Northeast Duluth .40 .64 1.87 2.72 2.04 5.75 5.40 4.22 3.93 3.05 .34 Grand Marais M.13 .05 .89 .63 1.04 2.93 2.20 3.27 3.42 2.23 .33 Hibbing .36 .13 .31 .96 1.33 6.01 4.78 6.17 2.03 2.36 .23 District Average .31 .47 1.41 1.13 1.65 4.74 3.82 4.46 2.78 2.69 .48 District Normal .98 .66 1.36 2.03 2.93 4.03 3.70 3.81 3.58 2.54 1.56 West Central Canby .07 .69 2.57 2.44 2.28 2.81 2.20 5.83 M 3.14 .09 Fergus Falls M.05 .62 M M M 2.15 9.77 4.57 1.23 M2.18 M.00 Montevideo M.00 M.09 M.06 M2.16 M2.78 2.89 4.78 9.08 1.30 M3.16 M.07 Morris .22 .99 1.31 1.95 2.06 4.49 6.04 3.83 1.39 2.58 .10 District Average .18 .64 1.13 2.22 2.53 2.92 5.65 4.33 1.36 2.68 .20 District Normal .73 .67 1.39 2.22 2.84 3.81 3.31 3.01 2.46 1.99 1.05 Central Hutchinson M.25 1.10 .86 2.45 2.55 10.51 4.33 8.44 .88 3.67 .05 Olivia .05 .52 1.48 2.27 2.41 5.10 3.69 5.42 M.69 3.87 T St. Cloud .28 .95 1.06 3.68 2.06 4.92 5.10 5.59 6.67 3.48 .15 Willmar .02 .89 2.25 2.83 3.17 6.37 4.55 8.43 1.58 3.21 .03 District Average .12 1.16 1.89 3.14 3.00 6.96 6.66 6.32 2.53 3.66 .13 District Normal .79 .70 1.63 2.46 3.22 4.35 3.66 3.66 3.01 2.27 1.36 East Central Aitkin .21 .94 1.72 3.42 2.20 3.13 8.87 3.20 4.06 2.79 .10 Cambridge .10 1.54 M M M M M M M M M MSP-Airport .46 .26 1.38 3.15 2.83 8.30 5.19 8.30 3.90 4.18 .08 District Average .29 .96 2.05 3.40 2.90 6.06 7.20 5.80 4.30 3.65 .09 District Normal .88 .69 1.62 2.33 3.31 4.31 3.88 3.83 3.35 2.46 1.52 Southwest Lamberton M.08 M.41 M1.21 1.86 2.20 3.82 3.28 5.35 .91 3.47 .10 Marshall .17 .58 3.75 3.61 2.60 3.82 2.61 5.63 1.02 3.47 .20 Pipestone M.08 .19 1.75 2.60 1.33 4.85 1.93 7.66 1.97 3.94 .08 Redwood Falls T .19 1.13 2.35 2.92 4.55 3.21 5.80 .79 3.39 .09 Windom .24 .65 1.39 2.72 3.17 3.61 1.84 7.66 1.41 3.21 M.13 District Average .13 .42 1.64 2.55 2.44 3.55 2.35 7.33 1.19 3.40 .12 District Normal .58 .68 1.70 2.56 3.18 3.78 3.73 2.95 3.08
2.04 2.04 1.28
South Central Fairmont .17 .66 M1.86 3.38 1.32 3.53 2.31 5.11 3.05 M2.67 .20 Faribault .64 .55 2.29 3.30 1.85 10.27 4.24 5.73 2.92 4.01 .13 Mankato .15 .56 1.67 3.04 2.05 5.09 2.00 4.92 2.23 3.14 .23 Waseca .49 .52 1.72 2.84 1.71 7.15 2.68 6.08 2.56 4.44 .26 District Average .36 .64 1.84 3.04 2.08 6.32 3.58 5.55 2.52 3.88 .18 District Normal .77 .78 1.89 2.80 3.48 4.01 4.08 3.79 3.24 2.26 1.50 Southeast Austin .93 .89 1.31 3.85 1.90 3.94 5.38 4.90 1.93 M3.65 .18 Caledonia .62 1.67 M1.12 3.77 1.79 6.89 4.16 2.57 3.09 2.81 .53 Rochester .65 1.68 1.24 3.40 1.47 8.20 5.00 4.64 2.02 3.50 .12 Winona .53 1.98 2.28 4.63 1.33 7.87 2.98 4.86 3.23 3.29 .24 District Average .49 1.51 1.78 3.79 1.89 8.36 3.94 5.79 3.60 3.80 .20 District Normal .96 .86 1.96 2.91 3.72 4.03 4.19 3.98 3.77 2.49 1.75 M = Missing, insufficient, or partial data T = Trace, too small to measure 1/ Data not available at time of publication. Source: National Oceanic and Atmospheric Administration, U.S. Department of Commerce

2003 Minnesota Agricultural Statistics
19PLANTING AND HARVESTING
CROPS: Average Completion Dates for Planting and Harvesting, Minnesota, 1998-2002 Date Planting Completed Date Harvesting Completed
Percent� Percent�Crop and Year� 10� 25� 50� 75� 90� 10� 25� 50� 75� 90�
Corn� � � � � � � � � � �
2002 Apr 24 Apr 29 May 04 May 11 May 19 Oct 07 Oct 17 Oct 27 Nov 05 Nov 14
2001� May 07 May 12 May 16 May 19 May 27 Oct 11 Oct 19 Oct 25 Oct 31 Nov 05
1998-2002� Apr 24 Apr 28 May 03 May 12 May 19 Oct 01 Oct 09 Oct 19 Oct 28 Nov 05 Soybeans� � � � � � � � � � �
2002 May 07 May 13 May 19 May 25 May 31 Sep 23 Sep 29 Oct 14 Oct 20 Nov 01
2001� May 14 May 17 May 24 Jun 04 Jun 10 Sep 29 Oct 03 Oct 07 Oct 13 Oct 22
1998-2002� May 03 May 08 May 17 May 26 Jun 03 Sep 21 Sep 27 Oct 04 Oct 13 Oct 21 Spring Wheat� � � � � � � � � � �
2002 Apr 29 May 05 May 16 May 23 May 26 Aug 03 Aug 09 Aug 19 Aug 30 Sep 08
2001� May 06 May 13 May 18 May 27 Jun 09 Aug 07 Aug 12 Aug 19 Aug 25 Aug 31
1998-2002� Apr 22 Apr 28 May 06 May 18 May 28 Aug 02 Aug 09 Aug 16 Aug 25 Sep 04 Oats� � � � � � � � � � �
2002 Apr 15 Apr 24 May 02 May 12 May 23 Jul 23 Jul 30 Aug 08 Aug 17 Aug 27
2001� May 01 May 06 May 12 May 19 Jun 05 Jul 28 Aug 02 Aug 09 Aug 15 Aug 20
1998-2002� Apr 13 Apr 23 May 01 May 10 May 21 Jul 23 Jul 30 Aug 07 Aug 15 Aug 24 Barley� � � � � � � � � � �
2002 Apr 26 May 04 May 18 May 24 May 28 Aug 04 Aug 08 Aug 19 Aug 25 Sep 03
2001� May 07 May 14 May 19 May 28 Jun 09 Aug 06 Aug 09 Aug 13 Aug 20 Aug 28
1998-2002� Apr 24 Apr 29 May 08 May 21 May 30 Jul 31 Aug 06 Aug 12 Aug 22 Sep 01 Potatoes� �
� � � � � � � � �
2002 Apr 22 May 01 May 10 May 22 May 31 Aug 24 Sep 10 Sep 27 Oct 13 Oct 23
2001� Apr 28 May 04 May 14 May 30 Jun 10 Sep 01 Sep 18 Sep 28 Oct 08 Oct 14
1998-2002� Apr 23 Apr 30 May 10 May 24 Jun 03 Aug 28 Sep 13 Sep 28 Oct 08 Oct 17 Sunflowers� � � � � � � � � � �
2002 May 20 May 24 May 29 Jun 01 Jun 06 Oct 05 Oct 17 Oct 29 Nov 08 Nov 19
2001� May 17 May 29 Jun 06 Jun 11 Jun 16 Oct 06 Oct 10 Oct 17 Oct 25 Nov 03
1998-2002� May 09 May 17 May 27 Jun 07 Jun 12 Oct 04 Oct 12 Oct 22 Nov 02 Nov 10 Alfalfa Hay 1/� � � � � � � � � � �
2002 � � � � � Jun 03 Jun 10 Jun 17 Jun 25 Jul 07
2001� � � � � � May 31 Jun 05 Jun 13 Jun 24 Jul 01
1998-2002� � � � � � May 25 May 30 Jun 08 Jun 19 Jun 29 Sweet Corn� � � � � � � � � � �
2002 May 03 May 13 May 24 Jun 09 Jun 22 Aug 04 Aug 10 Aug 23 Sep 10 Sep 20
2001� May 10 May 15 May 28 Jun 08 Jun 23 Aug 04 Aug 13 Aug 21 Sep 01 Sep 18
1998-2002� May 02 May 09 May 20 Jun 03 Jun 17 Aug 01 Aug 10 Aug 21 Sep 04 Sep 16 Dry Beans�
2002 May 15 May 21 May 27 Jun 01 Jun 07 Sep 02 Sep 14 Sep 22 Oct 08 Oct 13
2001� May 15 May 19 May 30 Jun 07 Jun 13 Sep 05 Sep 12 Sep 22 Oct 05 Oct 11
1998-2002� May 09 May 16 May 25 Jun 02 Jun 10 Sep 01 Sep 09 Sep 21 Oct 03 Oct 12 Sugarbeets�
2002 Apr 23 Apr 29 May 03 May 14 May 22 Sep 30 Oct 03 Oct 08 Oct 13 Oct 21
2001� May 05 May 10 May 15 May 20 May 27 Oct 01 Oct 03 Oct 08 Oct 13 Oct 18
1998-2002� Apr 22 Apr 26 May 01 May 11 May 21 Sep 27 Oct 03 Oct 08 Oct 13 Oct 19 1/ First Cutting.�

2003 Minnesota Agricultural Statistics
20
CORN
0
20
40
60
80
100
Oct 16 Oct 23 Oct 30 Nov 6 Nov 13
% Harvested
SOYBEANS
0
20
40
60
80
100
May 10 May 17 May 24 May 31 Jun 7
% Planted SOYBEANS
0
20
40
60
80
100
Sep 25 Oct 2 Oct 9 Oct 16 Oct 23
% Harvested
PLANTING AND HARVESTING
2003 Minnesota Agricultural Statistics
PLANTING & HARVESTING PROGRESSOF MINNESOTA’S MAJOR CROPS, 1998-2002
PLANTING PROGRESS HARVESTING PROGRESS
SPRING WHEAT
0
20
40
60
80
100
Apr 20 Apr 30 May 10 May 20 May 30
% Planted
1998 19992000 20012002 1998-2002
SPRING WHEAT
0
20
40
60
80
100
Aug 14 Aug 21 Aug 28 Sep 4 Sep 11
% Harvested
1998 19992000 20012002 1998-2002
CORN
0102030405060708090
100
May 1 May 8 May 15 May 22 May 29
% Planted
2003 Minnesota Agricultural Statistics
21CROPS
During the month of August, there were seasonably warmdays with enough rainfall to return most of the state’s soilmoisture to adequate. Row crop development and smallgrain harvest continued near the 5-year averages. Corndenting began moving along well, while oat harvest was 88%completed by Aug 25. Soybeans also completed settingpods by the end of the month.
Soil moisture continued to be adequate in most areas of thestate during September. By the end of the month, cornharvest was 4% complete and sweet corn harvest had beencompleted. Spring wheat, barley, and oats harvest wascompleted by mid-September and soybean harvest was 25%complete by September 29.
Cool and wet conditions began hindering farmers in themonth of October. Due to the cold weather, as well as thefirst major snow of the year, row crop harvest was slowed.Topsoil moisture ranged from adequate to surplus, causingmuddy fields. The soggy conditions caused trucks tobecome stuck in fields throughout the state. Corn andsoybean moisture levels were slow to decline.
November proved to be a very frustrating month, as somefarmers wanted to avoid frost to complete tillage while othersneeded the ground to freeze to complete harvest due to highsoil moisture.
The following is a rundown on the production of Minnesota’smajor crops for 2002:
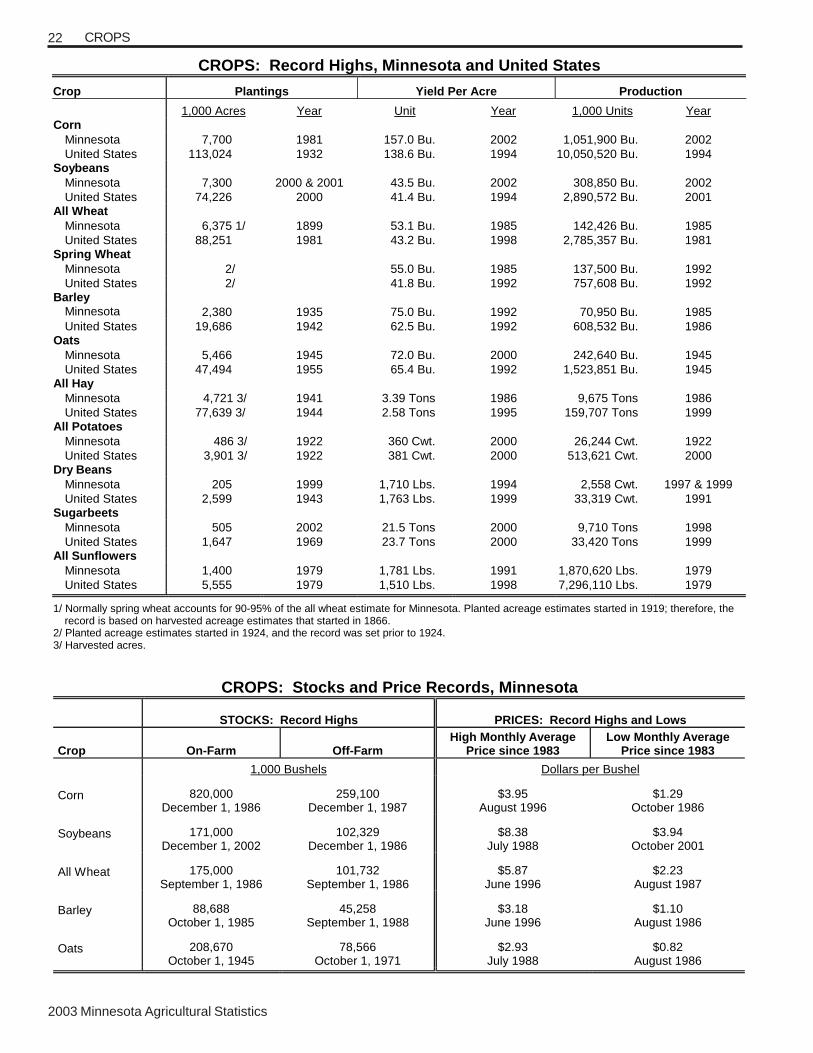
Minnesota’s 2002 CORN production at 1,052 million bushelswas up 2% from the record high production set in 1998. Arecord yield of 157.0 bushels per acre was up 27 bushelsfrom 2001.
Record SOYBEAN production was estimated at 308.9 millionbushels, up 5% from the record high production set in 2000.The final yield was 43.5 bushels per acre, which was up 6.5bushels from the previous year.
SPRING WHEAT production was 61.2 million bushels, down23% from 2001. The yield of 34.0 bushels per acre wasdown 10 bushels from 2001.
OAT production was estimated at 16.0 million bushels, 27%above 2001. The yield of 56.0 bushels per acre declined 4.0bushels per acre from the previous year.
BARLEY production of 6.4 million bushels was down 19%from 2001 and the lowest level since 1881. Yield at 39.0bushels per acre was down 16.0 bushels from 2001.
SUGARBEET production of 8.85 million tons was up 14%from 2001. Yield was estimated at 18.6 tons per acre, down2.9 tons from the record high set in 2000.
2002 CROP SUMMARY
Minnesota experienced a winter that was warmer than usualin 2002. During January much of the state experiencedabove normal temperatures, which produced excellentfeeding conditions for farmers. The unseasonably warmweather and lack of snow cover created concern for thealfalfa and winter wheat crop, but allowed fall fieldwork to becompleted. February brought much of the same conditions.Livestock were in good shape across the state. The lack ofsnow cover caused wind erosion concerns, but thanks to thewarm temperatures, farmers were able to focus onagricultural planning and education.
Due to snow and ice storms across much of the state, springplanting excitement came to a sudden halt in March. TheMarch storms added much needed moisture to the soilprofile. Well below zero temperatures were recorded afterthe two previous warm months.
The weather fluctuated throughout April, from unseasonablyhot weather to cold, snowy weather. Full scale fieldworkbegan around the middle of the month but was brought to asudden halt only a week later due to heavy snow in someareas. In drier fields, producers continued planting as muchas possible.
May was a very cool month. A great contrast was shownbetween the northern and southern parts of the state. Bothregions suffered from cold weather, with the northern halfreceiving the worst end of it. This contrast caused planting inthe northern part of the state to be minimal, while planting inthe south continued to progress. Pasture and hayfields inthe south were greening up and forage fields in the northwere having problems breaking dormancy. The cool, drymonth also contributed to corn stands being uneven.
During the month of June, weather and crop progress variedacross the entire state. Above average temperatures wereprevalent throughout the state, as was rain. The warmweather helped improve corn and soybean emergence in thestate. The rain received in June was generally welcome forrelieving increasingly dry conditions. However, during the lasthalf of June, exceptionally heavy rainfall from slow-movingstorm systems caused disastrous flooding in Roseau,Norman, and other counties in the Northwest and NorthCentral Districts.
Early in July warmth and sun pushed crop development tomake up for the late planting. By mid-July, crops in floodedareas that were not destroyed, started to make a recovery. Inthe southern region, fields were suffering from drought.Though light rains crept in during the middle of the month, itwas not enough to offset the stress caused by the aboveaverage temperatures throughout the month. By late July, haygrowth was so slow that livestock producers had to useemergency CRP haying and grazing provisions.
2003 Minnesota Agricultural Statistics
22 CROPS
CROPS: Record Highs, Minnesota and United States
Crop Plantings Yield Per Acre Production
1,000 Acres Year Unit Year 1,000 Units Year Corn Minnesota 7,700 1981 157.0 Bu. 2002 1,051,900 Bu. 2002 United States 113,024 1932 138.6 Bu. 1994 10,050,520 Bu. 1994 Soybeans Minnesota 7,300 2000 & 2001 43.5 Bu. 2002 308,850 Bu. 2002 United States 74,226 2000 41.4 Bu. 1994 2,890,572 Bu. 2001 All Wheat Minnesota 6,375 1/ 1899 53.1 Bu. 1985 142,426 Bu. 1985 United States 88,251 1981 43.2 Bu. 1998 2,785,357 Bu. 1981 Spring Wheat Minnesota 2/ 55.0 Bu. 1985 137,500 Bu. 1992 United States 2/ 41.8 Bu. 1992 757,608 Bu. 1992 Barley Minnesota
2,380 1935 75.0 Bu. 1992 70,950 Bu. 1985 United States 19,686 1942 62.5 Bu. 1992 608,532 Bu. 1986 Oats Minnesota 5,466 1945 72.0 Bu. 2000 242,640 Bu. 1945 United States 47,494 1955 65.4 Bu. 1992 1,523,851 Bu. 1945 All Hay Minnesota 4,721 3/ 1941 3.39 Tons 1986 9,675 Tons 1986 United States 77,639 3/ 1944 2.58 Tons 1995 159,707 Tons 1999 All Potatoes Minnesota 486 3/ 1922 360 Cwt. 2000 26,244 Cwt. 1922 United States 3,901 3/ 1922 381 Cwt. 2000 513,621 Cwt. 2000 Dry Beans Minnesota 205 1999 1,710 Lbs. 1994 2,558 Cwt. 1997 & 1999 United States 2,599 1943 1,763 Lbs. 1999 33,319 Cwt. 1991 Sugarbeets Minnesota 505 2002 21.5 Tons 2000 9,710 Tons 1998 United States 1,647 1969 23.7 Tons 2000 33,420 Tons 1999 All Sunflowers Minnesota 1,400 1979 1,781 Lbs. 1991 1,870,620 Lbs. 1979 United States 5,555 1979 1,510 Lbs. 1998 7,296,110 Lbs. 1979 1/ Normally spring wheat accounts for 90-95% of the all wheat estimate for Minnesota. Planted acreage estimates started in 1919; therefore, the record is based on harvested acreage estimates that started in 1866. 2/ Planted acreage estimates started in 1924, and the record was set prior to 1924. 3/ Harvested acres.
CROPS: Stocks and Price Records, Minnesota
STOCKS: Record Highs PRICES: Record Highs and Lows
Crop On-Farm Off-Farm High Monthly Average
Price since 1983 Low Monthly Average
Price since 1983 1,000 Bushels Dollars per Bushel
Corn 820,000 December 1, 1986
259,100 December 1, 1987
$3.95 August 1996
$1.29 October 1986
Soybeans 171,000 December 1, 2002
102,329 December 1, 1986
$8.38 July 1988
$3.94 October 2001
All Wheat 175,000 September 1, 1986
101,732 September 1, 1986
$5.87 June 1996
$2.23 August 1987
Barley 88,688 October 1, 1985
45,258 September 1, 1988
$3.18 June 1996
$1.10 August 1986
Oats 208,670 October 1, 1945
78,566 October 1, 1971
$2.93 July 1988
$0.82 August 1986
�

2003 Minnesota Agricultural Statistics
23CROPS
CROPS: Acreage, Yield, Production, Price, and Value, Minnesota, 1998-2002 Crop Year
�
Acreage Planted
Acreage Harvested
�
Yield Per Harvested Acre
�
Production
�
Marketing Year Average Price 1/
�
Farm Value of Production
�
Corn for Grain 2/ � ------- 1,000 Acres -------� Bushels 1,000 Bushels� Dols. Per Bu.� 1,000 Dols.�
1998� 7,300� 6,750� 153.0� 1,032,750� 1.71� 1,766,003�1999� 7,100 6,600 150.0 990,000 1.60 1,584,000 2000 7,200 6,650 145.0 964,250 1.71
1,648,868
2001 6,800 6,200 130.0 806,000 1.90 1,531,400 2002 7,200 6,700 157.0 1,051,900 2.15
2,261,585
Corn for Silage
� ------ 1,000 Acres -------� Tons� 1,000 Tons� � �
1998� --� 475� 16.0� 7,600� --� --�1999� --� 425 16.0 6,800 --� --�2000 -- 475 16.0 7,600 --� --�2001 -- 500 14.0 7,000 --� --�2002 -- 425 18.0 7,650 --� --�
Soybeans � ------- 1,000 Acres -------� Bushels� 1,000 Bushels� Dols. Per Bu.� 1,000 Dols.�
1998� 6,900� 6,800� 42.0� 285,600� 4.65� 1,328,040�1999� 7,000 6,900 42.0 289,800 4.42 1,280,916 2000 7,300 7,150 41.0 293,150 4.38 1,283,997 2001 7,300 7,200 37.0 266,400 4.32 1,150,848 2002 7,200 7,100 43.5 308,850 5.25 1,621,463
Oats
� ----- 1,000 Acres -----� Bushels 1,000 Bushels� Dols. Per Bu.� 1,000 Dols.�1998� 350� 310� 63.0� 19,530� 1.02� 19,921�1999� 360 300 59.0 17,700 0.97 17,169 2000� 400 310 72.0 22,320 0.99 22,097 2001� 300 210 60.0 12,600 1.53 19,278 2002 420 285 56.0 15,960 1.65 26,334
Barley
� ----- 1,000 Acres ------� Bushels� 1,000 Bushels� Dols. Per Bu.� 1,000 Dols.�1998� 440� 415� 55.0� 22,825� 1.62� 36,977�1999� 200 180 47.0 8,460 1.54 13,028 2000� 270 240 64.0 15,360 1.67 25,651 2001� 160 145 55.0 7,975 1.70 13,558 2002 210 165 39.0 6,435 2.20 14,157
Rye
� ----- 1,000 Acres -----� Bushels� 1,000 Bushels� Dols. Per Bu.� 1,000 Dols.�1998� 30� 27� 31.0� 837� 1.90� 1,590�1999 3/� 30 25 31.0 775 1.31 1,015 1/ Marketing year average prices received by farmers are based on monthly prices weighted by monthly marketings. Marketing year periods, by crop, are October-September for corn; September-August for soybeans; and July-June for oats, barley, and rye. Prices do not include allowance for CCC loans outstanding, purchases by the government, or deficiency payments. Price for latest year shown is preliminary. It includes an allowance for marketings from December through the remainder of the marketing year. 2/ Acreage planted to corn is for “all purposes”. 3/ Estimates for Minnesota discontinued after the 1999 crop year.
--continued��
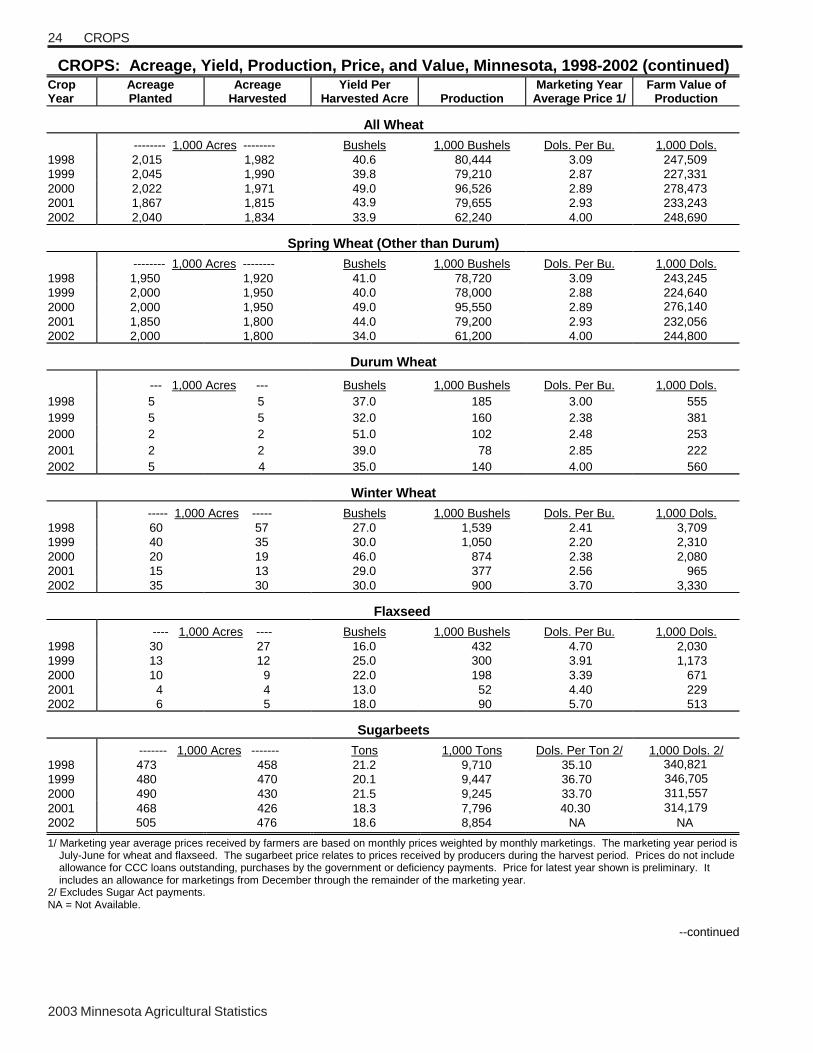
2003 Minnesota Agricultural Statistics
24 CROPS
CROPS: Acreage, Yield, Production, Price, and Value, Minnesota, 1998-2002 (continued) Crop Year�
Acreage Planted�
Acreage Harvested�
Yield Per Harvested Acre�
Production�
Marketing Year Average Price 1/�
Farm Value of Production�
All Wheat � -------- 1,000 Acres --------� Bushels� 1,000 Bushels� Dols. Per Bu.� 1,000 Dols.�
1998� 2,015� 1,982� 40.6� 80,444� 3.09� 247,509�1999� 2,045 1,990 39.8 79,210 2.87 227,331 2000� 2,022 1,971 49.0 96,526 2.89 278,473 2001� 1,867 1,815 43.9
79,655 2.93 233,243
2002 2,040 1,834 33.9 62,240 4.00 248,690
Spring Wheat (Other than Durum)�� -------- 1,000 Acres --------� Bushels� 1,000 Bushels� Dols. Per Bu.� 1,000 Dols.�
1998� 1,950� 1,920� 41.0� 78,720� 3.09� 243,245�1999� 2,000 1,950 40.0 78,000 2.88 224,640 2000� 2,000 1,950 49.0 95,550 2.89 276,140
2001� 1,850 1,800 44.0 79,200 2.93 232,056 2002 2,000 1,800 34.0 61,200 4.00 244,800
Durum Wheat
� --- 1,000 Acres --- � Bushels� 1,000 Bushels� Dols. Per Bu.� 1,000 Dols.�1998� 5� 5� 37.0� 185� 3.00� 555�1999� 5 5 32.0 160 2.38 381 2000� 2 2 51.0 102 2.48 253 2001� 2 2 39.0 78 2.85 222 2002� 5 4 35.0 140 4.00 560
Winter Wheat � ----- 1,000 Acres -----� Bushels� 1,000 Bushels� Dols. Per Bu.� 1,000 Dols.�
1998� 60� 57� 27.0� 1,539� 2.41� 3,709�1999� 40 35 30.0 1,050 2.20 2,310 2000� 20 19 46.0 874 2.38 2,080 2001� 15 13 29.0 377 2.56 965 2002� 35 30 30.0 900 3.70 3,330
Flaxseed � ---- 1,000 Acres ---- � Bushels� 1,000 Bushels� Dols. Per Bu.� 1,000 Dols.�
1998� 30� 27� 16.0� 432� 4.70� 2,030�1999� 13 12 25.0 300 3.91 1,173 2000� 10 9 22.0 198 3.39 671 2001� 4 4 13.0 52 4.40 229 2002� 6 5 18.0 90 5.70 513
Sugarbeets � ------- 1,000 Acres -------� Tons� 1,000 Tons� Dols. Per Ton 2/� 1,000 Dols. 2/�
1998� 473� 458� 21.2� 9,710� 35.10� 340,821�1999� 480 470 20.1 9,447 36.70 346,705 2000� 490 430 21.5 9,245 33.70 311,557 2001� 468 426 18.3 7,796 40.30 314,179 2002� 505 476 18.6 8,854 NA NA
1/ Marketing year average prices received by farmers are based on monthly prices weighted by monthly marketings. The marketing year period is July-June for wheat and flaxseed. The sugarbeet price relates to prices received by producers during the harvest period. Prices do not include allowance for CCC loans outstanding, purchases by the government or deficiency payments. Price for latest year shown is preliminary. It includes an allowance for marketings from December through the remainder of the marketing year. 2/ Excludes Sugar Act payments. NA = Not Available.
--continued��

2003 Minnesota Agricultural Statistics
25CROPS
CROPS: Acreage, Yield, Production, Price, and Value, Minnesota, 1998-2002 (continued) Crop Year
�
Acreage Planted
�
Acreage Harvested
�
Yield Per Harvested Acre
�
Production
�
Marketing Year Average Price 1/
�
Farm Value of Production
�
All Sunflowers �
----- 1,000 Acres -----� Pounds� 1,000 Lbs.� Dols. Per Cwt.� 1,000 Dols.�
1998� 130� 125� 1,320� 164,950� 12.20� 18,443�1999� 130 120 1,360 163,250 9.34 14,027 2000 95 85 1,578 134,150 7.90 11,335 2001� 60 56 1,325
74,200
10.90
8,028
2002 70 64 1,345 86,050 12.80 11,080
Oil Sunflowers �
--- 1,000 Acres ---�
Pounds�
1,000 Lbs.�
Dols. Per Cwt.�
1,000 Dols.�
1998�
90�
87�
1,350�
117,450�
10.00�
11,745�
1999�
80 77 1,450 111,650 6.74 7,525 2000
�
55 48 1,600 76,800 6.62 5,084 2001� 30
28
1,400 39,200 10.30 4,038
2002 40 37 1,450 53,650 12.50 6,706
Non-Oil Sunflowers �
--- 1,000 Acres ---� Pounds� 1,000 Lbs.� Dols. Per Cwt.� 1,000 Dols.�
1998� 40� 38� 1,250� 47,500� 14.10� 6,698�1999� 50 43 1,200 51,600 12.60 6,502 2000 40 37 1,550 57,350 10.90 6,251 2001 30 28 1,250 35,000 11.40 3,990 2002 30
27 1,200 32,400 13.50 4,374
Canola��
----- 1,000 Acres -----� Pounds� 1,000 Lbs.� Dols. Per Cwt.� 1,000 Dols.�
1998� 210� 200� 1,450� 290,000� NA� NA�1999� 105 100 1,300 130,000 NA� NA�2000� 140 125 1,480 185,000 NA� NA�2001� 80 75 1,180 88,500 8.27 7,319 2002 80 45 850 38,250 10.30 3,940
All Hay �
----- 1,000 Acres -----� Tons� 1,000 Tons� Dols. Per Ton� 1,000 Dols.�
1998� --� 2,400� 2.96� 7,110� 67.00� 482,040�1999� -- 2,450 2.91 7,130 60.00 433,340 2000� -- 2,250 3.04� 6,840 59.00 422,730 2001� -- 2,150 2.88 6,195 58.00 366,468 2002 -- 2,300 2.87 6,610 68.00 465,140
Alfalfa Hay �
----- 1,000 Acres -----� Tons� 1,000 Tons� Dols. Per Ton� 1,000 Dols.�
1998� --� 1,550� 3.60� 5,580� 73.50� 410,130�1999� -- 1,600 3.50 5,600 67.00 375,200 2000� -- 1,550 3.60� 5,580 66.50 371,070 2001
�
-- 1,450 3.50 5,075 62.50 317,188 2002 -- 1,600 3.30 5,280 75.50 398,640
All Other Hay �
----- 1,000 Acres -----� Tons� 1,000 Tons� Dols. Per Ton� 1,000 Dols.�
1998�
--�
850�
1.80�
1,530�
47.00�
71,910 1999
�
-- 850 1.80 1,530 38.00 58,140 2000� -- 700 1.80� 1,260 41.00 51,660 2001� -- 700 1.60 1,120 44.00 49,280 2002 -- 700 1.90 1,330 50.00 66,500 1/ Marketing year average prices received by farmers are based on monthly prices weighted by monthly marketings. Marketing years are September-August for sunflowers, July-June for canola, and June-May for hay. Price for latest year shown is preliminary. It includes an allowance for marketings from December through the remainder of the marketing year. NA = Not Available --continued

2003 Minnesota Agricultural Statistics
26 CROPS
CROPS: Acreage, Yield, Production, Price, and Value, Minnesota, 1998-2002 (continued) Crop Year
Acreage Planted�
Acreage Harvested�
Yield Per Harvested Acre� Production�
Marketing Year Average Price 1/�
Farm Value of Production�
All Dry Edible Beans ----------- Acres ----------- Pounds 1,000 Cwt. Dols. Per Cwt. 1,000 Dols.
1998 190,000 175,000 1,450 2,538 19.60 49,745 1999 205,000 165,000 1,550 2,558 17.30 44,253 2000 165,000 150,000 1,600 2,400 15.90 38,160 2001 115,000 105,000 1,500 1,575 24.30 38,273 2002 170,000 150,000 1,650 2,475 16.80 41,580
Navy
---------- Acres ---------- Pounds 1,000 Cwt. 1998 51,000 46,000 1,620 745 -- -- 1999 80,000 64,000 1,560 998 -- -- 2000 66,000 60,000 1,650 990 -- -- 2001 48,000 44,000 1,620 713 -- -- 2002 67,000 58,000 1,800 1,043 -- --
Pinto
---------- Acres ---------- Pounds 1,000 Cwt. 1998 55,000 52,000 1,400 726 -- -- 1999 38,000 24,000 1,430 343 -- -- 2000 39,000 34,000 1,450 494 -- -- 2001 13,000 12,000 1,300 156 -- -- 2002 25,000 22,000 1,350 297 -- --
Light Red Kidney
---------- Acres ---------- Pounds 1,000 Cwt. 1998 11,000 10,500 1,570 165 -- 1999 11,000 10,500 1,700 178 -- -- 2000 10,000 9,600 1,850 178 -- -- 2001 8,200 7,700 1,490 115 -- -- 2002 7,600 7,200 1,940 140 -- --
Dark Red Kidney
---------- Acres ---------- Pounds 1,000 Cwt. 1998 34,000 32,000 1,410 450 -- -- 1999 38,000 36,000 1,660 597 -- -- 2000 32,000 30,000 1,700 510 -- -- 2001 31,000 29,000 1,500 435 -- -- 2002 42,000 38,000 1,700 646 -- --
Other Dry Edible Beans
---------- Acres ---------- Pounds 1,000 Cwt. 1998 39,000 34,500 1,310 452 -- -- 1999 38,000 30,500 1,450 442 -- -- 2000 18,000 16,400 1,390 228 -- -- 2001 14,800 12,300 1,270 156 -- -- 2002 28,400 24,800 1,410 349 -- -- -- -- 1/ Marketing year average price received by farmers is based on monthly prices weighted by monthly marketings. Market year is September- August for dry beans. Price for latest year shown is preliminary. It includes an allowance for marketings from December through the remainder of the marketing year. Prices not available by type.
--continued
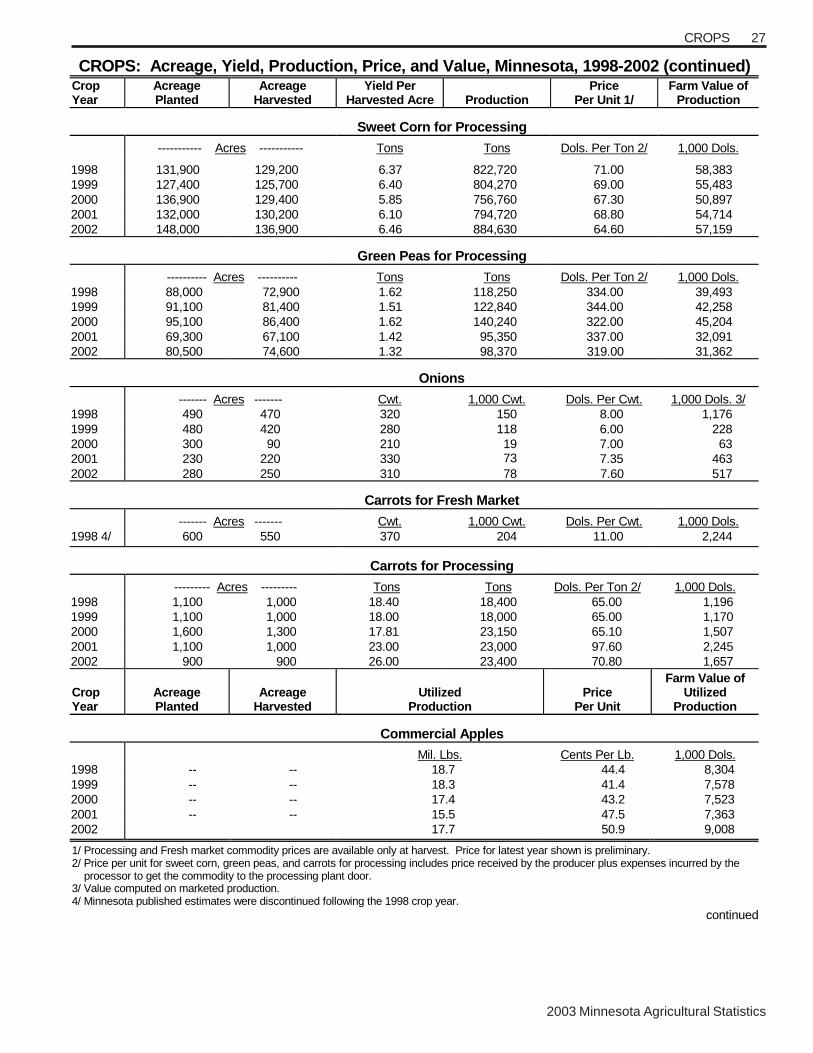
2003 Minnesota Agricultural Statistics
27CROPS
CROPS: Acreage, Yield, Production, Price, and Value, Minnesota, 1998-2002 (continued) Crop Year
Acreage Planted
Acreage Harvested
Yield Per Harvested Acre
Production
Price Per Unit 1/
Farm Value of Production
Sweet Corn for Processing ----------- Acres ----------- Tons Tons Dols. Per Ton 2/ 1,000 Dols.
1998 131,900 129,200 6.37 822,720 71.00 58,383 1999 127,400 125,700 6.40 804,270 69.00 55,483 2000 136,900 129,400 5.85 756,760 67.30 50,897 2001 132,000 130,200 6.10 794,720 68.80 54,714 2002 148,000 136,900 6.46 884,630 64.60 57,159
Green Peas for Processing ---------- Acres ---------- Tons Tons Dols. Per Ton 2/ 1,000 Dols.
1998 88,000 72,900 1.62 118,250 334.00 39,493 1999 91,100 81,400 1.51 122,840 344.00 42,258 2000 95,100 86,400 1.62 140,240 322.00 45,204 2001 69,300 67,100 1.42 95,350 337.00 32,091 2002 80,500 74,600 1.32 98,370 319.00 31,362
Onions ------- Acres ------- Cwt. 1,000 Cwt. Dols. Per Cwt. 1,000 Dols. 3/
1998 490 470 320 150 8.00 1,176 1999 480 420 280 118 6.00 228 2000 300 90 210 19 7.00 63 2001 230 220 330 73
7.35 463
2002 280 250 310 78 7.60 517
Carrots for Fresh Market ------- Acres ------- Cwt. 1,000 Cwt. Dols. Per Cwt. 1,000 Dols.
1998 4/ 600 550 370 204 11.00 2,244
Carrots for Processing --------- Acres --------- Tons Tons Dols. Per Ton 2/ 1,000 Dols.
1998 1,100 1,000 18.40 18,400 65.00 1,196 1999 1,100 1,000 18.00 18,000 65.00 1,170 2000 1,600 1,300 17.81 23,150 65.10 1,507 2001 1,100 1,000 23.00 23,000 97.60 2,245 2002 900 900 26.00 23,400 70.80 1,657
Crop Year
Acreage Planted
Acreage Harvested
Utilized Production
Price Per Unit
Farm Value of Utilized
Production
Commercial Apples Mil. Lbs. Cents Per Lb. 1,000 Dols.
1998 -- -- 18.7 44.4 8,304 1999 -- -- 18.3 41.4 7,578 2000 -- -- 17.4 43.2 7,523 2001 -- -- 15.5 47.5 7,363 2002 17.7 50.9 9,008 1/ Processing and Fresh market commodity prices are available only at harvest. Price for latest year shown is preliminary. 2/ Price per unit for sweet corn, green peas, and carrots for processing includes price received by the producer plus expenses incurred by the processor to get the commodity to the processing plant door. 3/ Value computed on marketed production. 4/ Minnesota published estimates were discontinued following the 1998 crop year.
continued
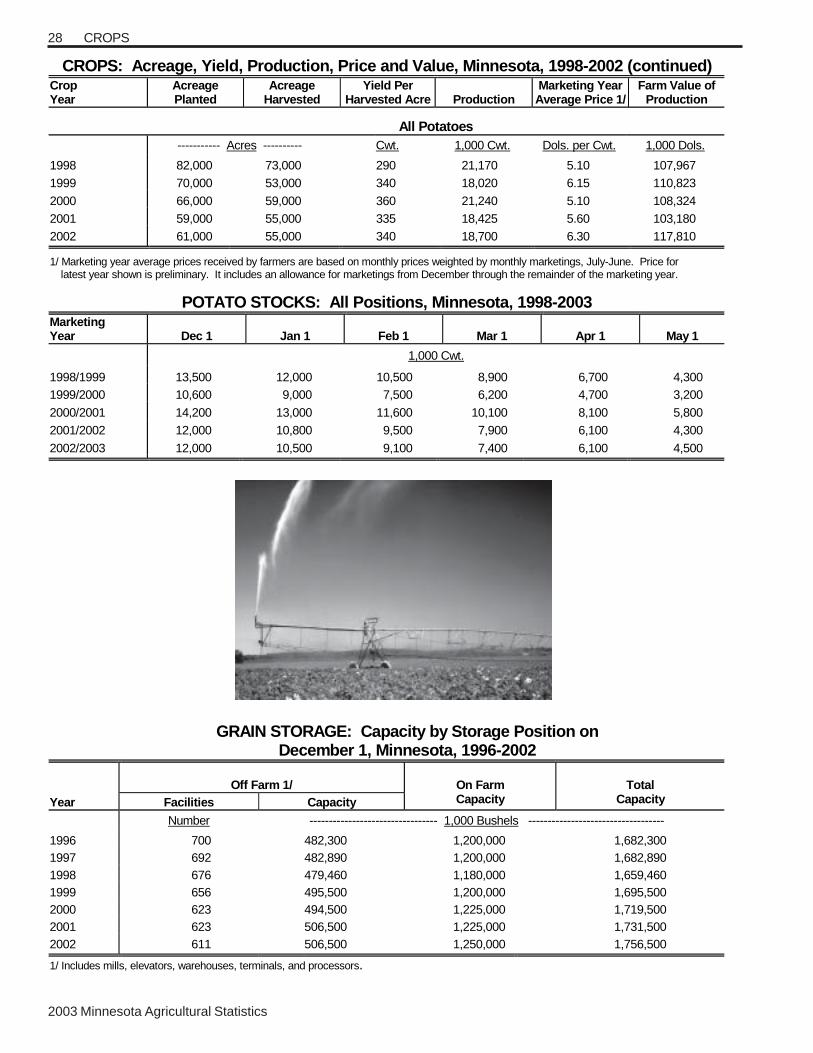
2003 Minnesota Agricultural Statistics
28
CROPS: Acreage, Yield, Production, Price and Value, Minnesota, 1998-2002 (continued) Crop Year
�
Acreage Planted
�
Acreage Harvested
�
Yield Per Harvested Acre
�
Production
�
Marketing Year Average Price 1/
�
Farm Value of Production
�
All Potatoes ----------- Acres ---------- Cwt. 1,000 Cwt. Dols. per Cwt. 1,000 Dols.
1998 82,000 73,000 290 21,170 5.10 107,967 1999 70,000 53,000 340 18,020 6.15 110,823
2000 66,000 59,000 360 21,240 5.10 108,324 2001 59,000 55,000 335 18,425 5.60 103,180 2002 61,000 55,000 340 18,700 6.30 117,810 1/ Marketing year average prices received by farmers are based on monthly prices weighted by monthly marketings, July-June. Price for latest year shown is preliminary. It includes an allowance for marketings from December through the remainder of the marketing year.
GRAIN STORAGE: Capacity by Storage Position on
December 1, Minnesota, 1996-2002
�
Off Farm 1/�
Year�
Facilities�
Capacity�
On Farm Capacity
�
Total Capacity
�
�
Number --------------------------------- 1,000 Bushels -----------------------------------�
1996� 700� 482,300� 1,200,000� 1,682,300�1997� 692� 482,890� 1,200,000� 1,682,890�1998� 676� 479,460� 1,180,000� 1,659,460�1999� 656 495,500 1,200,000 1,695,500 2000 623 494,500 1,225,000 1,719,500 2001 623 506,500 1,225,000 1,731,500 2002 611 506,500 1,250,000 1,756,500 1/ Includes mills, elevators, warehouses, terminals, and processors.��
POTATO STOCKS: All Positions, Minnesota, 1998-2003 Marketing Year
�
Dec 1�
Jan 1�
Feb 1�
Mar 1�
Apr 1�
May 1�
�
1,000 Cwt.�
1998/1999� 13,500� 12,000� 10,500� 8,900� 6,700� 4,300�1999/2000� 10,600 9,000 7,500 6,200 4,700 3,200
2000/2001 14,200 13,000 11,600 10,100 8,100 5,800 2001/2002 12,000 10,800 9,500 7,900 6,100 4,300
2002/2003 12,000 10,500 9,100 7,400 6,100 4,500
CROPS

2003 Minnesota Agricultural Statistics
29CROPS
OBJECTIVE YIELD: Corn, Soybeans, and Spring Wheat, Minnesota, 1998-2002 The Minnesota Agricultural Statistics Service conducts objective yield surveys in the state for corn, soybeans, and spring wheat. Randomly selected plots in fields across the state are visited monthly from August through harvest to obtain specific counts and measurements. Data in these tables are rounded actual counts from these surveys and are not official estimates of the Agricultural Statistics Board, but are intended to show trends in production practices. �
CORN FOR GRAIN: Plant Population per Acre 1/ Month 1998� 1999� 2000 2001 2002
� Number of Plants September� 27,750� 26,750 27,500 28,050 26,950 November 2/� 27,650� 26,800 27,150 28,000 26,800
CORN FOR GRAIN: Percentage Distributions by Row Width and Average Row Width Row Width (Inches) 3/
Year
Number of
Samples�20.5 or Less
20.6- 30.5�
30.6- 34.5�
34.6- 36.5�
36.6- 38.5�
38.6 & Greater
Average Row
Width�
� Number� --------------------------------------- Percent of Plots --------------------------------------� Inches�1998� 169� 0.6 62.0� 17.2� 10.1� 7.7� 2.4� 31.1�1999� 162 0.0 63.5 19.8 4.3 9.3 3.1 30.6
2000 164 2.4 62.3 20.1 6.1 7.3 1.8 30.5
2001� 162 2.5 66.7 22.2 3.1 4.3 1.2 29.5 2002 158 1.9 69.5 19.0 3.2 5.1 1.3 30.0
SOYBEANS: Pods with Beans per 18 Square Feet 1/ Month 1998� 1999� 2000 2001 2002
� Number of Pods September� 1,598� 1,612 1,607 1,492 1,688 November� 1,450� 1,563 1,507 1,475 1,739 Final� 1,442� 1,565 1,507 1,475 1,715
SOYBEANS: Percentage Distributions by Row Width and Average Row Width
� � Row Width (Inches) 3/� �
Year
Number of
Samples�10.0 & Less 4/�
10.1- 18.5�
18.6- 28.5�
28.6- 34.5�
34.6 & Greater�
Average Row
Width 3/�
� Number� ------------------------------------- Percent of Plots ----------------------------------� Inches�1998� 105� 17.6� 21.0� 15.7� 43.8� 1.9� 22.0�1999� 100 22.1 26.1 12.1 33.7 6.0 20.4 2000 95 23.7 19.5 12.1 42.6 2.1 20.8 2001 91 14.8 25.8 17.0 41.9 0.5 21.5 2002 103 19.9 24.3 20.9 33.0 1.9 20.2
SPRING WHEAT: Heads per Square Foot 5/ Month 1998� 1999� 2000 2001 2002
� Number of Heads�September� 45.8� 49.0 52.5 49.2 6/ Final� 45.8� 49.4 52.5 49.1 50.6 1/ Based on counts in plots selected for objective yield samples. 2/ No change between November and final. 3/ Spacings based on row measurements in sample plots selected for objective yield survey. 4/ Broadcast soybeans included as 10.0 inches and less but excluded in computation of average width. 5/ Based on the number of heads counted in plots selected for the objective yield survey.�6/ September forecast discontinued.
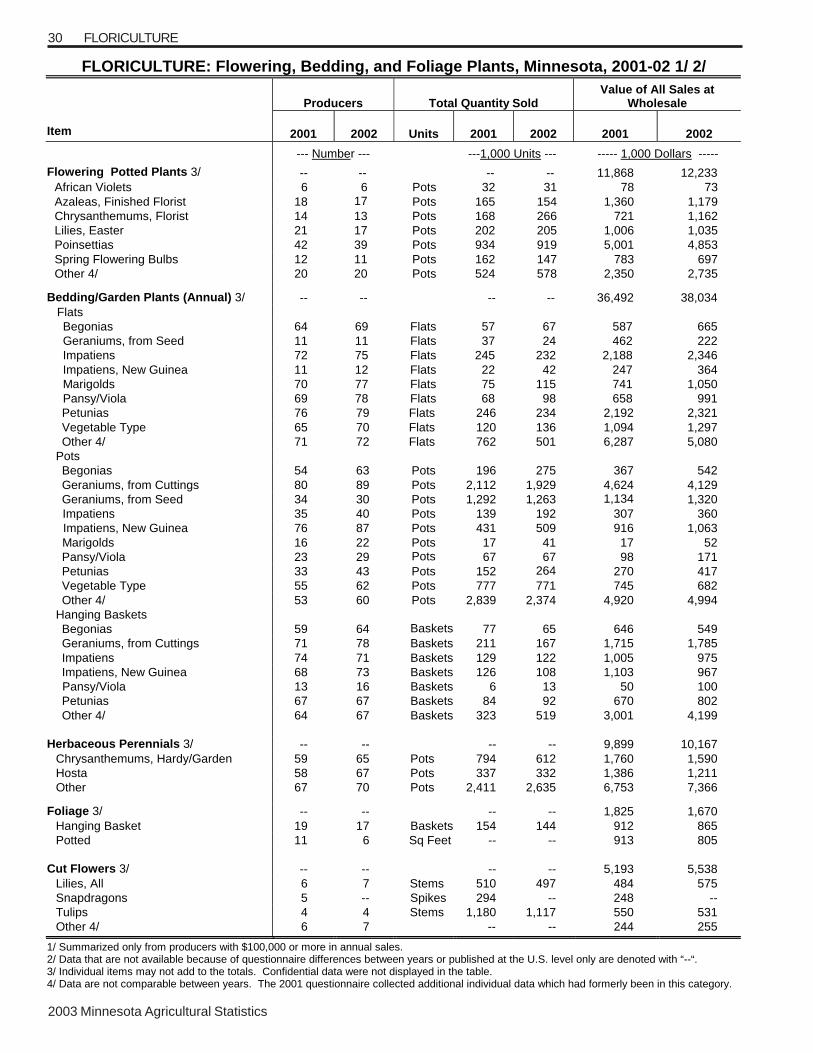
2003 Minnesota Agricultural Statistics
30 FLORICULTURE
FLORICULTURE: Flowering, Bedding, and Foliage Plants, Minnesota, 2001-02 1/ 2/
Producers� Total Quantity Sold�Value of All Sales at
Wholesale���
Item� 2001 � 2002 Units� 2001� 2002� 2001� 2002�
� --- Number --- ---1,000 Units ---� ----- 1,000 Dollars -----
Flowering Potted Plants 3/ -- -- -- -- 11,868 12,233 African Violets 6 6 Pots 32 31 78 73 Azaleas, Finished Florist� 18 17
Pots� 165 154 1,360 1,179
Chrysanthemums, Florist� 14 13 Pots� 168 266 721 1,162 Lilies, Easter� 21 17 Pots� 202 205 1,006 1,035 Poinsettias� 42 39 Pots� 934 919 5,001 4,853 Spring Flowering Bulbs� 12 11 Pots 162 147 783 697 Other 4/� 20 20 Pots� 524 578 2,350 2,735
Bedding/Garden Plants (Annual) 3/� -- -- � -- -- 36,492 38,034 Flats
Begonias� 64 69 Flats� 57 67 587 665 Geraniums, from Seed 11 11 Flats 37 24 462 222 Impatiens� 72 75 Flats� 245 232 2,188 2,346 Impatiens, New Guinea� 11 12 Flats� 22 42 247 364 Marigolds� 70 77 Flats� 75 115 741 1,050 Pansy/Viola� 69 78 Flats� 68 98 658 991
Petunias� 76 79 Flats� 246 234 2,192 2,321 Vegetable Type� 65 70 Flats� 120 136 1,094 1,297 Other 4/� 71 72 Flats� 762 501 6,287 5,080 Pots Begonias� 54 63 Pots� 196 275 367 542 Geraniums, from Cuttings� 80 89 Pots� 2,112 1,929 4,624 4,129 Geraniums, from Seed� 34 30 Pots� 1,292 1,263 1,134
Pansy/Viol 1,320
Impatiens� 35 40 Pots� 139 192 307 360 Impatiens, New Guinea� 76 87 Pots� 431 509 916 1,063
Marigolds 16 22 Pots 17 41 17 52 Pansy/Viola� 23 29 Pots
67 67 98 171
Petunias� 33 43 Pots� 152 264 Pansy/Vio
270 417 Vegetable Type� 55 62 Pots� 777 771 745 682 Other 4/� 53 60 Pots� 2,839 2,374 4,920 4,994 Hanging Baskets Begonias� 59 64 Baskets 77 65 646 549 Geraniums, from Cuttings 71 78 Baskets 211 167 1,715 1,785 Impatiens� 74 71 Baskets� 129 122 1,005 975 Impatiens, New Guinea� 68 73 Baskets� 126 108 1,103 967
Pansy/Viola 13 16 Baskets 6 13 50 100 Petunias� 67 67 Baskets� 84 92 670 802 Other 4/� 64 67 Baskets� 323 519 3,001 4,199 Herbaceous Perennials 3/ -- -- -- -- 9,899 10,167 Chrysanthemums, Hardy/Garden� 59 65 Pots� 794 612 1,760 1,590 Hosta� 58 67 Pots� 337 332 1,386 1,211 Other � 67 70 Pots� 2,411 2,635 6,753 7,366 Foliage 3/ -- -- -- -- 1,825 1,670 Hanging Basket� 19 17 Baskets� 154 144 912 865 Potted� 11 6 Sq Feet� -- -- 913 805 Cut Flowers 3/ -- -- -- -- 5,193 5,538 Lilies, All 6 7 Stems 510 497 484 575 Snapdragons 5 -- Spikes 294 -- 248 -- Tulips 4 4 Stems 1,180 1,117 550 531 Other 4/ 6 7 -- -- 244 255
1/ Summarized only from producers with $100,000 or more in annual sales. 2/ Data that are not available because of questionnaire differences between years or published at the U.S. level only are denoted with “--“. 3/ Individual items may not add to the totals. Confidential data were not displayed in the table. 4/ Data are not comparable between years. The 2001 questionnaire collected additional individual data which had formerly been in this category.
�
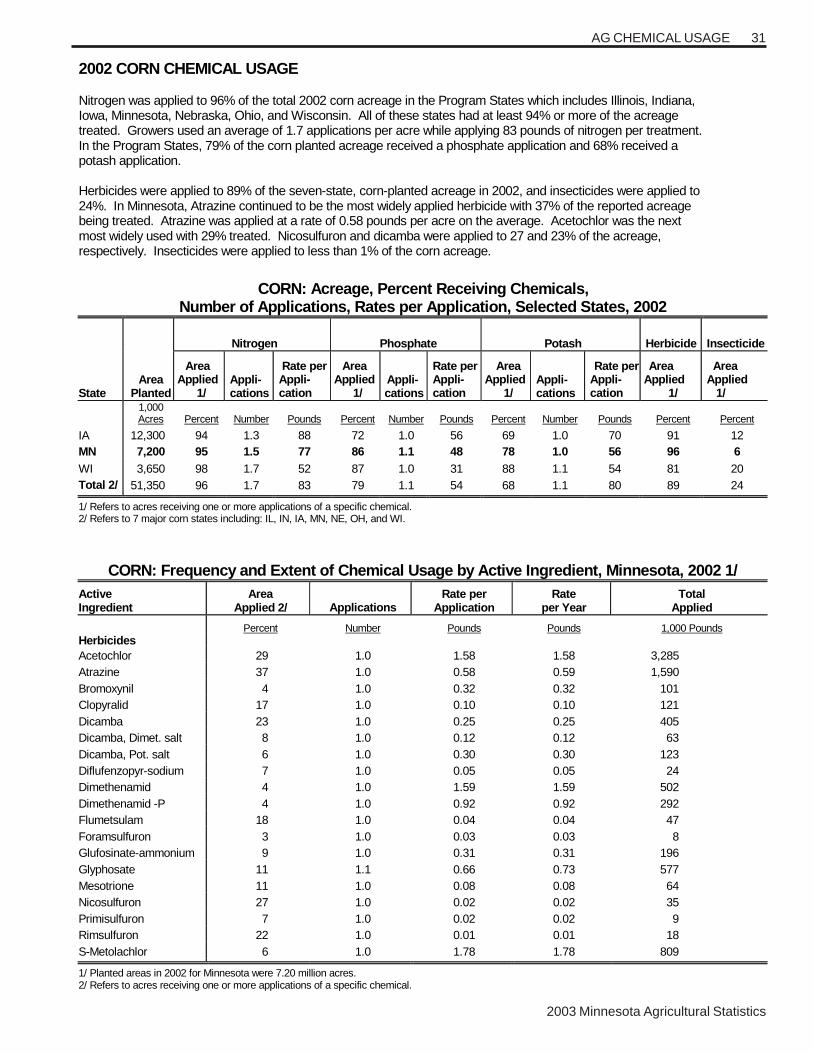
2003 Minnesota Agricultural Statistics
31AG CHEMICAL USAGE
2002 CORN CHEMICAL USAGE
Nitrogen was applied to 96% of the total 2002 corn acreage in the Program States which includes Illinois, Indiana, Iowa, Minnesota, Nebraska, Ohio, and Wisconsin. All of these states had at least 94% or more of the acreage treated. Growers used an average of 1.7 applications per acre while applying 83 pounds of nitrogen per treatment. In the Program States, 79% of the corn planted acreage received a phosphate application and 68% received a potash application.
Herbicides were applied to 89% of the seven-state, corn-planted acreage in 2002, and insecticides were applied to 24%. In Minnesota, Atrazine continued to be the most widely applied herbicide with 37% of the reported acreage being treated. Atrazine was applied at a rate of 0.58 pounds per acre on the average. Acetochlor was the next most widely used with 29% treated. Nicosulfuron and dicamba were applied to 27 and 23% of the acreage, respectively. Insecticides were applied to less than 1% of the corn acreage.
CORN: Acreage, Percent Receiving Chemicals, Number of Applications, Rates per Application, Selected States, 2002
Nitrogen Phosphate Potash Herbicide Insecticide
State Area
Planted
Area Applied
1/ Appli- cations
Rate per Appli- cation
Area Applied
1/ Appli-
cations
Rate per Appli- cation
Area Applied
1/ Appli- cations
Rate per Appli- cation
Area Applied
1/
Area Applied 1/
1,000 Acres Percent Number Pounds Percent Number Pounds Percent Number Pounds Percent Percent
IA 12,300 94 1.3 88 72 1.0 56 69 1.0 70 91 12 MN 7,200 95 1.5 77 86 1.1 48 78 1.0 56 96 6 WI 3,650 98 1.7 52 87 1.0 31 88 1.1 54 81 20 Total 2/ 51,350 96 1.7 83 79 1.1 54 68 1.1 80 89 24 1/ Refers to acres receiving one or more applications of a specific chemical. 2/ Refers to 7 major corn states including: IL, IN, IA, MN, NE, OH, and WI.
CORN: Frequency and Extent of Chemical Usage by Active Ingredient, Minnesota, 2002 1/ Active Ingredient
Area Applied 2/ Applications
Rate per Application
Rate per Year
Total Applied
Percent Number Pounds Pounds 1,000 Pounds Herbicides Acetochlor 29 1.0 1.58 1.58 3,285 Atrazine 37 1.0 0.58 0.59 1,590 Bromoxynil 4 1.0 0.32 0.32 101 Clopyralid 17 1.0 0.10 0.10 121 Dicamba 23 1.0 0.25 0.25 405 Dicamba, Dimet. salt 8 1.0 0.12 0.12 63 Dicamba, Pot. salt 6 1.0 0.30 0.30 123 Diflufenzopyr-sodium 7 1.0 0.05 0.05 24 Dimethenamid 4 1.0 1.59 1.59 502 Dimethenamid -P 4 1.0 0.92 0.92 292 Flumetsulam 18 1.0 0.04 0.04 47 Foramsulfuron 3 1.0 0.03 0.03 8 Glufosinate-ammonium 9 1.0 0.31 0.31 196 Glyphosate 11 1.1 0.66 0.73 577 Mesotrione 11 1.0 0.08 0.08 64 Nicosulfuron 27 1.0 0.02 0.02 35 Primisulfuron 7 1.0 0.02 0.02 9 Rimsulfuron 22 1.0 0.01 0.01 18 S-Metolachlor 6 1.0 1.78 1.78 809 1/ Planted areas in 2002 for Minnesota were 7.20 million acres. 2/ Refers to acres receiving one or more applications of a specific chemical.

2003 Minnesota Agricultural Statistics
32 AG CHEMICAL USAGE
SOYBEANS: Acreage, Percent Receiving Chemicals, Number of Applications, Rates per Application, Selected States, 2002
Nitrogen Phosphate Potash Herbicide Insecticide
State Area
Planted
Area Applied
1/ Appli-
cations
Rate per Appli- cation
Area Applied
1/ Appli-
cations
Rate per Appli- cation
Area Applied
1/ Appli-
cations
Rate per Appli- cation
Area Applied
1/
Area Applied
1/
1,000 Acres Percent Number Pounds Percent Number Pounds Percent Number Pounds Percent Percent
IA 10,400 3 1.0 26 7 1.0 70 12 10.0 120 99 9 MN 7,200 11 1.0 20 12 1.0 38 10 1.0 52 99 2/ SD 4,250 37 1.1 18 41 1.0 54 15 1.4 27 100 19 W I 1,540 40 1.0 14 35 1.0 35 48 1.0 73 86 2/ Total 3/ 71,670 20 1.1 19 26 1.0 48 29 1.0 87 99 6 1/ Refers to acres receiving one or more applications of a specific chemical. 2/ Data not published due to insufficient number of reports. 3/ Refers to twenty major soybean states including: AR, IL, IN, IA, KS, KY, LA, MD, MI, MN, MO, MS, NC, ND, NE, OH, SD, TN, VA, and WI
SOYBEANS: Frequency and Extent of Chemical Usage By Active Ingredient, Minnesota, 2002 1/
Active Ingredient
Area Applied 2/ Applications
Rate per Application
Rate per Year
Total Applied
Percent Number Pounds Pounds 1,000 Pounds Herbicides
Fenoxaprop 4 1.0 0.10 0.10 30 Fluazifop-P-butyl 4 1.0 0.04 0.04 13 Fomesafen 7 1.0 0.20 0.20 95 Glyphosate 70 1.2 0.74 0.90 4,516 Glyphosate diam salt 9
9 1.7 0.67 1.16 732 Imazamox 6 1.0 0.02 0.02 10 Imazethapyr 10 1.0 0.05 0.05 38 Pendimethalin 9 1.0 0.91 0.91 561 Thifensulfuron 2 1.0 0.003 0.003 3/ Trifluralin 14 1.0 0.77 0.77 761 1/ Planted acres in 2002 for Minnesota were 7.20 million acres. 2/ Refers to acres receiving one or more applications of a specific chemical. 3/ Total applied is less than 1,000 lbs.
2002 SOYBEAN CHEMICAL USAGE
Nitrogen fertilizer was applied to 20% of the total 2002 soybean acreage in the 20 Program States which includesArkansas, Illinois, Indiana, Iowa, Kansas, Kentucky, Louisiana, Maryland, Michigan, Minnesota, Mississippi, Missouri,Nebraska, North Carolina, North Dakota, Ohio, South Dakota, Tennessee, Virginia, and Wisconsin. Growers used anaverage of 1.1 applications per acre while applying an average of 19 pounds of nitrogen per treatment. In the ProgramStates, 26% of the soybean planted acreage received a phosphate application and 29% received a potash application.
Herbicides were applied to 99% of the 20-state, soybean-planted acreage in 2002, while insecticides were applied to6%. In Minnesota, glyphosate continued to be the most widely applied herbicide with 70% of the reported acreagebeing treated. Trifluralin, the next most widely used herbicide, was applied to 14% of the soybean acreage andImazethapyr was applied to 10%. The amount of Minnesota soybean acreage receiving fungicides or insecticides wastoo small to report.

2003 Minnesota Agricultural Statistics
33AG CHEMICAL USAGE
OTHER SPRING WHEAT: Acreage, Percent Receiving Chemicals, Number of Applications, Rates per Application, Major States, 2002
Nitrogen Phosphate Potash Herbicide Insecticide
State Area
Planted
Area Applied
1/ Appli-
cations
Rate per Appli- cation
Area Applied
1/ Appli-
cations
Rate per Appli- cation
Area Applied
1/ Appli-
cations
Rate per Appli- cation
Area Applied
1/
Area Applied
1/
1,000 Acres Percent Number Pounds Percent Number Pounds Percent Number Pounds Percent Percent
MN 2,000 89 1 .1 62 83 1 .0 36 68 1 .0 32 84 8 MT 3,750 66 1 .2 33 54 1 .0 23 21 1 .0 19 89 2 / ND 6 ,900 97 1 .6 46 83 1 .0 34 19 1 .0 24 95 8 Total 3 / 12,650 86 1 .4 46 74 1 .0 31 27 1 .0 27 91 6 1/ Refers to acres receiving one or more applications of a specific chemical. 2/ Data not published due to insufficient number of reports. 3/ Refers to three major spring wheat states including: MN, MT and ND.
OTHER SPRING WHEAT: Frequency and Extent of Usage by Active Ingredient, Minnesota, 2002
Active Ingredient
Area Applied 2/
Applications
Rate per Application
Rate per Year
Total Applied
Percent Number Lbs. Per Acre Lbs. Per Acre 1,000 Pounds
Herbicides 2,4-D 20 1.0 0.43 0.44 171 Bromoxynil 35 1.0 0.24 0.24 170 Clodinafop-propargil 5 1.0 0.05 0.05 5 Fenoxaprop 30 1.0 0.07 0.07 42
Glyphosate 6 1.0 0.66 0.66 75 MCPA 53 1.0 0.33 0.33 351 Thifensulfuron
8 1.0 0.01 0.01 2
Tribenuron-methyl 7 1.0 0.007 0.007 1
Fungicides
Propiconazole 5 1.0 0.08 0.08 7
1/ Planted acres in 2002 for Minnesota were 2.00 million acres. 2/ Refers to acres receiving one or more applications of a specific chemical.
2002 OTHER SPRING WHEAT CHEMICAL USAGE
Nitrogen was applied to 86 percent of the 2002 other spring wheat planted acreages in three Program Stateswhich includes Minnesota, Montana, and North Dakota. Phosphate was applied to 74 percent and potash to 27percent of the planted acreage in Program States. Spring wheat producers treated 91 percent of other springwheat planted acreage with herbicides. MCPA was applied to 47 percent of planted acreage, followed by 2,4-D at36%.
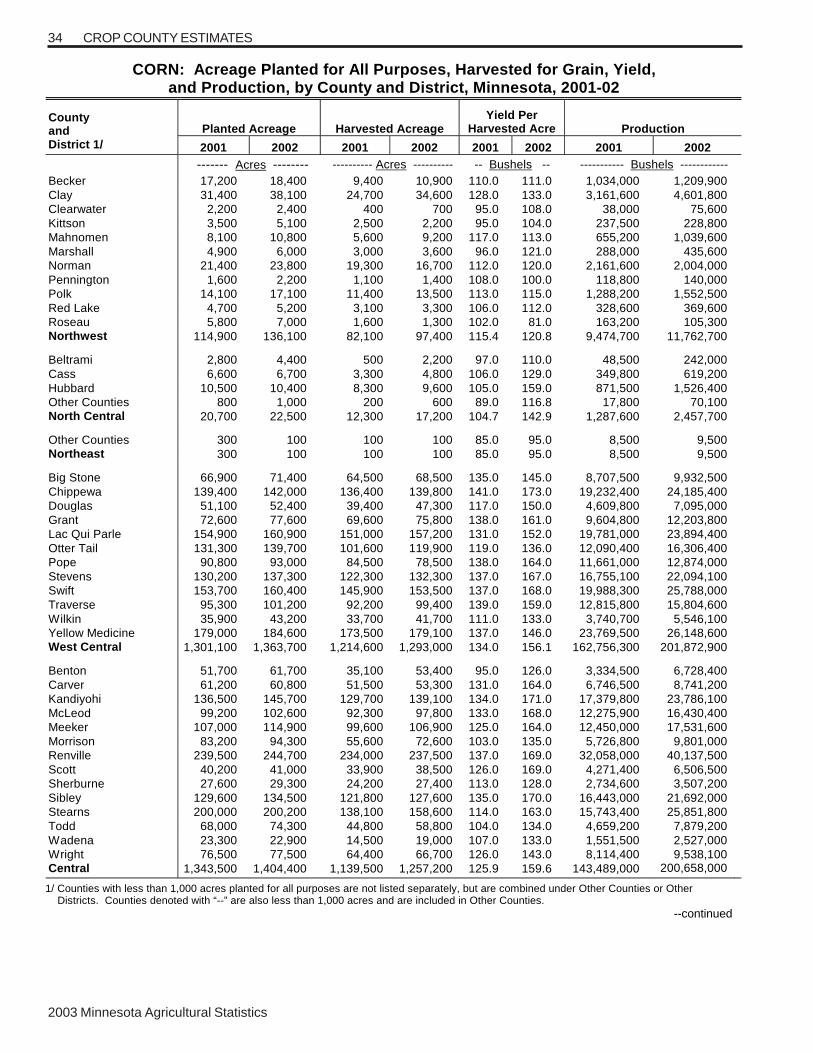
2003 Minnesota Agricultural Statistics
34 CROP COUNTY ESTIMATES
CORN: Acreage Planted for All Purposes, Harvested for Grain, Yield, and Production, by County and District, Minnesota, 2001-02
Planted Acreage Harvested Acreage Yield Per
Harvested Acre Production County and District 1/ 2001 2002 2001 2002 2001 2002 2001 2002 ------- Acres -------- ---------- Acres ---------- -- Bushels -- ----------- Bushels ------------ Becker 17,200 18,400 9,400 10,900 110.0 111.0 1,034,000 1,209,900 Clay 31,400 38,100 24,700 34,600 128.0 133.0 3,161,600 4,601,800 Clearwater 2,200 2,400 400 700 95.0 108.0 38,000 75,600 Kittson 3,500 5,100 2,500 2,200 95.0 104.0 237,500 228,800 Mahnomen 8,100 10,800 5,600 9,200 117.0 113.0 655,200 1,039,600 Marshall 4,900 6,000 3,000 3,600 96.0 121.0 288,000 435,600 Norman 21,400 23,800 19,300 16,700 112.0 120.0 2,161,600 2,004,000 Pennington 1,600 2,200 1,100 1,400 108.0 100.0 118,800 140,000 Polk 14,100 17,100 11,400 13,500 113.0 115.0 1,288,200 1,552,500 Red Lake 4,700 5,200 3,100 3,300 106.0 112.0 328,600 369,600 Roseau 5,800 7,000 1,600 1,300 102.0 81.0 163,200 105,300 Northwest 114,900 136,100 82,100 97,400 115.4 120.8 9,474,700 11,762,700 Beltrami 2,800 4,400 500 2,200 97.0 110.0 48,500 242,000 Cass 6,600 6,700 3,300 4,800 106.0 129.0 349,800 619,200 Hubbard 10,500 10,400 8,300 9,600 105.0 159.0 871,500 1,526,400 Other Counties 800 1,000 200 600 89.0 116.8 17,800 70,100 North Central 20,700 22,500 12,300 17,200 104.7 142.9 1,287,600 2,457,700 Other Counties 300 100 100 100 85.0 95.0 8,500 9,500 Northeast 300 100 100 100 85.0 95.0 8,500 9,500 Big Stone 66,900 71,400 64,500 68,500 135.0 145.0 8,707,500 9,932,500 Chippewa 139,400 142,000 136,400 139,800 141.0 173.0 19,232,400 24,185,400 Douglas 51,100 52,400 39,400 47,300 117.0 150.0 4,609,800 7,095,000 Grant 72,600 77,600 69,600 75,800 138.0 161.0 9,604,800 12,203,800 Lac Qui Parle 154,900 160,900 151,000 157,200 131.0 152.0 19,781,000 23,894,400 Otter Tail 131,300 139,700 101,600 119,900 119.0 136.0 12,090,400 16,306,400 Pope 90,800 93,000 84,500 78,500 138.0 164.0 11,661,000 12,874,000 Stevens 130,200 137,300 122,300 132,300 137.0 167.0 16,755,100 22,094,100 Swift 153,700 160,400 145,900 153,500 137.0 168.0 19,988,300 25,788,000 Traverse 95,300 101,200 92,200 99,400 139.0 159.0 12,815,800 15,804,600 Wilkin 35,900 43,200 33,700 41,700 111.0 133.0 3,740,700 5,546,100 Yellow Medicine 179,000 184,600 173,500 179,100 137.0 146.0 23,769,500 26,148,600 West Central 1,301,100 1,363,700 1,214,600 1,293,000 134.0 156.1 162,756,300 201,872,900 Benton 51,700 61,700 35,100 53,400 95.0 126.0 3,334,500 6,728,400 Carver 61,200 60,800 51,500 53,300 131.0 164.0 6,746,500 8,741,200 Kandiyohi 136,500 145,700 129,700 139,100 134.0 171.0 17,379,800 23,786,100 McLeod 99,200 102,600 92,300 97,800 133.0 168.0 12,275,900 16,430,400 Meeker 107,000 114,900 99,600 106,900 125.0 164.0 12,450,000 17,531,600 Morrison 83,200 94,300 55,600 72,600 103.0 135.0 5,726,800 9,801,000 Renville 239,500 244,700 234,000 237,500 137.0 169.0 32,058,000 40,137,500 Scott 40,200 41,000 33,900 38,500 126.0 169.0 4,271,400 6,506,500 Sherburne 27,600 29,300 24,200 27,400 113.0 128.0 2,734,600 3,507,200 Sibley 129,600 134,500 121,800 127,600 135.0 170.0 16,443,000 21,692,000 Stearns 200,000 200,200 138,100 158,600 114.0 163.0 15,743,400 25,851,800 Todd 68,000 74,300 44,800 58,800 104.0 134.0 4,659,200 7,879,200 Wadena 23,300 22,900 14,500 19,000 107.0 133.0 1,551,500 2,527,000 Wright 76,500 77,500 64,400 66,700 126.0 143.0 8,114,400 9,538,100 Central 1,343,500 1,404,400 1,139,500 1,257,200 125.9 159.6 143,489,000 200,658,000
1/ Counties with less than 1,000 acres planted for all purposes are not listed separately, but are combined under Other Counties or Other Districts. Counties denoted with “--” are also less than 1,000 acres and are included in Other Counties. --continued
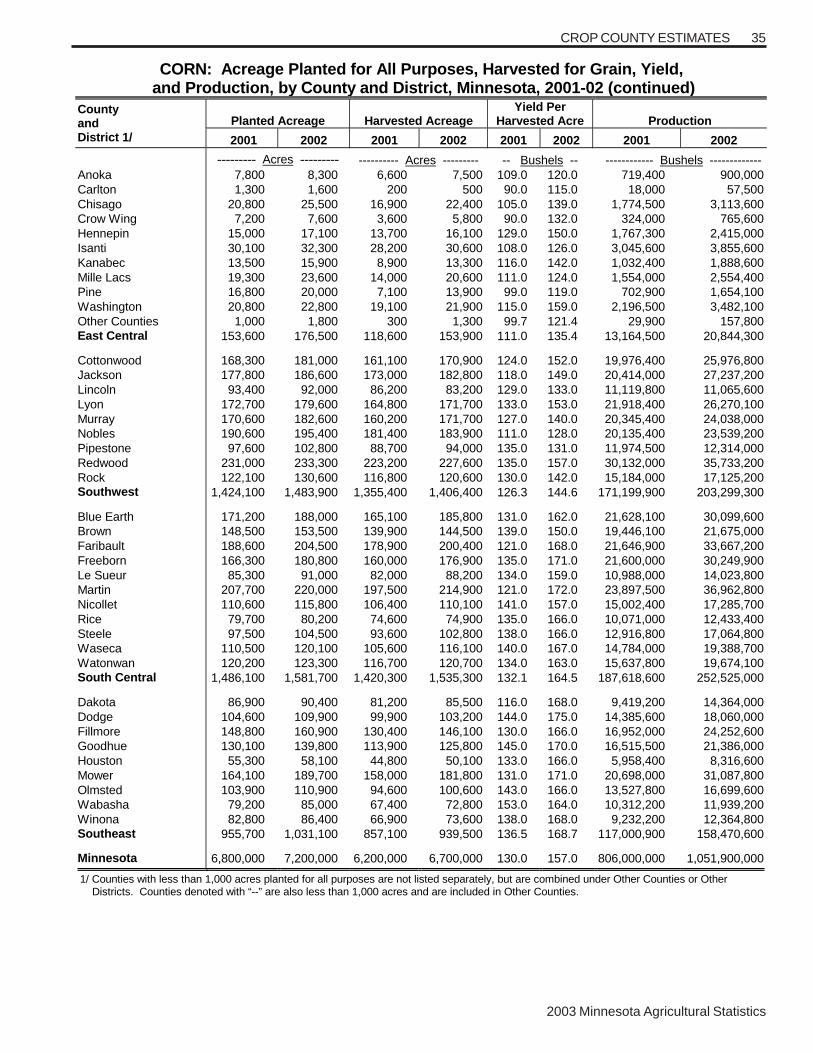
2003 Minnesota Agricultural Statistics
35CROP COUNTY ESTIMATES
CORN: Acreage Planted for All Purposes, Harvested for Grain, Yield, and Production, by County and District, Minnesota, 2001-02 (continued)
Planted Acreage Harvested Acreage Yield Per
Harvested Acre Production County and District 1/ 2001 2002 2001 2002 2001 2002 2001 2002
--------- Acres --------- ---------- Acres --------- -- Bushels -- ------------ Bushels ------------- Anoka 7,800 8,300 6,600 7,500 109.0 120.0 719,400 900,000 Carlton 1,300 1,600 200 500 90.0 115.0 18,000 57,500 Chisago 20,800 25,500 16,900 22,400 105.0 139.0 1,774,500 3,113,600 Crow Wing 7,200 7,600 3,600 5,800 90.0 132.0 324,000 765,600 Hennepin 15,000 17,100 13,700 16,100 129.0 150.0 1,767,300 2,415,000 Isanti 30,100 32,300 28,200 30,600 108.0 126.0 3,045,600 3,855,600 Kanabec 13,500 15,900 8,900 13,300 116.0 142.0 1,032,400 1,888,600 Mille Lacs 19,300 23,600 14,000 20,600 111.0 124.0 1,554,000 2,554,400 Pine 16,800 20,000 7,100 13,900 99.0 119.0 702,900 1,654,100 Washington 20,800 22,800 19,100 21,900 115.0 159.0 2,196,500 3,482,100 Other Counties 1,000 1,800 300 1,300 99.7 121.4 29,900 157,800 East Central 153,600 176,500 118,600 153,900 111.0 135.4 13,164,500 20,844,300 Cottonwood 168,300 181,000 161,100 170,900 124.0 152.0 19,976,400 25,976,800 Jackson 177,800 186,600 173,000 182,800 118.0 149.0 20,414,000 27,237,200 Lincoln 93,400 92,000 86,200 83,200 129.0 133.0 11,119,800 11,065,600 Lyon 172,700 179,600 164,800 171,700 133.0 153.0 21,918,400 26,270,100 Murray 170,600 182,600 160,200 171,700 127.0 140.0 20,345,400 24,038,000 Nobles 190,600 195,400 181,400 183,900 111.0 128.0 20,135,400 23,539,200 Pipestone 97,600 102,800 88,700 94,000 135.0 131.0 11,974,500 12,314,000 Redwood 231,000 233,300 223,200 227,600 135.0 157.0 30,132,000 35,733,200 Rock 122,100 130,600 116,800 120,600 130.0 142.0 15,184,000 17,125,200 Southwest 1,424,100 1,483,900 1,355,400 1,406,400 126.3 144.6 171,199,900 203,299,300 Blue Earth 171,200 188,000 165,100 185,800 131.0 162.0 21,628,100 30,099,600 Brown 148,500 153,500 139,900 144,500 139.0 150.0 19,446,100 21,675,000 Faribault 188,600 204,500 178,900 200,400 121.0 168.0 21,646,900 33,667,200 Freeborn 166,300 180,800 160,000 176,900 135.0 171.0 21,600,000 30,249,900 Le Sueur 85,300 91,000 82,000 88,200 134.0 159.0 10,988,000 14,023,800 Martin 207,700 220,000 197,500 214,900 121.0 172.0 23,897,500 36,962,800 Nicollet 110,600 115,800 106,400 110,100 141.0 157.0 15,002,400 17,285,700 Rice 79,700 80,200 74,600 74,900 135.0 166.0 10,071,000 12,433,400 Steele 97,500 104,500 93,600 102,800 138.0 166.0 12,916,800 17,064,800 Waseca 110,500 120,100 105,600 116,100 140.0 167.0 14,784,000 19,388,700 Watonwan 120,200 123,300 116,700 120,700 134.0 163.0 15,637,800 19,674,100 South Central 1,486,100 1,581,700 1,420,300 1,535,300 132.1 164.5 187,618,600 252,525,000 Dakota 86,900 90,400 81,200 85,500 116.0 168.0 9,419,200 14,364,000 Dodge 104,600 109,900 99,900 103,200 144.0 175.0 14,385,600 18,060,000 Fillmore 148,800 160,900 130,400 146,100 130.0 166.0 16,952,000 24,252,600 Goodhue 130,100 139,800 113,900 125,800 145.0 170.0 16,515,500 21,386,000 Houston 55,300 58,100 44,800 50,100 133.0 166.0 5,958,400 8,316,600 Mower 164,100 189,700 158,000 181,800 131.0 171.0 20,698,000 31,087,800 Olmsted 103,900 110,900 94,600 100,600 143.0 166.0 13,527,800 16,699,600 Wabasha 79,200 85,000 67,400 72,800 153.0 164.0 10,312,200 11,939,200 Winona 82,800 86,400 66,900 73,600 138.0 168.0 9,232,200 12,364,800 Southeast 955,700 1,031,100 857,100 939,500 136.5 168.7 117,000,900 158,470,600 Minnesota 6,800,000 7,200,000 6,200,000 6,700,000 130.0 157.0 806,000,000 1,051,900,000 1/ Counties with less than 1,000 acres planted for all purposes are not listed separately, but are combined under Other Counties or Other Districts. Counties denoted with “--” are also less than 1,000 acres and are included in Other Counties.
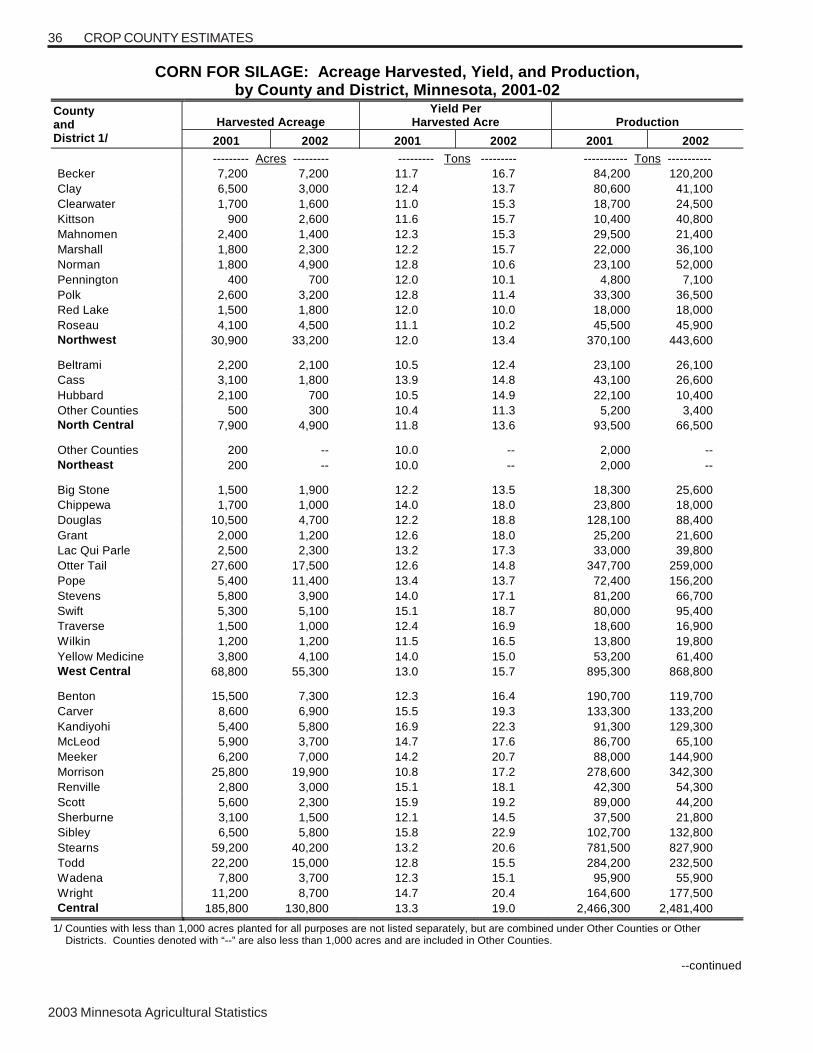
2003 Minnesota Agricultural Statistics
36 CROP COUNTY ESTIMATES
CORN FOR SILAGE: Acreage Harvested, Yield, and Production, by County and District, Minnesota, 2001-02
Harvested Acreage Yield Per
Harvested Acre Production County and District 1/ 2001 2002 2001 2002 2001 2002
--------- Acres --------- --------- Tons --------- ----------- Tons ----------- Becker 7,200 7,200 11.7 16.7 84,200 120,200 Clay 6,500 3,000 12.4 13.7 80,600 41,100 Clearwater 1,700 1,600 11.0 15.3 18,700 24,500 Kittson 900 2,600 11.6 15.7 10,400 40,800 Mahnomen 2,400 1,400 12.3 15.3 29,500 21,400 Marshall 1,800 2,300 12.2 15.7 22,000 36,100 Norman 1,800 4,900 12.8 10.6 23,100 52,000 Pennington 400 700 12.0 10.1 4,800 7,100 Polk 2,600 3,200 12.8 11.4 33,300 36,500 Red Lake 1,500 1,800 12.0 10.0 18,000 18,000 Roseau 4,100 4,500 11.1 10.2 45,500 45,900 Northwest 30,900 33,200 12.0 13.4 370,100 443,600 Beltrami 2,200 2,100 10.5 12.4 23,100 26,100 Cass 3,100 1,800 13.9 14.8 43,100 26,600 Hubbard 2,100 700 10.5 14.9 22,100 10,400 Other Counties 500 300 10.4 11.3 5,200 3,400 North Central 7,900 4,900 11.8 13.6 93,500 66,500 Other Counties 200 -- 10.0 -- 2,000 -- Northeast 200 -- 10.0 -- 2,000 -- Big Stone 1,500 1,900 12.2 13.5 18,300 25,600 Chippewa 1,700 1,000 14.0 18.0 23,800 18,000 Douglas 10,500 4,700 12.2 18.8 128,100 88,400 Grant 2,000 1,200 12.6 18.0 25,200 21,600 Lac Qui Parle 2,500 2,300 13.2 17.3 33,000 39,800 Otter Tail 27,600 17,500 12.6 14.8 347,700 259,000 Pope 5,400 11,400 13.4 13.7 72,400 156,200 Stevens 5,800 3,900 14.0 17.1 81,200 66,700 Swift 5,300 5,100 15.1 18.7 80,000 95,400 Traverse 1,500 1,000 12.4 16.9 18,600 16,900 Wilkin 1,200 1,200 11.5 16.5 13,800 19,800 Yellow Medicine 3,800 4,100 14.0 15.0 53,200 61,400 West Central 68,800 55,300 13.0 15.7 895,300 868,800 Benton 15,500 7,300 12.3 16.4 190,700 119,700 Carver 8,600 6,900 15.5 19.3 133,300 133,200 Kandiyohi 5,400 5,800 16.9 22.3 91,300 129,300 McLeod 5,900 3,700 14.7 17.6 86,700 65,100 Meeker 6,200 7,000 14.2 20.7 88,000 144,900 Morrison 25,800 19,900 10.8 17.2 278,600 342,300 Renville 2,800 3,000 15.1 18.1 42,300 54,300 Scott 5,600 2,300 15.9 19.2 89,000 44,200 Sherburne 3,100 1,500 12.1 14.5 37,500 21,800 Sibley 6,500 5,800 15.8 22.9 102,700 132,800 Stearns 59,200 40,200 13.2 20.6 781,500 827,900 Todd 22,200 15,000 12.8 15.5 284,200 232,500 Wadena 7,800 3,700 12.3 15.1 95,900 55,900 Wright 11,200 8,700 14.7 20.4 164,600 177,500 Central 185,800 130,800 13.3 19.0 2,466,300 2,481,400
1/ Counties with less than 1,000 acres planted for all purposes are not listed separately, but are combined under Other Counties or Other Districts. Counties denoted with “--” are also less than 1,000 acres and are included in Other Counties.
--continued
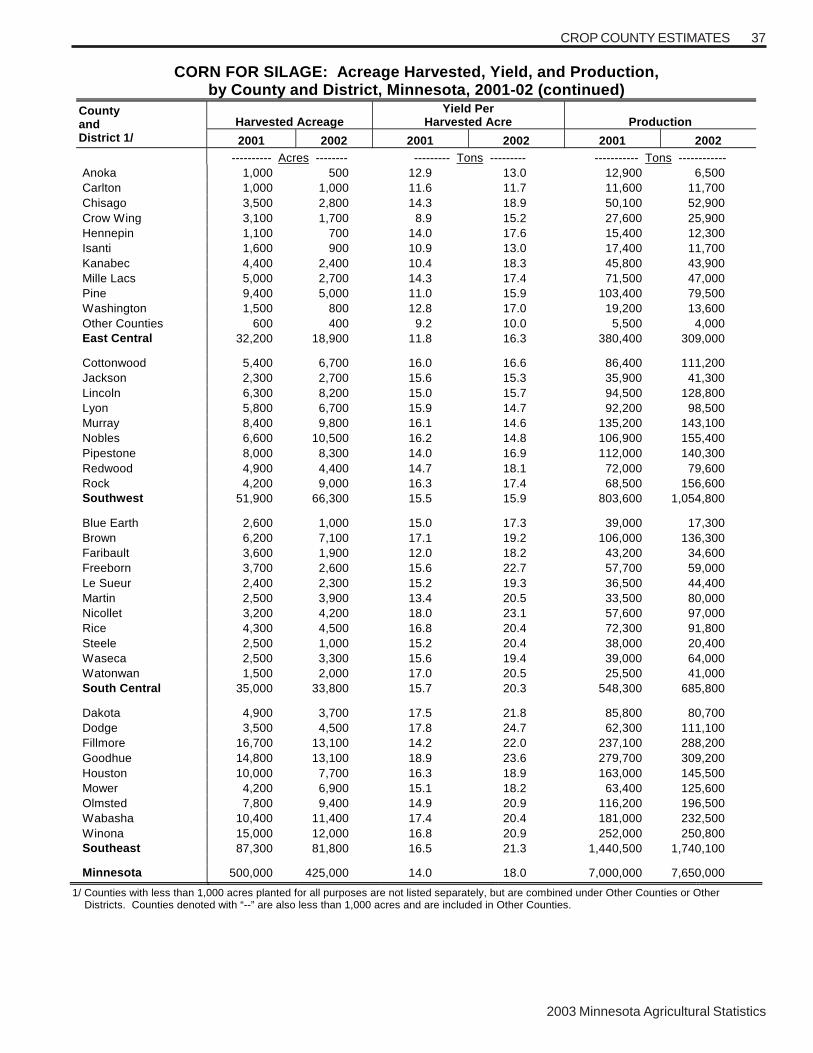
2003 Minnesota Agricultural Statistics
37CROP COUNTY ESTIMATES
CORN FOR SILAGE: Acreage Harvested, Yield, and Production, by County and District, Minnesota, 2001-02 (continued)
Harvested Acreage Yield Per
Harvested Acre Production County and District 1/ 2001 2002 2001 2002 2001 2002
---------- Acres -------- --------- Tons --------- ----------- Tons ------------ Anoka 1,000 500 12.9 13.0 12,900 6,500 Carlton 1,000 1,000 11.6 11.7 11,600 11,700 Chisago 3,500 2,800 14.3 18.9 50,100 52,900 Crow Wing 3,100 1,700 8.9 15.2 27,600 25,900 Hennepin 1,100 700 14.0 17.6 15,400 12,300 Isanti 1,600 900 10.9 13.0 17,400 11,700 Kanabec 4,400 2,400 10.4 18.3 45,800 43,900 Mille Lacs 5,000 2,700 14.3 17.4 71,500 47,000 Pine 9,400 5,000 11.0 15.9 103,400 79,500 Washington 1,500 800 12.8 17.0 19,200 13,600 Other Counties 600 400 9.2 10.0 5,500 4,000 East Central 32,200 18,900 11.8 16.3 380,400 309,000 Cottonwood 5,400 6,700 16.0 16.6 86,400 111,200 Jackson 2,300 2,700 15.6 15.3 35,900 41,300 Lincoln 6,300 8,200 15.0 15.7 94,500 128,800 Lyon 5,800 6,700 15.9 14.7 92,200 98,500 Murray 8,400 9,800 16.1 14.6 135,200 143,100 Nobles 6,600 10,500 16.2 14.8 106,900 155,400 Pipestone 8,000 8,300 14.0 16.9 112,000 140,300 Redwood 4,900 4,400 14.7 18.1 72,000 79,600 Rock 4,200 9,000 16.3 17.4 68,500 156,600 Southwest 51,900 66,300 15.5 15.9 803,600 1,054,800 Blue Earth 2,600 1,000 15.0 17.3 39,000 17,300 Brown 6,200 7,100 17.1 19.2 106,000 136,300 Faribault 3,600 1,900 12.0 18.2 43,200 34,600 Freeborn 3,700 2,600 15.6 22.7 57,700 59,000 Le Sueur 2,400 2,300 15.2 19.3 36,500 44,400 Martin 2,500 3,900 13.4 20.5 33,500 80,000 Nicollet 3,200 4,200 18.0 23.1 57,600 97,000 Rice 4,300 4,500 16.8 20.4 72,300 91,800 Steele 2,500 1,000 15.2 20.4 38,000 20,400 Waseca 2,500 3,300 15.6 19.4 39,000 64,000 Watonwan 1,500 2,000 17.0 20.5 25,500 41,000 South Central 35,000 33,800 15.7 20.3 548,300 685,800 Dakota 4,900 3,700 17.5 21.8 85,800 80,700 Dodge 3,500 4,500 17.8 24.7 62,300 111,100 Fillmore 16,700 13,100 14.2 22.0 237,100 288,200 Goodhue 14,800 13,100 18.9 23.6 279,700 309,200 Houston 10,000 7,700 16.3 18.9 163,000 145,500 Mower 4,200 6,900 15.1 18.2 63,400 125,600 Olmsted 7,800 9,400 14.9 20.9 116,200 196,500 Wabasha 10,400 11,400 17.4 20.4 181,000 232,500 Winona 15,000 12,000 16.8 20.9 252,000 250,800 Southeast 87,300 81,800 16.5 21.3 1,440,500 1,740,100 Minnesota 500,000 425,000 14.0 18.0 7,000,000 7,650,000
1/ Counties with less than 1,000 acres planted for all purposes are not listed separately, but are combined under Other Counties or Other Districts. Counties denoted with “--” are also less than 1,000 acres and are included in Other Counties.
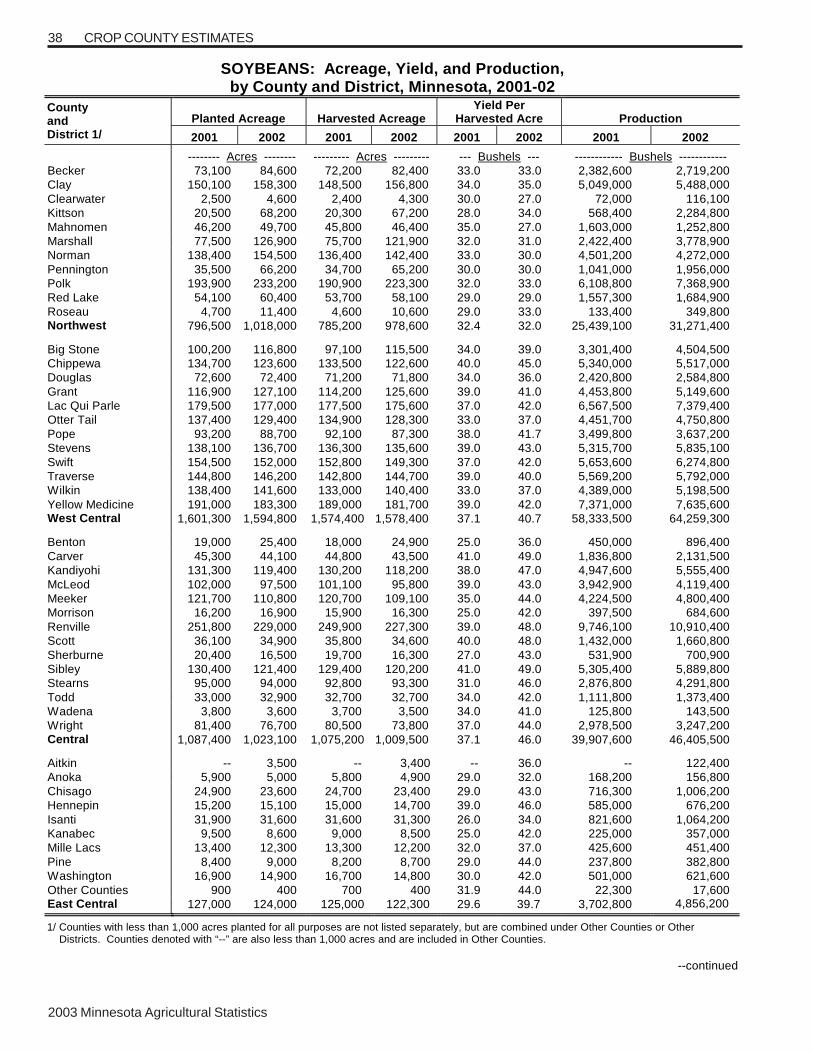
2003 Minnesota Agricultural Statistics
38 CROP COUNTY ESTIMATES
SOYBEANS: Acreage, Yield, and Production, by County and District, Minnesota, 2001-02
Planted Acreage Harvested Acreage Yield Per
Harvested Acre Production County and District 1/ 2001 2002 2001 2002 2001 2002 2001 2002
-------- Acres -------- --------- Acres --------- --- Bushels --- ------------ Bushels ------------ Becker 73,100 84,600 72,200 82,400 33.0 33.0 2,382,600 2,719,200 Clay 150,100 158,300 148,500 156,800 34.0 35.0 5,049,000 5,488,000 Clearwater 2,500 4,600 2,400 4,300 30.0 27.0 72,000 116,100 Kittson 20,500 68,200 20,300 67,200 28.0 34.0 568,400 2,284,800 Mahnomen 46,200 49,700 45,800 46,400 35.0 27.0 1,603,000 1,252,800 Marshall 77,500 126,900 75,700 121,900 32.0 31.0 2,422,400 3,778,900 Norman 138,400 154,500 136,400 142,400 33.0 30.0 4,501,200 4,272,000 Pennington 35,500 66,200 34,700 65,200 30.0 30.0 1,041,000 1,956,000 Polk 193,900 233,200 190,900 223,300 32.0 33.0 6,108,800 7,368,900 Red Lake 54,100 60,400 53,700 58,100 29.0 29.0 1,557,300 1,684,900 Roseau 4,700 11,400 4,600 10,600 29.0 33.0 133,400 349,800 Northwest 796,500 1,018,000 785,200 978,600 32.4 32.0 25,439,100 31,271,400 Big Stone 100,200 116,800 97,100 115,500 34.0 39.0 3,301,400 4,504,500 Chippewa 134,700 123,600 133,500 122,600 40.0 45.0 5,340,000 5,517,000 Douglas 72,600 72,400 71,200 71,800 34.0 36.0 2,420,800 2,584,800 Grant 116,900 127,100 114,200 125,600 39.0 41.0 4,453,800 5,149,600 Lac Qui Parle 179,500 177,000 177,500 175,600 37.0 42.0 6,567,500 7,379,400 Otter Tail 137,400 129,400 134,900 128,300 33.0 37.0 4,451,700 4,750,800 Pope 93,200 88,700 92,100 87,300 38.0 41.7 3,499,800 3,637,200 Stevens 138,100 136,700 136,300 135,600 39.0 43.0 5,315,700 5,835,100 Swift 154,500 152,000 152,800 149,300 37.0 42.0 5,653,600 6,274,800 Traverse 144,800 146,200 142,800 144,700 39.0 40.0 5,569,200 5,792,000 Wilkin 138,400 141,600 133,000 140,400 33.0 37.0 4,389,000 5,198,500 Yellow Medicine 191,000 183,300 189,000 181,700 39.0 42.0 7,371,000 7,635,600 West Central 1,601,300 1,594,800 1,574,400 1,578,400 37.1 40.7 58,333,500 64,259,300 Benton 19,000 25,400 18,000 24,900 25.0 36.0 450,000 896,400 Carver 45,300 44,100 44,800 43,500 41.0 49.0 1,836,800 2,131,500 Kandiyohi 131,300 119,400 130,200 118,200 38.0 47.0 4,947,600 5,555,400 McLeod 102,000 97,500 101,100 95,800 39.0 43.0 3,942,900 4,119,400 Meeker 121,700 110,800 120,700 109,100 35.0 44.0 4,224,500 4,800,400 Morrison 16,200 16,900 15,900 16,300 25.0 42.0 397,500 684,600 Renville 251,800 229,000 249,900 227,300 39.0 48.0 9,746,100 10,910,400 Scott 36,100 34,900 35,800 34,600 40.0 48.0 1,432,000 1,660,800 Sherburne 20,400 16,500 19,700 16,300 27.0 43.0 531,900 700,900 Sibley 130,400 121,400 129,400 120,200 41.0 49.0 5,305,400 5,889,800 Stearns 95,000 94,000 92,800 93,300 31.0 46.0 2,876,800 4,291,800 Todd 33,000 32,900 32,700 32,700 34.0 42.0 1,111,800 1,373,400 Wadena 3,800 3,600 3,700 3,500 34.0 41.0 125,800 143,500 Wright 81,400 76,700 80,500 73,800 37.0 44.0 2,978,500 3,247,200 Central 1,087,400 1,023,100 1,075,200 1,009,500 37.1 46.0 39,907,600 46,405,500 Aitkin -- 3,500 -- 3,400 -- 36.0 -- 122,400 Anoka 5,900 5,000 5,800 4,900 29.0 32.0 168,200 156,800 Chisago 24,900 23,600 24,700 23,400 29.0 43.0 716,300 1,006,200 Hennepin 15,200 15,100 15,000 14,700 39.0 46.0 585,000 676,200 Isanti 31,900 31,600 31,600 31,300 26.0 34.0 821,600 1,064,200 Kanabec 9,500 8,600 9,000 8,500 25.0 42.0 225,000 357,000 Mille Lacs 13,400 12,300 13,300 12,200 32.0 37.0 425,600 451,400 Pine 8,400 9,000 8,200 8,700 29.0 44.0 237,800 382,800 Washington 16,900 14,900 16,700 14,800 30.0 42.0 501,000 621,600 Other Counties 900 400 700 400 31.9 44.0 22,300 17,600 East Central 127,000 124,000 125,000 122,300 29.6 39.7 3,702,800 4,856,200
1/ Counties with less than 1,000 acres planted for all purposes are not listed separately, but are combined under Other Counties or Other Districts. Counties denoted with “--” are also less than 1,000 acres and are included in Other Counties.
--continued

2003 Minnesota Agricultural Statistics
39
SOYBEANS: Acreage, Yield, and Production, by County and District, Minnesota, 2001-02 (continued)
Planted Acreage Harvested Acreage Yield Per
Harvested Acre Production County and District 1/ 2001 2002 2001 2002 2001 2002 2001 2002
---------- Acres --------- ---------- Acres --------- ---- Bushels ---- ------------ Bushels ----------- Cottonwood 169,300 159,900 167,800 158,600 38.0 47.0 6,376,400 7,454,200 Jackson 182,300 169,400 177,300 168,100 36.0 46.0 6,382,800 7,732,600 Lincoln 100,500 99,500 99,700 98,700 36.0 40.0 3,589,200 3,948,000 Lyon 173,700 168,700 172,300 167,400 40.0 43.0 6,892,000 7,198,200 Murray 178,400 167,900 176,700 166,500 39.0 44.0 6,891,300 7,326,000 Nobles 196,000 187,200 194,000 185,700 38.0 44.0 7,372,000 8,170,800 Pipestone 103,400 94,800 102,500 93,300 39.0 43.0 3,997,500 4,011,900 Redwood 227,900 224,000 225,900 222,300 38.0 45.0 8,584,200 10,003,500 Rock 127,200 121,000 126,200 120,100 43.0 44.0 5,426,600 5,284,400 Southwest 1,458,700 1,392,400 1,442,400 1,380,700 38.5 44.3 55,512,000 61,129,600 Blue Earth 184,200 169,200 181,000 168,000 38.0 49.0 6,878,000 8,232,000 Brown 142,300 136,300 141,000 135,300 42.0 45.0 5,922,000 6,088,500 Faribault 192,000 168,500 186,100 167,100 35.0 50.0 6,513,500 8,355,000 Freeborn 169,900 156,000 167,500 154,800 37.0 51.0 6,197,500 7,894,800 Le Sueur 86,800 85,100 85,900 84,400 41.0 48.0 3,521,900 4,051,200 Martin 199,600 184,400 195,300 183,000 35.0 50.0 6,835,500 9,150,000 Nicollet 105,000 97,500 104,100 96,200 42.0 46.0 4,372,200 4,425,200 Rice 69,800 67,500 69,300 67,000 41.0 50.0 2,841,300 3,350,000 Steele 101,400 87,000 100,000 86,400 40.0 50.0 4,000,000 4,320,000 Waseca 107,400 97,000 106,200 96,200 41.0 52.0 4,354,200 5,002,400 Watonwan 116,600 114,000 115,700 113,100 39.0 46.0 4,512,300 5,202,600 South Central 1,475,000 1,362,500 1,452,100 1,351,500 38.5 48.9 55,948,400 66,071,700 Dakota 73,100 68,400 72,600 67,700 34.0 47.0 2,468,400 3,181,900 Dodge 100,100 92,500 99,100 91,600 42.0 52.0 4,162,200 4,763,200 Fillmore 107,300 97,500 106,100 96,800 34.0 51.0 3,607,400 4,936,800 Goodhue 105,700 92,800 105,000 91,600 39.0 50.0 4,095,000 4,580,000 Houston 28,900 25,300 27,800 25,100 33.0 48.0 917,400 1,204,800 Mower 181,400 165,900 179,800 164,700 37.0 53.0 6,652,600 8,729,100 Olmsted 79,700 73,500 78,300 73,000 38.0 52.0 2,975,400 3,796,000 Wabasha 40,000 35,400 39,600 35,000 35.0 56.0 1,386,000 1,960,000 Winona 29,700 26,600 29,500 26,400 36.0 54.0 1,062,000 1,425,600 Southeast 745,900 677,900 737,800 671,900 37.0 51.5 27,326,400 34,577,400 Other Districts 8,200 7,300 7,900 7,100 29.1 39.3 230,200 278,900 Minnesota 7,300,000 7,200,000 7,200,000 7,100,000 37.0 43.5 266,400,000 308,850,000 1/ Counties with less than 1,000 acres planted for all purposes are not listed separately, but are combined under Other Counties or Other Districts. Counties denoted with “--” are also less than 1,000 acres and are included in Other Counties.
CROP COUNTY ESTIMATES

2003 Minnesota Agricultural Statistics
40 CROP COUNTY ESTIMATES
ALL WHEAT: Acreage, Yield, and Production, by County and District, Minnesota, 2001-02
Planted Acreage Harvested Acreage Yield Per
Harvested Acre Production County and District 1/ 2001 2002 2001 2002 2001 2002 2001 2002
---------- Acres -------- --------- Acres ---------- -- Bushels -- ------------ Bushels ----------- Becker 68,100 61,800 66,400 58,600 45.0 33.0 2,985,200 1,932,000 Clay 170,100 164,300 165,200 156,800 48.0 40.0 7,925,700 6,267,000 Clearwater 3,700 7,100 3,600 6,200 39.0 29.5 139,800 183,200 Kittson 106,600 171,000 103,300 159,500 32.0 35.0 3,304,700 5,577,000 Mahnomen 42,100 39,300 41,100 33,500 45.0 25.0 1,849,500 839,100 Marshall 193,600 247,900 188,400 225,300 39.0 32.0 7,336,900 7,213,600 Norman 181,700 177,100 176,900 148,300 46.0 26.0 8,131,000 3,854,200 Pennington 62,700 74,700 60,700 69,500 38.0 24.3 2,289,700 1,686,200 Polk 348,300 331,300 339,200 302,400 45.0 35.0 15,256,100 10,581,600 Red Lake 53,800 57,500 52,300 52,000 42.0 30.1 2,189,000 1,563,900 Roseau 89,500 139,200 86,800 84,300 36.0 21.9 3,108,300 1,844,200 Northwest 1,320,200 1,471,200 1,283,900 1,296,400 43.0 32.0 54,515,900 41,542,000 Beltrami 5,200 7,200 5,000 6,600 39.0 26.0 193,700 171,600 Koochiching 1,000 1,700 900 1,300 35.0 26.0 31,500 33,800 Lake of the Woods 14,000 13,100 13,400 8,900 35.0 21.9 464,500 195,200 Other Counties 1,100 1,700 1,000 1,500 38.0 24.1 38,000 36,200 North Central 21,300 23,700 20,300 18,300 36.0 23.9 727,700 436,800 Other Counties 100 200 100 200 32.0 32.0 3,200 6,400 Northeast 100 200 100 200 32.0 32.0 3,200 6,400 Big Stone 30,400 36,400 29,600 35,000 52.0 43.9 1,539,200 1,535,400 Chippewa 2,500 2,900 2,400 2,800 53.0 36.0 127,200 100,800 Douglas 18,600 19,600 18,200 18,700 44.0 36.0 799,700 672,400 Grant 56,500 44,600 55,000 42,800 53.0 44.0 2,915,000 1,883,200 Lac Qui Parle 11,100 14,100 10,800 13,600 49.0 40.1 526,000 545,200 Otter Tail 67,200 72,700 65,500 68,100 49.0 34.0 3,207,900 2,313,900 Pope 12,600 13,600 12,200 13,000 45.0 36.0 546,600 467,500 Stevens 24,300 24,700 23,700 23,500 58.0 44.0 1,374,600 1,034,000 Swift 7,200 8,400 7,000 8,100 49.0 40.9 341,400 331,600 Traverse 50,400 48,400 48,700 46,500 51.0 45.0 2,483,700 2,091,300 Wilkin 161,000 148,900 156,900 143,300 44.0 39.0 6,902,500 5,588,300 Yellow Medicine 8,100 12,600 7,900 12,100 57.0 38.0 450,300 459,400 West Central 449,900 446,900 437,900 427,500 48.0 39.8 21,214,100 17,023,000 Benton -- 1,000 -- 800 -- 31.9 -- 25,500 Carver 1,700 2,100 1,600 1,900 43.0 31.9 68,000 60,600 Kandiyohi 4,700 6,900 4,600 6,500 45.0 33.0 207,000 214,500 McLeod 2,500 4,500 2,400 4,300 49.0 38.3 117,000 164,500 Meeker 4,700 6,500 4,600 5,900 41.0 32.6 187,400 192,400 Morrison -- 1,000 -- 900 -- 30.6 -- 27,500 Renville 4,400 5,500 4,300 5,300 55.0 36.9 236,500 195,700 Scott 1,200 -- 1,200 -- 41.0 -- 48,600 -- Sibley 1,800 2,400 1,700 2,200 47.0 41.5 79,700 91,200 Stearns 5,200 7,700 4,900 7,300 39.0 33.9 191,100 247,800 Todd 6,200 7,500 6,100 7,000 34.0 27.1 208,400 189,700 Wright 2,700 3,800 2,600 3,200 37.0 32.4 97,000 103,700 Other Counties 2,600 2,000 2,500 1,900 35.0 33.6 87,700 63,800 Central 37,700 50,900 36,500 47,200 42.0 33.4 1,528,400 1,576,900
1/ Counties with less than 1,000 acres planted for all purposes are not listed separately, but are combined under Other Counties or Other Districts. Counties denoted with “--” are also less than 1,000 acres and are included in Other Counties.
--continued

2003 Minnesota Agricultural Statistics
41
ALL WHEAT: Acreage, Yield, and Production, by County and District, Minnesota, 2001-02 (continued)
Planted Acreage Harvested Acreage Yield Per
Harvested Acre Production County and District 1/ 2001 2002 2001 2002 2001 2002 2001 2002
--------- Acres ---------- --------- Acres --------- -- Bushels -- ------------ Bushels ----------- Anoka 1,600 -- 1,400 -- 38.0 -- 53,200 -- Isanti -- 1,200 -- 1,000 -- 26.4 -- 26,400 Kanabec 1,400 2,300 1,400 2,200 36.0 29.8 51,000 65,500 Other Counties 2,500 2,900 2,500 2,500 35.0 31.6 86,600 79,100 East Central 5,500 6,400 5,300 5,700 36.0 30.0 190,800 171,000 Cottonwood 1,100 2,300 1,000 2,200 47.0 33.6 47,000 73,900 Lincoln 10,300 11,200 10,200 10,900 49.0 42.0 497,300 457,600 Lyon 3,500 4,600 3,400 4,500 49.0 33.0 166,600 148,500 Redwood 2,300 3,500 2,200 3,300 56.0 35.0 123,200 115,500 Other Counties 2,700 3,000 2,500 2,900 45.0 34.7 113,200 100,500 Southwest 19,900 24,600 19,300 23,800 49.0 37.6 947,300 896,000 Brown 1,700 3,000 1,600 2,800 46.0 36.6 73,400 102,400 Le Sueur 1,900 2,200 1,700 2,000 43.0 46.0 73,800 92,000 Other Counties 3,800 5,500 3,700 5,100 49.0 39.6 181,200 202,200 South Central 7,400 10,700 7,000 9,900 47.0 40.1 328,400 396,600 Dakota 2,000 1,600 1,900 1,500 40.0 36.8 75,500 55,200 Goodhue -- 1,000 -- 1,000 -- 41.6 -- 41,600 Other Counties 3,000 2,800 2,800 2,500 44.0 37.8 123,700 94,500 Southeast 5,000 5,400 4,700 5,000 42.0 38.3 199,200 191,300 Minnesota 1,867,000 2,040,000 1,815,000 1,834,000 43.9 33.9 79,655,000 62,240,000 1/ Counties with less than 1,000 acres planted for all purposes are not listed separately, but are combined under Other Counties or Other
Districts. Counties denoted with “--” are also less than 1,000 acres and are included in Other Counties.
CROP COUNTY ESTIMATES

2003 Minnesota Agricultural Statistics
42 CROP COUNTY ESTIMATES
SPRING WHEAT: Acreage, Yield, and Production, by County and District, Minnesota, 2001-02
Planted Acreage Harvested Acreage Yield Per
Harvested Acre Production County and District 1/ 2001 2002 2001 2002 2001 2002 2001 2002
--------- Acres --------- --------- Acres --------- -- Bushels -- ------------- Bushels ------------ Becker 68,000 61,500 66,300 58,300 45.0 33.0 2,983,500 1,923,900 Clay 169,700 163,800 164,800 156,300 48.0 40.0 7,910,400 6,252,000 Clearwater 3,500 5,200 3,400 4,400 40.0 31.0 136,000 136,400 Kittson 106,400 169,400 103,200 158,400 32.0 35.0 3,302,400 5,544,000 Mahnomen 42,100 38,400 41,100 32,700 45.0 25.0 1,849,500 817,500 Marshall 191,500 243,000 186,700 220,900 39.0 32.0 7,281,300 7,068,800 Norman 181,200 176,000 176,500 147,700 46.0 26.0 8,119,000 3,840,200 Pennington 61,300 72,000 59,400 66,900 38.0 24.0 2,257,200 1,605,600 Polk 347,100 326,600 338,300 297,900 45.0 35.0 15,223,500 10,426,500 Red Lake 53,200 56,100 51,900 50,700 42.0 30.0 2,179,800 1,521,000 Roseau 87,800 131,500 85,300 79,100 36.0 22.0 3,070,800 1,740,200 Northwest 1,311,800 1,443,500 1,276,900 1,273,300 43.0 32.1 54,313,400 40,876,100 Beltrami 5,100 6,800 4,900 6,300 39.0 26.0 191,100 163,800 Koochiching 1,000 1,700 900 1,300 35.0 26.0 31,500 33,800 Lake of the Woods 13,500 12,600 12,900 8,600 35.0 22.0 451,500 189,200 Other Counties 1,100 1,700 1,000 1,500 38.0 24.1 38,000 36,200 North Central 20,700 22,800 19,700 17,700 36.0 23.9 712,100 423,000 Other Counties 100 200 100 200 32.0 32.0 3,200 6,400 Northeast 100 200 100 200 32.0 32.0 3,200 6,400 Big Stone 30,400 35,400 29,600 34,100 52.0 44.0 1,539,200 1,500,400 Chippewa 2,500 2,900 2,400 2,800 53.0 36.0 127,200 100,800 Douglas 18,500 19,400 18,100 18,500 44.0 36.0 796,400 666,000 Grant 56,500 44,600 55,000 42,800 53.0 44.0 2,915,000 1,883,200 Lac Qui Parle 10,900 13,700 10,600 13,200 49.0 40.0 519,400 528,000 Otter Tail 67,000 72,100 65,400 67,600 49.0 34.0 3,204,600 2,298,400 Pope 12,400 13,000 12,000 12,500 45.0 36.0 540,000 450,000 Stevens 24,300 24,700 23,700 23,500 58.0 44.0 1,374,600 1,034,000 Swift 7,100 8,300 6,900 8,000 49.0 41.0 338,100 328,000 Traverse 50,400 48,200 48,700 46,300 51.0 45.0 2,483,700 2,083,500 Wilkin 160,900 148,800 156,800 143,200 44.0 39.0 6,899,200 5,584,800 Yellow Medicine 8,100 12,500 7,900 12,000 57.0 38.0 450,300 456,000 West Central 449,000 443,600 437,100 424,500 49.0 39.8 21,187,700 16,913,100 Carver 1,300 1,600 1,200 1,400 45.0 29.0 54,000 40,600 Kandiyohi 4,700 6,900 4,600 6,500 45.0 33.0 207,000 214,500 McLeod 2,200 3,800 2,100 3,700 51.0 37.0 107,100 136,900 Meeker 4,400 6,200 4,300 5,600 41.0 32.0 176,300 179,200 Renville 4,400 5,400 4,300 5,200 55.0 37.0 236,500 192,400 Sibley 1,500 2,000 1,400 1,800 49.0 42.0 68,600 75,600 Stearns 5,100 7,600 4,900 7,200 39.0 34.0 191,100 244,800 Todd 5,400 6,700 5,300 6,300 36.0 28.0 190,800 176,400 Wright 2,500 3,500 2,400 2,900 37.0 31.0 88,800 89,900 Other Counties 3,000 3,300 2,900 2,900 39.0 34.2 112,000 99,300 Central 34,500 47,000 33,400 43,500 43.0 33.3 1,432,200 1,449,600 1/ Counties with less than 1,000 acres planted for all purposes are not listed separately, but are combined under Other Counties or Other Districts. Counties denoted with “--” are also less than 1,000 acres and are included in Other Counties.
--continued
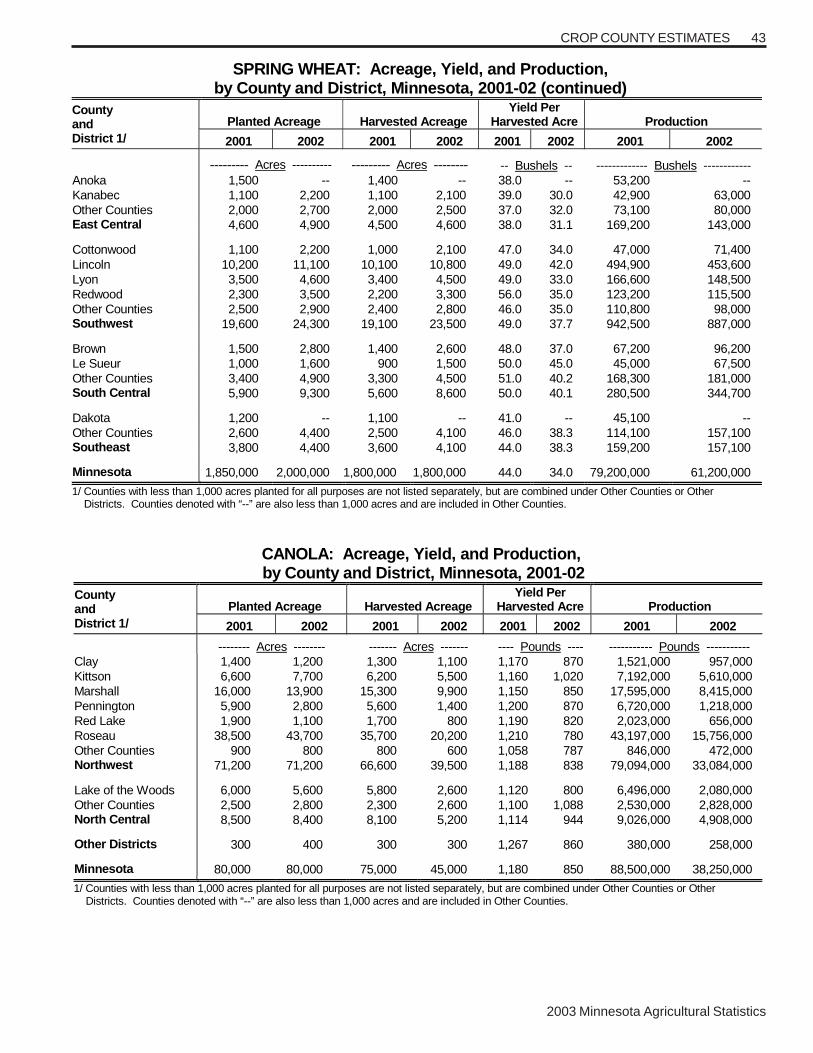
2003 Minnesota Agricultural Statistics
43CROP COUNTY ESTIMATES
SPRING WHEAT: Acreage, Yield, and Production, by County and District, Minnesota, 2001-02 (continued)
Planted Acreage Harvested Acreage Yield Per
Harvested Acre Production County and District 1/ 2001 2002 2001 2002 2001 2002 2001 2002
--------- Acres ---------- --------- Acres -------- -- Bushels -- ------------- Bushels ------------ Anoka 1,500 -- 1,400 -- 38.0 -- 53,200 -- Kanabec 1,100 2,200 1,100 2,100 39.0 30.0 42,900 63,000 Other Counties 2,000 2,700 2,000 2,500 37.0 32.0 73,100 80,000 East Central 4,600 4,900 4,500 4,600 38.0 31.1 169,200 143,000 Cottonwood 1,100 2,200 1,000 2,100 47.0 34.0 47,000 71,400 Lincoln 10,200 11,100 10,100 10,800 49.0 42.0 494,900 453,600 Lyon 3,500 4,600 3,400 4,500 49.0 33.0 166,600 148,500 Redwood 2,300 3,500 2,200 3,300 56.0 35.0 123,200 115,500 Other Counties 2,500 2,900 2,400 2,800 46.0 35.0 110,800 98,000 Southwest 19,600 24,300 19,100 23,500 49.0 37.7 942,500 887,000 Brown 1,500 2,800 1,400 2,600 48.0 37.0 67,200 96,200 Le Sueur 1,000 1,600 900 1,500 50.0 45.0 45,000 67,500 Other Counties 3,400 4,900 3,300 4,500 51.0 40.2 168,300 181,000 South Central 5,900 9,300 5,600 8,600 50.0 40.1 280,500 344,700 Dakota 1,200 -- 1,100 -- 41.0 -- 45,100 -- Other Counties 2,600 4,400 2,500 4,100 46.0 38.3 114,100 157,100 Southeast 3,800 4,400 3,600 4,100 44.0 38.3 159,200 157,100 Minnesota 1,850,000 2,000,000 1,800,000 1,800,000 44.0 34.0 79,200,000 61,200,000
1/ Counties with less than 1,000 acres planted for all purposes are not listed separately, but are combined under Other Counties or Other Districts. Counties denoted with “--” are also less than 1,000 acres and are included in Other Counties.
CANOLA: Acreage, Yield, and Production, by County and District, Minnesota, 2001-02
Planted Acreage Harvested Acreage Yield Per
Harvested Acre Production County and District 1/ 2001 2002 2001 2002 2001 2002 2001 2002
-------- Acres -------- ------- Acres ------- ---- Pounds ---- ----------- Pounds ----------- Clay 1,400 1,200 1,300 1,100 1,170 870 1,521,000 957,000 Kittson 6,600 7,700 6,200 5,500 1,160 1,020 7,192,000 5,610,000 Marshall 16,000 13,900 15,300 9,900 1,150 850 17,595,000 8,415,000 Pennington 5,900 2,800 5,600 1,400 1,200 870 6,720,000 1,218,000 Red Lake 1,900 1,100 1,700 800 1,190 820 2,023,000 656,000 Roseau 38,500 43,700 35,700 20,200 1,210 780 43,197,000 15,756,000 Other Counties 900 800 800 600 1,058 787 846,000 472,000 Northwest 71,200 71,200 66,600 39,500 1,188 838 79,094,000 33,084,000 Lake of the Woods 6,000 5,600 5,800 2,600 1,120 800 6,496,000 2,080,000 Other Counties 2,500 2,800 2,300 2,600 1,100 1,088 2,530,000 2,828,000 North Central 8,500 8,400 8,100 5,200 1,114 944 9,026,000 4,908,000 Other Districts 300 400 300 300 1,267 860 380,000 258,000 Minnesota 80,000 80,000 75,000 45,000 1,180 850 88,500,000 38,250,000
1/ Counties with less than 1,000 acres planted for all purposes are not listed separately, but are combined under Other Counties or Other Districts. Counties denoted with “--” are also less than 1,000 acres and are included in Other Counties.
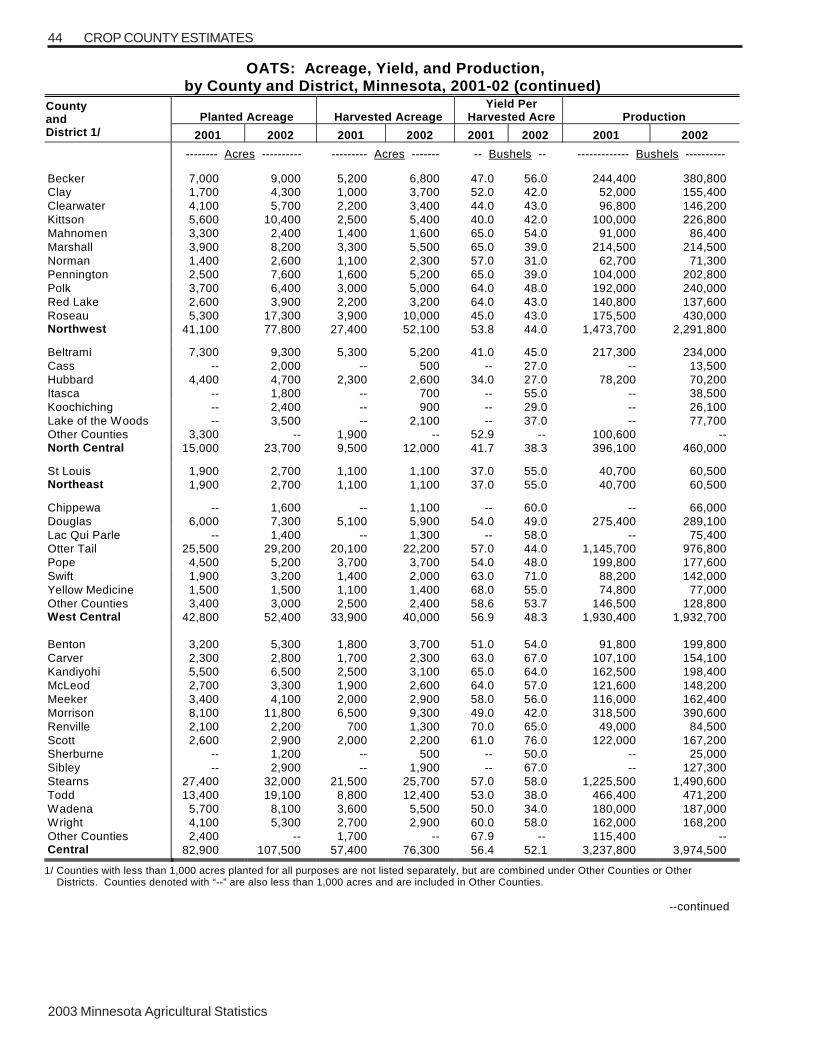
2003 Minnesota Agricultural Statistics
44 CROP COUNTY ESTIMATES
OATS: Acreage, Yield, and Production, by County and District, Minnesota, 2001-02 (continued)
Planted Acreage Harvested Acreage Yield Per
Harvested Acre Production County and District 1/ 2001 2002 2001 2002 2001 2002 2001 2002
-------- Acres ---------- --------- Acres ------- -- Bushels -- ------------- Bushels ----------
Becker 7,000 9,000 5,200 6,800 47.0 56.0 244,400 380,800 Clay 1,700 4,300 1,000 3,700 52.0 42.0 52,000 155,400 Clearwater 4,100 5,700 2,200 3,400 44.0 43.0 96,800 146,200 Kittson 5,600 10,400 2,500 5,400 40.0 42.0 100,000 226,800 Mahnomen 3,300 2,400 1,400 1,600 65.0 54.0 91,000 86,400 Marshall 3,900 8,200 3,300 5,500 65.0 39.0 214,500 214,500 Norman 1,400 2,600 1,100 2,300 57.0 31.0 62,700 71,300 Pennington 2,500 7,600 1,600 5,200 65.0 39.0 104,000 202,800 Polk 3,700 6,400 3,000 5,000 64.0 48.0 192,000 240,000 Red Lake 2,600 3,900 2,200 3,200 64.0 43.0 140,800 137,600 Roseau 5,300 17,300 3,900 10,000 45.0 43.0 175,500 430,000 Northwest 41,100 77,800 27,400 52,100 53.8 44.0 1,473,700 2,291,800 Beltrami 7,300 9,300 5,300 5,200 41.0 45.0 217,300 234,000 Cass -- 2,000 -- 500 -- 27.0 -- 13,500 Hubbard 4,400 4,700 2,300 2,600 34.0 27.0 78,200 70,200 Itasca -- 1,800 -- 700 -- 55.0 -- 38,500 Koochiching -- 2,400 -- 900 -- 29.0 -- 26,100 Lake of the Woods -- 3,500 -- 2,100 -- 37.0 -- 77,700 Other Counties 3,300 -- 1,900 -- 52.9 -- 100,600 -- North Central 15,000 23,700 9,500 12,000 41.7 38.3 396,100 460,000 St Louis 1,900 2,700 1,100 1,100 37.0 55.0 40,700 60,500 Northeast 1,900 2,700 1,100 1,100 37.0 55.0 40,700 60,500 Chippewa -- 1,600 -- 1,100 -- 60.0 -- 66,000 Douglas 6,000 7,300 5,100 5,900 54.0 49.0 275,400 289,100 Lac Qui Parle -- 1,400 -- 1,300 -- 58.0 -- 75,400 Otter Tail 25,500 29,200 20,100 22,200 57.0 44.0 1,145,700 976,800 Pope 4,500 5,200 3,700 3,700 54.0 48.0 199,800 177,600 Swift 1,900 3,200 1,400 2,000 63.0 71.0 88,200 142,000 Yellow Medicine 1,500 1,500 1,100 1,400 68.0 55.0 74,800 77,000 Other Counties 3,400 3,000 2,500 2,400 58.6 53.7 146,500 128,800 West Central 42,800 52,400 33,900 40,000 56.9 48.3 1,930,400 1,932,700 Benton 3,200 5,300 1,800 3,700 51.0 54.0 91,800 199,800 Carver 2,300 2,800 1,700 2,300 63.0 67.0 107,100 154,100 Kandiyohi 5,500 6,500 2,500 3,100 65.0 64.0 162,500 198,400 McLeod 2,700 3,300 1,900 2,600 64.0 57.0 121,600 148,200 Meeker 3,400 4,100 2,000 2,900 58.0 56.0 116,000 162,400 Morrison 8,100 11,800 6,500 9,300 49.0 42.0 318,500 390,600 Renville 2,100 2,200 700 1,300 70.0 65.0 49,000 84,500 Scott 2,600 2,900 2,000 2,200 61.0 76.0 122,000 167,200 Sherburne -- 1,200 -- 500 -- 50.0 -- 25,000 Sibley -- 2,900 -- 1,900 -- 67.0 -- 127,300 Stearns 27,400 32,000 21,500 25,700 57.0 58.0 1,225,500 1,490,600 Todd 13,400 19,100 8,800 12,400 53.0 38.0 466,400 471,200 Wadena 5,700 8,100 3,600 5,500 50.0 34.0 180,000 187,000 Wright 4,100 5,300 2,700 2,900 60.0 58.0 162,000 168,200 Other Counties 2,400 -- 1,700 -- 67.9 -- 115,400 -- Central 82,900 107,500 57,400 76,300 56.4 52.1 3,237,800 3,974,500 1/ Counties with less than 1,000 acres planted for all purposes are not listed separately, but are combined under Other Counties or Other Districts. Counties denoted with “--” are also less than 1,000 acres and are included in Other Counties.
--continued
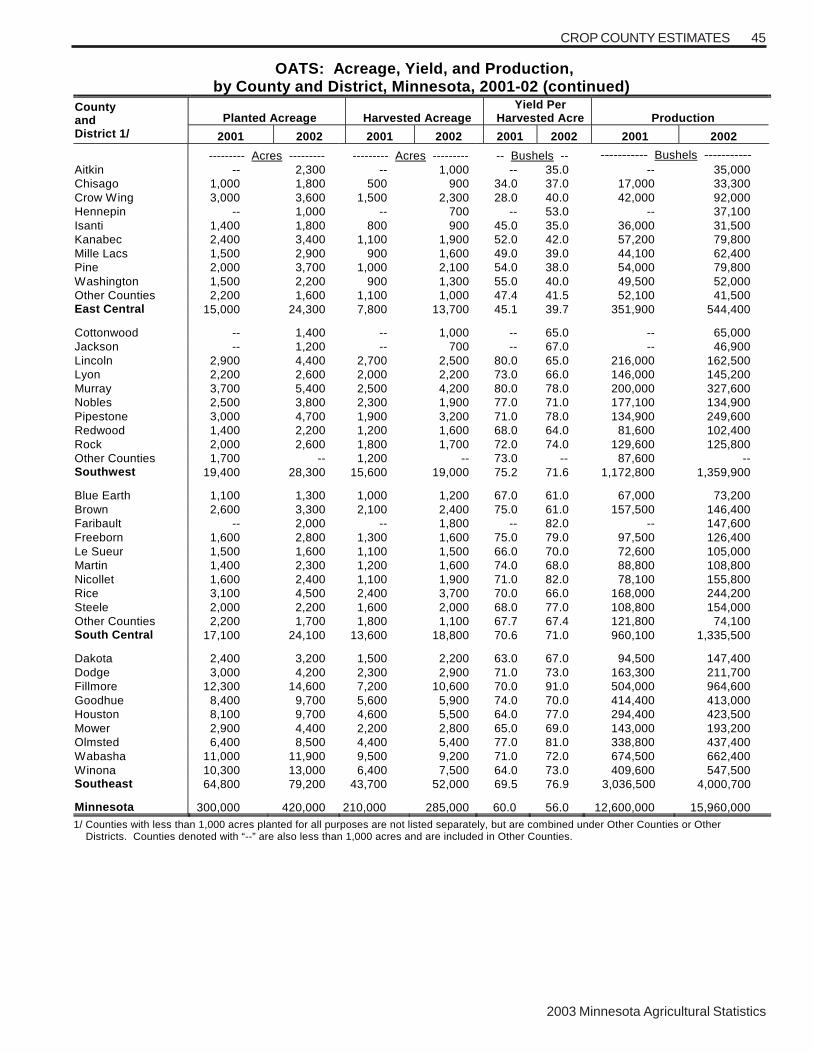
2003 Minnesota Agricultural Statistics
45CROP COUNTY ESTIMATES
OATS: Acreage, Yield, and Production, by County and District, Minnesota, 2001-02 (continued)
Planted Acreage Harvested Acreage Yield Per
Harvested Acre Production County and District 1/ 2001 2002 2001 2002 2001 2002 2001 2002
--------- Acres --------- --------- Acres --------- -- Bushels -- ----------- Bushels ----------- Aitkin -- 2,300 -- 1,000 -- 35.0 -- 35,000 Chisago 1,000 1,800 500 900 34.0 37.0 17,000 33,300 Crow Wing 3,000 3,600 1,500 2,300 28.0 40.0 42,000 92,000 Hennepin -- 1,000 -- 700 -- 53.0 -- 37,100 Isanti 1,400 1,800 800 900 45.0 35.0 36,000 31,500 Kanabec 2,400 3,400 1,100 1,900 52.0 42.0 57,200 79,800 Mille Lacs 1,500 2,900 900 1,600 49.0 39.0 44,100 62,400 Pine 2,000 3,700 1,000 2,100 54.0 38.0 54,000 79,800 Washington 1,500 2,200 900 1,300 55.0 40.0 49,500 52,000 Other Counties 2,200 1,600 1,100 1,000 47.4 41.5 52,100 41,500 East Central 15,000 24,300 7,800 13,700 45.1 39.7 351,900 544,400 Cottonwood -- 1,400 -- 1,000 -- 65.0 -- 65,000 Jackson -- 1,200 -- 700 -- 67.0 -- 46,900 Lincoln 2,900 4,400 2,700 2,500 80.0 65.0 216,000 162,500 Lyon 2,200 2,600 2,000 2,200 73.0 66.0 146,000 145,200 Murray 3,700 5,400 2,500 4,200 80.0 78.0 200,000 327,600 Nobles 2,500 3,800 2,300 1,900 77.0 71.0 177,100 134,900 Pipestone 3,000 4,700 1,900 3,200 71.0 78.0 134,900 249,600 Redwood 1,400 2,200 1,200 1,600 68.0 64.0 81,600 102,400 Rock 2,000 2,600 1,800 1,700 72.0 74.0 129,600 125,800 Other Counties 1,700 -- 1,200 -- 73.0 -- 87,600 -- Southwest 19,400 28,300 15,600 19,000 75.2 71.6 1,172,800 1,359,900 Blue Earth 1,100 1,300 1,000 1,200 67.0 61.0 67,000 73,200 Brown 2,600 3,300 2,100 2,400 75.0 61.0 157,500 146,400 Faribault -- 2,000 -- 1,800 -- 82.0 -- 147,600 Freeborn 1,600 2,800 1,300 1,600 75.0 79.0 97,500 126,400 Le Sueur 1,500 1,600 1,100 1,500 66.0 70.0 72,600 105,000 Martin 1,400 2,300 1,200 1,600 74.0 68.0 88,800 108,800 Nicollet 1,600 2,400 1,100 1,900 71.0 82.0 78,100 155,800 Rice 3,100 4,500 2,400 3,700 70.0 66.0 168,000 244,200 Steele 2,000 2,200 1,600 2,000 68.0 77.0 108,800 154,000 Other Counties 2,200 1,700 1,800 1,100 67.7 67.4 121,800 74,100 South Central 17,100 24,100 13,600 18,800 70.6 71.0 960,100 1,335,500 Dakota 2,400 3,200 1,500 2,200 63.0 67.0 94,500 147,400 Dodge 3,000 4,200 2,300 2,900 71.0 73.0 163,300 211,700 Fillmore 12,300 14,600 7,200 10,600 70.0 91.0 504,000 964,600 Goodhue 8,400 9,700 5,600 5,900 74.0 70.0 414,400 413,000 Houston 8,100 9,700 4,600 5,500 64.0 77.0 294,400 423,500 Mower 2,900 4,400 2,200 2,800 65.0 69.0 143,000 193,200 Olmsted 6,400 8,500 4,400 5,400 77.0 81.0 338,800 437,400 Wabasha 11,000 11,900 9,500 9,200 71.0 72.0 674,500 662,400 Winona 10,300 13,000 6,400 7,500 64.0 73.0 409,600 547,500 Southeast 64,800 79,200 43,700 52,000 69.5 76.9 3,036,500 4,000,700 Minnesota 300,000 420,000 210,000 285,000 60.0 56.0 12,600,000 15,960,000 1/ Counties with less than 1,000 acres planted for all purposes are not listed separately, but are combined under Other Counties or Other Districts. Counties denoted with “--” are also less than 1,000 acres and are included in Other Counties.
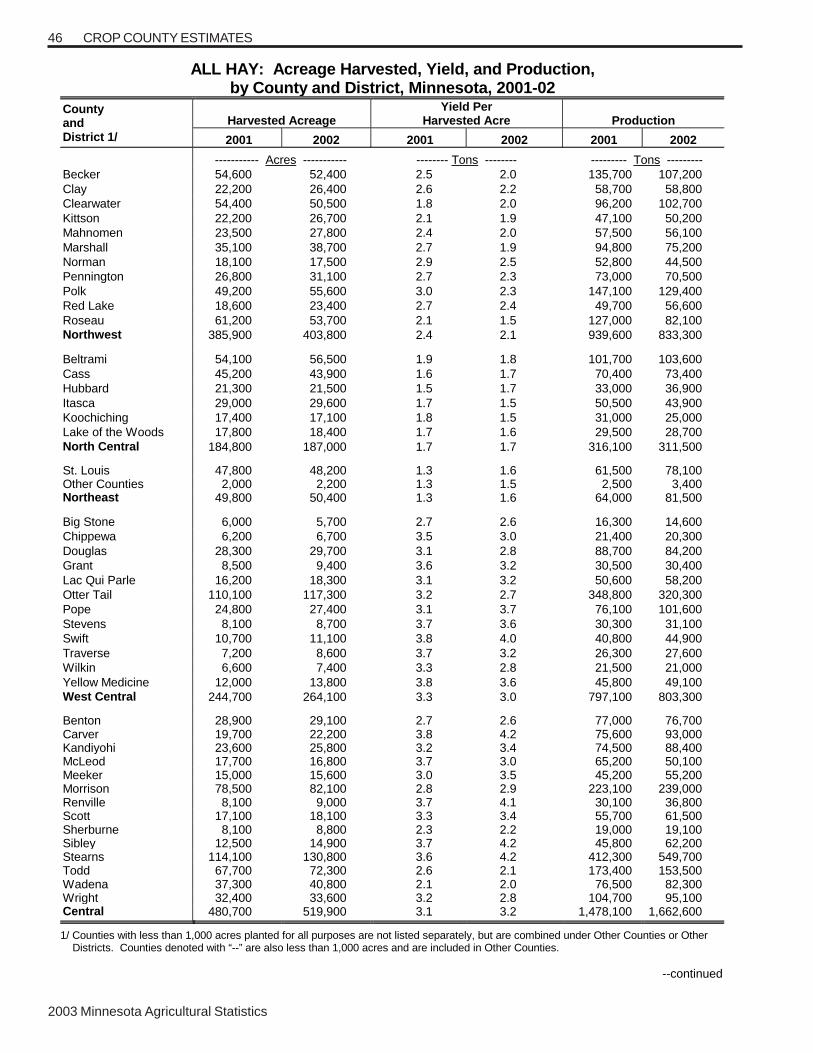
2003 Minnesota Agricultural Statistics
46 CROP COUNTY ESTIMATES
ALL HAY: Acreage Harvested, Yield, and Production, by County and District, Minnesota, 2001-02
Harvested Acreage Yield Per
Harvested Acre Production County and District 1/ 2001 2002 2001 2002 2001 2002
----------- Acres ----------- -------- Tons -------- --------- Tons --------- Becker 54,600 52,400 2.5 2.0 135,700 107,200 Clay 22,200 26,400 2.6 2.2 58,700 58,800 Clearwater 54,400 50,500 1.8 2.0 96,200 102,700 Kittson 22,200 26,700 2.1 1.9 47,100 50,200 Mahnomen 23,500 27,800 2.4 2.0 57,500 56,100 Marshall 35,100 38,700 2.7 1.9 94,800 75,200 Norman 18,100 17,500 2.9 2.5 52,800 44,500 Pennington 26,800 31,100 2.7 2.3 73,000 70,500 Polk 49,200 55,600 3.0 2.3 147,100 129,400 Red Lake 18,600 23,400 2.7 2.4 49,700 56,600 Roseau 61,200 53,700 2.1 1.5 127,000 82,100 Northwest 385,900 403,800 2.4 2.1 939,600 833,300 Beltrami 54,100 56,500 1.9 1.8 101,700 103,600 Cass 45,200 43,900 1.6 1.7 70,400 73,400 Hubbard 21,300 21,500 1.5 1.7 33,000 36,900 Itasca 29,000 29,600 1.7 1.5 50,500 43,900 Koochiching 17,400 17,100 1.8 1.5 31,000 25,000 Lake of the Woods 17,800 18,400 1.7 1.6 29,500 28,700 North Central 184,800 187,000 1.7 1.7 316,100 311,500 St. Louis 47,800 48,200 1.3 1.6 61,500 78,100 Other Counties 2,000 2,200 1.3 1.5 2,500 3,400 Northeast 49,800 50,400 1.3 1.6 64,000 81,500 Big Stone 6,000 5,700 2.7 2.6 16,300 14,600 Chippewa 6,200 6,700 3.5 3.0 21,400 20,300 Douglas 28,300 29,700 3.1 2.8 88,700 84,200 Grant 8,500 9,400 3.6 3.2 30,500 30,400 Lac Qui Parle 16,200 18,300 3.1 3.2 50,600 58,200 Otter Tail 110,100 117,300 3.2 2.7 348,800 320,300 Pope 24,800 27,400 3.1 3.7 76,100 101,600 Stevens 8,100 8,700 3.7 3.6 30,300 31,100 Swift 10,700 11,100 3.8 4.0 40,800 44,900 Traverse 7,200 8,600 3.7 3.2 26,300 27,600 Wilkin 6,600 7,400 3.3 2.8 21,500 21,000 Yellow Medicine 12,000 13,800 3.8 3.6 45,800 49,100 West Central 244,700 264,100 3.3 3.0 797,100 803,300 Benton 28,900 29,100 2.7 2.6 77,000 76,700 Carver 19,700 22,200 3.8 4.2 75,600 93,000 Kandiyohi 23,600 25,800 3.2 3.4 74,500 88,400 McLeod 17,700 16,800 3.7 3.0 65,200 50,100 Meeker 15,000 15,600 3.0 3.5 45,200 55,200 Morrison 78,500 82,100 2.8 2.9 223,100 239,000 Renville 8,100 9,000 3.7 4.1 30,100 36,800 Scott 17,100 18,100 3.3 3.4 55,700 61,500 Sherburne 8,100 8,800 2.3 2.2 19,000 19,100 Sibley 12,500 14,900 3.7 4.2 45,800 62,200 Stearns 114,100 130,800 3.6 4.2 412,300 549,700 Todd 67,700 72,300 2.6 2.1 173,400 153,500 Wadena 37,300 40,800 2.1 2.0 76,500 82,300 Wright 32,400 33,600 3.2 2.8 104,700 95,100 Central 480,700 519,900 3.1 3.2 1,478,100 1,662,600 1/ Counties with less than 1,000 acres planted for all purposes are not listed separately, but are combined under Other Counties or Other Districts. Counties denoted with “--” are also less than 1,000 acres and are included in Other Counties.
--continued
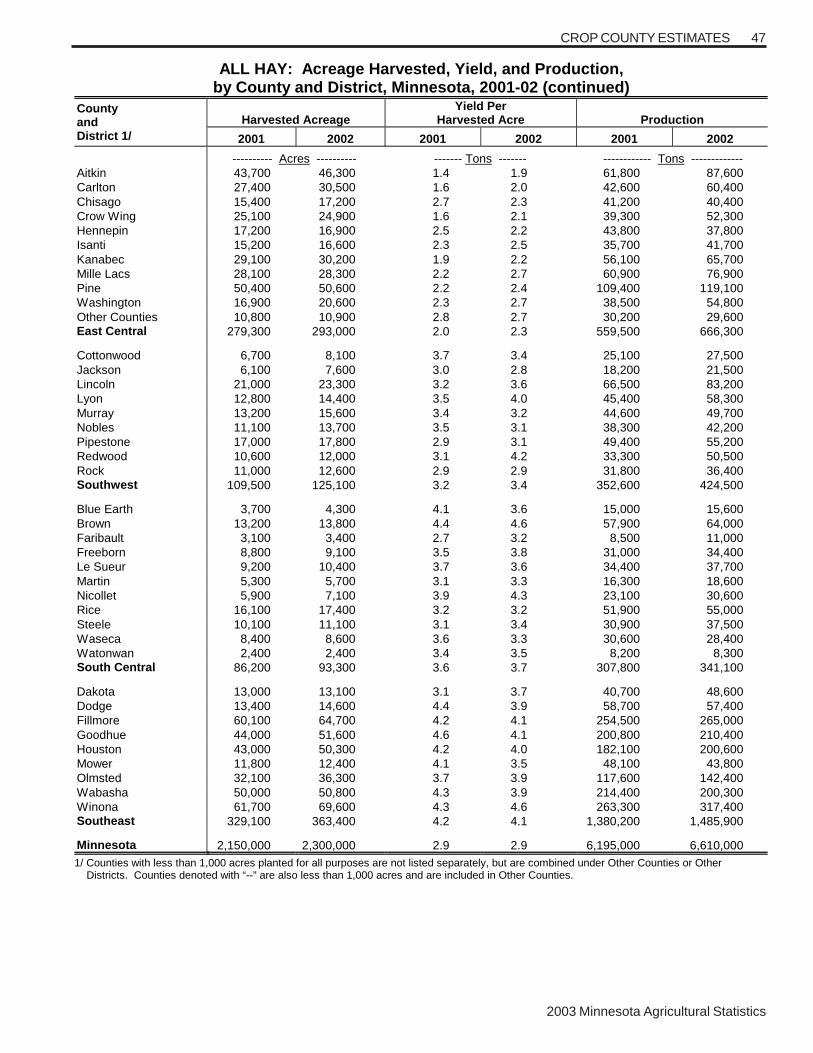
2003 Minnesota Agricultural Statistics
47CROP COUNTY ESTIMATES
ALL HAY: Acreage Harvested, Yield, and Production, by County and District, Minnesota, 2001-02 (continued)
Harvested Acreage Yield Per
Harvested Acre Production County and District 1/ 2001 2002 2001 2002 2001 2002
---------- Acres ---------- ------- Tons ------- ------------ Tons ------------- Aitkin 43,700 46,300 1.4 1.9 61,800 87,600 Carlton 27,400 30,500 1.6 2.0 42,600 60,400 Chisago 15,400 17,200 2.7 2.3 41,200 40,400 Crow Wing 25,100 24,900 1.6 2.1 39,300 52,300 Hennepin 17,200 16,900 2.5 2.2 43,800 37,800 Isanti 15,200 16,600 2.3 2.5 35,700 41,700 Kanabec 29,100 30,200 1.9 2.2 56,100 65,700 Mille Lacs 28,100 28,300 2.2 2.7 60,900 76,900 Pine 50,400 50,600 2.2 2.4 109,400 119,100 Washington 16,900 20,600 2.3 2.7 38,500 54,800 Other Counties 10,800 10,900 2.8 2.7 30,200 29,600 East Central 279,300 293,000 2.0 2.3 559,500 666,300 Cottonwood 6,700 8,100 3.7 3.4 25,100 27,500 Jackson 6,100 7,600 3.0 2.8 18,200 21,500 Lincoln 21,000 23,300 3.2 3.6 66,500 83,200 Lyon 12,800 14,400 3.5 4.0 45,400 58,300 Murray 13,200 15,600 3.4 3.2 44,600 49,700 Nobles 11,100 13,700 3.5 3.1 38,300 42,200 Pipestone 17,000 17,800 2.9 3.1 49,400 55,200 Redwood 10,600 12,000 3.1 4.2 33,300 50,500 Rock 11,000 12,600 2.9 2.9 31,800 36,400 Southwest 109,500 125,100 3.2 3.4 352,600 424,500 Blue Earth 3,700 4,300 4.1 3.6 15,000 15,600 Brown 13,200 13,800 4.4 4.6 57,900 64,000 Faribault 3,100 3,400 2.7 3.2 8,500 11,000 Freeborn 8,800 9,100 3.5 3.8 31,000 34,400 Le Sueur 9,200 10,400 3.7 3.6 34,400 37,700 Martin 5,300 5,700 3.1 3.3 16,300 18,600 Nicollet 5,900 7,100 3.9 4.3 23,100 30,600 Rice 16,100 17,400 3.2 3.2 51,900 55,000 Steele 10,100 11,100 3.1 3.4 30,900 37,500 Waseca 8,400 8,600 3.6 3.3 30,600 28,400 Watonwan 2,400 2,400 3.4 3.5 8,200 8,300 South Central 86,200 93,300 3.6 3.7 307,800 341,100 Dakota 13,000 13,100 3.1 3.7 40,700 48,600 Dodge 13,400 14,600 4.4 3.9 58,700 57,400 Fillmore 60,100 64,700 4.2 4.1 254,500 265,000 Goodhue 44,000 51,600 4.6 4.1 200,800 210,400 Houston 43,000 50,300 4.2 4.0 182,100 200,600 Mower 11,800 12,400 4.1 3.5 48,100 43,800 Olmsted 32,100 36,300 3.7 3.9 117,600 142,400 Wabasha 50,000 50,800 4.3 3.9 214,400 200,300 Winona 61,700 69,600 4.3 4.6 263,300 317,400 Southeast 329,100 363,400 4.2 4.1 1,380,200 1,485,900 Minnesota 2,150,000 2,300,000 2.9 2.9 6,195,000 6,610,000 1/ Counties with less than 1,000 acres planted for all purposes are not listed separately, but are combined under Other Counties or Other Districts. Counties denoted with “--” are also less than 1,000 acres and are included in Other Counties.

2003 Minnesota Agricultural Statistics
48 CROP COUNTY ESTIMATES
ALFALFA HAY: Acreage Harvested, Yield, and Production, by County and District, Minnesota, 2001-02
Harvested Acreage Yield Per
Harvested Acre Production County and District 1/ 2001 2002 2001 2002 2001 2002
------------ Acres ---------- -------- Tons --------- ------------ Tons ------------- Becker 41,500 38,400 2.7 2.1 112,100 80,600 Clay 15,000 18,700 3.0 2.4 45,000 44,900 Clearwater 28,500 31,200 2.1 2.3 59,900 71,800 Kittson 13,400 16,200 2.6 2.0 34,800 32,400 Mahnomen 16,600 20,500 2.8 2.1 46,500 43,000 Marshall 24,800 27,800 3.2 2.0 79,400 55,600 Norman 14,800 14,500 3.3 2.7 48,800 39,100 Pennington 17,700 22,700 3.2 2.4 56,600 54,500 Polk 38,600 43,600 3.4 2.5 131,200 109,000 Red Lake 13,100 16,300 3.0 2.6 39,300 42,400 Roseau 31,600 23,000 2.8 1.7 88,500 39,100 Northwest 255,600 272,900 2.9 2.2 742,100 612,400 Beltrami 30,400 33,000 2.1 2.0 63,800 66,000 Cass 11,600 10,800 2.3 2.2 26,700 23,800 Hubbard 9,300 9,300 2.0 2.0 18,600 18,600 Itasca 7,000 7,700 2.5 2.0 17,500 15,400 Koochiching 9,200 9,200 2.3 1.6 21,200 14,700 Lake of the Woods 9,000 10,000 2.2 1.7 19,800 17,000 North Central 76,500 80,000 2.2 1.9 167,600 155,500 St. Louis 3,400 3,400 2.4 1.9 8,200 6,400 Other Counties 200 200 2.0 2.0 400 400 Northeast 3,600 3,600 2.4 1.9 8,600 6,800 Big Stone 4,100 4,100 3.2 2.9 13,100 11,900 Chippewa 5,400 5,600 3.7 3.2 20,000 17,900 Douglas 23,600 25,900 3.4 3.0 80,200 77,700 Grant 8,000 9,000 3.7 3.3 29,600 29,700 Lac Qui Parle 12,400 15,200 3.5 3.4 43,400 51,700 Otter Tail 95,900 101,000 3.4 2.8 326,100 282,800 Pope 20,700 23,600 3.3 4.0 68,300 94,400 Stevens 7,500 8,100 3.9 3.7 29,300 30,000 Swift 8,800 9,600 4.3 4.4 37,800 42,200 Traverse 6,100 7,500 4.0 3.4 24,400 25,500 Wilkin 5,600 6,300 3.5 3.0 19,600 18,900 Yellow Medicine 9,700 11,700 4.2 3.8 40,700 44,500 West Central 207,800 227,600 3.5 3.2 732,500 727,200 Benton 22,000 23,200 3.0 2.9 66,000 67,300 Carver 17,000 19,200 4.1 4.5 69,700 86,400 Kandiyohi 20,200 22,100 3.4 3.6 68,700 79,500 McLeod 13,600 11,900 4.1 3.3 55,800 39,300 Meeker 12,200 12,200 3.2 3.8 39,000 46,400 Morrison 48,100 51,200 3.5 3.4 168,400 174,100 Renville 6,800 7,600 3.9 4.3 26,500 32,700 Scott 13,600 14,700 3.6 3.7 49,000 54,400 Sherburne 5,900 6,500 2.7 2.4 15,900 15,600 Sibley 9,700 11,900 4.0 4.6 38,800 54,700 Stearns 98,500 117,200 3.9 4.4 384,200 515,700 Todd 40,700 46,800 3.2 2.3 130,200 107,600 Wadena 20,000 22,300 2.7 2.2 54,000 49,000 Wright 27,900 28,400 3.4 3.0 94,800 85,200 Central 356,200 395,200 3.5 3.6 1,261,000 1,407,900 1/ Counties with less than 1,000 acres planted for all purposes are not listed separately, but are combined under Other Counties or Other Districts. Counties denoted with “--” are also less than 1,000 acres and are included in Other Counties.
--continued
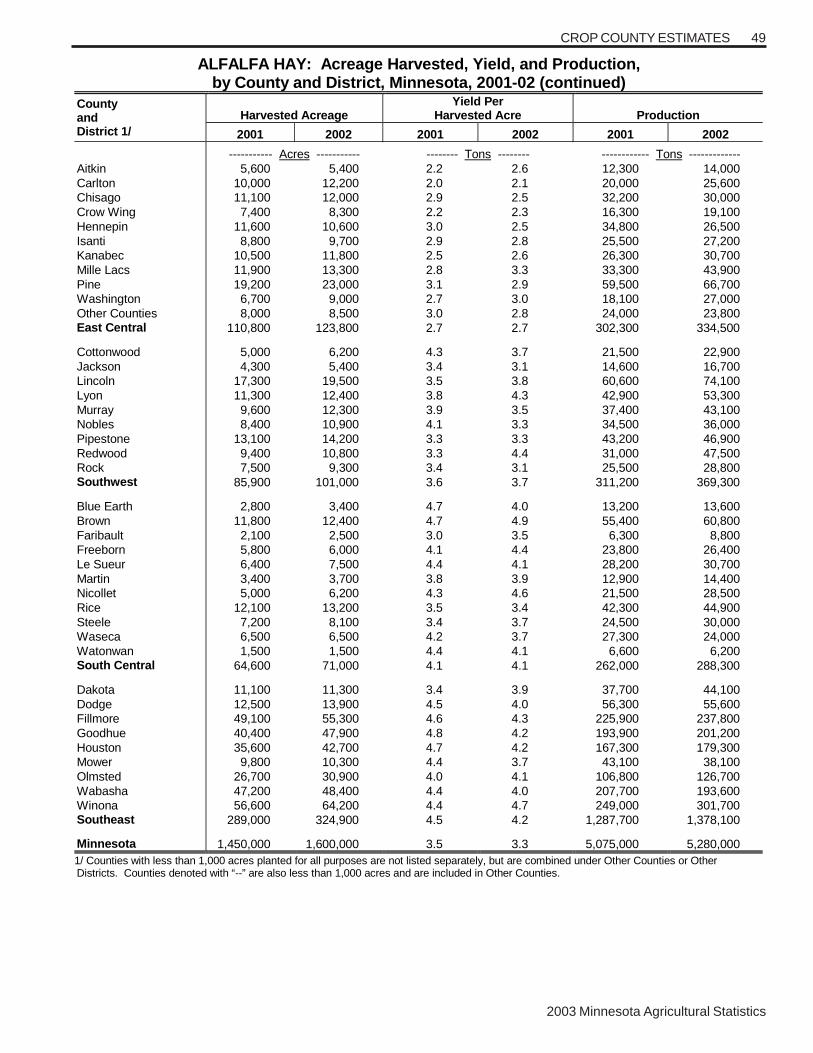
2003 Minnesota Agricultural Statistics
49CROP COUNTY ESTIMATES
ALFALFA HAY: Acreage Harvested, Yield, and Production, by County and District, Minnesota, 2001-02 (continued)
Harvested Acreage Yield Per
Harvested Acre Production County and District 1/ 2001 2002 2001 2002 2001 2002
----------- Acres ----------- -------- Tons -------- ------------ Tons ------------- Aitkin 5,600 5,400 2.2 2.6 12,300 14,000 Carlton 10,000 12,200 2.0 2.1 20,000 25,600 Chisago 11,100 12,000 2.9 2.5 32,200 30,000 Crow Wing 7,400 8,300 2.2 2.3 16,300 19,100 Hennepin 11,600 10,600 3.0 2.5 34,800 26,500 Isanti 8,800 9,700 2.9 2.8 25,500 27,200 Kanabec 10,500 11,800 2.5 2.6 26,300 30,700 Mille Lacs 11,900 13,300 2.8 3.3 33,300 43,900 Pine 19,200 23,000 3.1 2.9 59,500 66,700 Washington 6,700 9,000 2.7 3.0 18,100 27,000 Other Counties 8,000 8,500 3.0 2.8 24,000 23,800 East Central 110,800 123,800 2.7 2.7 302,300 334,500 Cottonwood 5,000 6,200 4.3 3.7 21,500 22,900 Jackson 4,300 5,400 3.4 3.1 14,600 16,700 Lincoln 17,300 19,500 3.5 3.8 60,600 74,100 Lyon 11,300 12,400 3.8 4.3 42,900 53,300 Murray 9,600 12,300 3.9 3.5 37,400 43,100 Nobles 8,400 10,900 4.1 3.3 34,500 36,000 Pipestone 13,100 14,200 3.3 3.3 43,200 46,900 Redwood 9,400 10,800 3.3 4.4 31,000 47,500 Rock 7,500 9,300 3.4 3.1 25,500 28,800 Southwest 85,900 101,000 3.6 3.7 311,200 369,300 Blue Earth 2,800 3,400 4.7 4.0 13,200 13,600 Brown 11,800 12,400 4.7 4.9 55,400 60,800 Faribault 2,100 2,500 3.0 3.5 6,300 8,800 Freeborn 5,800 6,000 4.1 4.4 23,800 26,400 Le Sueur 6,400 7,500 4.4 4.1 28,200 30,700 Martin 3,400 3,700 3.8 3.9 12,900 14,400 Nicollet 5,000 6,200 4.3 4.6 21,500 28,500 Rice 12,100 13,200 3.5 3.4 42,300 44,900 Steele 7,200 8,100 3.4 3.7 24,500 30,000 Waseca 6,500 6,500 4.2 3.7 27,300 24,000 Watonwan 1,500 1,500 4.4 4.1 6,600 6,200 South Central 64,600 71,000 4.1 4.1 262,000 288,300 Dakota 11,100 11,300 3.4 3.9 37,700 44,100 Dodge 12,500 13,900 4.5 4.0 56,300 55,600 Fillmore 49,100 55,300 4.6 4.3 225,900 237,800 Goodhue 40,400 47,900 4.8 4.2 193,900 201,200 Houston 35,600 42,700 4.7 4.2 167,300 179,300 Mower 9,800 10,300 4.4 3.7 43,100 38,100 Olmsted 26,700 30,900 4.0 4.1 106,800 126,700 Wabasha 47,200 48,400 4.4 4.0 207,700 193,600 Winona 56,600 64,200 4.4 4.7 249,000 301,700 Southeast 289,000 324,900 4.5 4.2 1,287,700 1,378,100 Minnesota 1,450,000 1,600,000 3.5 3.3 5,075,000 5,280,000 1/ Counties with less than 1,000 acres planted for all purposes are not listed separately, but are combined under Other Counties or Other Districts. Counties denoted with “--” are also less than 1,000 acres and are included in Other Counties.
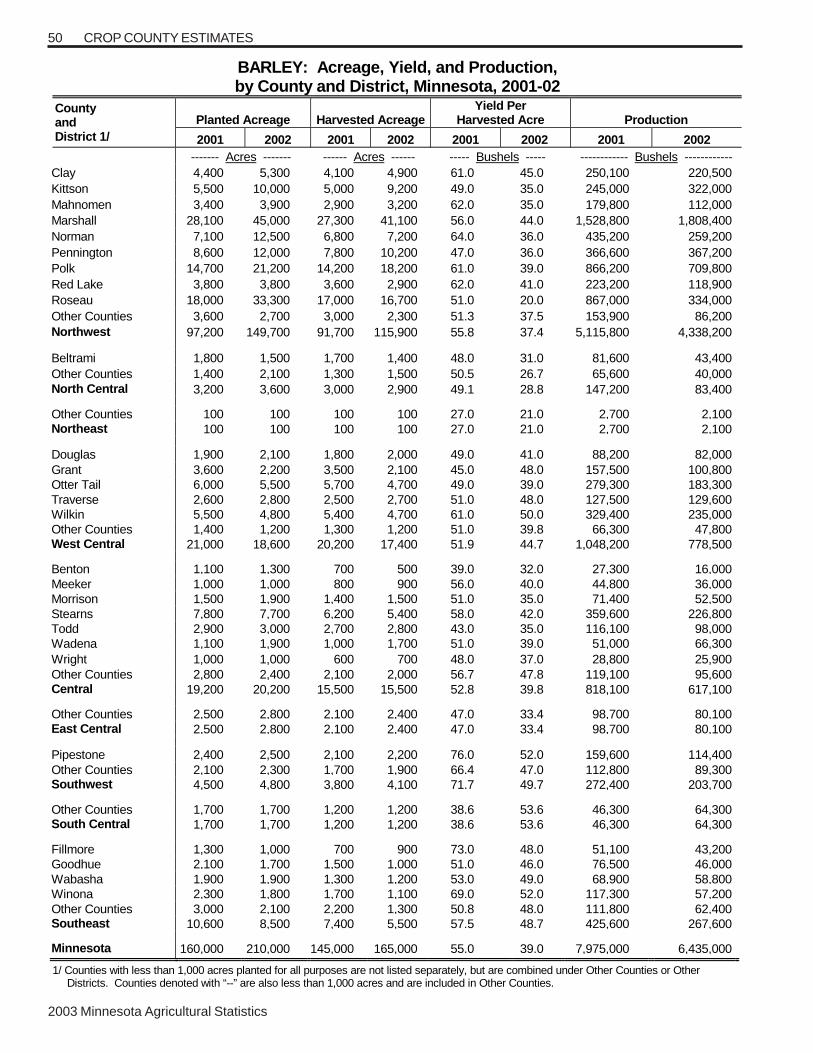
2003 Minnesota Agricultural Statistics
50 CROP COUNTY ESTIMATES
BARLEY: Acreage, Yield, and Production, by County and District, Minnesota, 2001-02
Planted Acreage Harvested Acreage Yield Per
Harvested Acre Production County and District 1/ 2001 2002 2001 2002 2001 2002 2001 2002
------- Acres ------- ------ Acres ------ ----- Bushels ----- ------------ Bushels ------------ Clay 4,400 5,300 4,100 4,900 61.0 45.0 250,100 220,500 Kittson 5,500 10,000 5,000 9,200 49.0 35.0 245,000 322,000 Mahnomen 3,400 3,900 2,900 3,200 62.0 35.0 179,800 112,000 Marshall 28,100 45,000 27,300 41,100 56.0 44.0 1,528,800 1,808,400 Norman 7,100 12,500 6,800 7,200 64.0 36.0 435,200 259,200 Pennington 8,600 12,000 7,800 10,200 47.0 36.0 366,600 367,200 Polk 14,700 21,200 14,200 18,200 61.0 39.0 866,200 709,800 Red Lake 3,800 3,800 3,600 2,900 62.0 41.0 223,200 118,900 Roseau 18,000 33,300 17,000 16,700 51.0 20.0 867,000 334,000 Other Counties 3,600 2,700 3,000 2,300 51.3 37.5 153,900 86,200 Northwest 97,200 149,700 91,700 115,900 55.8 37.4 5,115,800 4,338,200 Beltrami 1,800 1,500 1,700 1,400 48.0 31.0 81,600 43,400 Other Counties 1,400 2,100 1,300 1,500 50.5 26.7 65,600 40,000 North Central 3,200 3,600 3,000 2,900 49.1 28.8 147,200 83,400 Other Counties 100 100 100 100 27.0 21.0 2,700 2,100 Northeast 100 100 100 100 27.0 21.0 2,700 2,100 Douglas 1,900 2,100 1,800 2,000 49.0 41.0 88,200 82,000 Grant 3,600 2,200 3,500 2,100 45.0 48.0 157,500 100,800 Otter Tail 6,000 5,500 5,700 4,700 49.0 39.0 279,300 183,300 Traverse 2,600 2,800 2,500 2,700 51.0 48.0 127,500 129,600 Wilkin 5,500 4,800 5,400 4,700 61.0 50.0 329,400 235,000 Other Counties 1,400 1,200 1,300 1,200 51.0 39.8 66,300 47,800 West Central 21,000 18,600 20,200 17,400 51.9 44.7 1,048,200 778,500 Benton 1,100 1,300 700 500 39.0 32.0 27,300 16,000 Meeker 1,000 1,000 800 900 56.0 40.0 44,800 36,000 Morrison 1,500 1,900 1,400 1,500 51.0 35.0 71,400 52,500 Stearns 7,800 7,700 6,200 5,400 58.0 42.0 359,600 226,800 Todd 2,900 3,000 2,700 2,800 43.0 35.0 116,100 98,000 Wadena 1,100 1,900 1,000 1,700 51.0 39.0 51,000 66,300 Wright 1,000 1,000 600 700 48.0 37.0 28,800 25,900 Other Counties 2,800 2,400 2,100 2,000 56.7 47.8 119,100 95,600 Central 19,200 20,200 15,500 15,500 52.8 39.8 818,100 617,100 Other Counties 2,500 2,800 2,100 2,400 47.0 33.4 98,700 80,100 East Central 2,500 2,800 2,100 2,400 47.0 33.4 98,700 80,100 Pipestone 2,400 2,500 2,100 2,200 76.0 52.0 159,600 114,400 Other Counties 2,100 2,300 1,700 1,900 66.4 47.0 112,800 89,300 Southwest 4,500 4,800 3,800 4,100 71.7 49.7 272,400 203,700 Other Counties 1,700 1,700 1,200 1,200 38.6 53.6 46,300 64,300 South Central 1,700 1,700 1,200 1,200 38.6 53.6 46,300 64,300 Fillmore 1,300 1,000 700 900 73.0 48.0 51,100 43,200 Goodhue 2,100 1,700 1,500 1,000 51.0 46.0 76,500 46,000 Wabasha 1,900 1,900 1,300 1,200 53.0 49.0 68,900 58,800 Winona 2,300 1,800 1,700 1,100 69.0 52.0 117,300 57,200 Other Counties 3,000 2,100 2,200 1,300 50.8 48.0 111,800 62,400 Southeast 10,600 8,500 7,400 5,500 57.5 48.7 425,600 267,600 Minnesota 160,000 210,000 145,000 165,000 55.0 39.0 7,975,000 6,435,000 1/ Counties with less than 1,000 acres planted for all purposes are not listed separately, but are combined under Other Counties or Other Districts. Counties denoted with “--” are also less than 1,000 acres and are included in Other Counties.
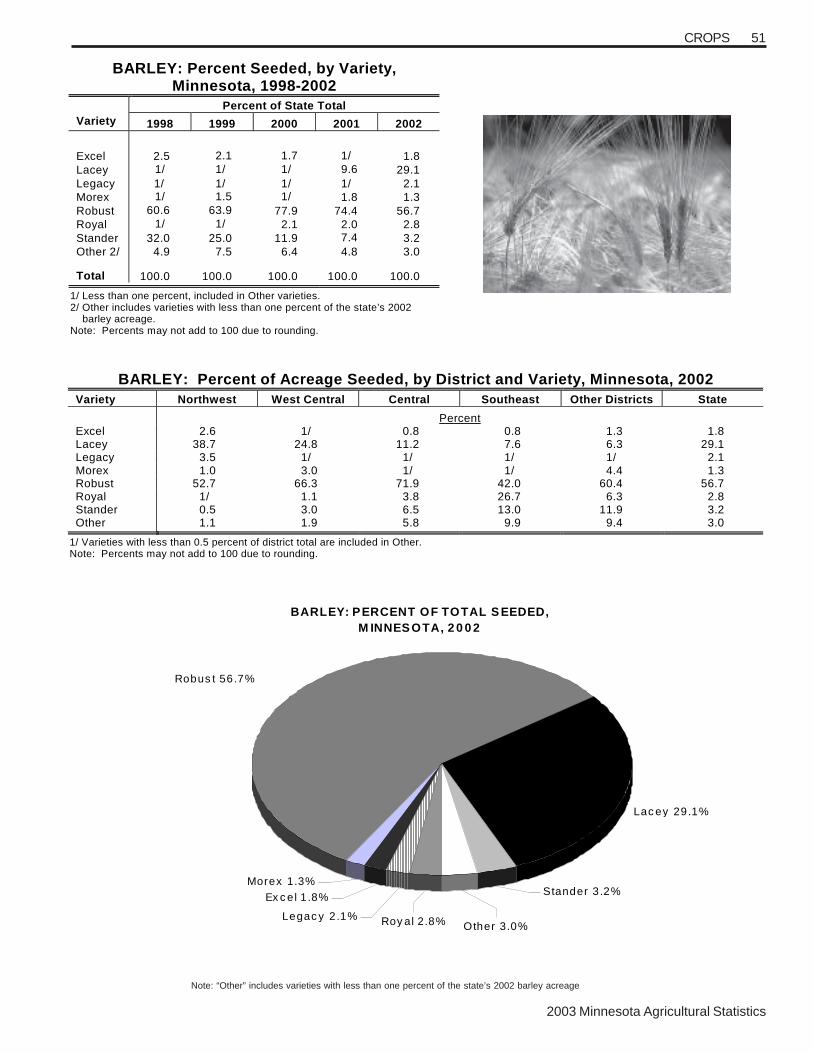
2003 Minnesota Agricultural Statistics
51CROPS
Note: “Other” includes varieties with less than one percent of the state’s 2002 barley acreage
BARLEY: Percent Seeded, by Variety, Minnesota, 1998-2002
Percent of State Total Variety 1998 1999 2000 2001 2002
Excel 2.5 2.1
1.7
1/
1.8
Lacey 1/
1/
1/
9.6
29.1 Legacy 1/ 1/ 1/ 1/ 2.1 Morex 1/
1.5
1/
1.8 1.3
Robust 60.6
63.9
77.9 74.4 56.7 Royal 1/
1/
2.1 2.0 2.8
Stander 32.0 25.0 11.9 7.4
3.2 Other 2/ 4.9 7.5 6.4 4.8 3.0 Total 100.0 100.0 100.0 100.0 100.0
1/ Less than one percent, included in Other varieties. 2/ Other includes varieties with less than one percent of the state’s 2002 barley acreage. Note: Percents may not add to 100 due to rounding.
BARLEY: Percent of Acreage Seeded, by District and Variety, Minnesota, 2002 Variety Northwest West Central Central Southeast Other Districts State
Percent Excel 2.6 1/ 0.8 0.8 1.3 1.8 Lacey 38.7 24.8 11.2 7.6 6.3 29.1 Legacy 3.5 1/ 1/ 1/ 1/ 2.1 Morex 1.0 3.0 1/ 1/ 4.4 1.3 Robust 52.7 66.3 71.9 42.0 60.4 56.7 Royal 1/ 1.1 3.8 26.7 6.3 2.8 Stander 0.5 3.0 6.5 13.0 11.9 3.2 Other 1.1 1.9 5.8 9.9 9.4 3.0
1/ Varieties with less than 0.5 percent of district total are included in Other. Note: Percents may not add to 100 due to rounding.
BARLEY: PERCENT OF TOTAL S EEDED, M INNES OTA, 2 0 0 2
Morex 1.3%
Ex c el 1 .8%
Legac y 2.1% Roy al 2.8%
Lac ey 29.1%
Stander 3 .2%
Other 3.0%
Robus t 56.7%Robus t 56.7%
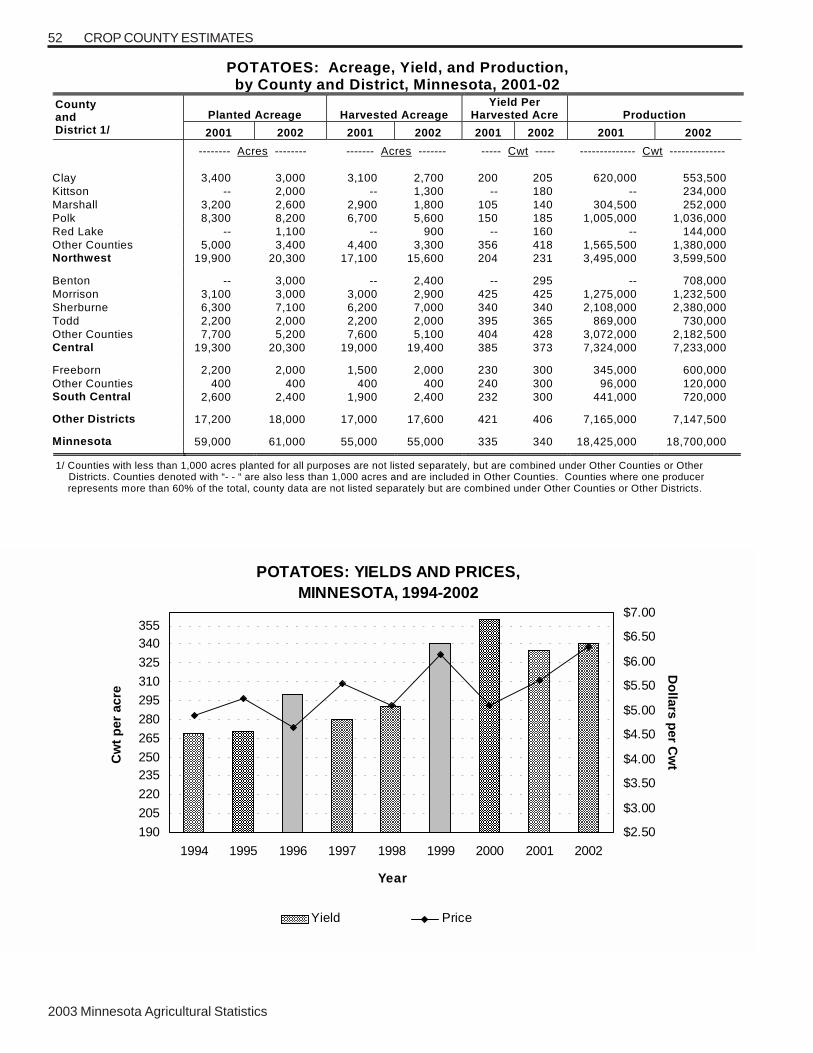
2003 Minnesota Agricultural Statistics
52 CROP COUNTY ESTIMATES
POTATOES: Acreage, Yield, and Production, by County and District, Minnesota, 2001-02
Planted Acreage Harvested Acreage Yield Per
Harvested Acre Production County and District 1/ 2001 2002 2001 2002 2001 2002 2001 2002
-------- Acres -------- ------- Acres ------- ----- Cwt ----- -------------- Cwt -------------- Clay 3,400 3,000 3,100 2,700 200 205 620,000 553,500 Kittson -- 2,000 -- 1,300 -- 180 -- 234,000 Marshall 3,200 2,600 2,900 1,800 105 140 304,500 252,000 Polk 8,300 8,200 6,700 5,600 150 185 1,005,000 1,036,000 Red Lake -- 1,100 -- 900 -- 160 -- 144,000 Other Counties 5,000 3,400 4,400 3,300 356 418 1,565,500 1,380,000 Northwest 19,900 20,300 17,100 15,600 204 231 3,495,000 3,599,500 Benton -- 3,000 -- 2,400 -- 295 -- 708,000 Morrison 3,100 3,000 3,000 2,900 425 425 1,275,000 1,232,500 Sherburne 6,300 7,100 6,200 7,000 340 340 2,108,000 2,380,000 Todd 2,200 2,000 2,200 2,000 395 365 869,000 730,000 Other Counties 7,700 5,200 7,600 5,100 404 428 3,072,000 2,182,500 Central 19,300 20,300 19,000 19,400 385 373 7,324,000 7,233,000 Freeborn 2,200 2,000 1,500 2,000 230 300 345,000 600,000 Other Counties 400 400 400 400 240 300 96,000 120,000 South Central 2,600 2,400 1,900 2,400 232 300 441,000 720,000 Other Districts 17,200 18,000 17,000 17,600 421 406 7,165,000 7,147,500 Minnesota 59,000 61,000 55,000 55,000 335 340 18,425,000 18,700,000 1/ Counties with less than 1,000 acres planted for all purposes are not listed separately, but are combined under Other Counties or Other Districts. Counties denoted with “- - “ are also less than 1,000 acres and are included in Other Counties. Counties where one producer represents more than 60% of the total, county data are not listed separately but are combined under Other Counties or Other Districts.
POTATOES: YIELDS AND PRICES, MINNESOTA, 1994-2002
190
205
220
235250
265
280
295
310
325
340355
1994 1995 1996 1997 1998 1999 2000 2001 2002
Year
Cw
t p
er a
cre
$2.50
$3.00
$3.50
$4.00
$4.50
$5.00
$5.50
$6.00
$6.50
$7.00
Do
llars per C
wt
Yield Price

2003 Minnesota Agricultural Statistics
53
SUGARBEETS: Acreage, Yield, and Production, by County and District, Minnesota, 2001-02
Planted Acreage Harvested Acreage Yield Per
Harvested Acre Production County and District 1/ 2001 2002 2001 2002 2001 2002 2001 2002
-------- Acres -------- -------- Acres -------- ---- Tons ---- ----------- Tons ----------- Becker 10,900 9,000 10,200 8,900 18.0 18.2 184,000 161,600 Clay 63,200 57,500 59,100 56,200 17.9 16.8 1,059,200 941,500 Kittson 24,800 38,400 20,700 37,800 11.2 17.6 231,800 663,600 Mahnomen 3,600 4,600 3,300 4,500 18.8 12.4 61,900 55,700 Marshall 24,500 46,600 21,700 44,600 15.7 16.9 340,500 755,400 Norman 52,300 46,100 50,000 42,100 19.1 14.9 953,900 625,700 Polk 101,800 102,900 96,700 99,400 18.7 17.8 1,806,700 1,764,700 Red Lake 1,200 1,300 1,100 1,300 19.9 14.8 21,900 19,200 Other Counties 400 200 400 200 19.5 20.0 7,800 4,000 Northwest 282,700 306,600 263,200 295,000 17.7 16.9 4,667,700 4,991,400 Chippewa 32,000 34,300 27,900 29,500 19.3 21.4 537,100 632,600 Grant 10,200 11,200 9,100 11,100 18.3 20.4 166,800 226,600 Otter Tail 3,500 4,000 3,100 3,900 19.8 19.8 61,400 77,300 Pope 2,400 3,100 2,100 3,100 21.5 20.0 45,100 61,900 Stevens 3,400 3,800 2,700 3,700 21.3 22.5 57,500 83,300 Swift 5,600 6,200 4,900 5,400 18.6 21.3 91,000 114,900 Traverse 9,200 10,500 7,900 10,400 16.6 21.0 131,300 218,400 Wilkin 45,500 49,500 38,600 49,000 17.7 22.0 682,700 1,077,700 Yellow Medicine 3,400 3,300 2,900 2,900 19.0 23.7 55,200 68,800 Other Counties 1,200 1,300 900 1,200 14.6 14.8 13,100 17,800 West Central 116,400 127,200 100,100 120,200 18.4 21.5 1,841,200 2,579,300 Kandiyohi 15,900 14,400 14,400 10,600 21.3 22.1 306,800 233,800 McLeod 2,700 1,500 2,400 1,500 17.9 18.9 43,000 28,400 Meeker 2,500 1,500 2,400 800 19.2 18.8 46,100 15,000 Renville 38,700 43,300 35,500 39,000 20.6 21.5 732,300 839,900 Sibley 2,200 3,600 2,000 3,200 19.7 19.6 39,300 62,700 Stearns 2,600 2,100 2,400 1,600 20.2 19.1 48,400 30,600 Central 64,600 66,400 59,100 56,700 20.6 21.3 1,215,900 1,210,400 Redwood 3,400 3,900 2,900 3,500 20.0 17.8 58,100 62,300 Other Counties -- 500 -- 400 -- 15.3 -- 6,100 Southwest 3,400 4,400 2,900 3,900 20.0 17.5 58,100 68,400 Other Districts 900 400 700 200 18.7 22.5 13,100 4,500 Minnesota 468,000 505,000 426,000 476,000 18.3 18.6 7,796,000 8,854,000
1/ Counties with less than 1,000 acres planted for all purposes are not listed separately, but are combined under Other Counties or Other Districts. Counties denoted with “--” are also less than 1,000 acres and are included in Other Counties.
CROP COUNTY ESTIMATES
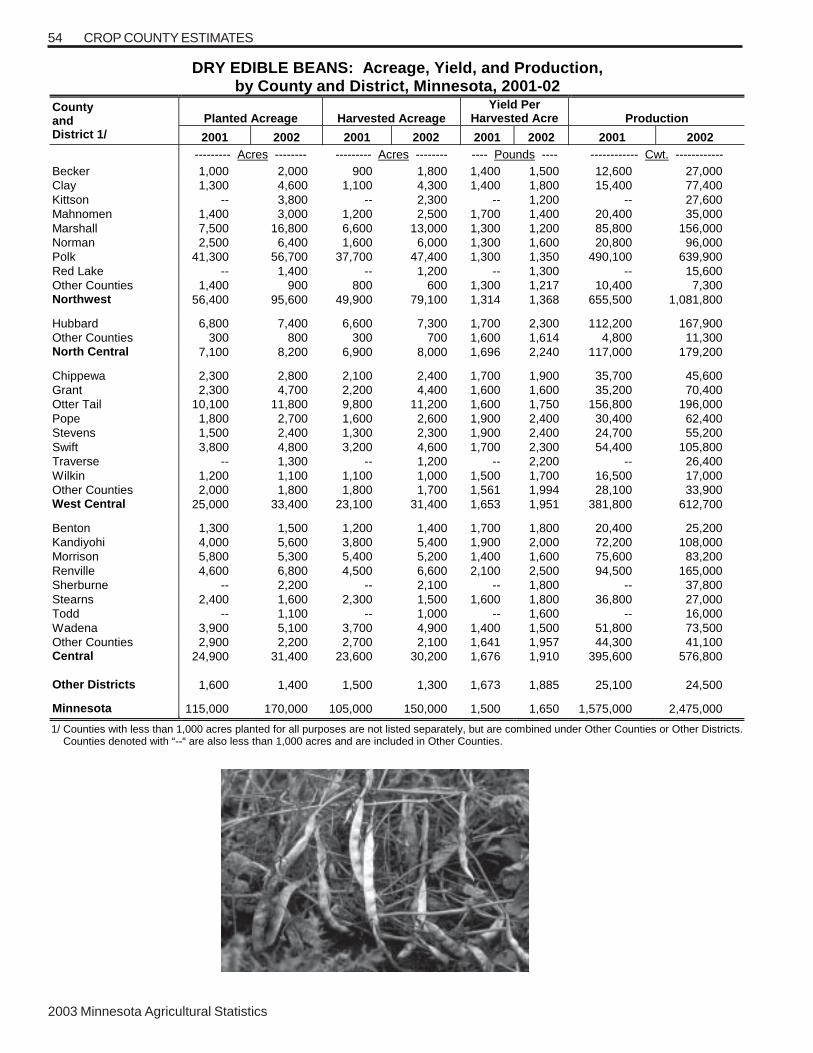
2003 Minnesota Agricultural Statistics
54
DRY EDIBLE BEANS: Acreage, Yield, and Production, by County and District, Minnesota, 2001-02
Planted Acreage Harvested Acreage Yield Per
Harvested Acre Production County and District 1/ 2001 2002 2001 2002 2001 2002 2001 2002
--------- Acres -------- --------- Acres -------- ---- Pounds ---- ------------ Cwt. ------------ Becker 1,000 2,000 900 1,800 1,400 1,500 12,600 27,000 Clay 1,300 4,600 1,100 4,300 1,400 1,800 15,400 77,400 Kittson -- 3,800 -- 2,300 -- 1,200 -- 27,600 Mahnomen 1,400 3,000 1,200 2,500 1,700 1,400 20,400 35,000 Marshall 7,500 16,800 6,600 13,000 1,300 1,200 85,800 156,000 Norman 2,500 6,400 1,600 6,000 1,300 1,600 20,800 96,000 Polk 41,300 56,700 37,700 47,400 1,300 1,350 490,100 639,900 Red Lake -- 1,400 -- 1,200 -- 1,300 -- 15,600 Other Counties 1,400 900 800 600 1,300 1,217 10,400 7,300 Northwest 56,400 95,600 49,900 79,100 1,314 1,368 655,500 1,081,800 Hubbard 6,800 7,400 6,600 7,300 1,700 2,300 112,200 167,900 Other Counties 300 800 300 700 1,600 1,614 4,800 11,300 North Central 7,100 8,200 6,900 8,000 1,696 2,240 117,000 179,200 Chippewa 2,300 2,800 2,100 2,400 1,700 1,900 35,700 45,600 Grant 2,300 4,700 2,200 4,400 1,600 1,600 35,200 70,400 Otter Tail 10,100 11,800 9,800 11,200 1,600 1,750 156,800 196,000 Pope 1,800 2,700 1,600 2,600 1,900 2,400 30,400 62,400 Stevens 1,500 2,400 1,300 2,300 1,900 2,400 24,700 55,200 Swift 3,800 4,800 3,200 4,600 1,700 2,300 54,400 105,800 Traverse -- 1,300 -- 1,200 -- 2,200 -- 26,400 Wilkin 1,200 1,100 1,100 1,000 1,500 1,700 16,500 17,000 Other Counties 2,000 1,800 1,800 1,700 1,561 1,994 28,100 33,900 West Central 25,000 33,400 23,100 31,400 1,653 1,951 381,800 612,700 Benton 1,300 1,500 1,200 1,400 1,700 1,800 20,400 25,200 Kandiyohi 4,000 5,600 3,800 5,400 1,900 2,000 72,200 108,000 Morrison 5,800 5,300 5,400 5,200 1,400 1,600 75,600 83,200 Renville 4,600 6,800 4,500 6,600 2,100 2,500 94,500 165,000 Sherburne -- 2,200 -- 2,100 -- 1,800 -- 37,800 Stearns 2,400 1,600 2,300 1,500 1,600 1,800 36,800 27,000 Todd -- 1,100 -- 1,000 -- 1,600 -- 16,000 Wadena 3,900 5,100 3,700 4,900 1,400 1,500 51,800 73,500 Other Counties 2,900 2,200 2,700 2,100 1,641 1,957 44,300 41,100 Central 24,900 31,400 23,600 30,200 1,676 1,910 395,600 576,800 Other Districts 1,600 1,400 1,500 1,300 1,673 1,885 25,100 24,500
Minnesota 115,000 170,000 105,000 150,000 1,500 1,650 1,575,000 2,475,000 1/ Counties with less than 1,000 acres planted for all purposes are not listed separately, but are combined under Other Counties or Other Districts. Counties denoted with “--“ are also less than 1,000 acres and are included in Other Counties.
CROP COUNTY ESTIMATES

2003 Minnesota Agricultural Statistics
55CROP COUNTY ESTIMATES
ALL SUNFLOWERS: Acreage, Yield, and Production, by County and District, Minnesota, 2001-02
Planted Acreage Harvested Acreage Yield Per
Harvested Acre Production County and District 1/ 2001 2002 2001 2002 2001 2002 2001 2002
------- Acres ------- ------- Acres ------- --- Pounds --- ------------ Pounds ------------ Clay 6,400 6,300 5,900 6,200 1,453 1,584 8,570,000 9,820,000 Kittson 1,600 6,800 1,500 6,600 1,547 1,275 2,320,000 8,415,000 Marshall 7,400 10,900 6,900 10,400 1,374 1,254 9,480,000 13,040,000 Norman 13,000 9,500 12,200 9,300 1,282 1,283 15,640,000 11,935,000 Pennington 1,200 3,400 1,100 3,200 1,064 1,169 1,170,000 3,740,000 Polk 9,800 6,900 9,300 6,700 1,300 1,390 12,090,000 9,310,000 Red Lake 1,600 1,500 1,400 1,400 1,057 1,214 1,480,000 1,700,000 Roseau 6,400 11,600 6,000 7,400 1,050 1,238 6,300,000 9,160,000 Other Counties 400 1,300 400 1,300 1,200 1,412 480,000 1,835,000 Northwest 47,800 58,200 44,700 52,500 1,287 1,313 57,530,000 68,955,000 Otter Tail 2,900 3,000 2,700 3,000 1,700 1,837 4,590,000 5,510,000 Wilkin 5,200 5,100 4,800 4,900 1,388 1,384 6,660,000 6,780,000 Other Counties 900 500 900 500 1,350 1,310 1,215,000 655,000 West Central 9,000 8,600 8,400 8,400 1,484 1,541 12,465,000 12,945,000 Other Counties 2,500 2,200 2,200 2,100 1,491 1,400 3,280,000 2,940,000 Central 2,500 2,200 2,200 2,100 1,491 1,400 3,280,000 2,940,000 Other Districts 700 1,000 700 1,000 1,321 1,210 925,000 1,210,000 Minnesota 60,000 70,000 56,000 64,000 1,325 1,345 74,200,000 86,050,000 1/ Counties with less than 1,000 acres planted for all purposes are not listed separately, but are combined under Other Counties or Other Districts. Counties denoted with “--” are also less than 1,000 acres and are included in Other Counties.

2003 Minnesota Agricultural Statistics
56 CROP COUNTY ESTIMATES
OIL SUNFLOWERS: Acreage, Yield, and Production, by County and District, Minnesota, 2001-02
Planted Acreage Harvested Acreage Yield Per
Harvested Acre Production County and District 1/ 2001 2002 2001 2002 2001 2002 2001 2002
------- Acres ------- -------- Acres ------- --- Pounds --- ---------- Pounds ---------- Clay 4,800 4,500 4,500 4,400 1,500 1,700 6,750,000 7,480,000 Kittson -- 3,400 -- 3,300 -- 1,400 -- 4,620,000 Marshall 5,500 8,400 5,100 8,000 1,400 1,300 7,140,000 10,400,000 Norman 4,200 3,200 3,900 3,100 1,350 1,250 5,265,000 3,875,000 Pennington -- 1,100 -- 1,100 -- 1,300 -- 1,430,000 Polk 3,500 4,100 3,400 4,000 1,300 1,450 4,420,000 5,800,000 Roseau 2,000 5,300 1,900 3,400 1,050 1,400 1,995,000 4,760,000 Other Counties 2,700 1,800 2,500 1,700 1,252 1,400 3,130,000 2,380,000 Northwest 22,700 31,800 21,300 29,000 1,347 1,405 28,700,000 40,745,000 Otter Tail 2,900 2,900 2,700 2,900 1,700 1,850 4,590,000 5,365,000 Wilkin 1,000 2,100 900 2,000 1,550 1,650 1,395,000 3,300,000 Other Counties 400 200 400 200 1,413 1,500 565,000 300,000 West Central 4,300 5,200 4,000 5,100 1,638 1,758 6,550,000 8,965,000 Other Counties 2,400 2,200 2,100 2,100 1,500 1,400 3,150,000 2,940,000 Central 2,400 2,200 2,100 2,100 1,500 1,400 3,150,000 2,940,000 Other Districts 600 800 600 800 1,333 1,250 800,000 1,000,000 Minnesota 30,000 40,000 28,000 37,000 1,400 1,450 39,200,000 53,650,000 1/ Counties with less than 1,000 acres planted for all purposes are not listed separately, but are combined under Other Counties or Other Districts. Counties denoted with “--” are also less than 1,000 acres and are included in Other Counties.
FLAXSEED: Acreage, Yield, and Production, by County and District, Minnesota, 2001-02
Planted Acreage Harvested Acreage Yield Per
Harvested Acre Production County and District 1/ 2001 2002 2001 2002 2001 2002 2001 2002
---------- Acres -------- ------- Acres ------- --- Bushels --- ---------- Bushels ---------
Marshall -- 1,000 -- 900 -- 21.0 -- 18,900 Roseau 1,300 1,800 1,300 1,200 14.0 14.0 18,200 16,800 Other Counties 1,600 2,100 1,600 2,100 13.1 19.5 20,900 41,000 Northwest 2,900 4,900 2,900 4,200 13.5 18.3 39,100 76,700 Other District 1,100 1,100 1,100 800 11.7 16.6 12,900 13,300 Minnesota 4,000 6,000 4,000 5,000 13.0 18.0 52,000 90,000 1/ Counties with less than 1,000 acres planted for all purposes are not listed separately, but are combined under Other Counties or Other Districts. Counties denoted with “--” are also less than 1,000 acres and are included in Other Counties.

2003 Minnesota Agricultural Statistics
57
SWEET CORN FOR PROCESSING: Acreage, Yield, and Production, by County and District, Minnesota, 2001-02
Planted Acreage Harvested Acreage Yield Per
Harvested Acre Production County and District 1/ 2001 2002 2001 2002 2001 2002 2001 2002
---------- Acres --------- -------- Acres -------- ----- Tons ----- ----------- Tons ----------- Pope 1,600 2,000 1,500 1,900 6.13 6.89 9,200 13,100 Other Counties 1,100 200 1,100 200 6.55 6.00 7,200 1,200 West Central 2,700 2,200 2,600 2,100 6.31 6.81 16,400 14,300 Kandiyohi 2,000 3,100 2,000 3,000 6.50 7.10 13,000 21,300 McLeod 2,200 2,100 2,200 2,000 5.50 6.80 12,100 13,600 Meeker 1,500 1,300 1,500 1,200 6.00 6.58 9,000 7,900 Renville 25,400 27,300 25,100 25,700 6.59 6.50 165,520 167,030 Sherburne 1,000 -- 1,000 -- 7.00 -- 7,000 -- Sibley 9,400 10,200 9,300 9,600 6.51 5.80 60,500 55,700 Stearns 1,000 1,300 1,000 1,200 6.30 6.00 6,300 7,200 Other Counties 1,000 1,600 1,000 1,500 6.40 6.67 6,400 10,000 Central 43,500 46,900 43,100 44,200 6.49 6.40 279,820 282,730 Redwood 6,200 6,300 6,000 6,000 5.90 6.60 35,400 39,600 Other Counties 200 100 200 100 6.00 6.00 1,200 600 Southwest 6,400 6,400 6,200 6,100 5.90 6.59 36,600 40,200 Blue Earth 2,100 2,500 2,100 2,300 4.90 6.39 10,300 14,700 Brown 8,400 8,600 8,200 8,200 6.40 5.90 52,500 48,400 Faribault 5,300 7,300 5,100 6,400 5.90 6.80 30,100 43,500 Freeborn 7,000 10,000 6,900 9,200 6.41 7.21 44,200 66,300 Le Sueur 1,400 1,800 1,400 1,600 5.57 6.38 7,800 10,200 Martin 2,000 2,100 2,000 1,900 5.90 7.00 11,800 13,300 Nicollet 3,500 3,800 3,500 3,600 5.91 5.80 20,700 20,900 Steele 4,500 8,100 4,400 6,800 5.59 6.40 24,600 43,500 Waseca 6,000 7,000 5,900 6,700 5.90 6.60 34,800 44,200 Other Counties 1,100 1,400 1,100 1,300 5.55 6.62 6,100 8,600 South Central 41,300 52,600 40,600 48,000 5.98 6.53 242,900 313,600 Dakota 5,200 5,600 5,200 5,200 5.00 5.81 26,000 30,200 Dodge 4,600 3,700 4,600 3,300 5.80 7.09 26,700 23,400 Fillmore 1,000 -- 1,000 -- 6.20 -- 6,200 -- Goodhue 5,400 5,600 5,300 5,100 5.70 6.10 30,200 31,100 Mower 7,500 10,000 7,400 9,100 6.20 7.20 45,900 65,500 Olmsted 8,700 8,200 8,600 7,700 5.60 6.21 48,200 47,800 Wabasha 4,300 4,600 4,300 4,200 6.51 5.69 28,000 23,900 Other Counties 500 1,400 500 1,200 5.80 6.42 2,900 7,700 Southeast 37,200 39,100 36,900 35,800 5.80 6.41 214,100 229,600 Other Districts 900 800 800 700 6.13 6.00 4,900 4,200 Minnesota 132,000 148,000 130,200 136,900 6.10 6.46 794,720 884,630 1/ Counties with less than 1,000 acres planted for all purposes are not listed separately, but are combined under Other Counties or Other Districts. Counties denoted with “--” are also less than 1,000 acres and are included in Other Counties.
CROP COUNTY ESTIMATES

2003 Minnesota Agricultural Statistics
58
GREEN PEAS FOR PROCESSING: Acreage, Yield, and Production, by County and District, Minnesota, 2001-02
Planted Acreage Harvested Acreage Yield Per
Harvested Acre Production County and District 1/ 2001 2002 2001 2002 2001 2002 2001 2002
------- Acres ------- ------- Acres ------- ----- Tons ----- ---------- Tons ---------- Other Counties 1,400 1,200 1,300 1,100 1.54 1.09 2,000 1,200 West Central 1,400 1,200 1,300 1,100 1.54 1.09 2,000 1,200 Kandiyohi -- 1,300 -- 1,200 -- 1.00 -- 1,200 McLeod 1,300 1,600 1,200 1,200 1.08 0.92 1,300 1,100 Meeker -- 1,900 -- 1,600 -- 1.19 -- 1,900 Renville 10,500 13,100 10,300 12,500 1.40 1.10 14,400 13,770 Sibley 4,500 5,500 4,200 5,200 1.50 0.90 6,300 4,700 Other Counties 1,600 1,100 1,600 1,100 1.66 1.09 2,650 1,200 Central 17,900 24,500 17,300 22,800 1.42 1.05 24,650 23,870 Redwood 2,300 3,200 2,200 2,700 2.00 1.70 4,400 4,600 Other Counties 100 100 100 100 1.00 1.00 100 100 Southwest 2,400 3,300 2,300 2,800 1.96 1.68 4,500 4,700 Blue Earth 1,200 1,200 1,200 1,100 1.00 1.36 1,200 1,500 Brown 5,300 4,200 5,200 4,000 1.60 1.60 8,300 6,400 Faribault 2,700 3,900 2,600 3,700 0.92 1.30 2,400 4,800 Freeborn 2,500 1,900 2,400 1,800 1.00 1.61 2,400 2,900 Le Sueur 1,100 1,500 1,000 1,400 1.20 1.29 1,200 1,800 Martin 1,800 2,600 1,700 2,500 1.12 1.28 1,900 3,200 Nicollet 1,300 1,900 1,200 1,800 1.58 0.72 1,900 1,300 Steele 4,000 4,500 3,900 3,900 1.41 1.31 5,500 5,100 Waseca 2,900 2,600 2,800 2,300 0.89 1.48 2,500 3,400 Other Counties 1,000 1,000 1,000 1,000 1.50 1.40 1,500 1,400 South Central 23,800 25,300 23,000 23,500 1.25 1.35 28,800 31,800 Dakota 5,200 6,800 5,000 6,200 1.00 1.21 5,000 7,500 Dodge 1,700 2,000 1,600 1,900 1.00 1.58 1,600 3,000 Goodhue 2,500 3,000 2,400 2,700 1.88 1.19 4,500 3,200 Mower 5,700 6,100 5,600 5,600 1.30 1.70 7,300 9,500 Olmsted 5,100 4,400 5,000 4,200 1.90 1.71 9,500 7,200 Wabasha 1,900 1,900 1,900 1,800 2.37 1.78 4,500 3,200 Other Counties 1,700 2,000 1,700 2,000 1.76 1.60 3,000 3,200 Southeast 23,800 26,200 23,200 24,400 1.53 1.51 35,400 36,800 Minnesota 69,300 80,500 67,100 74,600 1.42 1.32 95,350 98,370 1/ Counties with less than 1,000 acres planted for all purposes are not listed separately, but are combined under Other Counties or Other Districts. Counties denoted with “--“ are also less than 1,000 acres and are included in Other Counties.
CROP COUNTY ESTIMATES
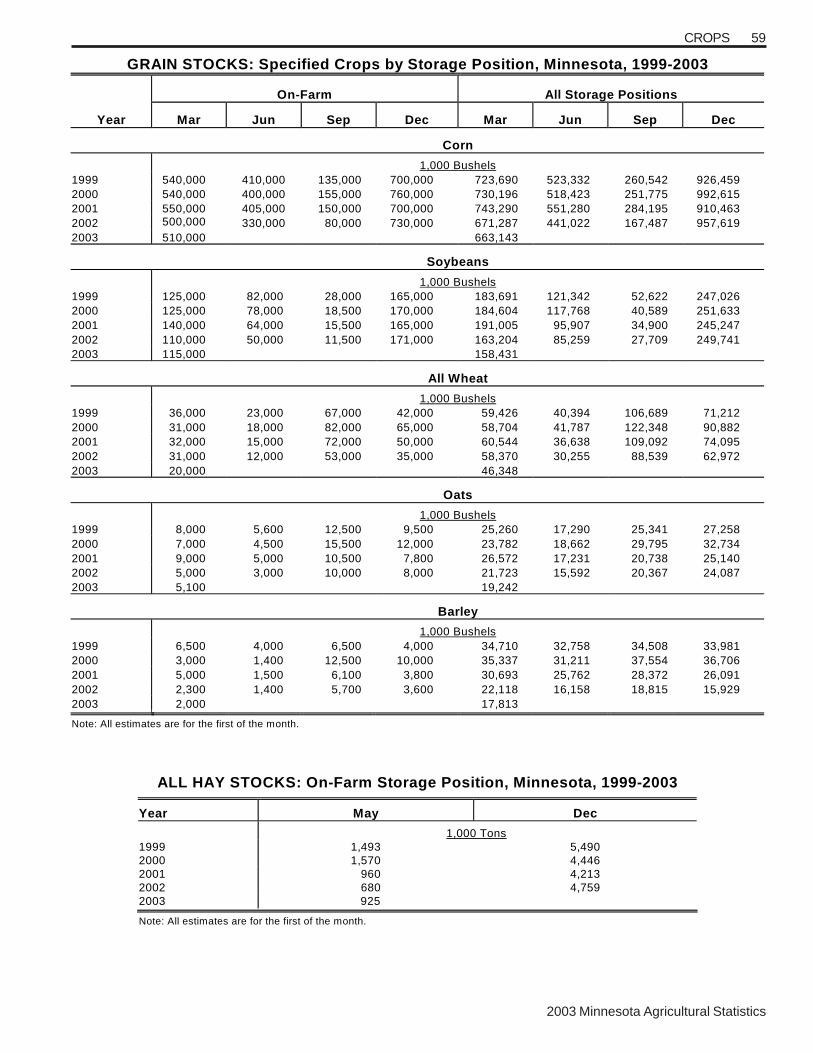
2003 Minnesota Agricultural Statistics
59CROPS
GRAIN STOCKS: Specified Crops by Storage Position, Minnesota, 1999-2003
On-Farm All Storage Positions
Year Mar Jun Sep Dec Mar Jun Sep Dec
Corn
1,000 Bushels 1999 540,000 410,000 135,000 700,000 723,690 523,332 260,542 926,459 2000 540,000 400,000 155,000 760,000 730,196 518,423 251,775 992,615 2001 550,000 405,000 150,000 700,000 743,290 551,280 284,195 910,463 2002 500,000
4 330,000 80,000 730,000 671,287 441,022 167,487 957,619
2003 510,000 663,143
Soybeans
1,000 Bushels 1999 125,000 82,000 28,000 165,000 183,691 121,342 52,622 247,026 2000 125,000 78,000 18,500 170,000 184,604 117,768 40,589 251,633 2001 140,000 64,000 15,500 165,000 191,005 95,907 34,900 245,247 2002 110,000 50,000 11,500 171,000 163,204 85,259 27,709 249,741 2003 115,000 158,431
All Wheat
1,000 Bushels 1999 36,000 23,000 67,000 42,000 59,426 40,394 106,689 71,212 2000 31,000 18,000 82,000 65,000 58,704 41,787 122,348 90,882 2001 32,000 15,000 72,000 50,000 60,544 36,638 109,092 74,095 2002 31,000 12,000 53,000 35,000 58,370 30,255 88,539 62,972 2003 20,000 46,348
Oats
1,000 Bushels 1999 8,000 5,600 12,500 9,500 25,260 17,290 25,341 27,258 2000 7,000 4,500 15,500 12,000 23,782 18,662 29,795 32,734 2001 9,000 5,000 10,500 7,800 26,572 17,231 20,738 25,140 2002 5,000 3,000 10,000 8,000 21,723 15,592 20,367 24,087 2003 5,100 19,242
Barley
1,000 Bushels 1999 6,500 4,000 6,500 4,000 34,710 32,758 34,508 33,981 2000 3,000 1,400 12,500 10,000 35,337 31,211 37,554 36,706 2001 5,000 1,500 6,100 3,800 30,693 25,762 28,372 26,091 2002 2,300 1,400 5,700 3,600 22,118 16,158 18,815 15,929 2003 2,000 17,813
Note: All estimates are for the first of the month.
ALL HAY STOCKS: On-Farm Storage Position, Minnesota, 1999-2003
Year May Dec
1,000 Tons 1999 1,493 5,490 2000 1,570 4,446 2001 960 4,213 2002 680 4,759 2003 925 2003 Note: All estimates are for the first of the month.

CROPS60
2003 Minnesota Agricultural Statistics
Corn: Percent Marketed by Month,
Minnesota, 1998-2002 Month 1998-99 1999-00 2000-01 2001-02 Percent October 13 13 20 10 November 9 9 8 10 December 6 5 8 4 January 7 9 11 7 February 6 5 5 5 March 7 6 6 4 April 4 4 5 4 May 5 5 5 6 June 7 8 6 13 July 11 10 9 15 August 15 13 11 13 September 10 13 6 9
All Wheat: Percent Marketed by Month, Minnesota, 1998-2002
Month 1998-99 1999-00 2000-01 2001-02 Percent July 9 8 6 5 August 15 17 15 17 September 7 9 7 8 October 7 4 6 5 November 8 7 8 11 December 12 11 13 11 January 5 11 13 8 February 5 7 7 6 March 9 8 5 5 April 7 7 10 4 May 6 6 6 7 June 10 5 4 13
Barley: Percent Marketed by Month, Minnesota, 1998-2002
Month 1998-99 1999-00 2000-01 2001-02 Percent July 19 20 9 19 August 8 18 12 20 September 6 8 3 7 October 4 4 2 4 November 6 5 5 4 December 11 4 14 7 January 11 8 19 13 February 12 9 12 8 March 8 4 10 3 April 3 7 8 5 May 4 2 5 3 June 8 11 1 7
Note: Months are ordered according to crop marketing year.
Soybeans: Percent Marketed by Month,
Minnesota, 1998-2002 Month 1998-99 1999-00 2000-01 2001-02 Percent September 11 9 12 3 October 20 24 19 20 November 7 5 7 7 December 5 6 8 9 January 7 11 13 12 February 5 6 6 6 March 8 7 6 8 April 6 5 5 4 May 4 5 7 5 June 7 6 6 9 July 9 7 6 10 August 11 9 5 7
Oats: Percent Marketed by Month, Minnesota, 1998-2002
Month 1998-99 1999-00 2000-01 2001-02 Percent July 24 14 22 12 August 21 34 30 30 September 5 5 6 5 October 6 6 4 5 November 5 1 3 4 December 5 2 2 9 January 5 6 6 6 February 7 4 3 6 March 5 9 6 4 April 8 5 6 9 May 3 5 9 5 June 6 9 3 5
Dry Edible Beans: Percent Marketed by Month, Minnesota, 1998-2002
Month 1998-99 1999-00 2000-01 2001-02 Percent September 45 40 16 6 October 11 22 19 39 November 9 5 10 10 December 9 5 5 17 January 6 2 5 12 February 5 3 9 3 March 2 6 6 4 April 2 5 7 4 May 6 6 6 2 June 3 3 5 2 July 1 2 8 1 August 1 1 4 --

MINNESOTA FERTILIZER USAGE Minnesota fertilizer consumption totaled 2.1 million tons for the year ending June 30, 2002 an increase of 10% from the previous year. Minnesota was the 10th ranking state in total tonnage. Usage of the primary nutrients is shown on the chart; nitrogen increased 9% from 2001, phosphate (P205) usage increased 13%, and potash (K20) usage increased 23%. Fertilizer consumption represents all commercial fertilizer sold or shipped for farm and non-farm use as fertilizer. Source: The Association of American Plant Food Control Officials, University of Kentucky
CULTIVATED WILD RICE W ild Rice is the only cereal grain native to the United States. In 1977, the State Legislature designated wild rice as Minnesota’s official State Grain. The cultivated crop is grown in the northern one-third of the state on an estimated 18,000 acres in the counties of Aitkin, Beltrami, Clearwater, Crow W ing, Itasca, Koochiching, Lake of the W oods, Marshall, Polk, Pennington, and Red Lake. In 2002, cultivated wild rice production was 5.61 million processed pounds, up 35% from 2001. Source: Minnesota Cultivated W ild Rice Council
CROPS 61
2003 Minnesota Agricultural Statistics
MINNESOTA'S USAGE OF PRIMARY NUTRIENTS AS FERTILIZER
0100200300400500600700800
1998 1999 2000 2001 2002
(000
) T
on
s
Nitrogen Phosphate Potash

2003 Minnesota Agricultural Statistics
62 CROPS
FARM LABOR
Regional and national data for hiredworkers, hours worked, and wage ratesare published quarterly. Minnesota isincluded in the Lake Region which alsoincludes Michigan and Wisconsin.Information from the Farm Labor report isused to determine farm labor’s effect onproduction costs, evaluate the impact ofwage rate changes, and to define thenation’s need for farm labor.
Farm Labor estimates are made at theU.S. and regional levels for January,April, July, and October for the weekincluding the 12th of the month. Statelevel wage rate information is availableannually for the October survey period.
HIRED WORKERS 1/: Annual Average Wage Rates, Minnesota 1998-2002
Year All Hired Field Field & Livestock Dollars per Hour 1998 8.68 8.10 8.01 1999 8.53 8.67 8.26 2000 8.91 8.67 8.38 2001 9.53 9.90 9.26 2002 9.73 9.76 9.12
1/ Excludes Agricultural Service Workers.
FARM LABOR: Farm Workers and Wages by Type of Work, Lake Region, 2001-2003 1/
Hired Workers and Hours Worked Wages, Type of Work Expected To Be
Employed
Year and Month
Number of
Workers 150 Days or More
149 Days or Less
Number of Hours Worked All Hired Field Livestock
Field & Livestock
---------- 1,000 Workers ---------- Hours ----------------- Dollars Per Hour ----------------- 2001 January 38 34 4 34.6 9.53 9.12 8.26 8.57 April 43 34 9 36.5 9.57 8.93 8.82 8.87 July 76 46 30 36.9 8.38 8.21 7.66 8.00 October 74 42 32 40.7 9.21 9.14 8.59 8.97 2002 January 38 33 5 33.5 9.91 10.22 8.26 8.94 April 55 42 13 36.2 9.88 9.43 8.44 9.01 July 62 44 18 34.8 8.33 7.85 7.85 7.85 October 64 41 23 34.7 9.73 9.28 9.11 9.21 2003 January 45 40 5 31.7 10.54 10.51 9.44 9.65 April 56 36 20 37.0 9.90 9.31 9.20 9.26 1/ Lake Region includes Minnesota, Michigan, and Wisconsin.
ALL HIRED WORKER 1/ Wage Rate Comparison
$6.50
$7.00
$7.50
$8.00
$8.50
$9.00
$9.50
$10.00
$10.50
$11.00
Jan
01
Apr 0
1Ju
l 01
Oct 01
Jan
02
Apr 0
2Ju
l 02
Oct 02
Jan
03
Apr 0
3
Su
rvey
wee
k $
per
ho
ur
Lake Region United States
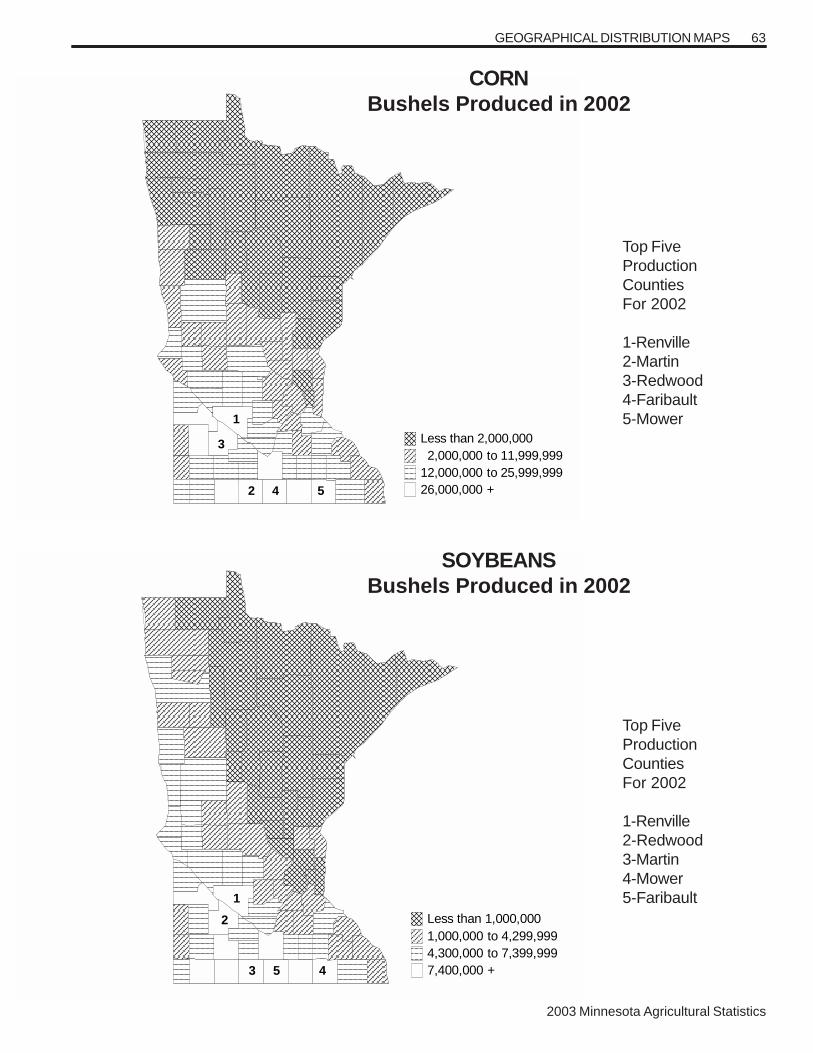
2003 Minnesota Agricultural Statistics
63
53
2
4
1
Less than 1,000,0001,000,000 to 4,299,9994,300,000 to 7,399,9997,400,000 +
3
542
1
Less than 2,000,0002,000,000 to 11,999,999
12,000,000 to 25,999,99926,000,000 +
GEOGRAPHICAL DISTRIBUTION MAPS
CORNBushels Produced in 2002
Top FiveProductionCountiesFor 2002
1-Renville2-Martin3-Redwood4-Faribault5-Mower
Top FiveProductionCountiesFor 2002
1-Renville2-Redwood3-Martin4-Mower5-Faribault
SOYBEANSBushels Produced in 2002

2003 Minnesota Agricultural Statistics
64
4
2
3
5
1
Less than 150,000150,000 to 999,999
1,000,000 to 5,499,9995,500,000 +
4
5
2
1
3
Less than 40,00040,000 to 59,99960,000 to 149,999
150,000 +
GEOGRAPHICAL DISTRIBUTION MAPS
ALL WHEATBushels Produced in 2002
ALL HAYTons Produced in 2002
Top FiveProductionCountiesFor 2002
1-Polk2-Marshall3-Clay4-Wilkin5-Kittson
Top FiveProductionCountiesFor 2002
1-Stearns2-Otter Tail3-Winona4-Fillmore5-Morrison
64

2003 Minnesota Agricultural Statistics
65
3
5
2
1
3
Less than 14,00014,000 to 27,99928,000 to 55,99956,000 +
4
23
1
5
Less than 5,0005,000 to 29,999
30,000 to 189,999190,000 +
GEOGRAPHICAL DISTRIBUTION MAPS
ALL CATTLE & CALVESNumber of Head, January 1, 2003
ALL HOGSNumber of Head, December 1, 2002
Top FiveAll HogCountiesFor 2002
1-Martin2-Blue Earth3-Brown4-Nicollet5-Renville
Top FiveAll Cattle& CalvesCountiesFor 2002
1-Stearns2-Otter Tail3-Fillmore*3-Winona*5-Morrison*Tied for 3rd
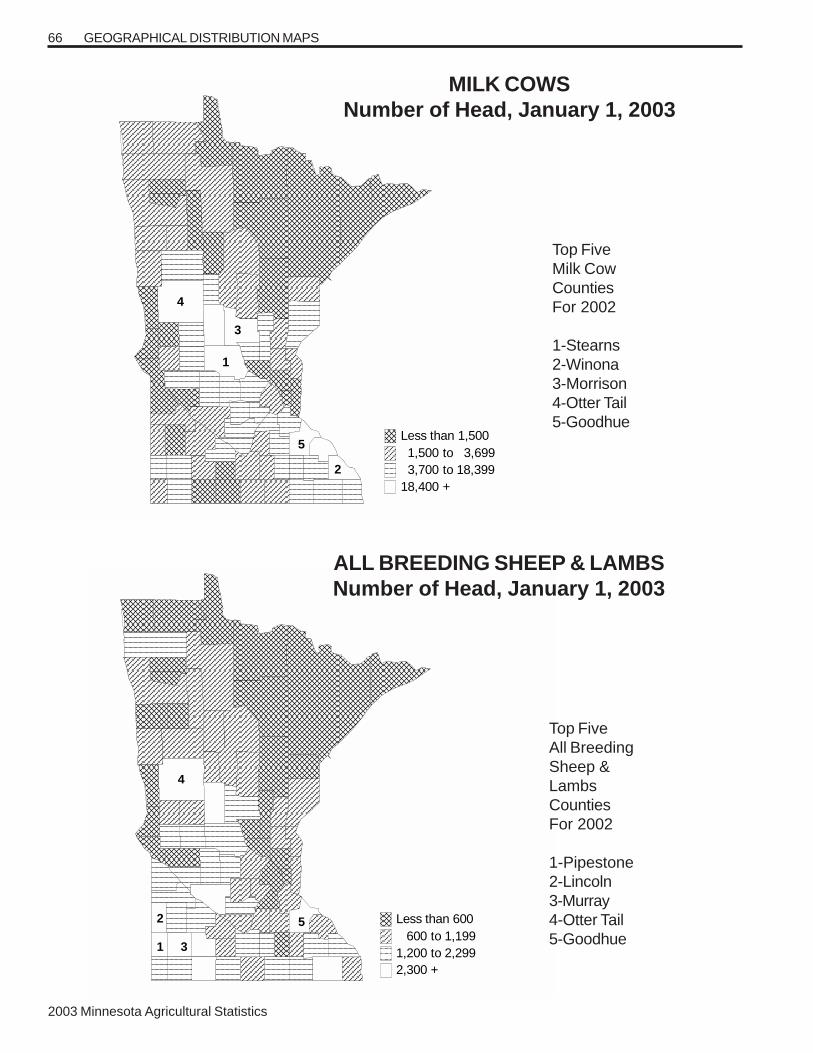
2003 Minnesota Agricultural Statistics
66
3
5
4
1
2
Less than 1,5001,500 to 3,6993,700 to 18,399
18,400 +
5
1 3
2
4
Less than 600600 to 1,199
1,200 to 2,2992,300 +
GEOGRAPHICAL DISTRIBUTION MAPS
MILK COWSNumber of Head, January 1, 2003
ALL BREEDING SHEEP & LAMBSNumber of Head, January 1, 2003
Top FiveMilk CowCountiesFor 2002
1-Stearns2-Winona3-Morrison4-Otter Tail5-Goodhue
Top FiveAll BreedingSheep &LambsCountiesFor 2002
1-Pipestone2-Lincoln3-Murray4-Otter Tail5-Goodhue

2003 Minnesota Agricultural Statistics
67LIVESTOCK, DAIRY, POULTRY
LIVESTOCK SUMMARY Cattle numbers on Minnesota farms on January 1, 2003, decreased by 3% from the January 1, 2002 inventory. Minnesota’s 2002 calf crop at 880,000 was down 1% from 2001. Meanwhile, sheep and lambs were down 9% from January 1, 2002. The inventory of all hogs on December 1, 2002, was up 3% from a year earlier. Farrowings at 1,060,000 in 2002 were unchanged from the previous year. A crop of 9,409,000 pigs was produced in the state during 2002, down 1% from 2001. The average annual litter rate of 8.88 was down from 9.00 in 2001. All chickens on farms were down 7% from a year earlier. The combined value of all livestock and poultry on Minnesota farms was $2.4 billion at the end of 2002. All cattle and calves, valued at $1.9 billion, were down 7% from a year earlier. The value of hogs on hand on December 1, 2002, accounted for $502 million, down 4%; all sheep and lambs, $14.2 million, down 5%; and all chickens, $19 million, down 24%. Cattle operations were the same as last year while hog operations were down 300. Operations with milk cows decreased 600 and beef cows remained the same. All sheep operations were down 100.
�
LIVESTOCK: January 1 Inventory, Minnesota, 1999-2003
Year�All
Cattle�Cattle on
Feed� Milk Cows� Beef Cows� Hogs 1/�All
Sheep�
1,000 Head�1999� 2,500� 270� 545� 385� 5,700� 175�2000� 2,550 285 540 400 5,500 165 2001� 2,550 290 520 410 5,800 170 2002 2,550 270 500 410 5,700 160 2003 2,470 270 480 400 6,000 145
1/ Inventory as of December 1 previous year.
LIVESTOCK: Number of Operations, Minnesota, 1998-2002 1/� Number of Operations With:
Year All
Cattle� Milk Cows� Beef Cows� Hogs�All
Sheep�
Operations 1998� 31,000� 9,700� 15,800� 8,500� 2,600�1999� 30,000 9,100 15,800 7,500 2,700 2000� 30,000 8,500 15,800 7,300 2,600 2001 29,000 7,800 15,500 6,500 2,400 2002 29,000 7,200 15,500 6,200 2,300
1/ An operation is any farm having one or more head of livestock on hand at any time during the year. Addition may exceed total farms in the state.
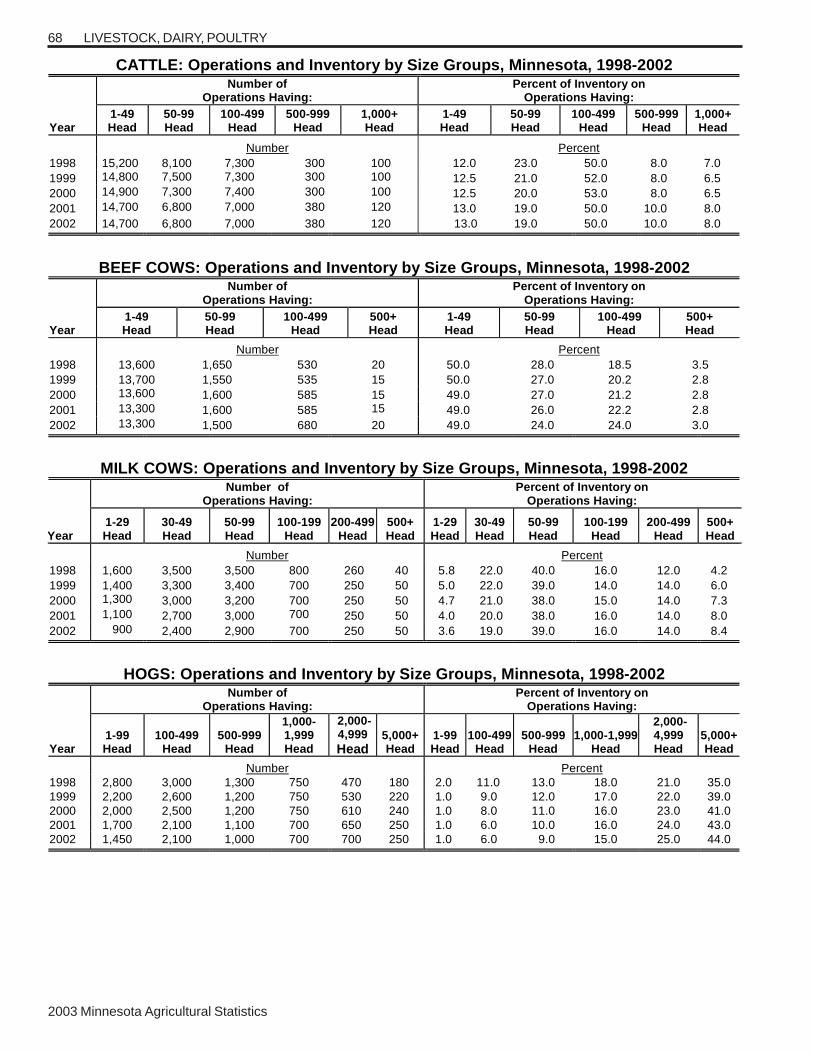
2003 Minnesota Agricultural Statistics
68 LIVESTOCK, DAIRY, POULTRY
CATTLE: Operations and Inventory by Size Groups, Minnesota, 1998-2002 Number of
Operations Having:�
Percent of Inventory on Operations Having:
�
Year 1-49 Head
�
50-99 Head
�
100-499 Head
�
500-999 Head
�
1,000+ Head
�
1-49 Head
�
50-99 Head
�
100-499 Head
�
500-999 Head
�
1,000+ Head
�
� Number� Percent 1998� 15,200 8,100 7,300 300 100 12.0� 23.0� 50.0� 8.0� 7.0�1999� 14,800
7,500 7,300 300 100 12.5 21.0 52.0 8.0 6.5
2000 14,900 7,300 7,400 300 100 12.5 20.0 53.0 8.0 6.5 2001 14,700 6,800 7,000 380 120 13.0 19.0 50.0 10.0 8.0 2002 14,700 6,800 7,000 380 120 13.0 19.0 50.0 10.0 8.0
BEEF COWS: Operations and Inventory by Size Groups, Minnesota, 1998-2002
�
Number of Operations Having:
�
Percent of Inventory on Operations Having:
�
Year�
1-49 Head
�
50-99 Head
�
100-499 Head
�
500+ Head
�
1-49 Head
�
50-99 Head
�
100-499 Head
�
500+ Head
�
� Number�
Percent�
1998� 13,600 1,650 530 20 50.0� 28.0� 18.5� 3.5�1999� 13,700 1,550 535 15 50.0 27.0 20.2 2.8 2000 13,600
1,600 585 15 49.0 27.0 21.2 2.8
2001� 13,300 1,600 585 15
49.0 26.0 22.2 2.8 2002 13,300 1,500 680 20 49.0 24.0 24.0 3.0
MILK COWS: Operations and Inventory by Size Groups, Minnesota, 1998-2002
Number of
Operations Having:�
Percent of Inventory on Operations Having:
�
Year 1-29 Head
�
30-49 Head
�
50-99 Head
�
100-199 Head
�
200-499�
Head 500+ Head
1-29 Head
30-49 Head
�
50-99 Head
�
100-199 Head
�
200-499 Head
�
500+ Head
�
� � Number Percent 1998� 1,600 3,500 3,500 800 260� 40 5.8� 22.0� 40.0� 16.0� 12.0 4.2 1999
�
1,400 3,300 3,400 700 250 50 5.0 22.0 39.0 14.0 14.0 6.0 2000 1,300
3,000 3,200 700 250 50 4.7 21.0 38.0 15.0 14.0 7.3
2001� 1,100 2,700 3,000 700
250 50 4.0 20.0 38.0 16.0 14.0 8.0 2002 900 2,400 2,900 700 250 50 3.6 19.0 39.0 16.0 14.0 8.4
HOGS: Operations and Inventory by Size Groups, Minnesota, 1998-2002
�
Number of Operations Having:
�
Percent of Inventory on Operations Having:
�
Year 1-99 Head
�
100-499 Head
�
500-999 Head
�
1,000-1,999 Head
�
2,000- 4,999
�
Head 5,000+ Head
1-99 Head
�
100-499 Head
�
500-999 Head
�
1,000-1,999 Head
�
2,000- 4,999 Head
5,000+ Head
� Number�
Percent�
1998�
2,800 3,000 1,300 750 470 180 2.0 11.0 13.0 18.0 21.0 35.0 1999� 2,200 2,600 1,200 750 530 220 1.0 9.0 12.0 17.0 22.0 39.0 2000 2,000 2,500 1,200 750 610 240 1.0 8.0 11.0 16.0 23.0 41.0 2001 1,700 2,100 1,100 700 650 250 1.0 6.0 10.0 16.0 24.0 43.0 2002 1,450 2,100 1,000 700 700 250 1.0 6.0 9.0 15.0 25.0 44.0
2003 Minnesota Agricultural Statistics
69
LIVESTOCK, DAIRY, AND POULTRY: Production Records, Minnesota and United States
Item Number Record High
Date� Item Number�Record High
Date�All Cattle Inventories � Jan 1,� Annual Pig Crop � �
Minnesota� 4,518,000� 1964 & 1965� Minnesota� 9,612,000� 1998� United States� 132,028,000� 1975� United States � 121,807,000� 1944
� � � � � �
Beef Cows��
Jan 1,� Annual Milk�� �
Minnesota� 751,000� 1976� Production�� �
United States� 45,712,000� 1975� (Mil. Lbs.):�� �
� � �
Minnesota� 11,155� 1964�Milk Cows�
�
Jan 1,� United States� 169,758 2002 Minnesota� 1,893,000� 1934�
� � �
United States� 27,770,000� 1945� Milk Production�� �
� � �
Per Cow (Lbs.)�� �
Cattle on Feed��
Jan 1,� Minnesota� 17,777 2000 Minnesota� 589,000� 1970� United States� 18,571 2002 United States
14,432,000� 1973
� � �
� � �
All Sheep �� �
Calves Born�� �
And Lambs��
Jan 1,� Minnesota� 1,867,000� 1944� Minnesota � 1,496,000� 1943� United States� 50,873,000� 1974� United States� 56,213,000� 1942�� � � � � �
All Hogs by Qtr �� �
Breeding Sheep��
Jan 1,� March 1 1/�
� �
Minnesota� 1,201,000� 1942 & 1943� Minnesota� 6,100,000� 2003� United States� 49,346,000� 1942� June 1 2/�
� � � � �
Minnesota� 5,928,000� 1951� Lamb Crop�� �
September 1 1/�� �
Minnesota� 1,015,000� 1942� Minnesota� 6,100,000� 2002� United States� 32,610,000� 1941
December 1 1/�� � � � �
Minnesota� 6,000,000� 2002� All Chickens��
Dec 1,� United States� 83,741,000� 1944� Minnesota� 31,742,000� 1944�� � �
United States� 582,197,000� 1944�Annual Pigs �
� � � � �
Per Litter�� �
Eggs Per Layer�� �
Minnesota� 9.00 2001 Minnesota� 266� 1998� United States� 8.83 2000 United States� 257 1 1999, 2000 � � � � �
& 2002�� � �
Turkeys Raised�� �
� � �
Minnesota � 46,300,000� 1990�� � �
United States� 302,713,000� 1996�1/ March 1, September 1, and December 1 data available since 1954. 2/ June 1 estimates were started in 1950.�
�
�
LIVESTOCK, DAIRY, POULTRY

2003 Minnesota Agricultural Statistics
70 LIVESTOCK, DAIRY, POULTRY
LIVESTOCK AND POULTRY: Inventory and Values, Minnesota, 2001-2003 Number on Farms
�
Value per Head�
Total Inventory Value�
Class� 2001
�
2002�
2003 2001�
2002�
2003 2001�
2002�
2003
------- 1,000 Head -----� ---------- Dollars -----------� --------------- 1,000 Dollars ------------�
All Cattle & Calves, Jan 1� 2,550 2,550 2,470 750.00 800.00 770.00 1,912,500 2,040,000 1,901,900
Total Cows That Have Calved� 930 910 880 � � � � � �
Beef Cows� 410 410 400 � � � � � �
Milk Cows� 520 500 480 � � � � � �
Total Heifers 500 Lbs. and Over� 570 575 575 � � � � � �
Beef Replacement� 100 100 100 � � � � � �
Milk Replacement� 290 295 295 � � � � � �
Other� 180 180 180 � � � � � �
Steers 500 Lbs. and Over
�
470 480 470 � � � � � �
Bulls 500 Lbs. and Over� 40 35 35 � � � � � �
Calves Under 500 Lbs.� 540 550 510 � � � � � �
Cattle & Calves on Feed, Jan 1�
290 270 270 � � � � � �
Calf Crop� 890 880 -- � � � � � �
All Hogs & Pigs, Dec 1 1/ 5,800 5,800 6,000 91.00 90.00 85.00 527,800 522,000 501,500
Market Hogs & Pigs, Dec 1 1/� 5,200 5,230 5,420
Breeding Hogs, Dec 1 1/� 600 570 580
Annual Pig Crop�
9,541 9,409 --
All Sheep & Lambs, Jan 1 170 160 145 100.00 93.00 98.00 17,000 14,880 14,210
Breeding Sheep & Lambs� 110 115 105
Ewes 1 Year and Older� 90 95 85 � � � � � �
Rams 1 Year and Older� 5 5 5 � � � � � �
Replacement Lambs� 15 15 15 � � � � � �
Market Sheep & Lambs� 60 45 40 � � � � � �
Lambs Under 65 Lbs.� 15 11 9 � � � � � �
Lambs 65-84 Lbs.� 12 9 8 � � � � � �
Lambs 85-105 Lbs.� 16 12 11 � � � � � �
Lambs Over 105 Lbs.�
16 12 11 � � � � � �
Sheep� 1 1 1 � � � � � �
Lamb Crop� 155 145 -- � � � � � �
All Chickens, Dec 1 1/ 2/ 15,815 15,803 14,685 1.80 1.60 1.30 28,467 25,285 19,091
Total Layers� 12,480 12,215 11,460 � � � � � �
Pullets 13 Weeks Old but Not of Laying Age
�
1,730 2,090 820 � � � � � �
Pullets Under 13 Weeks Old� 1,542 1,439 2,355 � � � � � �
Other Chickens� 63 59 50 � � � � � �
1/ December 1 preceding year. �2/ Excludes commercial broilers.
�
2003 Minnesota Agricultural Statistics
71LIVESTOCK, DAIRY, POULTRY
CATTLE AND CALVES: Inventory, Supply, and Disposition, Minnesota, 1998-2003
Marketings 2/� Deaths�
Year�
All Cattle and
Calves 1/�Calf Crop�
Cattle On
Feed 1/�Inship-ments� Cattle� Calves�
Farm Slaughter
3/� Cattle� Calves�
� 1,000 Head�1998� 2,500� 900� 265� 370� 982� 127� 6� 50� 105�1999� 2,500� 900� 270� 370� 932� 132� 6� 50� 100�2000� 2,550 910 285 425 1,032 142 6 55 100 2001 2,550 890 290 360 957 137 6 50 100 2002 2,550 880 270 350 1017 137 6 55 95 2003 2,470 -- 270 -- -- -- -- -- -- 1/ All cattle and calves and cattle on feed inventory numbers refer to January 1.
2/ Includes custom slaughter for use on farms where produced and state outshipments, but excludes interfarm sales within the state. 3/ Excludes custom slaughter for farmers at commercial establishments.�
CATTLE AND CALVES: Production and Income, Minnesota, 1998-2002 Average Price per
100 Pounds�Year
Production 1/�
Marketings 2/� Cattle� Calves�
Value of Production�
Cash Receipts
3/�
Value of Home
Consumption�Gross
Income�
� ------ 1,000 Pounds ------� ------ Dollars ----- ------------------------ 1,000 Dollars ---------------------------- �1998� 1,070,366� 1,300,375� 57.30� 68.80� 602,003� 749,643� 11,867� 761,510�1999� 1,083,421 1,265,850 58.50 79.70 625,407 749,479 12,593 762,072 2000 1,157,288 1,415,800 62.20 94.80 714,369 896,602 14,117 910,719 2001 1,106,915 1,328,400 65.90 95.20 726,006 890,842 15,134 905,976 2002 1,162,595 1,420,800 60.00 85.40 690,713 866,196 14,225 880,421
1/ Adjustments made for changes in inventory and for inshipments. 2/ Excludes custom slaughter for use on farms where produced and interfarm sales within the state. 3/ Receipts from marketings and sale of farm slaughter.�
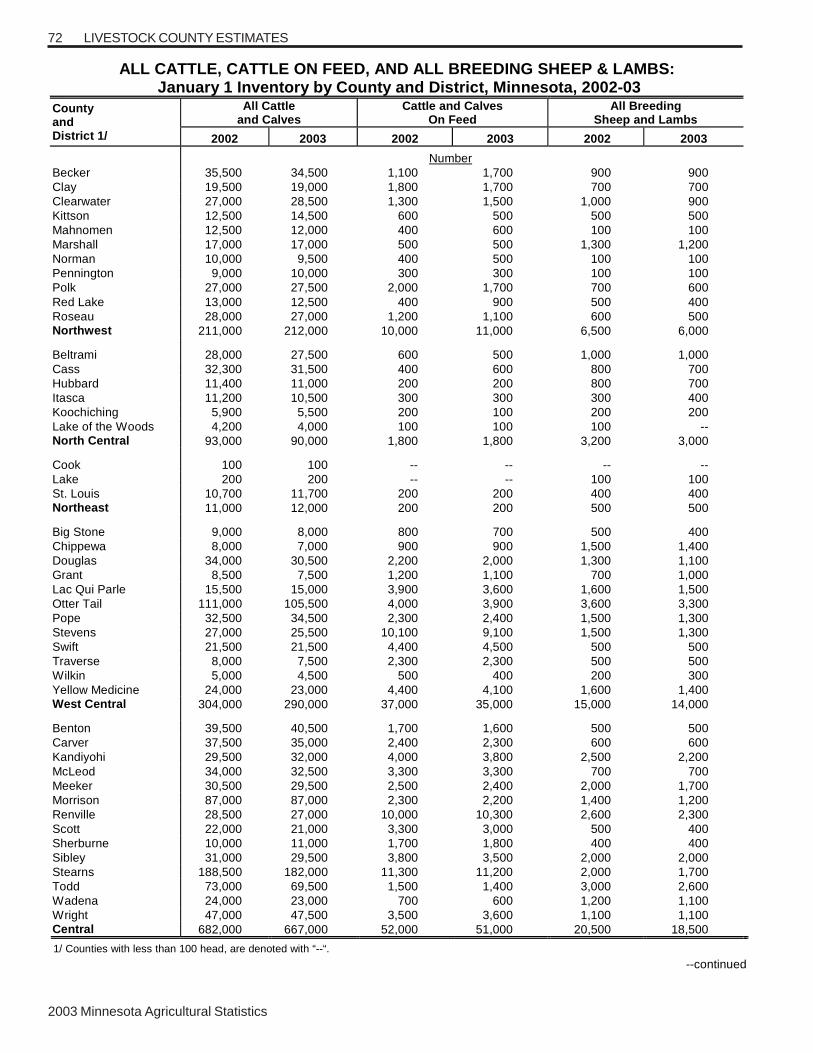
2003 Minnesota Agricultural Statistics
72 LIVESTOCK COUNTY ESTIMATES
ALL CATTLE, CATTLE ON FEED, AND ALL BREEDING SHEEP & LAMBS: January 1 Inventory by County and District, Minnesota, 2002-03
All Cattle and Calves
Cattle and Calves On Feed
All Breeding Sheep and Lambs
County and District 1/ 2002 2003 2002 2003 2002 2003
Number Becker 35,500 34,500 1,100 1,700 900 900 Clay 19,500 19,000 1,800 1,700 700 700 Clearwater 27,000 28,500 1,300 1,500 1,000 900 Kittson 12,500 14,500 600 500 500 500 Mahnomen 12,500 12,000 400 600 100 100 Marshall 17,000 17,000 500 500 1,300 1,200 Norman 10,000 9,500 400 500 100 100 Pennington 9,000 10,000 300 300 100 100 Polk 27,000 27,500 2,000 1,700 700 600 Red Lake 13,000 12,500 400 900 500 400 Roseau 28,000 27,000 1,200 1,100 600 500 Northwest 211,000 212,000 10,000 11,000 6,500 6,000 Beltrami 28,000 27,500 600 500 1,000 1,000 Cass 32,300 31,500 400 600 800 700 Hubbard 11,400 11,000 200 200 800 700 Itasca 11,200 10,500 300 300 300 400 Koochiching 5,900 5,500 200 100 200 200 Lake of the Woods 4,200 4,000 100 100 100 -- North Central 93,000 90,000 1,800 1,800 3,200 3,000 Cook 100 100 -- -- -- -- Lake 200 200 -- -- 100 100 St. Louis 10,700 11,700 200 200 400 400 Northeast 11,000 12,000 200 200 500 500 Big Stone 9,000 8,000 800 700 500 400 Chippewa 8,000 7,000 900 900 1,500 1,400 Douglas 34,000 30,500 2,200 2,000 1,300 1,100 Grant 8,500 7,500 1,200 1,100 700 1,000 Lac Qui Parle 15,500 15,000 3,900 3,600 1,600 1,500 Otter Tail 111,000 105,500 4,000 3,900 3,600 3,300 Pope 32,500 34,500 2,300 2,400 1,500 1,300 Stevens 27,000 25,500 10,100 9,100 1,500 1,300 Swift 21,500 21,500 4,400 4,500 500 500 Traverse 8,000 7,500 2,300 2,300 500 500 Wilkin 5,000 4,500 500 400 200 300 Yellow Medicine 24,000 23,000 4,400 4,100 1,600 1,400 West Central 304,000 290,000 37,000 35,000 15,000 14,000 Benton 39,500 40,500 1,700 1,600 500 500 Carver 37,500 35,000 2,400 2,300 600 600 Kandiyohi 29,500 32,000 4,000 3,800 2,500 2,200 McLeod 34,000 32,500 3,300 3,300 700 700 Meeker 30,500 29,500 2,500 2,400 2,000 1,700 Morrison 87,000 87,000 2,300 2,200 1,400 1,200 Renville 28,500 27,000 10,000 10,300 2,600 2,300 Scott 22,000 21,000 3,300 3,000 500 400 Sherburne 10,000 11,000 1,700 1,800 400 400 Sibley 31,000 29,500 3,800 3,500 2,000 2,000 Stearns 188,500 182,000 11,300 11,200 2,000 1,700 Todd 73,000 69,500 1,500 1,400 3,000 2,600 Wadena 24,000 23,000 700 600 1,200 1,100 Wright 47,000 47,500 3,500 3,600 1,100 1,100 Central 682,000 667,000 52,000 51,000 20,500 18,500
1/ Counties with less than 100 head, are denoted with “--“. --continued
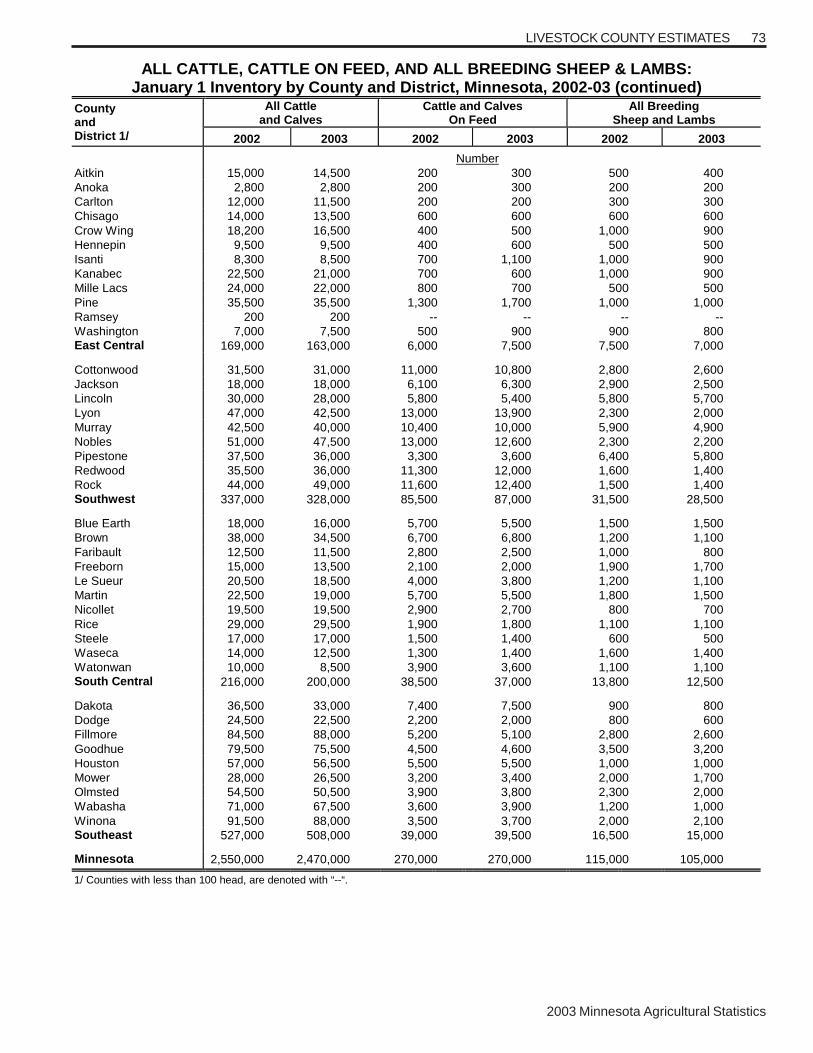
2003 Minnesota Agricultural Statistics
73LIVESTOCK COUNTY ESTIMATES
ALL CATTLE, CATTLE ON FEED, AND ALL BREEDING SHEEP & LAMBS: January 1 Inventory by County and District, Minnesota, 2002-03 (continued)
All Cattle and Calves
Cattle and Calves On Feed
All Breeding Sheep and Lambs
County and District 1/ 2002 2003 2002 2003 2002 2003
Number Aitkin 15,000 14,500 200 300 500 400 Anoka 2,800 2,800 200 300 200 200 Carlton 12,000 11,500 200 200 300 300 Chisago 14,000 13,500 600 600 600 600 Crow Wing 18,200 16,500 400 500 1,000 900 Hennepin 9,500 9,500 400 600 500 500 Isanti 8,300 8,500 700 1,100 1,000 900 Kanabec 22,500 21,000 700 600 1,000 900 Mille Lacs 24,000 22,000 800 700 500 500 Pine 35,500 35,500 1,300 1,700 1,000 1,000 Ramsey 200 200 -- -- -- -- Washington 7,000 7,500 500 900 900 800 East Central 169,000 163,000 6,000 7,500 7,500 7,000 Cottonwood 31,500 31,000 11,000 10,800 2,800 2,600 Jackson 18,000 18,000 6,100 6,300 2,900 2,500 Lincoln 30,000 28,000 5,800 5,400 5,800 5,700 Lyon 47,000 42,500 13,000 13,900 2,300 2,000 Murray 42,500 40,000 10,400 10,000 5,900 4,900 Nobles 51,000 47,500 13,000 12,600 2,300 2,200 Pipestone 37,500 36,000 3,300 3,600 6,400 5,800 Redwood 35,500 36,000 11,300 12,000 1,600 1,400 Rock 44,000 49,000 11,600 12,400 1,500 1,400 Southwest 337,000 328,000 85,500 87,000 31,500 28,500 Blue Earth 18,000 16,000 5,700 5,500 1,500 1,500 Brown 38,000 34,500 6,700 6,800 1,200 1,100 Faribault 12,500 11,500 2,800 2,500 1,000 800 Freeborn 15,000 13,500 2,100 2,000 1,900 1,700 Le Sueur 20,500 18,500 4,000 3,800 1,200 1,100 Martin 22,500 19,000 5,700 5,500 1,800 1,500 Nicollet 19,500 19,500 2,900 2,700 800 700 Rice 29,000 29,500 1,900 1,800 1,100 1,100 Steele 17,000 17,000 1,500 1,400 600 500 Waseca 14,000 12,500 1,300 1,400 1,600 1,400 Watonwan 10,000 8,500 3,900 3,600 1,100 1,100 South Central 216,000 200,000 38,500 37,000 13,800 12,500 Dakota 36,500 33,000 7,400 7,500 900 800 Dodge 24,500 22,500 2,200 2,000 800 600 Fillmore 84,500 88,000 5,200 5,100 2,800 2,600 Goodhue 79,500 75,500 4,500 4,600 3,500 3,200 Houston 57,000 56,500 5,500 5,500 1,000 1,000 Mower 28,000 26,500 3,200 3,400 2,000 1,700 Olmsted 54,500 50,500 3,900 3,800 2,300 2,000 Wabasha 71,000 67,500 3,600 3,900 1,200 1,000 Winona 91,500 88,000 3,500 3,700 2,000 2,100 Southeast 527,000 508,000 39,000 39,500 16,500 15,000 Minnesota 2,550,000 2,470,000 270,000 270,000 115,000 105,000
1/ Counties with less than 100 head, are denoted with “--“.
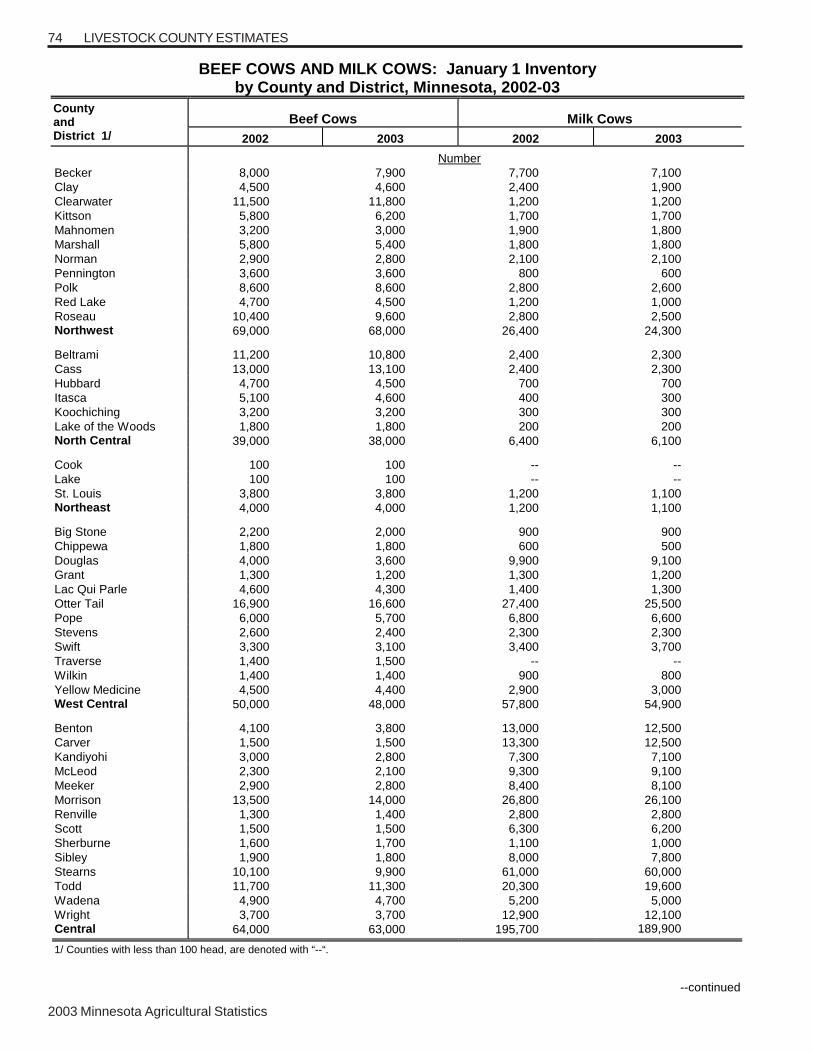
2003 Minnesota Agricultural Statistics
74 LIVESTOCK COUNTY ESTIMATES
BEEF COWS AND MILK COWS: January 1 Inventory by County and District, Minnesota, 2002-03
Beef Cows Milk Cows County and District 1/ 2002 2003 2002 2003
Number Becker 8,000 7,900 7,700 7,100 Clay 4,500 4,600 2,400 1,900 Clearwater 11,500 11,800 1,200 1,200 Kittson 5,800 6,200 1,700 1,700 Mahnomen 3,200 3,000 1,900 1,800 Marshall 5,800 5,400 1,800 1,800 Norman 2,900 2,800 2,100 2,100 Pennington 3,600 3,600 800 600 Polk 8,600 8,600 2,800 2,600 Red Lake 4,700 4,500 1,200 1,000 Roseau 10,400 9,600 2,800 2,500 Northwest 69,000 68,000 26,400 24,300 Beltrami 11,200 10,800 2,400 2,300 Cass 13,000 13,100 2,400 2,300 Hubbard 4,700 4,500 700 700 Itasca 5,100 4,600 400 300 Koochiching 3,200 3,200 300 300 Lake of the Woods 1,800 1,800 200 200 North Central 39,000 38,000 6,400 6,100 Cook 100 100 -- -- Lake 100 100 -- -- St. Louis 3,800 3,800 1,200 1,100 Northeast 4,000 4,000 1,200 1,100 Big Stone 2,200 2,000 900 900 Chippewa 1,800 1,800 600 500 Douglas 4,000 3,600 9,900 9,100 Grant 1,300 1,200 1,300 1,200 Lac Qui Parle 4,600 4,300 1,400 1,300 Otter Tail 16,900 16,600 27,400 25,500 Pope 6,000 5,700 6,800 6,600 Stevens 2,600 2,400 2,300 2,300 Swift 3,300 3,100 3,400 3,700 Traverse 1,400 1,500 -- -- Wilkin 1,400 1,400 900 800 Yellow Medicine 4,500 4,400 2,900 3,000 West Central 50,000 48,000 57,800 54,900 Benton 4,100 3,800 13,000 12,500 Carver 1,500 1,500 13,300 12,500 Kandiyohi 3,000 2,800 7,300 7,100 McLeod 2,300 2,100 9,300 9,100 Meeker 2,900 2,800 8,400 8,100 Morrison 13,500 14,000 26,800 26,100 Renville 1,300 1,400 2,800 2,800 Scott 1,500 1,500 6,300 6,200 Sherburne 1,600 1,700 1,100 1,000 Sibley 1,900 1,800 8,000 7,800 Stearns 10,100 9,900 61,000 60,000 Todd 11,700 11,300 20,300 19,600 Wadena 4,900 4,700 5,200 5,000 Wright 3,700 3,700 12,900 12,100 Central 64,000 63,000 195,700 189,900
1/ Counties with less than 100 head, are denoted with “--“.
--continued
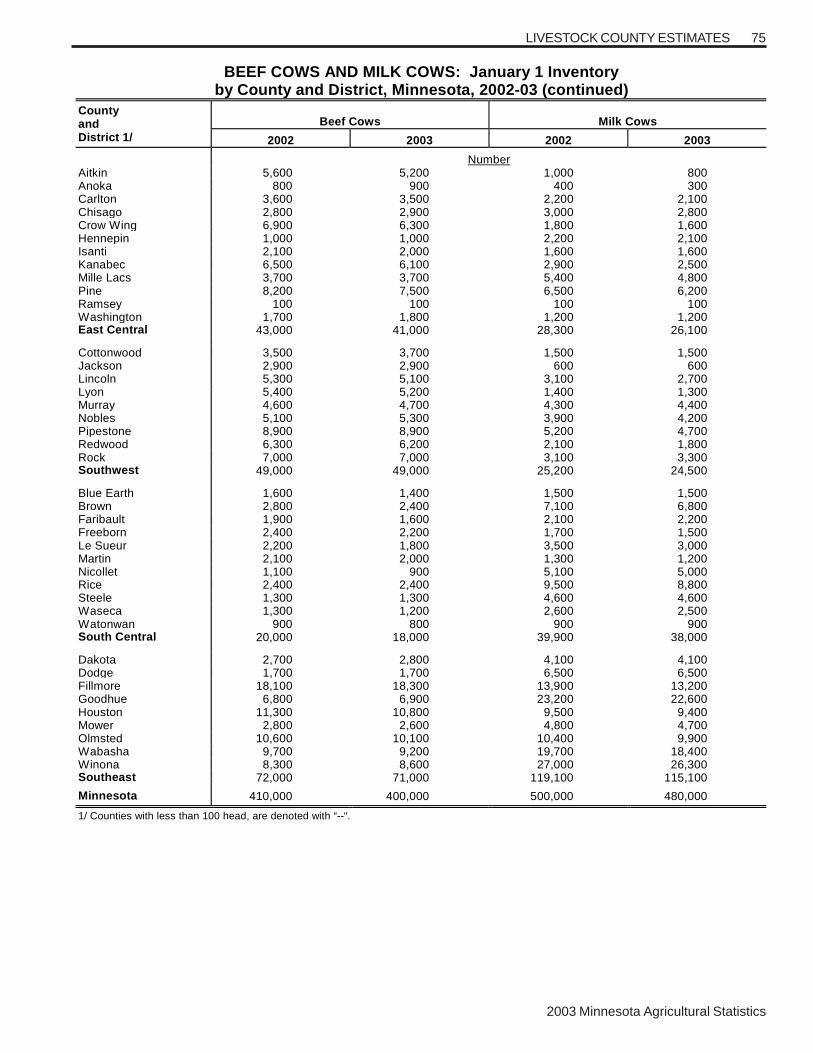
2003 Minnesota Agricultural Statistics
75LIVESTOCK COUNTY ESTIMATES
BEEF COWS AND MILK COWS: January 1 Inventory by County and District, Minnesota, 2002-03 (continued)
Beef Cows Milk Cows County and District 1/ 2002 2003 2002 2003
Number Aitkin 5,600 5,200 1,000 800 Anoka 800 900 400 300 Carlton 3,600 3,500 2,200 2,100 Chisago 2,800 2,900 3,000 2,800 Crow Wing 6,900 6,300 1,800 1,600 Hennepin 1,000 1,000 2,200 2,100 Isanti 2,100 2,000 1,600 1,600 Kanabec 6,500 6,100 2,900 2,500 Mille Lacs 3,700 3,700 5,400 4,800 Pine 8,200 7,500 6,500 6,200 Ramsey 100 100 100 100 Washington 1,700 1,800 1,200 1,200 East Central 43,000 41,000 28,300 26,100 Cottonwood 3,500 3,700 1,500 1,500 Jackson 2,900 2,900 600 600 Lincoln 5,300 5,100 3,100 2,700 Lyon 5,400 5,200 1,400 1,300 Murray 4,600 4,700 4,300 4,400 Nobles 5,100 5,300 3,900 4,200 Pipestone 8,900 8,900 5,200 4,700 Redwood 6,300 6,200 2,100 1,800 Rock 7,000 7,000 3,100 3,300 Southwest 49,000 49,000 25,200 24,500 Blue Earth 1,600 1,400 1,500 1,500 Brown 2,800 2,400 7,100 6,800 Faribault 1,900 1,600 2,100 2,200 Freeborn 2,400 2,200 1,700 1,500 Le Sueur 2,200 1,800 3,500 3,000 Martin 2,100 2,000 1,300 1,200 Nicollet 1,100 900 5,100 5,000 Rice 2,400 2,400 9,500 8,800 Steele 1,300 1,300 4,600 4,600 Waseca 1,300 1,200 2,600 2,500 Watonwan 900 800 900 900 South Central 20,000 18,000 39,900 38,000 Dakota 2,700 2,800 4,100 4,100 Dodge 1,700 1,700 6,500 6,500 Fillmore 18,100 18,300 13,900 13,200 Goodhue 6,800 6,900 23,200 22,600 Houston 11,300 10,800 9,500 9,400 Mower 2,800 2,600 4,800 4,700 Olmsted 10,600 10,100 10,400 9,900 Wabasha 9,700 9,200 19,700 18,400 Winona 8,300 8,600 27,000 26,300 Southeast 72,000 71,000 119,100 115,100
Minnesota 410,000 400,000 500,000 480,000 1/ Counties with less than 100 head, are denoted with “--“.
�
�

2003 Minnesota Agricultural Statistics
76 LIVESTOCK, DAIRY, POULTRY
HOGS AND PIGS: Sows Farrowed, Pig Crop, and Disposition, Minnesota, 1998-2002
Year
Spring Sows
Farrowed�
Spring Pig
Crop�
Fall Sows
Farrowed�
Fall Pig
Crop�
Annual Farrowings
1/�
Total Pig
Crop�
Annual Litter Rate�
Inship- ments�
Marketings 2/� Deaths�
All Hogs On Farms
Dec 1�
� ------------------------------ 1,000 Head ---------------------------------� Head� ---------------- 1,000 Head ----------------�1998� 535� 4,775� 545� 4,837� 1,080� 9,612� 8.90� 2,010� 11,150� 465� 5,700�1999� 520 4,654 510 4,590 1,030 9,244 8.97 2,650 11,608 480 5,500 2000� 505 4,496 530 4,769 1,035 9,265 8.95 3,150 11,581 530 5,800 2001� 530 4,771 530 4,770 1,060 9,541 9.00 4,050 12,957 630 5,800 2002 530 4,705 535 4,748 1,065 9,453 8.88 4,550 13,149 650 6,000 1/ Includes sows that have farrowed more than one time. 2/ Excludes interfarm sales.
�
HOGS: Sows Farrowed, Pigs per Litter, Pig Crop, by Quarters, Minnesota, 1998-2002 1/ �
December-February 2/� March-May� June-August� September-November�
Year Sows
Farrowed
Pigs Per
Litter�Pig
Crop�Sows
Farrowed�
Pigs Per
Litter�Pig
Crop�Sows
Farrowed�
Pigs per
Litter�Pig
Crop�Sows
Farrowed�
Pigs Per
Litter�Pig
Crop
1,000 Head Head - 1,000 Head - Head -- 1,000 Head -- Head -- 1,000 Head -- Head 1,000 Head 1998� 260� 8.95� 2,327� 275� 8.90� 2,448� 280� 8.90� 2,492� 265� 8.85� 2,345�1999� 255 8.95 2,282 265 8.95 2,372 265 9.00 2,385 245 9.00 2,205 2000� 245 8.80 2,156 260 9.00 2,340 260 9.10 2,366 270 8.90 2,403 2001� 260 8.95 2,327 270 9.05 2,444 265 9.00 2,385 265 9.00 2,385 2002 260 8.80 2,288 270 8.95 2,417 265 8.85 2,345 270 8.90 2,403
1/ Sows farrowed and pig crop numbers are 1,000 head. 2/ December previous year.�

2003 Minnesota Agricultural Statistics
77LIVESTOCK, DAIRY, POULTRY
HOGS AND PIGS All Breeding and Market Hogs and Pigs by Quarter, Minnesota, 1998-2003
Market Hogs and Pigs
Year and Quarter All Hogs and Pigs�
For Breeding Purposes� Under 60 Lbs.�60 - 119 Lbs.�120 -179 Lbs.�
180 Lbs. and Over� Total Market
� 1,000 Head�1998�
� � � � � � �
March� 5,700� 630� 1,960� 1,240� 1,020� 850� 5,070� June� 5,900� 640� 2,050� 1,330� 1,050� 830� 5,260� September� 6,000� 650� 2,110� 1,380� 1,060� 800� 5,350� December� 5,700� 620� 2,020� 1,270� 960� 830� 5,080�
1999�� � � � � � �
March� 5,600� 590� 1,960� 1,230� 990� 830� 5,010� June� 5,600 600 2,000 1,200 980 820 5,000 September� 5,500 590 1,960 1,180 970 800 4,910 December� 5,500 560 1,940 1,190 1,030 780 4,940
2000� March� 5,400 570 1,910 1,150 960 810 4,830 June� 5,700 580 2,060 1,250 1,020 790 5,120 September� 5,600 580 2,080 1,220 950 770 5,020 December� 5,800 600 2,110 1,270 1,040 780 5,200
2001� March� 5,800 590 2,040 1,310 1,090 770 5,210 June� 5,800 590 2,140 1,300 1,050 720 5,210 September� 5,900 590 2,190 1,320 1,060 740 5,310
December� 5,800 570 2,130 1,250 1,030 820 5,230
2002� March� 5,800 570 2,070 1,330 1,060 770 5,230 June� 5,900 580 2,080 1,380 1,100 760 5,320 September� 6,100 580 2,170 1,410 1,140 800 5,520 December� 6,000 580 2,110 1,330 1,080 900 5,420 2003� March� 6,100 590 2,120 1,320 1,190 880 5,510 �
�
�
�
�
HOGS AND PIGS Production and Income, Minnesota, 1998-2002
Year Production
1/�Marketings
2/�
Average Price Per 100
Lbs�
Value of Production
3/�
Cash Receipts
4/�
Value of Home
Consumption�Gross
Income�
� ------- 1,000 Pounds -------� Dollars --------------------------- 1,000 Dollars ------------------------------�1998� 2,403,231� 2,540,555� 35.50� 837,110� 916,989� 2,602� 919,591�1999� 2,461,044 2,640,931 30.50 735,092 823,895 2,214 826,109 2000 2,514,895 2,666,359 44.00 1,083,307 1,207,465 1,866 1,209,331 2001 2,773,774 3,000,504 45.50 1,230,885 1,410,773 1,929 1,412,702 2002 2,772,757 2,992,850 34.60 928,593 1,067,805 1,487 1,069,292
1/ Adjustments made for changes in inventory and for inshipments. 2/ Excludes custom slaughter for use on farms where produced and interfarm sales within the state. 3/ Includes allowance for higher average price of state inshipments and outshipments of feeder pigs. 4/ Receipts from marketings and sale of farm slaughter. Includes allowance for higher average price of state inshipments and outshipments of feeder pigs.
�
�
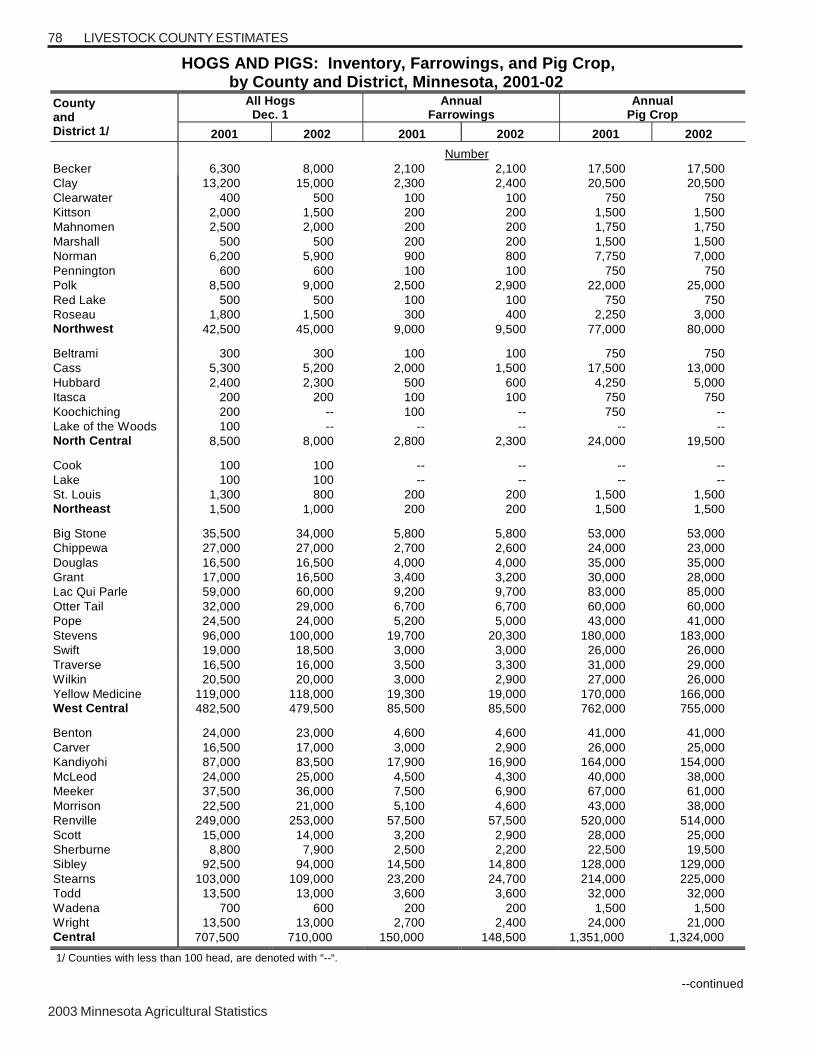
2003 Minnesota Agricultural Statistics
78 LIVESTOCK COUNTY ESTIMATES
HOGS AND PIGS: Inventory, Farrowings, and Pig Crop, by County and District, Minnesota, 2001-02
All Hogs Dec. 1
Annual Farrowings
Annual Pig Crop
County and District 1/ 2001 2002 2001 2002 2001 2002
Number Becker 6,300 8,000 2,100 2,100 17,500 17,500 Clay 13,200 15,000 2,300 2,400 20,500 20,500 Clearwater 400 500 100 100 750 750 Kittson 2,000 1,500 200 200 1,500 1,500 Mahnomen 2,500 2,000 200 200 1,750 1,750 Marshall 500 500 200 200 1,500 1,500 Norman 6,200 5,900 900 800 7,750 7,000 Pennington 600 600 100 100 750 750 Polk 8,500 9,000 2,500 2,900 22,000 25,000 Red Lake 500 500 100 100 750 750 Roseau 1,800 1,500 300 400 2,250 3,000 Northwest 42,500 45,000 9,000 9,500 77,000 80,000 Beltrami 300 300 100 100 750 750 Cass 5,300 5,200 2,000 1,500 17,500 13,000 Hubbard 2,400 2,300 500 600 4,250 5,000 Itasca 200 200 100 100 750 750 Koochiching 200 -- 100 -- 750 -- Lake of the Woods 100 -- -- -- -- -- North Central 8,500 8,000 2,800 2,300 24,000 19,500 Cook 100 100 -- -- -- -- Lake 100 100 -- -- -- -- St. Louis 1,300 800 200 200 1,500 1,500 Northeast 1,500 1,000 200 200 1,500 1,500 Big Stone 35,500 34,000 5,800 5,800 53,000 53,000 Chippewa 27,000 27,000 2,700 2,600 24,000 23,000 Douglas 16,500 16,500 4,000 4,000 35,000 35,000 Grant 17,000 16,500 3,400 3,200 30,000 28,000 Lac Qui Parle 59,000 60,000 9,200 9,700 83,000 85,000 Otter Tail 32,000 29,000 6,700 6,700 60,000 60,000 Pope 24,500 24,000 5,200 5,000 43,000 41,000 Stevens 96,000 100,000 19,700 20,300 180,000 183,000 Swift 19,000 18,500 3,000 3,000 26,000 26,000 Traverse 16,500 16,000 3,500 3,300 31,000 29,000 Wilkin 20,500 20,000 3,000 2,900 27,000 26,000 Yellow Medicine 119,000 118,000 19,300 19,000 170,000 166,000 West Central 482,500 479,500 85,500 85,500 762,000 755,000 Benton 24,000 23,000 4,600 4,600 41,000 41,000 Carver 16,500 17,000 3,000 2,900 26,000 25,000 Kandiyohi 87,000 83,500 17,900 16,900 164,000 154,000 McLeod 24,000 25,000 4,500 4,300 40,000 38,000 Meeker 37,500 36,000 7,500 6,900 67,000 61,000 Morrison 22,500 21,000 5,100 4,600 43,000 38,000 Renville 249,000 253,000 57,500 57,500 520,000 514,000 Scott 15,000 14,000 3,200 2,900 28,000 25,000 Sherburne 8,800 7,900 2,500 2,200 22,500 19,500 Sibley 92,500 94,000 14,500 14,800 128,000 129,000 Stearns 103,000 109,000 23,200 24,700 214,000 225,000 Todd 13,500 13,000 3,600 3,600 32,000 32,000 Wadena 700 600 200 200 1,500 1,500 Wright 13,500 13,000 2,700 2,400 24,000 21,000 Central 707,500 710,000 150,000 148,500 1,351,000 1,324,000 1/ Counties with less than 100 head, are denoted with “--“.
--continued
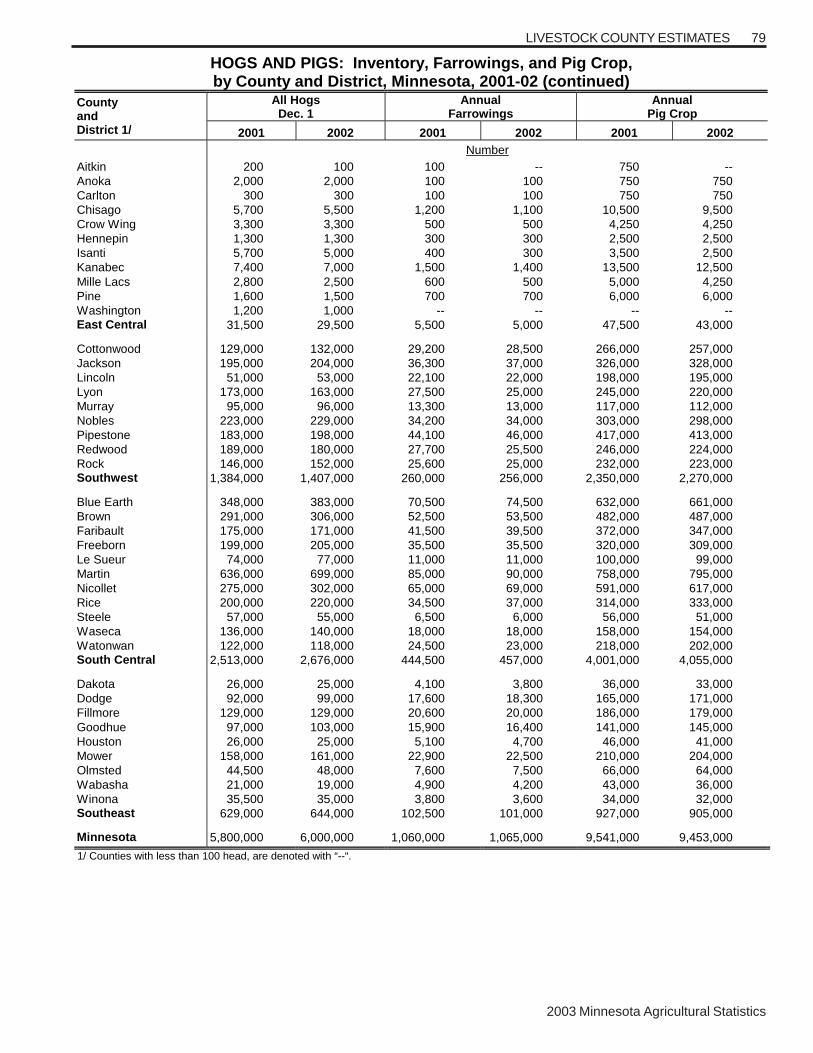
2003 Minnesota Agricultural Statistics
79LIVESTOCK COUNTY ESTIMATES
HOGS AND PIGS: Inventory, Farrowings, and Pig Crop, by County and District, Minnesota, 2001-02 (continued)
All Hogs Dec. 1
Annual Farrowings
Annual Pig Crop
County and District 1/ 2001 2002 2001 2002 2001 2002
Number Aitkin 200 100 100 -- 750 -- Anoka 2,000 2,000 100 100 750 750 Carlton 300 300 100 100 750 750 Chisago 5,700 5,500 1,200 1,100 10,500 9,500 Crow Wing 3,300 3,300 500 500 4,250 4,250 Hennepin 1,300 1,300 300 300 2,500 2,500 Isanti 5,700 5,000 400 300 3,500 2,500 Kanabec 7,400 7,000 1,500 1,400 13,500 12,500 Mille Lacs 2,800 2,500 600 500 5,000 4,250 Pine 1,600 1,500 700 700 6,000 6,000 Washington 1,200 1,000 -- -- -- -- East Central 31,500 29,500 5,500 5,000 47,500 43,000 Cottonwood 129,000 132,000 29,200 28,500 266,000 257,000 Jackson 195,000 204,000 36,300 37,000 326,000 328,000 Lincoln 51,000 53,000 22,100 22,000 198,000 195,000 Lyon 173,000 163,000 27,500 25,000 245,000 220,000 Murray 95,000 96,000 13,300 13,000 117,000 112,000 Nobles 223,000 229,000 34,200 34,000 303,000 298,000 Pipestone 183,000 198,000 44,100 46,000 417,000 413,000 Redwood 189,000 180,000 27,700 25,500 246,000 224,000 Rock 146,000 152,000 25,600 25,000 232,000 223,000 Southwest 1,384,000 1,407,000 260,000 256,000 2,350,000 2,270,000 Blue Earth 348,000 383,000 70,500 74,500 632,000 661,000 Brown 291,000 306,000 52,500 53,500 482,000 487,000 Faribault 175,000 171,000 41,500 39,500 372,000 347,000 Freeborn 199,000 205,000 35,500 35,500 320,000 309,000 Le Sueur 74,000 77,000 11,000 11,000 100,000 99,000 Martin 636,000 699,000 85,000 90,000 758,000 795,000 Nicollet 275,000 302,000 65,000 69,000 591,000 617,000 Rice 200,000 220,000 34,500 37,000 314,000 333,000 Steele 57,000 55,000 6,500 6,000 56,000 51,000 Waseca 136,000 140,000 18,000 18,000 158,000 154,000 Watonwan 122,000 118,000 24,500 23,000 218,000 202,000 South Central 2,513,000 2,676,000 444,500 457,000 4,001,000 4,055,000 Dakota 26,000 25,000 4,100 3,800 36,000 33,000 Dodge 92,000 99,000 17,600 18,300 165,000 171,000 Fillmore 129,000 129,000 20,600 20,000 186,000 179,000 Goodhue 97,000 103,000 15,900 16,400 141,000 145,000 Houston 26,000 25,000 5,100 4,700 46,000 41,000 Mower 158,000 161,000 22,900 22,500 210,000 204,000 Olmsted 44,500 48,000 7,600 7,500 66,000 64,000 Wabasha 21,000 19,000 4,900 4,200 43,000 36,000 Winona 35,500 35,000 3,800 3,600 34,000 32,000 Southeast 629,000 644,000 102,500 101,000 927,000 905,000 Minnesota 5,800,000 6,000,000 1,060,000 1,065,000 9,541,000 9,453,000 1/ Counties with less than 100 head, are denoted with “--“.

2003 Minnesota Agricultural Statistics
80 LIVESTOCK, DAIRY, POULTRY
SHEEP AND LAMBS: Inventory, Supply, and Disposition, Minnesota, 1998-2003 Marketings 2/ Deaths
Year
All Sheep and
Lambs 1/ Lamb Crop Inshipments Sheep Lambs
Farm Slaughter
3/ Sheep Lambs 1,000 Head
1998 165 155 39 10 144 1 9 20 1999 175 145 51 23 153 1 9 20 2000 165 145 48 11 147 1 9 20 2001 170 155 28 8 152 1 10 22 2002 160 145 22 25 132 1 7 17 2003 145 -- -- -- -- -- -- -- 1/ Sheep and lamb inventory numbers refer to January 1.
2/ Includes custom slaughter for use on farms where produced and state outshipments, but excludes interfarm sales within the state. 3/ Excludes custom slaughter for farmers at commercial establishments.
SHEEP AND LAMBS: Inventory, Production, and Income, Minnesota, 1998-2002 Average Price
per 100 Pounds Year
Production 1/
Marketings 2/ Sheep Lambs
Value of Production
Cash Receipts
3/
Value of Home
Consumption Gross
Income
---- 1,000 Pounds ---- -------- Dollars ------- ------------------------- 1,000 Dollars ------------------------ 1998 16,355 17,795 27.20 71.40 10,834 12,109 168 12,277 1999 15,906 20,585 25.00 73.20 10,697 13,572 169 13,741 2000 16,518 19,005 27.40 75.40 11,530 13,617 176 13,793 2001 16,808 19,200 24.90 62.00 9,787 11,503 145 11,648 2002 15,665 19,045 22.30 71.10 10,391 11,918 156 12,074
1/ Adjustments made for changes in inventory and for inshipments. 2/ Excludes custom slaughter for use on farms where produced and interfarm sales within the state. 3/ Receipts from marketings and sale of farm slaughter.
WOOL: Sheep Shorn, Production, and Value, Minnesota, 1998-2002
Year Sheep Shorn 1/ Weight per
Fleece Production Annual Average Price per Pound Value
1,000 Head Pounds 1,000 Pounds Cents 1,000 Dollars 1998 160 6.6 1,055 34 359 1999 150 6.7 1,000 15 150 2000 155 6.7 1,035 11 114 2001 165 6.6 1,085 11 119 2002 150 6.8 1,020 20 204
1/ Includes sheep shorn at commercial feeding yards.
�
�
�
�
� � � � � �
2003 Minnesota Agricultural Statistics
81LIVESTOCK, DAIRY, POULTRY
COMMERCIAL LIVESTOCK SLAUGHTER: Number and Live Weight, by Month, Minnesota, 2001-02
Cattle
Live Weight Number
Slaughtered Average Weight Total Weight
Month 2001 2002 2001 2002 2001 2002
------ 1,000 Head ------ -------- Pounds --------- ----- 1,000 Pounds ----- January 64.0 63.9 1,374 1,394 87,945 89,076 February 52.4 54.0 1,389 1,435 72,735 77,546 March 58.2 52.5 1,417 1,422 82,483 74,639 April 52.5 57.1 1,377 1,396 72,332 79,788 May 59.2 62.0 1,331 1,361 78,740 84,333 June 57.6 64.1 1,338 1,364 77,061 87,456 July 55.5 67.5 1,339 1,347 74,309 90,998 August 61.8 66.4 1,342 1,356 82,917 90,098 September 55.3 62.2 1,350 1,348 74,695 83,820 October 65.9 78.5 1,362 1,346 89,808 105,695 November 61.6 71.7 1,333 1,350 82,071 96,788 December 58.9 71.9 1,364 1,355 80,385 97,440 Total 703.0 771.9 1,359 1,370 955,479 1,057,677
Hogs
Live Weight Number
Slaughtered Average Weight Total Weight
Month 2001 2002 2001 2002 2001 2002
------ 1,000 Head ------- ------- Pounds -------- ------ 1,000 Pounds ----- January 717.0 778.7 263 263 188,822 204,472 February 650.5 670.1 262 263 170,577 176,040 March 741.2 721.6 261 263 193,809 190,068 April 659.5 728.6 261 263 172,426 191,956 May 652.5 737.7 259 263 169,300 193,794 June 651.9 661.3 260 260 169,415 171,758 July 659.8 701.0 256 254 168,958 178,351 August 713.5 736.1 254 256 180,976 188,454 September 683.5 752.5 258 259 176,560 194,895 October 821.5 808.6 264 263 216,847 212,606 November 779.8 771.3 266 265 207,130 204,512 December 734.5 775.3 264 264 193,588 204,907 Total 8,465.1 8,842.9 261 261 2,208,407 2,311,812 Note: Totals may not add due to rounding. Includes slaughter under federal inspection and other commercial slaughter. Excludes farm slaughter.
�
�
�
�
�
� � � � � � � � � � �
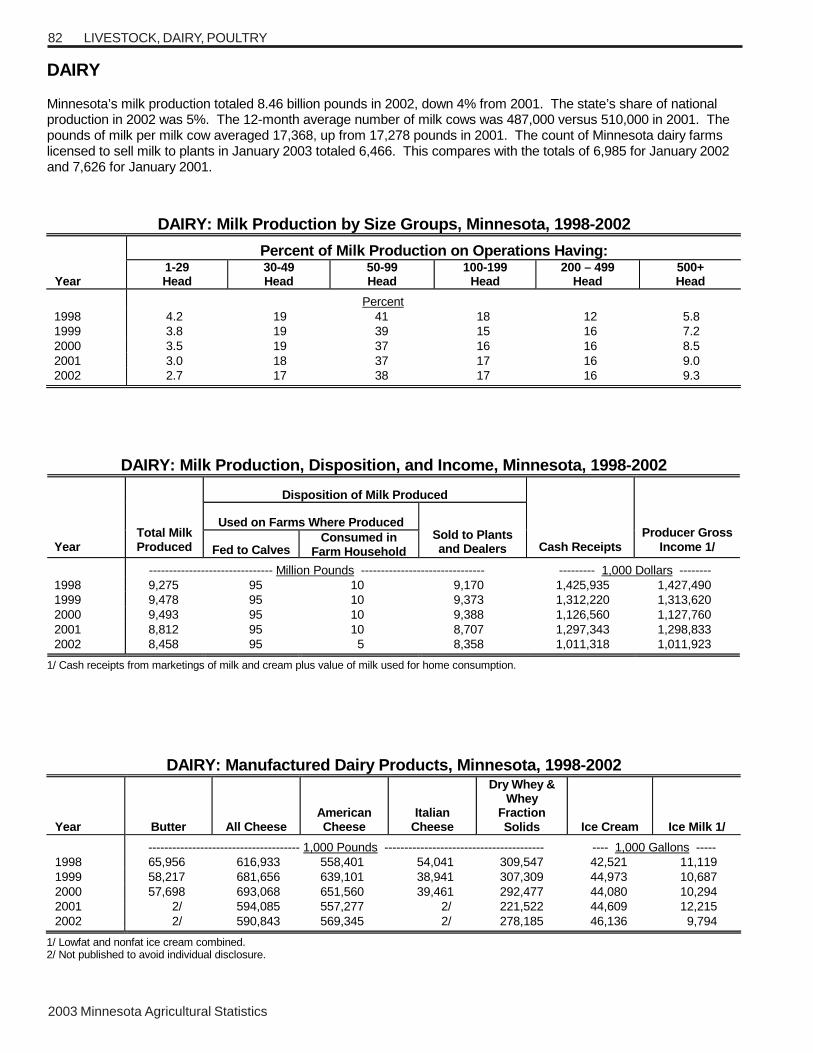
2003 Minnesota Agricultural Statistics
82
DAIRY Minnesota’s milk production totaled 8.46 billion pounds in 2002, down 4% from 2001. The state’s share of national production in 2002 was 5%. The 12-month average number of milk cows was 487,000 versus 510,000 in 2001. The pounds of milk per milk cow averaged 17,368, up from 17,278 pounds in 2001. The count of Minnesota dairy farms licensed to sell milk to plants in January 2003 totaled 6,466. This compares with the totals of 6,985 for January 2002 and 7,626 for January 2001.
DAIRY: Milk Production by Size Groups, Minnesota, 1998-2002
Percent of Milk Production on Operations Having:
Year 1-29 Head
30-49 Head
50-99 Head
100-199 Head
200 – 499 Head
500+ Head
Percent 1998 4.2 19 41 18 12 5.8 1999 3.8 19 39 15 16 7.2 2000 3.5 19 37 16 16 8.5 2001 3.0 18 37 17 16 9.0 2002 2.7 17 38 17 16 9.3
DAIRY: Milk Production, Disposition, and Income, Minnesota, 1998-2002
Disposition of Milk Produced
Used on Farms Where Produced
Year Total Milk Produced Fed to Calves
Consumed in Farm Household
Sold to Plants and Dealers
Cash Receipts
Producer Gross
Income 1/
------------------------------- Million Pounds ------------------------------- --------- 1,000 Dollars -------- 1998 9,275 95 10 9,170 1,425,935 1,427,490 1999 9,478 95 10 9,373 1,312,220 1,313,620 2000 9,493 95 10 9,388 1,126,560 1,127,760 2001 8,812 95 10 8,707 1,297,343 1,298,833 2002 8,458 95 5 8,358 1,011,318 1,011,923
1/ Cash receipts from marketings of milk and cream plus value of milk used for home consumption.
DAIRY: Manufactured Dairy Products, Minnesota, 1998-2002
Year Butter All Cheese American Cheese
Italian Cheese
Dry Whey & Whey
Fraction Solids Ice Cream Ice Milk 1/
-------------------------------------- 1,000 Pounds ---------------------------------------- ---- 1,000 Gallons ----- 1998 65,956 616,933 558,401 54,041 309,547 42,521 11,119 1999 58,217 681,656 639,101 38,941 307,309 44,973 10,687 2000 57,698 693,068 651,560 39,461 292,477 44,080 10,294 2001 2/ 594,085 557,277 2/ 221,522 44,609 12,215 2002 2/ 590,843 569,345 2/ 278,185 46,136 9,794
1/ Lowfat and nonfat ice cream combined. 2/ Not published to avoid individual disclosure.
�
� � � � � � � � �
LIVESTOCK, DAIRY, POULTRY
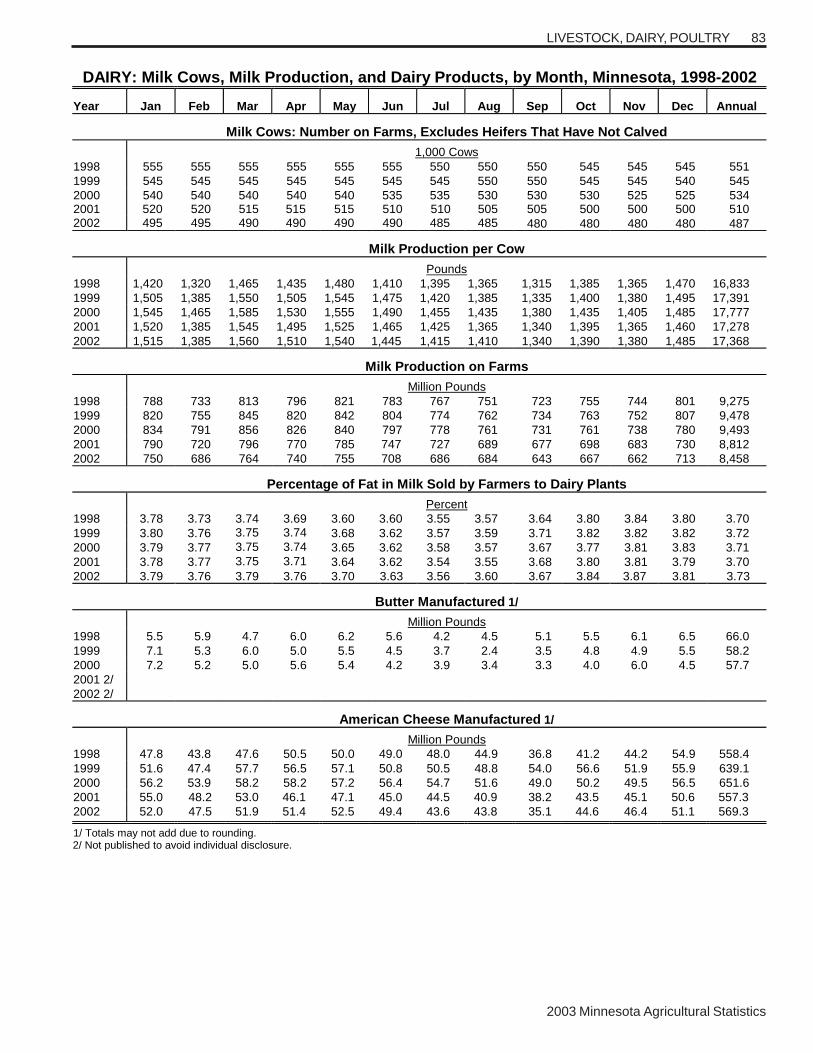
2003 Minnesota Agricultural Statistics
83LIVESTOCK, DAIRY, POULTRY
DAIRY: Milk Cows, Milk Production, and Dairy Products, by Month, Minnesota, 1998-2002
Year Jan Feb Mar Apr May Jun Jul Aug Sep Oct Nov Dec Annual
Milk Cows: Number on Farms, Excludes Heifers That Have Not Calved 1,000 Cows
1998 555 555 555 555 555 555 550 550 550 545 545 545 551 1999 545 545 545 545 545 545 545 550 550 545 545 540 545 2000 540 540 540 540 540 535 535 530 530 530 525 525 534 2001 520 520 515 515 515 510 510 505 505 500 500 500 510 2002 495 495 490 490 490 490 485 485 480 480 480 480 487
Milk Production per Cow Pounds
1998 1,420 1,320 1,465 1,435 1,480 1,410 1,395 1,365 1,315 1,385 1,365 1,470 16,833 1999 1,505 1,385 1,550 1,505 1,545 1,475 1,420 1,385 1,335 1,400 1,380 1,495 17,391 2000 1,545 1,465 1,585 1,530 1,555 1,490 1,455 1,435 1,380 1,435 1,405 1,485 17,777 2001 1,520 1,385 1,545 1,495 1,525 1,465 1,425 1,365 1,340 1,395 1,365 1,460 17,278 2002 1,515 1,385 1,560 1,510 1,540 1,445 1,415 1,410 1,340 1,390 1,380 1,485 17,368
Milk Production on Farms Million Pounds
1998 788 733 813 796 821 783 767 751 723 755 744 801 9,275 1999 820 755 845 820 842 804 774 762 734 763 752 807 9,478 2000 834 791 856 826 840 797 778 761 731 761 738 780 9,493 2001 790 720 796 770 785 747 727 689 677 698 683 730 8,812 2002 750 686 764 740 755 708 686 684 643 667 662 713 8,458
Percentage of Fat in Milk Sold by Farmers to Dairy Plants Percent
1998 3.78 3.73 3.74 3.69 3.60 3.60 3.55 3.57 3.64 3.80 3.84 3.80 3.70 1999 3.80 3.76 3.75
3.74
3.68 3.62 3.57 3.59 3.71 3.82 3.82 3.82 3.72 2000 3.79 3.77 3.75
3.74
3.65 3.62 3.58 3.57 3.67 3.77 3.81 3.83 3.71 2001 3.78 3.77 3.75
3.71
3.64 3.62 3.54 3.55 3.68 3.80 3.81 3.79 3.70 2002 3.79 3.76 3.79 3.76 3.70 3.63 3.56 3.60 3.67 3.84 3.87 3.81 3.73
Butter Manufactured 1/ Million Pounds
1998 5.5 5.9 4.7 6.0 6.2 5.6 4.2 4.5 5.1 5.5 6.1 6.5 66.0 1999 7.1 5.3 6.0 5.0 5.5 4.5 3.7 2.4 3.5 4.8 4.9 5.5 58.2 2000 7.2 5.2 5.0 5.6 5.4 4.2 3.9 3.4 3.3 4.0 6.0 4.5 57.7 2001 2/ 2002 2/
American Cheese Manufactured 1/ Million Pounds
1998 47.8 43.8 47.6 50.5 50.0 49.0 48.0 44.9 36.8 41.2 44.2 54.9 558.4 1999 51.6 47.4 57.7 56.5 57.1 50.8 50.5 48.8 54.0 56.6 51.9 55.9 639.1 2000 56.2 53.9 58.2 58.2 57.2 56.4 54.7 51.6 49.0 50.2 49.5 56.5 651.6 2001 55.0 48.2 53.0 46.1 47.1 45.0 44.5 40.9 38.2 43.5 45.1 50.6 557.3 2002 52.0 47.5 51.9 51.4 52.5 49.4 43.6 43.8 35.1 44.6 46.4 51.1 569.3 1/ Totals may not add due to rounding. 2/ Not published to avoid individual disclosure.

2003 Minnesota Agricultural Statistics
84 LIVESTOCK COUNTY ESTIMATES
DAIRY: Milk Cows, Production Per Cow, and Total Production, by County and District, Minnesota, 2001-02
Annual Average Milk Cows On Farms
Annual Average Production Per Cow
Total Production
County and District 1/ 2001 2002 2001 2002 2001 2002
--------- Number --------- --Thousand Pounds -- ----Thousand Pounds ---- Becker 8,000 7,300 16.9 17.1 135,500 124,500 Clay 2,500 2,100 16.8 16.9 42,000 35,500 Clearwater 1,400 1,200 15.7 15.8 22,000 19,000 Kittson 1,700 1,700 17.1 17.4 29,000 29,500 Mahnomen 2,000 1,800 16.5 16.7 33,000 30,000 Marshall 1,800 1,800 16.7 16.9 30,000 30,500 Norman 2,000 2,100 16.5 16.7 33,000 35,000 Pennington 900 700 16.7 16.4 15,000 11,500 Polk 3,000 2,700 16.5 16.5 49,500 44,500 Red Lake 1,300 1,100 16.5 16.4 21,500 18,000 Roseau 2,900 2,700 16.9 16.5 49,000 44,500 Northwest 27,500 25,200 16.7 16.8 459,500 422,500 Beltrami 2,500 2,400 15.8 15.8 39,500 38,000 Cass 2,400 2,300 15.4 15.7 37,000 36,000 Hubbard 700 700 16.4 16.4 11,500 11,500 Itasca 400 300 16.3 16.7 6,500 5,000 Koochiching 200 300 17.5 15.0 3,500 4,500 Lake of the Woods 200 200 15.0 15.0 3,000 3,000 North Central 6,400 6,200 15.8 15.8 101,000 98,000 St Louis 1,200 1,100 15.8 15.9 19,000 17,500 Northeast 1,200 1,100 15.8 15.9 19,000 17,500 Big Stone 1,000 900 16.5 16.7 16,500 15,000 Chippewa 600 500 16.7 17.0 10,000 8,500 Douglas 10,200 9,400 16.5 16.5 168,500 155,500 Grant 1,400 1,300 16.1 16.2 22,500 21,000 Lac Qui Parle 1,400 1,300 16.8 16.9 23,500 22,000 Otter Tail 28,200 26,300 17.2 17.1 484,000 450,500 Pope 7,000 6,700 16.8 16.8 117,500 112,500 Stevens 2,300 2,300 18.3 18.5 42,000 42,500 Swift 2,900 3,500 17.2 17.3 50,000 60,500 Wilkin 900 800 16.1 16.3 14,500 13,000 Yellow Medicine 2,900 2,900 16.7 16.9 48,500 49,000 West Central 58,800 55,900 17.0 17.0 997,500 950,000 Benton 13,300 12,700 16.9 17.0 224,500 215,500 Carver 13,500 12,800 17.9 17.9 241,000 228,500 Kandiyohi 7,300 7,100 17.3 17.4 126,500 123,500 McLeod 9,400 9,100 16.8 16.9 157,500 153,500 Meeker 8,500 8,200 17.7 17.8 150,500 146,000 Morrison 26,900 26,300 17.0 17.1 458,500 450,000 Renville 2,800 2,800 17.1 17.3 48,000 48,500 Scott 6,600 6,300 17.7 17.7 116,500 111,500 Sherburne 1,300 1,000 16.5 17.0 21,500 17,000 Sibley 8,300 7,900 17.3 17.4 144,000 137,500 Stearns 61,500 60,500 17.8 18.0 1,095,000 1,089,000 Todd 20,700 19,800 16.6 16.7 344,500 330,500 Wadena 5,400 5,100 16.2 16.3 87,500 83,000 Wright 13,200 12,400 17.7 17.8 234,000 220,500 Central 198,700 192,000 17.4 17.5 3,449,500 3,354,500 1/ Counties with less than 100 head, are denoted with “--“.
--continued
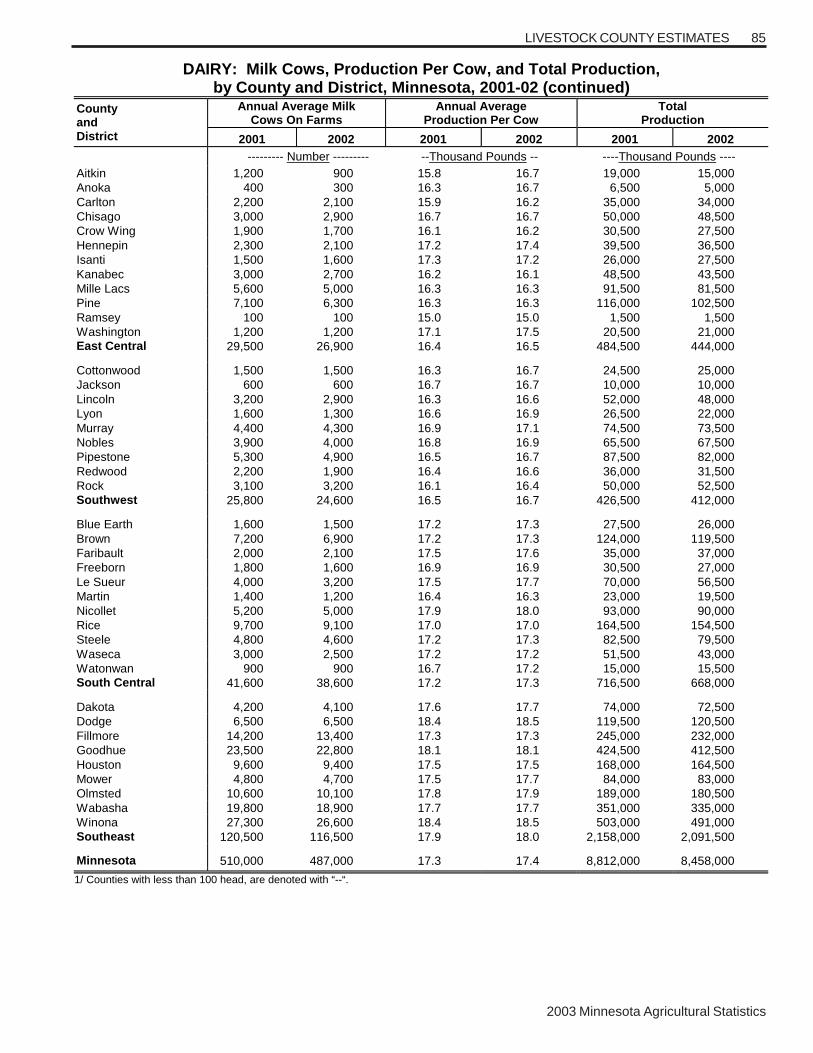
2003 Minnesota Agricultural Statistics
85LIVESTOCK COUNTY ESTIMATES
DAIRY: Milk Cows, Production Per Cow, and Total Production, by County and District, Minnesota, 2001-02 (continued)
Annual Average Milk Cows On Farms
Annual Average Production Per Cow
Total Production
County and District 2001 2002 2001 2002 2001 2002
--------- Number --------- --Thousand Pounds -- ----Thousand Pounds ---- Aitkin 1,200 900 15.8 16.7 19,000 15,000 Anoka 400 300 16.3 16.7 6,500 5,000 Carlton 2,200 2,100 15.9 16.2 35,000 34,000 Chisago 3,000 2,900 16.7 16.7 50,000 48,500 Crow Wing 1,900 1,700 16.1 16.2 30,500 27,500 Hennepin 2,300 2,100 17.2 17.4 39,500 36,500 Isanti 1,500 1,600 17.3 17.2 26,000 27,500 Kanabec 3,000 2,700 16.2 16.1 48,500 43,500 Mille Lacs 5,600 5,000 16.3 16.3 91,500 81,500 Pine 7,100 6,300 16.3 16.3 116,000 102,500 Ramsey 100 100 15.0 15.0 1,500 1,500 Washington 1,200 1,200 17.1 17.5 20,500 21,000 East Central 29,500 26,900 16.4 16.5 484,500 444,000 Cottonwood 1,500 1,500 16.3 16.7 24,500 25,000 Jackson 600 600 16.7 16.7 10,000 10,000 Lincoln 3,200 2,900 16.3 16.6 52,000 48,000 Lyon 1,600 1,300 16.6 16.9 26,500 22,000 Murray 4,400 4,300 16.9 17.1 74,500 73,500 Nobles 3,900 4,000 16.8 16.9 65,500 67,500 Pipestone 5,300 4,900 16.5 16.7 87,500 82,000 Redwood 2,200 1,900 16.4 16.6 36,000 31,500 Rock 3,100 3,200 16.1 16.4 50,000 52,500 Southwest 25,800 24,600 16.5 16.7 426,500 412,000 Blue Earth 1,600 1,500 17.2 17.3 27,500 26,000 Brown 7,200 6,900 17.2 17.3 124,000 119,500 Faribault 2,000 2,100 17.5 17.6 35,000 37,000 Freeborn 1,800 1,600 16.9 16.9 30,500 27,000 Le Sueur 4,000 3,200 17.5 17.7 70,000 56,500 Martin 1,400 1,200 16.4 16.3 23,000 19,500 Nicollet 5,200 5,000 17.9 18.0 93,000 90,000 Rice 9,700 9,100 17.0 17.0 164,500 154,500 Steele 4,800 4,600 17.2 17.3 82,500 79,500 Waseca 3,000 2,500 17.2 17.2 51,500 43,000 Watonwan 900 900 16.7 17.2 15,000 15,500 South Central 41,600 38,600 17.2 17.3 716,500 668,000 Dakota 4,200 4,100 17.6 17.7 74,000 72,500 Dodge 6,500 6,500 18.4 18.5 119,500 120,500 Fillmore 14,200 13,400 17.3 17.3 245,000 232,000 Goodhue 23,500 22,800 18.1 18.1 424,500 412,500 Houston 9,600 9,400 17.5 17.5 168,000 164,500 Mower 4,800 4,700 17.5 17.7 84,000 83,000 Olmsted 10,600 10,100 17.8 17.9 189,000 180,500 Wabasha 19,800 18,900 17.7 17.7 351,000 335,000 Winona 27,300 26,600 18.4 18.5 503,000 491,000 Southeast 120,500 116,500 17.9 18.0 2,158,000 2,091,500 Minnesota 510,000 487,000 17.3 17.4 8,812,000 8,458,000 1/ Counties with less than 100 head, are denoted with “--“.

2003 Minnesota Agricultural Statistics
86 LIVESTOCK COUNTY ESTIMATES
DAIRY: Farm Numbers by County and District, Minnesota, January 2003 1/ County and District
Grade A 2/
Grade B 3/ Total
County and District
Grade A 2/
Grade B 3/ Total
Number Number Becker 80 9 89 Aitkin 11 6 17 Clay 18 3 21 Anoka 4 2 6 Clearwater 16 9 25 Carlton 25 9 34 Kittson 4 -- 4 Chisago 37 2 39 Mahnomen 26 -- 26 Crow Wing 20 2 22 Marshall 14 -- 14 Hennepin
31 -- 31
Norman 15 3 18 Isanti 11 2 13 Pennington 8 3 11 Kanabec 35 8 43 Polk 29 6 35 Mille Lacs 64 18 82 Red Lake 13 -- 13 Pine 84 21 105 Roseau 26 5 31 Ramsey 1 -- 1 Northwest 249 38 287 Washington 25 -- 25 East Central 348 70 418 Beltrami 25 1 26 Cass 18 9 27 Cottonwood 12 7 19 Hubbard 7 2 9 Jackson 4 4 8 Itasca 5 -- 5 Lincoln 22 13 35 Koochiching 4 -- 4 Lyon 14 7 21 Lake of the Woods 3 -- 3 Murray 33 9 42 North Central 62 12 74 Nobles 31 12 43 Pipestone 39 10 49 Cook -- -- -- Redwood 17 11 28 Lake -- -- -- Rock 22 6 28 St. Louis 17 2 19 Southwest 194 79 273 Northeast 17 2 19 Blue Earth 17 7 24 Big Stone 12 4 16 Brown 90 20 110 Chippewa 5 1 6 Faribault 12 1 13 Douglas 136 24 160 Freeborn 18 7 25 Grant 17 4 21 Le Sueur 32 9 41 Lac Qui Parle 14 11 25 Martin 11 3 14 Otter Tail 352 43 395 Nicollet
57 11 68
Pope 90 9 99 Rice 107 26 133 Stevens 9 1 10 Steele 70 10 80 Swift 26 3 29 Waseca 27 3 30 Traverse -- -- -- Watonwan 9 2 11 Wilkin 8 1 9 South Central 450 99 549 Yellow Medicine
15 8 23 West Central 684 109 793 Dakota 44 1 45 Dodge 48 4 52 Benton 156 10 166 Fillmore 118 62 180 Carver 128 29 157 Goodhue 203 10 213 Kandiyohi 105 12 117 Houston 101 19 120 McLeod 105 21 126 Mower 56 6 62 Meeker 80 10 90 Olmsted 116 15 131 Morrison 362 40 402 Wabasha
181 29 210
Renville 34 6 40 Winona 229 27 256 Scott 66 9 75 Southeast 1,096 173 1,269 Sherburne 10 5 15 Sibley 74 15 89 Minnesota 5,568 898 6,466 Stearns 878 65 943 Todd 274 53 327 Wadena 74 11 85 Wright 122 30 152 Central 2,468 316 2,784 1/ “-- “ indicates no dairy operations for the particular grade.
2/ Fluid market milk 3/ Manufacturing grade milk Source: MN Department of Agriculture, Dairy & Food Division

2003 Minnesota Agricultural Statistics
87LIVESTOCK, DAIRY, POULTRY
POULTRY In 2002, Minnesota turkey growers ranked second in turkeys raised and second in pounds produced. Minnesota raised 44.0 million turkeys, the same amount as 2001. The total liveweight of turkeys produced was 1.15 billion pounds, up 4% from the previous year. The average price received for turkeys in 2002 was 36 cents per pound, up 1 cent from 2001. The value of the state’s turkey production in 2002 was up 7% to $413.4 million. During 2002, hatcheries in the West North Central Region (which includes the states of Iowa, Kansas, Missouri, Nebraska North Dakota, South Dakota, and Minnesota) placed 108.2 million turkey poults, up 4% from 2001. Minnesota’s total chicken inventory (excluding broilers) on December 1, 2002, was down 7% from the previous year at 14.7 million birds. The state’s egg production in 2002 was 3.12 billion eggs, up slightly from 2001. The value of eggs produced was down 6% in 2002 to $106.2 million. The all-egg price decreased to 40.8 cents per dozen. The annual average number of layers on farms was down 3% at 11.7 million. Value of sales from chickens (excluding broilers) fell 14% to $18,000. In 2002, the number of broilers produced was up 1% to 44.2 Million. From 2001 to 2002, value of production decreased 19% to $68.9 million. The annual average price per pound decreased to 30.0 cents per pound. Hatchery production of egg-type chicks decreased 7% to 17.6 million in 2002. These poultry estimates are based on survey data reported by producers, hatcheries, and processing plants.
MINNESOTA TURKEY PRODUCTION
0.0
10.0
20.0
30.0
40.0
50.0
1990 1991 1992 1993 1994 1995 1996 1997 1998 1999 2000 2001 2002
Mill
ion
Hea
d
300
400
500
600
700800
900
1,000
1,100
1,200
Millio
n L
bs.
Live Pounds Produced Number Raised

2003 Minnesota Agricultural Statistics
88 LIVESTOCK, DAIRY, POULTRY
POULTRY: Chicken Inventory, Egg Production, and Value, Minnesota, 1998-2002 Chickens on Farms,
Dec 1 Chickens 1/ 2/ Eggs 1/
Year All Hens & Pullets of Laying Age
Number Sold
Value of Sales
Number Produced
Value of Production
Egg-Type Chicks
Hatched
--- 1,000 Birds -- 1,000 Birds 1,000 Dollars Mil. Eggs 1,000 Dollars 1,000 Birds
1998 15,575 12,240 6,100 571 3,152 126,868 22,273
1999 16,625 12,965 6,200 239 3,138 114,537 20,746
2000 15,815 12,480 6,277 45 3,271 116,666 20,144
2001 15,803 12,215 5,792 21 3,112 112,810 19,000
2002 14,685 11,460 5,054 18 3,124 106,216 17,840 1/ December previous year through November current year.
2/ Excludes commercial broilers.
POULTRY: Broiler and Turkey Production, and Value, Minnesota, 1998-2002 Commercial Broilers 1/ Turkeys
Year Number Raised
Value of Production Number Raised
Value of Production
1,000 Birds 1,000 Dollars 1,000 Birds 1,000 Dollars
1998 42,300 80,847 44,500 359,783
1999 44,200 77,976 43,500 373,013
2000 44,200 72,930 43,500 360,876
2001 43,900 85,605 44,000 385,000
2002 44,200 68,940 44,000 413,424
1/ December previous year through November current year.
POULTRY: Layers and Egg Production by District, Minnesota 2001-2002
District Annual Average
Layers Annual Average Eggs per Layer
Total Egg Production
2001 2002 2001 2002 2001 2002 ---------------------------------- Number ---------------------------------- ---------- 1,000 Eggs ----------
Northwest 990,000 939,000 256 266 253,000 250,000
West Central 500,000 470,000 260 266 130,000 125,000
Central 7,336,000 7,037,000 257 266 1,885,000 1,874,000
Southwest 300,000 352,000 253 267 76,000 94,000
South Central 2,170,000 2,111,000 254 266 552,000 562,000
Southeast 265,000 235,000 253 268 67,000 63,000
Other Districts 580,000 585,000 257 267 149,000 156,000
Minnesota 12,141,000 11,729,000 256 266 3,112,000 3,124,000 Note: Poultry estimates by county are not available.
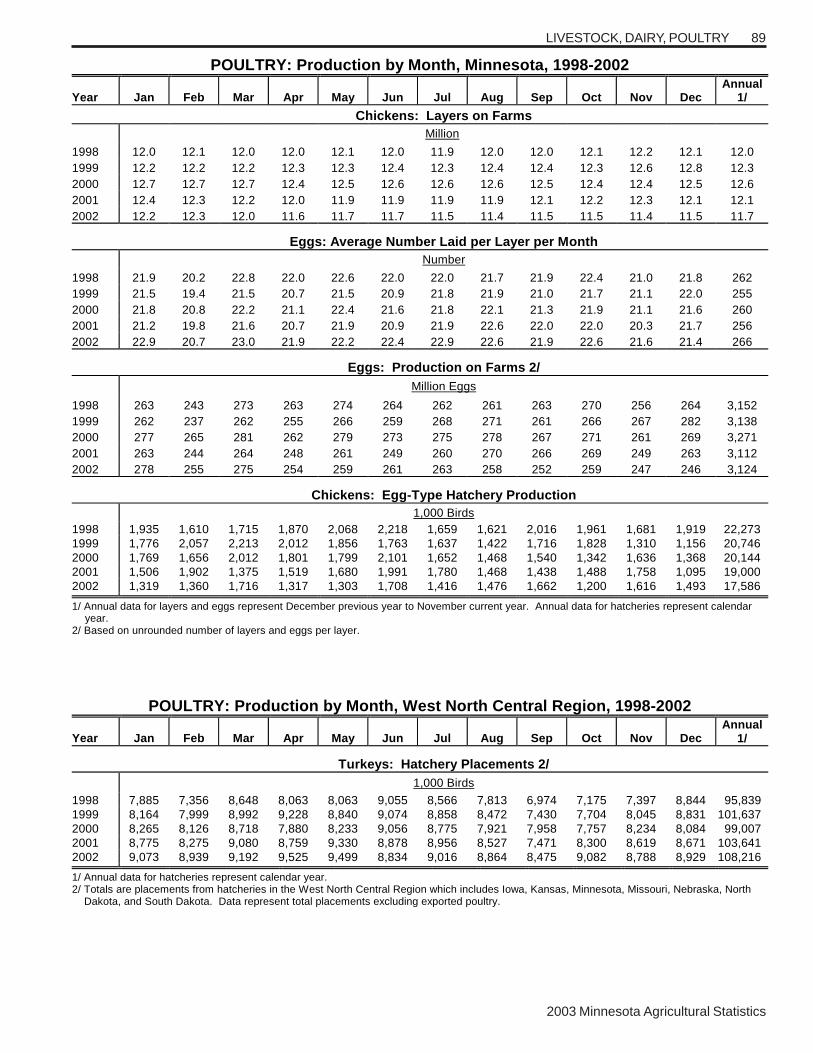
2003 Minnesota Agricultural Statistics
89LIVESTOCK, DAIRY, POULTRY
POULTRY: Production by Month, Minnesota, 1998-2002
Year�
Jan�
Feb�
Mar�
Apr�
May�
Jun�
Jul�
Aug�
Sep�
Oct�
Nov�
Dec�
Annual 1/�
� Chickens: Layers on Farms
� � � � �
Million � � � � � �
1998� 12.0� 12.1� 12.0� 12.0� 12.1� 12.0� 11.9� 12.0� 12.0� 12.1� 12.2� 12.1� 12.0�1999� 12.2 12.2 12.2 12.3 12.3 12.4 12.3 12.4 12.4 12.3 12.6 12.8 12.3 2000� 12.7 12.7 12.7 12.4 12.5 12.6 12.6 12.6 12.5 12.4 12.4 12.5 12.6 2001 12.4 12.3 12.2 12.0 11.9 11.9 11.9 11.9 12.1 12.2 12.3 12.1 12.1 2002 12.2 12.3 12.0 11.6 11.7 11.7 11.5 11.4 11.5 11.5 11.4 11.5 11.7
� Eggs: Average Number Laid per Layer per Month �
Number
1998� 21.9� 20.2� 22.8� 22.0� 22.6� 22.0� 22.0� 21.7� 21.9� 22.4� 21.0� 21.8� 262�1999
�
21.5 19.4 21.5 20.7 21.5 20.9 21.8 21.9 21.0 21.7 21.1 22.0 255 2000� 21.8 20.8 22.2 21.1 22.4 21.6 21.8 22.1 21.3 21.9 21.1 21.6 260 2001� 21.2 19.8 21.6 20.7 21.9 20.9 21.9 22.6 22.0 22.0 20.3 21.7 256 2002� 22.9 20.7 23.0 21.9 22.2 22.4 22.9 22.6 21.9 22.6 21.6 21.4 266
� Eggs: Production on Farms 2/ �
Million Eggs
1998� 263� 243� 273� 263� 274� 264� 262� 261� 263� 270� 256� 264� 3,152�1999� 262 237 262 255 266 259 268 271 261 266 267 282 3,138 2000
�
277 265 281 262 279 273 275 278 267 271 261 269 3,271 2001
�
263 244 264 248 261 249 260 270 266 269 249 263 3,112 2002� 278 255 275 254 259 261 263 258 252 259 247 246 3,124
� Chickens: Egg-Type Hatchery Production �
1,000 Birds�1998� 1,935� 1,610� 1,715� 1,870� 2,068� 2,218� 1,659� 1,621� 2,016� 1,961� 1,681� 1,919� 22,273�1999� 1,776 2,057 2,213 2,012 1,856 1,763 1,637 1,422 1,716 1,828 1,310 1,156 20,746 2000� 1,769 1,656 2,012 1,801 1,799 2,101 1,652 1,468 1,540 1,342 1,636 1,368 20,144 2001� 1,506 1,902 1,375 1,519 1,680 1,991 1,780 1,468 1,438 1,488 1,758 1,095 19,000 2002� 1,319 1,360 1,716 1,317 1,303 1,708 1,416 1,476 1,662 1,200 1,616 1,493 17,586 1/ Annual data for layers and eggs represent December previous year to November current year. Annual data for hatcheries represent calendar year. 2/ Based on unrounded number of layers and eggs per layer.
�
�
POULTRY: Production by Month, West North Central Region, 1998-2002
Year Jan�
Feb�
Mar�
Apr�
May�
Jun�
Jul�
Aug�
Sep�
Oct�
Nov�
Dec�
Annual 1/�
� Turkeys: Hatchery Placements 2/ �
1,000 Birds�
1998�
7,885�
7,356�
8,648�
8,063�
8,063�
9,055�
8,566�
7,813�
6,974�
7,175�
7,397�
8,844�
95,839�
1999�
8,164 7,999 8,992 9,228 8,840 9,074 8,858 8,472 7,430 7,704 8,045 8,831 101,637 2000
�
8,265 8,126 8,718 7,880 8,233 9,056 8,775 7,921 7,958 7,757 8,234 8,084 99,007 2001
�
8,775 8,275 9,080 8,759 9,330 8,878 8,956 8,527 7,471 8,300 8,619 8,671 103,641 2002 9,073 8,939 9,192 9,525 9,499 8,834 9,016 8,864 8,475 9,082 8,788 8,929 108,216
1/ Annual data for hatcheries represent calendar year. 2/ Totals are placements from hatcheries in the West North Central Region which includes Iowa, Kansas, Minnesota, Missouri, Nebraska, North Dakota, and South Dakota. Data represent total placements excluding exported poultry.
�
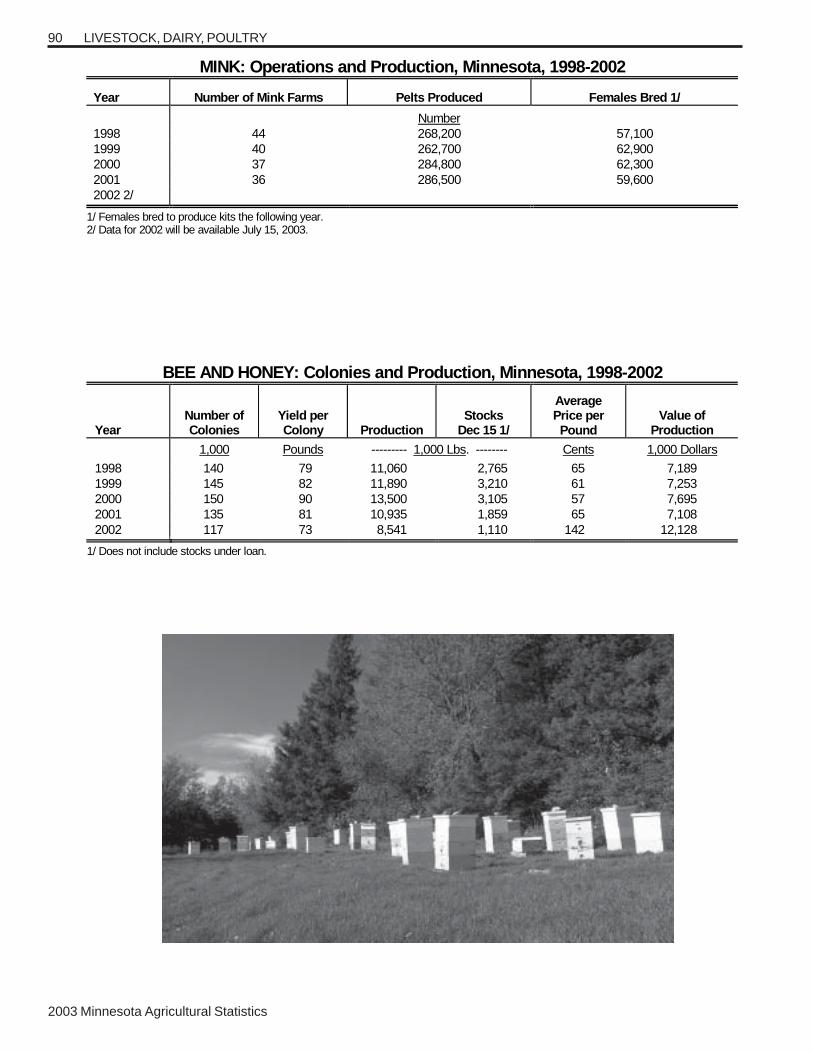
2003 Minnesota Agricultural Statistics
90
MINK: Operations and Production, Minnesota, 1998-2002
Year Number of Mink Farms Pelts Produced Females Bred 1/
Number 1998 44 268,200 57,100 1999 40 262,700 62,900 2000 37 284,800 62,300 2001 36 286,500 59,600 2002 2/
1/ Females bred to produce kits the following year. 2/ Data for 2002 will be available July 15, 2003.
BEE AND HONEY: Colonies and Production, Minnesota, 1998-2002
Year Number of Colonies
Yield per Colony Production
Stocks Dec 15 1/
Average Price per Pound
Value of Production
1,000 Pounds --------- 1,000 Lbs. -------- Cents 1,000 Dollars
1998 140 79 11,060 2,765 65 7,189 1999 145 82 11,890 3,210 61 7,253 2000 150 90 13,500 3,105 57 7,695 2001 135 81 10,935 1,859 65 7,108 2002 117 73 8,541 1,110 142 12,128 1/ Does not include stocks under loan.
LIVESTOCK, DAIRY, POULTRY
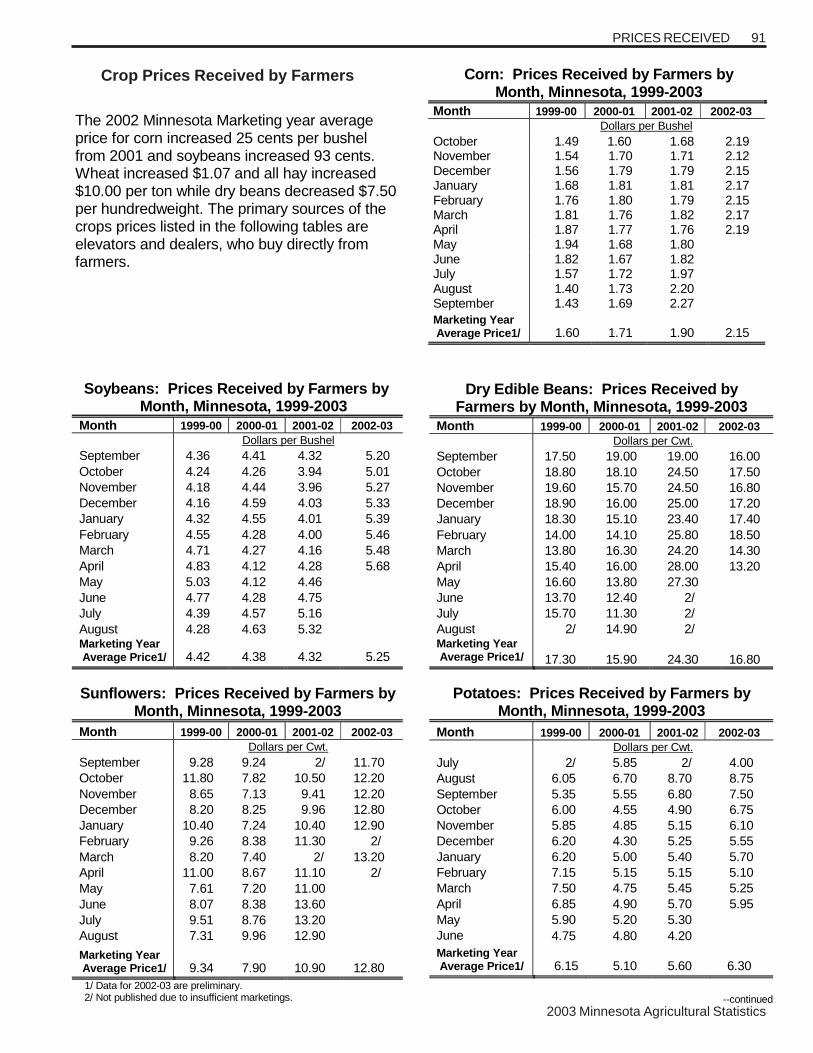
91
2003 Minnesota Agricultural Statistics
PRICES RECEIVED
The 2002 Minnesota Marketing year average price for corn increased 25 cents per bushel from 2001 and soybeans increased 93 cents. Wheat increased $1.07 and all hay increased $10.00 per ton while dry beans decreased $7.50 per hundredweight. The primary sources of the crops prices listed in the following tables are elevators and dealers, who buy directly from farmers.
Soybeans: Prices Received by Farmers by
Month, Minnesota, 1999-2003 Month 1999-00 2000-01 2001-02 2002-03 Dollars per Bushel September 4.36 4.41 4.32 5.20 October 4.24 4.26 3.94 5.01 November 4.18 4.44 3.96 5.27 December 4.16 4.59 4.03 5.33 January 4.32 4.55 4.01 5.39 February 4.55 4.28 4.00 5.46 March 4.71 4.27 4.16 5.48 April 4.83 4.12 4.28 5.68 May 5.03 4.12 4.46 June 4.77 4.28 4.75 July 4.39 4.57 5.16 August 4.28 4.63 5.32 Marketing Year Average Price1/ 4.42 4.38 4.32 5.25 Sunflowers: Prices Received by Farmers by
Month, Minnesota, 1999-2003 Month 1999-00 2000-01 2001-02 2002-03 Dollars per Cwt. September 9.28 9.24 2/ 11.70 October 11.80 7.82 10.50 12.20 November 8.65 7.13 9.41 12.20 December 8.20 8.25 9.96 12.80 January 10.40 7.24 10.40 12.90 February 9.26 8.38 11.30 2/ March 8.20 7.40 2/ 13.20 April 11.00 8.67 11.10 2/ May 7.61 7.20 11.00 June 8.07 8.38 13.60 July 9.51 8.76 13.20 August 7.31 9.96 12.90 Marketing Year Average Price1/ 9.34 7.90 10.90 12.80 1/ Data for 2002-03 are preliminary.
2/ Not published due to insufficient marketings.
Dry Edible Beans: Prices Received by
Farmers by Month, Minnesota, 1999-2003 Month 1999-00 2000-01 2001-02 2002-03 Dollars per Cwt. September 17.50 19.00 19.00 16.00 October 18.80 18.10 24.50 17.50 November 19.60 15.70 24.50 16.80 December 18.90 16.00 25.00 17.20 January 18.30 15.10 23.40 17.40 February 14.00 14.10 25.80 18.50 March 13.80 16.30 24.20 14.30 April 15.40 16.00 28.00 13.20 May 16.60 13.80 27.30 June 13.70 12.40 2/ July 15.70 11.30 2/ August 2/ 14.90 2/ Marketing Year Average Price1/
17.30
15.90
24.30
16.80
Potatoes: Prices Received by Farmers by
Month, Minnesota, 1999-2003 Month 1999-00 2000-01 2001-02 2002-03 Dollars per Cwt. July 2/ 5.85 2/ 4.00 August 6.05 6.70 8.70 8.75 September 5.35 5.55 6.80 7.50 October 6.00 4.55 4.90 6.75 November 5.85 4.85 5.15 6.10 December 6.20 4.30 5.25 5.55 January 6.20 5.00 5.40 5.70 February 7.15 5.15 5.15 5.10 March 7.50 4.75 5.45 5.25 April 6.85 4.90 5.70 5.95 May 5.90 5.20 5.30 June 4.75 4.80 4.20 Marketing Year Average Price1/ 6.15 5.10
5.60 6.30
--continued
Corn: Prices Received by Farmers by
Month, Minnesota, 1999-2003 Month 1999-00 2000-01 2001-02 2002-03 Dollars per Bushel October 1.49 1.60 1.68 2.19 November 1.54 1.70 1.71 2.12 December 1.56 1.79 1.79 2.15 January 1.68 1.81 1.81 2.17 February 1.76 1.80 1.79 2.15 March 1.81 1.76 1.82 2.17 April 1.87 1.77 1.76 2.19 May 1.94 1.68 1.80 June 1.82 1.67 1.82 July 1.57 1.72 1.97 August 1.40 1.73 2.20 September 1.43 1.69 2.27 Marketing Year Average Price1/ 1.60
1.71 1.90 2.15
Crop Prices Received by Farmers
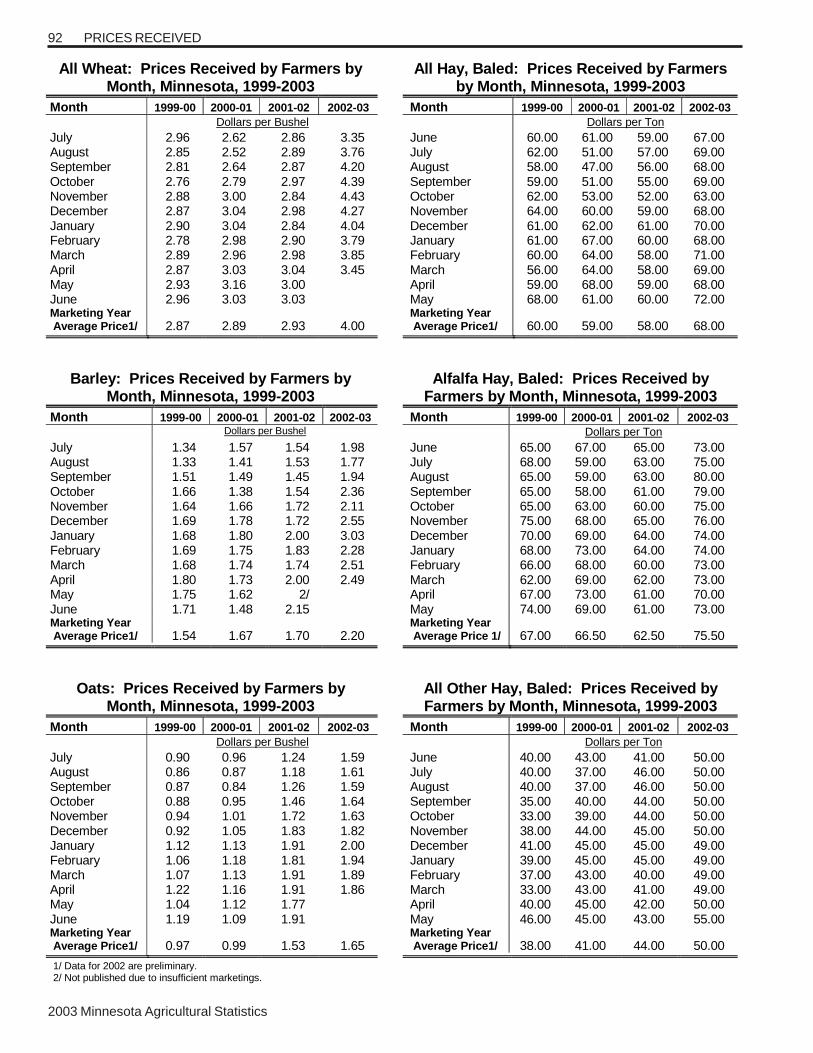
92
2003 Minnesota Agricultural Statistics
PRICES RECEIVED
All Wheat: Prices Received by Farmers by Month, Minnesota, 1999-2003
Month 1999-00 2000-01 2001-02 2002-03 Dollars per Bushel July 2.96 2.62 2.86 3.35 August 2.85 2.52 2.89 3.76 September 2.81 2.64 2.87 4.20 October 2.76 2.79 2.97 4.39 November 2.88 3.00 2.84 4.43 December 2.87 3.04 2.98 4.27 January 2.90 3.04 2.84 4.04 February 2.78 2.98 2.90 3.79 March 2.89 2.96 2.98 3.85 April 2.87 3.03 3.04 3.45 May 2.93 3.16 3.00 June 2.96 3.03 3.03 Marketing Year Average Price1/ 2.87 2.89 2.93 4.00
Barley: Prices Received by Farmers by
Month, Minnesota, 1999-2003 Month 1999-00 2000-01 2001-02 2002-03 Dollars per Bushel
July 1.34 1.57 1.54 1.98 August 1.33 1.41 1.53 1.77 September 1.51 1.49 1.45 1.94 October 1.66 1.38 1.54 2.36 November 1.64 1.66 1.72 2.11 December 1.69 1.78 1.72 2.55 January 1.68 1.80 2.00 3.03 February 1.69 1.75 1.83 2.28 March 1.68 1.74 1.74 2.51 April 1.80 1.73 2.00 2.49 May 1.75 1.62 2/ June 1.71 1.48 2.15 Marketing Year Average Price1/ 1.54 1.67 1.70 2.20
Oats: Prices Received by Farmers by Month, Minnesota, 1999-2003
Month 1999-00 2000-01 2001-02 2002-03 Dollars per Bushel July 0.90 0.96 1.24 1.59 August 0.86 0.87 1.18 1.61 September 0.87 0.84 1.26 1.59 October 0.88 0.95 1.46 1.64 November 0.94 1.01 1.72 1.63 December 0.92 1.05 1.83 1.82 January 1.12 1.13 1.91 2.00 February 1.06 1.18 1.81 1.94 March 1.07 1.13 1.91 1.89 April 1.22 1.16 1.91 1.86 May 1.04 1.12 1.77 June 1.19 1.09 1.91 Marketing Year Average Price1/ 0.97 0.99 1.53 1.65 1/ Data for 2002 are preliminary. 2/ Not published due to insufficient marketings.
All Hay, Baled: Prices Received by Farmers by Month, Minnesota, 1999-2003
Month 1999-00 2000-01 2001-02 2002-03 Dollars per Ton June 60.00 61.00 59.00 67.00 July 62.00 51.00 57.00 69.00 August 58.00 47.00 56.00 68.00 September 59.00 51.00 55.00 69.00 October 62.00 53.00 52.00 63.00 November 64.00 60.00 59.00 68.00 December 61.00 62.00 61.00 70.00 January 61.00 67.00 60.00 68.00 February 60.00 64.00 58.00 71.00 March 56.00 64.00 58.00 69.00 April 59.00 68.00 59.00 68.00 May 68.00 61.00 60.00 72.00 Marketing Year Average Price1/ 60.00 59.00 58.00 68.00
Alfalfa Hay, Baled: Prices Received by Farmers by Month, Minnesota, 1999-2003
Month 1999-00 2000-01 2001-02 2002-03 Dollars per Ton June 65.00 67.00 65.00 73.00 July 68.00 59.00 63.00 75.00 August 65.00 59.00 63.00 80.00 September 65.00 58.00 61.00 79.00 October 65.00 63.00 60.00 75.00 November 75.00 68.00 65.00 76.00 December 70.00 69.00 64.00 74.00 January 68.00 73.00 64.00 74.00 February 66.00 68.00 60.00 73.00 March 62.00 69.00 62.00 73.00 April 67.00 73.00 61.00 70.00 May 74.00 69.00 61.00 73.00 Marketing Year Average Price 1/ 67.00 66.50 62.50 75.50
All Other Hay, Baled: Prices Received by Farmers by Month, Minnesota, 1999-2003
Month 1999-00 2000-01 2001-02 2002-03 Dollars per Ton June 40.00 43.00 41.00 50.00 July 40.00 37.00 46.00 50.00 August 40.00 37.00 46.00 50.00 September 35.00 40.00 44.00 50.00 October 33.00 39.00 44.00 50.00 November 38.00 44.00 45.00 50.00 December 41.00 45.00 45.00 49.00 January 39.00 45.00 45.00 49.00 February 37.00 43.00 40.00 49.00 March 33.00 43.00 41.00 49.00 April 40.00 45.00 42.00 50.00 May 46.00 45.00 43.00 55.00 Marketing Year Average Price1/ 38.00 41.00 44.00 50.00

93
2003 Minnesota Agricultural Statistics
LIVESTOCK, DAIRY, AND POULTRY PRICES The livestock and dairy price statistics included in these tables are based on reports from farmers, auction markets, livestock buyers, meat and poultry processing plants, Market News Service, produce houses, egg handlers and dealers, marketing cooperatives, dairy plants, and other firms doing business with farmers. The marketing year for livestock, dairy, and poultry items is a calendar year; except for hogs, chickens, and eggs, which are on a December-November basis. The 2002 Minnesota annual average prices for meat animals were lower than 2001 except for lambs. Beef cattle were down $5.90 per hundredweight and steers and heifers were down $6.30. Cows decreased $3.20 and calves were down $9.80. All hogs decreased $10.90 while barrows and gilts were down $11.10. Sows decreased $13.80. Sheep were down $2.60 while lambs were up $9.10. All milk was $12.10 while grade A fluid milk was $12.20 and manufacturing milk was $10.60 per 100 pounds. Milk cows for dairy herd replacement were up $80.00 per head. Turkeys were 36 cents per pound, up 1 cent from the previous year and table market eggs at 37 cents per dozen were down 3 cents.
PRICES RECEIVED BY FARMERS FOR LIVESTOCK, DAIRY, AND POULTRY By Month, Minnesota, 1998-2002
Year Jan� Feb� Mar� Apr� May� Jun� Jul� Aug� Sep� Oct� Nov� Dec
Annual Average
Price
�
Beef Cattle 1/ Dollars per Cwt.
1998 60.70 59.60 57.70 59.00 59.50 59.50 58.90 56.70 55.20 54.30 54.20 54.60 57.30 1999 54.60 55.40 57.90 58.00 57.80 59.30 57.90 58.30 59.10 60.40 60.50 62.00 58.50 2000 60.80 61.70 62.20 65.30 65.80 64.00 62.20 61.30 59.50 60.20 60.70 62.30 62.20 2001 68.10 70.10 70.50 70.90 69.30 70.70 68.50 64.70 64.10 60.60 57.70 57.90 65.90 2002 59.00 62.50 64.20 62.30 61.30 58.50 57.10 57.90 57.90 57.20 59.80 63.30 60.00
�
Steers and Heifers �
Dollars per Cwt.�1998� 63.60 62.20 61.80 63.30 64.00 64.50 63.60 59.80 58.90 58.90 59.20 57.90 61.30 1999� 60.30 59.90 61.30 62.50 61.80 63.10 62.20 62.70 63.80 65.40 66.60 67.10 63.20 2000� 66.30 66.00 67.70 70.10 70.10 68.50 66.30 64.70 63.50 64.30 65.80 68.70 66.80 2001� 73.60 75.40 77.10 76.40 74.30 74.90 72.60 69.80 68.20 65.10 62.60 61.60 71.00 2002� 63.80 67.50 69.90 67.80 64.80 62.30 60.40 61.50 61.90 63.00 65.40 69.50 64.70
�
Cows 2/ �
Dollars per Cwt.�1998 33.00 36.70 35.60 35.60 38.80 37.10 36.20 35.50 33.20 32.30 31.00 32.40 34.50 1999 34.30 35.60 35.60 34.90 38.00 38.40 39.10 36.80 36.20 35.80 34.60 35.90 36.20 2000 36.60 38.20 40.40 42.10 41.40 42.00 41.70 41.60 39.40 37.60 37.80 38.00 39.70 2001 39.70 45.20 44.10 45.90 47.10 48.10 46.00 45.40 43.50 39.60 36.60 36.80 42.80 2002 39.60 42.70 43.90 42.80 42.90 41.30 39.60 38.70 37.20 36.50 36.10 37.10 39.60
�
Calves �
Dollars per Cwt.�1998 71.00 74.00 70.40 72.50 78.20 72.60 63.80 66.80 62.60 65.20 60.60 68.70 68.80 1999 71.20 72.60 75.00 78.80 79.50 80.20 79.80 81.60 84.30 84.70 79.30 90.20 79.70 2000 90.50 89.10 95.10 104.00 103.00 98.20 93.50 96.40 95.80 91.90 91.10 90.30 94.80 2001 93.40 94.70 99.50 104.00 104.00 106.00 99.00 92.00 98.00 83.00 83.60 88.50 95.20 2002 93.50 96.80 96.90 96.00 96.70 83.40 76.20 83.00 76.00 79.80 72.90 80.90 85.40
1/ Cows and Steers and Heifers combined. 2/ Beef cows and dairy cows sold for slaughter.
--continued�
PRICES RECEIVED
94
2003 Minnesota Agricultural Statistics
PRICES RECEIVED
PRICES RECEIVED BY FARMERS FOR LIVESTOCK, DAIRY, AND POULTRY By Month, Minnesota, 1998-2002 (continued)
Year Jan� Feb� Mar� Apr� May� Jun� Jul� Aug� Sep� Oct� Nov� Dec�
Annual Average
Price�
�
Hogs 1/ 2/ � Dollars per Cwt.�
1998� 36.30� 37.30� 35.40� 35.40� 42.40� 43.50� 38.20� 36.70� 30.30� 29.00� 19.30� 15.20� 35.50�1999� 25.80 28.10 26.10 29.30 37.30 34.80 31.10 36.80 33.50 34.20 33.60 36.20 30.50 2000 36.40 40.50 42.20 48.40 50.40 51.50 51.20 46.70 43.50 44.50 38.90 41.80 44.00 2001 37.40 39.60 46.60 48.30 52.60 53.20 53.70 52.60 45.20 41.03 34.70 34.20 45.50 2002 37.90 40.60 37.00 31.90 33.90 36.30 41.40 35.80 28.90 31.80 27.50 30.40 34.60
�
Barrows and Gilts 1/ � Dollars per Cwt.�
1998� 36.60� 37.60� 35.70� 35.70� 42.90� 44.10� 38.70� 37.10� 30.80� 29.30� 19.40� 15.30� 35.90�1999� 26.00 28.40 26.20 29.50 37.50 35.00 31.50 37.30 33.90 34.50 33.90 36.50 30.70 2000� 36.50 40.60 42.40 48.80 50.70 51.70 51.50 46.90 43.80 44.60 39.10 42.00 44.30 2001 37.50 39.80 47.00 48.60 53.20 53.80 54.10 53.10 45.70 41.60 34.80 34.30 45.80 2002 38.00 40.70 37.00 32.00 34.00 36.40 41.60 36.00 29.00 31.90 27.50 30.50 34.70
�
Sows 1/ � Dollars per Cwt.�
1998� 27.70� 28.30� 27.90� 27.90� 30.20� 30.40� 27.00� 25.40� 20.00� 20.20� 16.50� 11.60� 26.20�1999� 20.20 18.90 22.30 24.20 32.40 30.20 21.10 25.40 23.30 26.50 24.30 27.60 23.80 2000� 33.30 38.00 35.80 39.60 40.90 36.70 35.60 35.30 34.80 33.70 29.00 30.50 35.20 2001 32.50 34.00 37.20 42.30 40.70 41.60 42.20 40.50 34.40 33.80 28.40 24.10 37.60 2002 26.60 28.60 31.50 25.70 23.60 21.90 20.70 20.20 15.00 20.20 21.40 23.10 23.80
�
Sheep � Dollars per Cwt.�
1998� 38.20� 38.70� 37.50� 30.20� 26.90� 22.80� 23.70� 23.00� 23.90� 21.60� 20.50� 27.10� 27.20�1999� 29.10 22.60 25.40 25.70 26.60 22.90 23.20 24.40 24.70 23.20 25.20 27.10 25.00 2000� 28.60 32.10 30.30 26.30 25.00 26.30 30.80 27.50 26.00 24.10 26.70 29.00 27.40 2001 30.00 30.00 32.20 27.10 25.60 21.10 25.20 25.50 23.70 17.60 20.60 25.90 24.90 2002 28.50 27.60 24.20 19.30 19.00 18.00 19.00 21.20 21.00 23.00 26.00 31.00 22.30
�
Lambs�� Dollars per Cwt.�
1998� 76.40� 71.00� 69.10� 65.00� 71.40� 92.60� 78.70� 78.50� 71.20� 64.50� 58.30� 61.80� 71.40�1999� 68.20 64.50 63.50 65.80 87.80 79.30 77.50 80.70 71.60 69.20 74.30 75.90 73.20 2000� 70.70 72.10 75.80 78.70 97.80 88.30 83.50 80.20 73.20 69.10 64.50 71.20 75.40 2001 73.70 83.40 85.00 83.30 87.20 68.80 59.20 49.60 48.00 44.80 48.80 61.70 62.00 2002 61.90 63.90 63.10 58.90 63.30 73.20 75.50 71.60 69.10 75.00 80.80 84.10 71.10 1/ Annual average price is the marketing year average -- December previous year through November current year. 2/ “Barrows and Gilts” and “Sows” combined.
--continued
�
�
�
�
�
�
�
�
�
�

95
2003 Minnesota Agricultural Statistics
PRICES RECEIVED
PRICES RECEIVED BY FARMERS FOR LIVESTOCK, DAIRY, AND POULTRY By Month, Minnesota, 1998-2002 (continued)
Year� Jan� Feb� Mar� Apr� May� Jun� Jul� Aug� Sep� Oct� Nov� Dec�
Annual Average
Price�
� All Milk�� Dollars per Cwt.�
1998� 14.83� 14.84� 14.28� 13.41� 12.47� 14.22� 15.11� 15.61� 16.76� 18.07� 18.66� 18.86� 15.55�1999� 17.05 13.51 13.69 13.00 12.52 12.97 14.38 16.63 16.34 13.93 12.40 11.77 14.00 2000 11.60 11.30 11.50 11.60 11.50 12.00 12.40 12.30 12.80 12.30 11.90 12.60 12.00 2001 12.70 12.90 13.80 14.40 15.70 16.20 16.20 16.40 17.30 15.80 14.20 13.70 14.90 2002 13.80 12.90 12.50 12.40 12.10 11.30 10.70 11.10 11.70 12.40 11.80 11.80 12.10
� Fluid Grade Milk�� Dollars per Cwt.�
1998� 14.93� 14.94� 14.39� 13.52� 12.59� 14.32� 15.19� 15.69� 16.86� 18.15� 18.74� 18.95� 15.65�1999� 17.16 13.62 13.80 13.08 12.61 13.05 14.46 16.71 16.42 14.03 12.50 11.84 14.10 2000� 11.70 11.40 11.60 11.70 11.60 12.10 12.50 12.40 12.90 12.40 12.00 12.70 12.10 2001� 12.80 13.00 13.90 14.50 15.80 16.30 16.30 16.50 17.30 15.80 14.30 13.80 15.00 2002 13.90 13.00 12.60 12.50 12.20 11.40 10.80 11.20 11.80 12.50 11.90 11.90 12.20
� Manufacturing Grade Milk�� Dollars per Cwt.�
1998� 13.50� 13.48� 12.92� 11.99� 11.05� 13.04� 14.08� 14.54� 15.45� 16.95� 17.53� 17.70� 14.24�1999� 15.54 11.93 12.18 11.86 11.30 11.80 13.28 15.43 15.14 12.41 10.78 10.50 12.70 2000� 10.30 9.90 9.80 9.80 9.80 10.30 10.60 10.50 11.30 10.50 10.00 10.60 10.30 2001� 10.60 10.90 12.20 12.80 14.50 15.20 14.90 15.20 16.30 14.60 12.30 12.30 13.40 2002 12.30 11.60 11.10 11.10 10.80 10.00 9.10 9.50 10.10 11.00 10.40 10.30 10.60
� Milk Cows 1/�� Dollars per Head�
1998� 990� --� --� 1,050� --� --� 1,030� --� --� 1,110� --� --� 1,050�1999� 1,190 --� --� 1,150 --� --� 1,260 --� --� 1,360 --� --� 1,240 2000� 1,220 --� --� 1,250 --� --� 1,260 --� --� 1,260 --� --� 1,250 2001� 1,180 --� --� 1,320 --� --� 1,570 --� --� 1,590 --� --� 1,420 2002� 1,470� --� --� 1,650 --� --� 1,580 --� --� 1,280 --� --� 1,500 1/ Milk cows for dairy herd replacement only.
-- continued

96
2003 Minnesota Agricultural Statistics
PRICES RECEIVED
PRICES RECEIVED BY FARMERS FOR LIVESTOCK, DAIRY, AND POULTRY By Month, Minnesota, 1998-2002 (continued)�
Year Jan� Feb� Mar� Apr� May� Jun� Jul� Aug� Sep� Oct� Nov� Dec�
Annual Average
Price�
� Turkeys�� Cents per Pound Live Weight�
1998� 36� 36� 37� 36� 35� 34� 34� 34� 35� 34� 33� 33� 35�1999� 33 33 34 35 36 37 35 35 35 35 34 36 35 2000 33 33 34 35 35 35 34 34 34 35 35 34 34 2001 34 34 34 34 35 35 34 33 34 37 37 35 35 2002 1/ 36 1/ State monthly price discontinued January 2002.
Table Market Eggs 1/ Cents per Dozen
1998 50 43 51 43 33 39 40 44 43 47 51 55 45 1999 55 45 52 37 31 31 35 35 34 26 40 34 40 2000 30 45 37 44 31 38 30 46 35 46 53 67 39 2001 42 45 46 45 35 29 27 32 29 37 42 37 40 2002 40 30 54 27 23 41 32 41 35 31 50 50 37 1/ Table market eggs include eggs sold retail by the producers; but exclude hatching eggs. The annual average price is the marketing year average - December previous year through November current year.
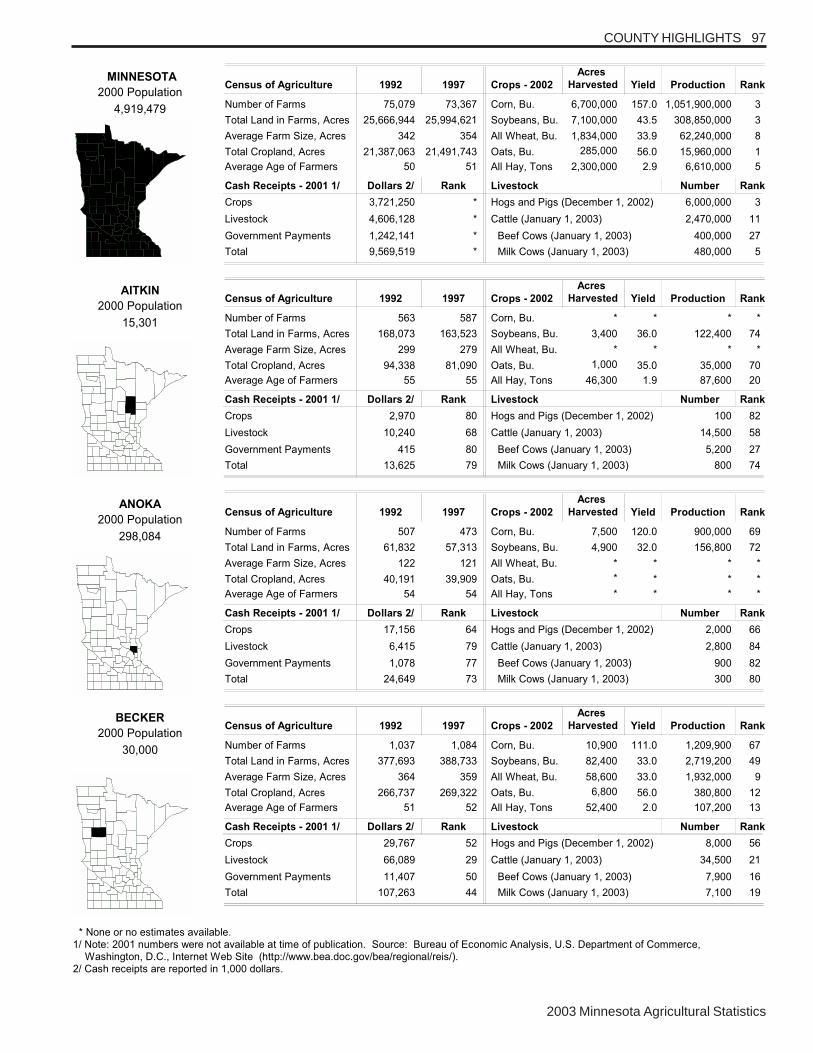
COUNTY HIGHLIGHTS 97
2003 Minnesota Agricultural Statistics
Number of Farms 75,079
Total Land in Farms, Acres 25,666,944
Average Farm Size, Acres 342
Total Cropland, Acres 21,387,063
Average Age of Farmers 50
73,367
25,994,621
354
21,491,743
51
Corn, Bu. 6,700,000
Soybeans, Bu. 7,100,000
All Wheat, Bu. 1,834,000
Oats, Bu. 285,000
All Hay, Tons 2,300,000
157.0
43.5
33.9
56.0
2.9
1,051,900,000
308,850,000
62,240,000
15,960,000
6,610,000
3
3
8
1
5
Crops - 2002
Acres
Harvested Yield Production RankCensus of Agriculture 1992 1997
Crops 3,721,250
Livestock 4,606,128
Government Payments 1,242,141
Total 9,569,519
*
*
*
*
6,000,000
2,470,000
400,000
480,000
3
11
27
5
Hogs and Pigs (December 1, 2002)
Cattle (January 1, 2003)
Beef Cows (January 1, 2003)
Milk Cows (January 1, 2003)
Livestock Number RankCash Receipts - 2001 1/ Dollars 2/ Rank
MINNESOTA
2000 Population
4,919,479
Number of Farms 563
Total Land in Farms, Acres 168,073
Average Farm Size, Acres 299
Total Cropland, Acres 94,338
Average Age of Farmers 55
587
163,523
279
81,090
55
Corn, Bu. *
Soybeans, Bu. 3,400
All Wheat, Bu. *
Oats, Bu. 1,000
All Hay, Tons 46,300
*
36.0
*
35.0
1.9
*
122,400
*
35,000
87,600
*
74
*
70
20
Crops - 2002
Acres
Harvested Yield Production RankCensus of Agriculture 1992 1997
Crops 2,970
Livestock 10,240
Government Payments 415
Total 13,625
80
68
80
79
100
14,500
5,200
800
82
58
27
74
Hogs and Pigs (December 1, 2002)
Cattle (January 1, 2003)
Beef Cows (January 1, 2003)
Milk Cows (January 1, 2003)
Livestock Number RankCash Receipts - 2001 1/ Dollars 2/ Rank
AITKIN
2000 Population
15,301
Number of Farms 507
Total Land in Farms, Acres 61,832
Average Farm Size, Acres 122
Total Cropland, Acres 40,191
Average Age of Farmers 54
473
57,313
121
39,909
54
Corn, Bu. 7,500
Soybeans, Bu. 4,900
All Wheat, Bu. *
Oats, Bu. *
All Hay, Tons *
120.0
32.0
*
*
*
900,000
156,800
*
*
*
69
72
*
*
*
Crops - 2002
Acres
Harvested Yield Production RankCensus of Agriculture 1992 1997
Crops 17,156
Livestock 6,415
Government Payments 1,078
Total 24,649
64
79
77
73
2,000
2,800
900
300
66
84
82
80
Hogs and Pigs (December 1, 2002)
Cattle (January 1, 2003)
Beef Cows (January 1, 2003)
Milk Cows (January 1, 2003)
Livestock Number RankCash Receipts - 2001 1/ Dollars 2/ Rank
ANOKA
2000 Population
298,084
Number of Farms 1,037
Total Land in Farms, Acres 377,693
Average Farm Size, Acres 364
Total Cropland, Acres 266,737
Average Age of Farmers 51
1,084
388,733
359
269,322
52
Corn, Bu. 10,900
Soybeans, Bu. 82,400
All Wheat, Bu. 58,600
Oats, Bu. 6,800
All Hay, Tons 52,400
111.0
33.0
33.0
56.0
2.0
1,209,900
2,719,200
1,932,000
380,800
107,200
67
49
9
12
13
Crops - 2002
Acres
Harvested Yield Production RankCensus of Agriculture 1992 1997
Crops 29,767
Livestock 66,089
Government Payments 11,407
Total 107,263
52
29
50
44
8,000
34,500
7,900
7,100
56
21
16
19
Hogs and Pigs (December 1, 2002)
Cattle (January 1, 2003)
Beef Cows (January 1, 2003)
Milk Cows (January 1, 2003)
Livestock Number RankCash Receipts - 2001 1/ Dollars 2/ Rank
BECKER
2000 Population
30,000
* None or no estimates available.1/ Note: 2001 numbers were not available at time of publication. Source: Bureau of Economic Analysis, U.S. Department of Commerce, Washington, D.C., Internet Web Site (http://www.bea.doc.gov/bea/regional/reis/).2/ Cash receipts are reported in 1,000 dollars.
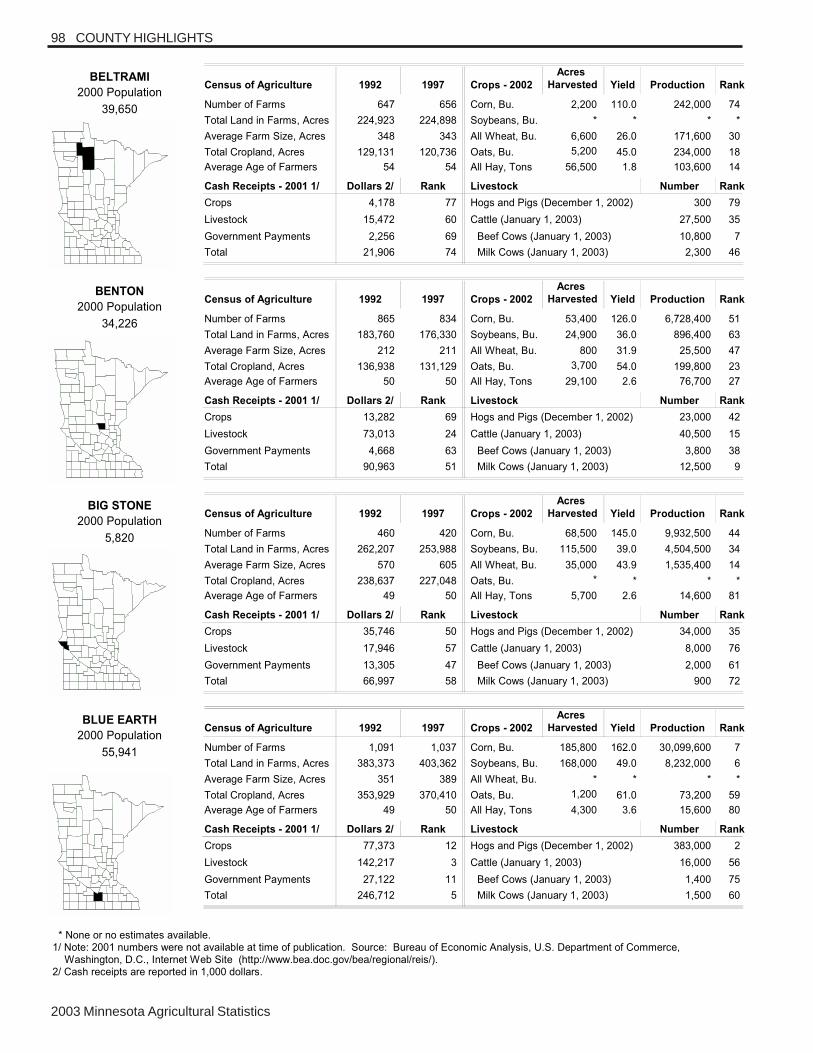
2003 Minnesota Agricultural Statistics
98 COUNTY HIGHLIGHTS
Number of Farms 647
Total Land in Farms, Acres 224,923
Average Farm Size, Acres 348
Total Cropland, Acres 129,131
Average Age of Farmers 54
656
224,898
343
120,736
54
Corn, Bu. 2,200
Soybeans, Bu. *
All Wheat, Bu. 6,600
Oats, Bu. 5,200
All Hay, Tons 56,500
110.0
*
26.0
45.0
1.8
242,000
*
171,600
234,000
103,600
74
*
30
18
14
Crops - 2002
Acres
Harvested Yield Production RankCensus of Agriculture 1992 1997
Crops 4,178
Livestock 15,472
Government Payments 2,256
Total 21,906
77
60
69
74
300
27,500
10,800
2,300
79
35
7
46
Hogs and Pigs (December 1, 2002)
Cattle (January 1, 2003)
Beef Cows (January 1, 2003)
Milk Cows (January 1, 2003)
Livestock Number RankCash Receipts - 2001 1/ Dollars 2/ Rank
BELTRAMI
2000 Population
39,650
Number of Farms 865
Total Land in Farms, Acres 183,760
Average Farm Size, Acres 212
Total Cropland, Acres 136,938
Average Age of Farmers 50
834
176,330
211
131,129
50
Corn, Bu. 53,400
Soybeans, Bu. 24,900
All Wheat, Bu. 800
Oats, Bu. 3,700
All Hay, Tons 29,100
126.0
36.0
31.9
54.0
2.6
6,728,400
896,400
25,500
199,800
76,700
51
63
47
23
27
Crops - 2002
Acres
Harvested Yield Production RankCensus of Agriculture 1992 1997
Crops 13,282
Livestock 73,013
Government Payments 4,668
Total 90,963
69
24
63
51
23,000
40,500
3,800
12,500
42
15
38
9
Hogs and Pigs (December 1, 2002)
Cattle (January 1, 2003)
Beef Cows (January 1, 2003)
Milk Cows (January 1, 2003)
Livestock Number RankCash Receipts - 2001 1/ Dollars 2/ Rank
BENTON
2000 Population
34,226
Number of Farms 460
Total Land in Farms, Acres 262,207
Average Farm Size, Acres 570
Total Cropland, Acres 238,637
Average Age of Farmers 49
420
253,988
605
227,048
50
Corn, Bu. 68,500
Soybeans, Bu. 115,500
All Wheat, Bu. 35,000
Oats, Bu. *
All Hay, Tons 5,700
145.0
39.0
43.9
*
2.6
9,932,500
4,504,500
1,535,400
*
14,600
44
34
14
*
81
Crops - 2002
Acres
Harvested Yield Production RankCensus of Agriculture 1992 1997
Crops 35,746
Livestock 17,946
Government Payments 13,305
Total 66,997
50
57
47
58
34,000
8,000
2,000
900
35
76
61
72
Hogs and Pigs (December 1, 2002)
Cattle (January 1, 2003)
Beef Cows (January 1, 2003)
Milk Cows (January 1, 2003)
Livestock Number RankCash Receipts - 2001 1/ Dollars 2/ Rank
BIG STONE
2000 Population
5,820
Number of Farms 1,091
Total Land in Farms, Acres 383,373
Average Farm Size, Acres 351
Total Cropland, Acres 353,929
Average Age of Farmers 49
1,037
403,362
389
370,410
50
Corn, Bu. 185,800
Soybeans, Bu. 168,000
All Wheat, Bu. *
Oats, Bu. 1,200
All Hay, Tons 4,300
162.0
49.0
*
61.0
3.6
30,099,600
8,232,000
*
73,200
15,600
7
6
*
59
80
Crops - 2002
Acres
Harvested Yield Production RankCensus of Agriculture 1992 1997
Crops 77,373
Livestock 142,217
Government Payments 27,122
Total 246,712
12
3
11
5
383,000
16,000
1,400
1,500
2
56
75
60
Hogs and Pigs (December 1, 2002)
Cattle (January 1, 2003)
Beef Cows (January 1, 2003)
Milk Cows (January 1, 2003)
Livestock Number RankCash Receipts - 2001 1/ Dollars 2/ Rank
BLUE EARTH
2000 Population
55,941
* None or no estimates available.1/ Note: 2001 numbers were not available at time of publication. Source: Bureau of Economic Analysis, U.S. Department of Commerce, Washington, D.C., Internet Web Site (http://www.bea.doc.gov/bea/regional/reis/).2/ Cash receipts are reported in 1,000 dollars.
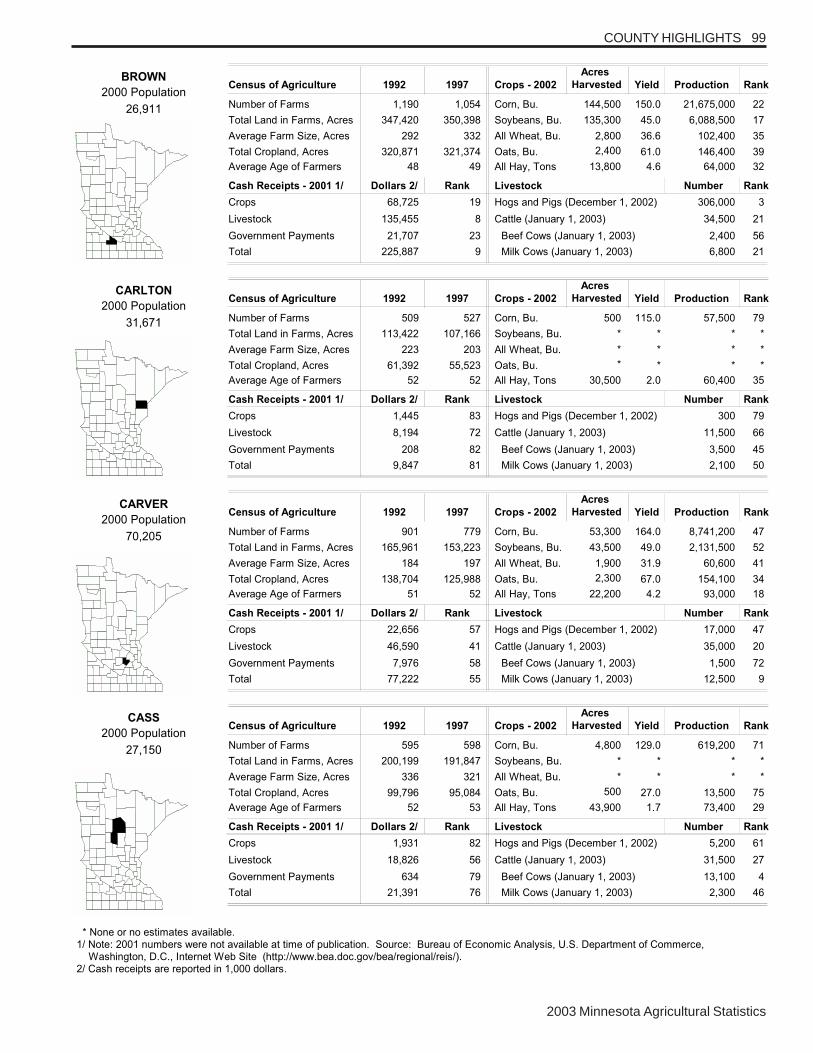
COUNTY HIGHLIGHTS 99
2003 Minnesota Agricultural Statistics
Number of Farms 1,190
Total Land in Farms, Acres 347,420
Average Farm Size, Acres 292
Total Cropland, Acres 320,871
Average Age of Farmers 48
1,054
350,398
332
321,374
49
Corn, Bu. 144,500
Soybeans, Bu. 135,300
All Wheat, Bu. 2,800
Oats, Bu. 2,400
All Hay, Tons 13,800
150.0
45.0
36.6
61.0
4.6
21,675,000
6,088,500
102,400
146,400
64,000
22
17
35
39
32
Crops - 2002
Acres
Harvested Yield Production RankCensus of Agriculture 1992 1997
Crops 68,725
Livestock 135,455
Government Payments 21,707
Total 225,887
19
8
23
9
306,000
34,500
2,400
6,800
3
21
56
21
Hogs and Pigs (December 1, 2002)
Cattle (January 1, 2003)
Beef Cows (January 1, 2003)
Milk Cows (January 1, 2003)
Livestock Number RankCash Receipts - 2001 1/ Dollars 2/ Rank
BROWN
2000 Population
26,911
Number of Farms 509
Total Land in Farms, Acres 113,422
Average Farm Size, Acres 223
Total Cropland, Acres 61,392
Average Age of Farmers 52
527
107,166
203
55,523
52
Corn, Bu. 500
Soybeans, Bu. *
All Wheat, Bu. *
Oats, Bu. *
All Hay, Tons 30,500
115.0
*
*
*
2.0
57,500
*
*
*
60,400
79
*
*
*
35
Crops - 2002
Acres
Harvested Yield Production RankCensus of Agriculture 1992 1997
Crops 1,445
Livestock 8,194
Government Payments 208
Total 9,847
83
72
82
81
300
11,500
3,500
2,100
79
66
45
50
Hogs and Pigs (December 1, 2002)
Cattle (January 1, 2003)
Beef Cows (January 1, 2003)
Milk Cows (January 1, 2003)
Livestock Number RankCash Receipts - 2001 1/ Dollars 2/ Rank
CARLTON
2000 Population
31,671
Number of Farms 901
Total Land in Farms, Acres 165,961
Average Farm Size, Acres 184
Total Cropland, Acres 138,704
Average Age of Farmers 51
779
153,223
197
125,988
52
Corn, Bu. 53,300
Soybeans, Bu. 43,500
All Wheat, Bu. 1,900
Oats, Bu. 2,300
All Hay, Tons 22,200
164.0
49.0
31.9
67.0
4.2
8,741,200
2,131,500
60,600
154,100
93,000
47
52
41
34
18
Crops - 2002
Acres
Harvested Yield Production RankCensus of Agriculture 1992 1997
Crops 22,656
Livestock 46,590
Government Payments 7,976
Total 77,222
57
41
58
55
17,000
35,000
1,500
12,500
47
20
72
9
Hogs and Pigs (December 1, 2002)
Cattle (January 1, 2003)
Beef Cows (January 1, 2003)
Milk Cows (January 1, 2003)
Livestock Number RankCash Receipts - 2001 1/ Dollars 2/ Rank
CARVER
2000 Population
70,205
Number of Farms 595
Total Land in Farms, Acres 200,199
Average Farm Size, Acres 336
Total Cropland, Acres 99,796
Average Age of Farmers 52
598
191,847
321
95,084
53
Corn, Bu. 4,800
Soybeans, Bu. *
All Wheat, Bu. *
Oats, Bu. 500
All Hay, Tons 43,900
129.0
*
*
27.0
1.7
619,200
*
*
13,500
73,400
71
*
*
75
29
Crops - 2002
Acres
Harvested Yield Production RankCensus of Agriculture 1992 1997
Crops 1,931
Livestock 18,826
Government Payments 634
Total 21,391
82
56
79
76
5,200
31,500
13,100
2,300
61
27
4
46
Hogs and Pigs (December 1, 2002)
Cattle (January 1, 2003)
Beef Cows (January 1, 2003)
Milk Cows (January 1, 2003)
Livestock Number RankCash Receipts - 2001 1/ Dollars 2/ Rank
CASS
2000 Population
27,150
* None or no estimates available.1/ Note: 2001 numbers were not available at time of publication. Source: Bureau of Economic Analysis, U.S. Department of Commerce, Washington, D.C., Internet Web Site (http://www.bea.doc.gov/bea/regional/reis/).2/ Cash receipts are reported in 1,000 dollars.
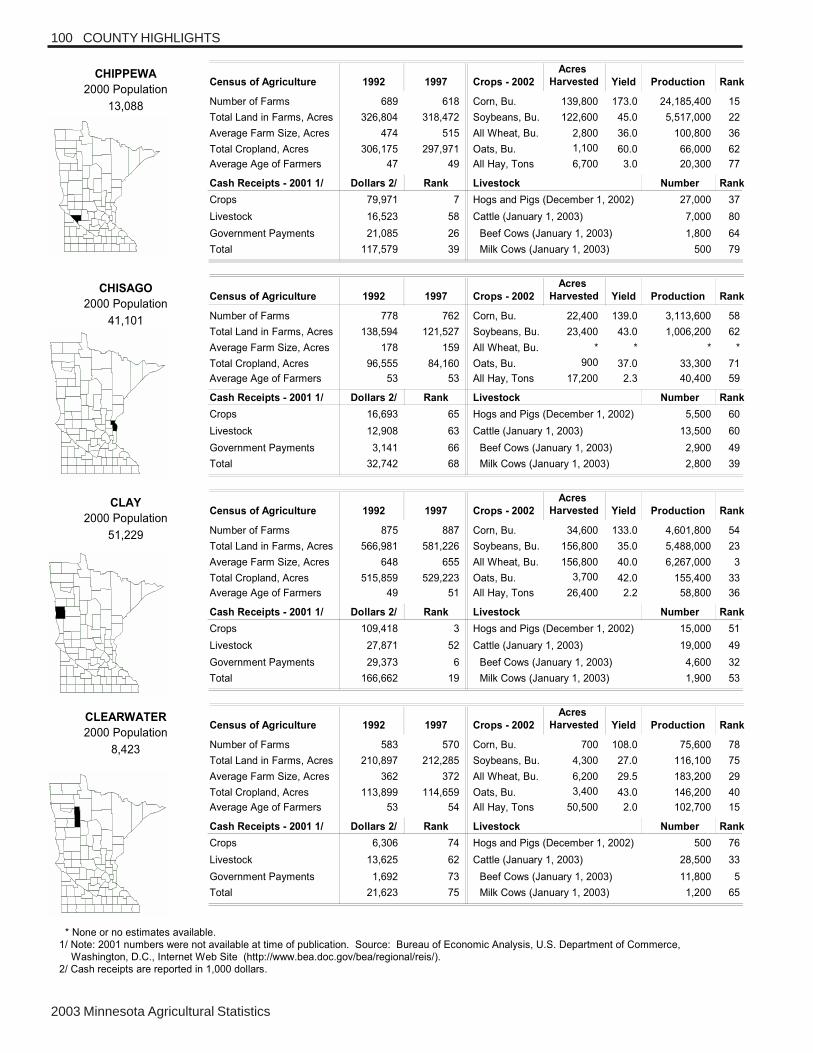
2003 Minnesota Agricultural Statistics
100 COUNTY HIGHLIGHTS
Number of Farms 689
Total Land in Farms, Acres 326,804
Average Farm Size, Acres 474
Total Cropland, Acres 306,175
Average Age of Farmers 47
618
318,472
515
297,971
49
Corn, Bu. 139,800
Soybeans, Bu. 122,600
All Wheat, Bu. 2,800
Oats, Bu. 1,100
All Hay, Tons 6,700
173.0
45.0
36.0
60.0
3.0
24,185,400
5,517,000
100,800
66,000
20,300
15
22
36
62
77
Crops - 2002
Acres
Harvested Yield Production RankCensus of Agriculture 1992 1997
Crops 79,971
Livestock 16,523
Government Payments 21,085
Total 117,579
7
58
26
39
27,000
7,000
1,800
500
37
80
64
79
Hogs and Pigs (December 1, 2002)
Cattle (January 1, 2003)
Beef Cows (January 1, 2003)
Milk Cows (January 1, 2003)
Livestock Number RankCash Receipts - 2001 1/ Dollars 2/ Rank
CHIPPEWA
2000 Population
13,088
Number of Farms 778
Total Land in Farms, Acres 138,594
Average Farm Size, Acres 178
Total Cropland, Acres 96,555
Average Age of Farmers 53
762
121,527
159
84,160
53
Corn, Bu. 22,400
Soybeans, Bu. 23,400
All Wheat, Bu. *
Oats, Bu. 900
All Hay, Tons 17,200
139.0
43.0
*
37.0
2.3
3,113,600
1,006,200
*
33,300
40,400
58
62
*
71
59
Crops - 2002
Acres
Harvested Yield Production RankCensus of Agriculture 1992 1997
Crops 16,693
Livestock 12,908
Government Payments 3,141
Total 32,742
65
63
66
68
5,500
13,500
2,900
2,800
60
60
49
39
Hogs and Pigs (December 1, 2002)
Cattle (January 1, 2003)
Beef Cows (January 1, 2003)
Milk Cows (January 1, 2003)
Livestock Number RankCash Receipts - 2001 1/ Dollars 2/ Rank
CHISAGO
2000 Population
41,101
Number of Farms 875
Total Land in Farms, Acres 566,981
Average Farm Size, Acres 648
Total Cropland, Acres 515,859
Average Age of Farmers 49
887
581,226
655
529,223
51
Corn, Bu. 34,600
Soybeans, Bu. 156,800
All Wheat, Bu. 156,800
Oats, Bu. 3,700
All Hay, Tons 26,400
133.0
35.0
40.0
42.0
2.2
4,601,800
5,488,000
6,267,000
155,400
58,800
54
23
3
33
36
Crops - 2002
Acres
Harvested Yield Production RankCensus of Agriculture 1992 1997
Crops 109,418
Livestock 27,871
Government Payments 29,373
Total 166,662
3
52
6
19
15,000
19,000
4,600
1,900
51
49
32
53
Hogs and Pigs (December 1, 2002)
Cattle (January 1, 2003)
Beef Cows (January 1, 2003)
Milk Cows (January 1, 2003)
Livestock Number RankCash Receipts - 2001 1/ Dollars 2/ Rank
CLAY
2000 Population
51,229
Number of Farms 583
Total Land in Farms, Acres 210,897
Average Farm Size, Acres 362
Total Cropland, Acres 113,899
Average Age of Farmers 53
570
212,285
372
114,659
54
Corn, Bu. 700
Soybeans, Bu. 4,300
All Wheat, Bu. 6,200
Oats, Bu. 3,400
All Hay, Tons 50,500
108.0
27.0
29.5
43.0
2.0
75,600
116,100
183,200
146,200
102,700
78
75
29
40
15
Crops - 2002
Acres
Harvested Yield Production RankCensus of Agriculture 1992 1997
Crops 6,306
Livestock 13,625
Government Payments 1,692
Total 21,623
74
62
73
75
500
28,500
11,800
1,200
76
33
5
65
Hogs and Pigs (December 1, 2002)
Cattle (January 1, 2003)
Beef Cows (January 1, 2003)
Milk Cows (January 1, 2003)
Livestock Number RankCash Receipts - 2001 1/ Dollars 2/ Rank
CLEARWATER
2000 Population
8,423
* None or no estimates available.1/ Note: 2001 numbers were not available at time of publication. Source: Bureau of Economic Analysis, U.S. Department of Commerce, Washington, D.C., Internet Web Site (http://www.bea.doc.gov/bea/regional/reis/).2/ Cash receipts are reported in 1,000 dollars.
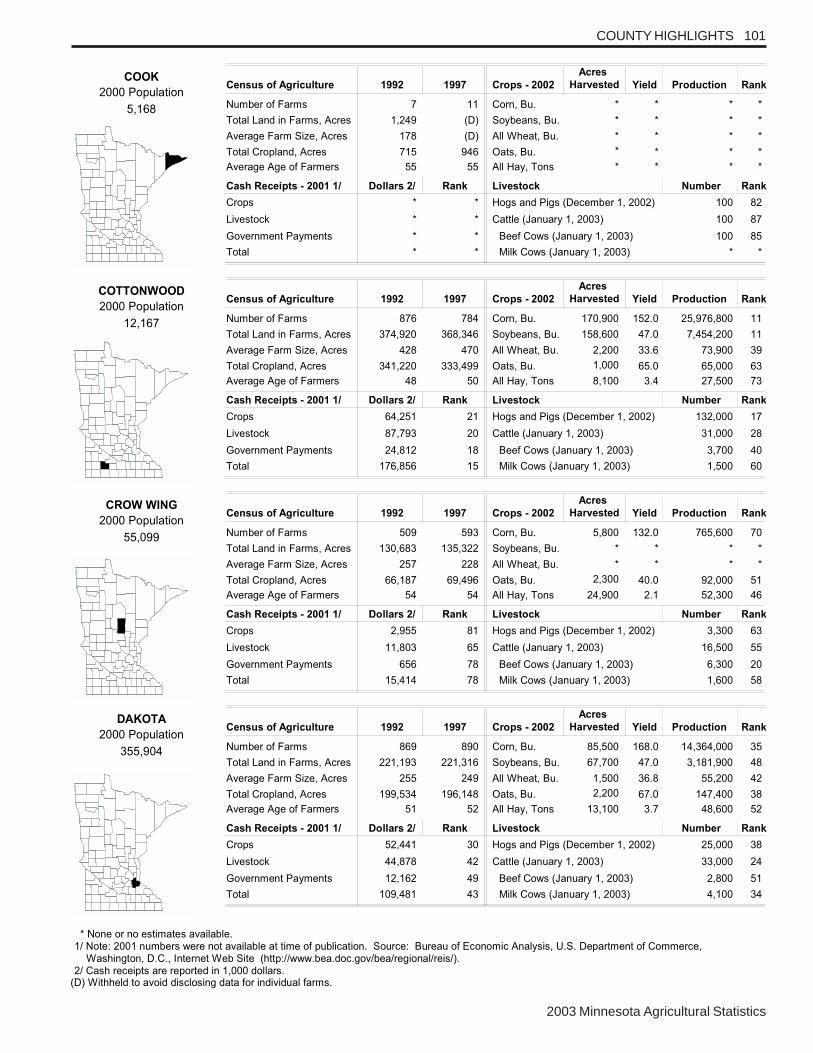
2003 Minnesota Agricultural Statistics
COUNTY HIGHLIGHTS 101
Number of Farms 7
Total Land in Farms, Acres 1,249
Average Farm Size, Acres 178
Total Cropland, Acres 715
Average Age of Farmers 55
11
(D)
(D)
946
55
Corn, Bu. *
Soybeans, Bu. *
All Wheat, Bu. *
Oats, Bu. *
All Hay, Tons *
*
*
*
*
*
*
*
*
*
*
*
*
*
*
*
Crops - 2002
Acres
Harvested Yield Production RankCensus of Agriculture 1992 1997
Crops *
Livestock *
Government Payments *
Total *
*
*
*
*
100
100
100
*
82
87
85
*
Hogs and Pigs (December 1, 2002)
Cattle (January 1, 2003)
Beef Cows (January 1, 2003)
Milk Cows (January 1, 2003)
Livestock Number RankCash Receipts - 2001 1/ Dollars 2/ Rank
COOK
2000 Population
5,168
Number of Farms 876
Total Land in Farms, Acres 374,920
Average Farm Size, Acres 428
Total Cropland, Acres 341,220
Average Age of Farmers 48
784
368,346
470
333,499
50
Corn, Bu. 170,900
Soybeans, Bu. 158,600
All Wheat, Bu. 2,200
Oats, Bu. 1,000
All Hay, Tons 8,100
152.0
47.0
33.6
65.0
3.4
25,976,800
7,454,200
73,900
65,000
27,500
11
11
39
63
73
Crops - 2002
Acres
Harvested Yield Production RankCensus of Agriculture 1992 1997
Crops 64,251
Livestock 87,793
Government Payments 24,812
Total 176,856
21
20
18
15
132,000
31,000
3,700
1,500
17
28
40
60
Hogs and Pigs (December 1, 2002)
Cattle (January 1, 2003)
Beef Cows (January 1, 2003)
Milk Cows (January 1, 2003)
Livestock Number RankCash Receipts - 2001 1/ Dollars 2/ Rank
COTTONWOOD
2000 Population
12,167
Number of Farms 509
Total Land in Farms, Acres 130,683
Average Farm Size, Acres 257
Total Cropland, Acres 66,187
Average Age of Farmers 54
593
135,322
228
69,496
54
Corn, Bu. 5,800
Soybeans, Bu. *
All Wheat, Bu. *
Oats, Bu. 2,300
All Hay, Tons 24,900
132.0
*
*
40.0
2.1
765,600
*
*
92,000
52,300
70
*
*
51
46
Crops - 2002
Acres
Harvested Yield Production RankCensus of Agriculture 1992 1997
Crops 2,955
Livestock 11,803
Government Payments 656
Total 15,414
81
65
78
78
3,300
16,500
6,300
1,600
63
55
20
58
Hogs and Pigs (December 1, 2002)
Cattle (January 1, 2003)
Beef Cows (January 1, 2003)
Milk Cows (January 1, 2003)
Livestock Number RankCash Receipts - 2001 1/ Dollars 2/ Rank
CROW WING
2000 Population
55,099
Number of Farms 869
Total Land in Farms, Acres 221,193
Average Farm Size, Acres 255
Total Cropland, Acres 199,534
Average Age of Farmers 51
890
221,316
249
196,148
52
Corn, Bu. 85,500
Soybeans, Bu. 67,700
All Wheat, Bu. 1,500
Oats, Bu. 2,200
All Hay, Tons 13,100
168.0
47.0
36.8
67.0
3.7
14,364,000
3,181,900
55,200
147,400
48,600
35
48
42
38
52
Crops - 2002
Acres
Harvested Yield Production RankCensus of Agriculture 1992 1997
Crops 52,441
Livestock 44,878
Government Payments 12,162
Total 109,481
30
42
49
43
25,000
33,000
2,800
4,100
38
24
51
34
Hogs and Pigs (December 1, 2002)
Cattle (January 1, 2003)
Beef Cows (January 1, 2003)
Milk Cows (January 1, 2003)
Livestock Number RankCash Receipts - 2001 1/ Dollars 2/ Rank
DAKOTA
2000 Population
355,904
* None or no estimates available.1/ Note: 2001 numbers were not available at time of publication. Source: Bureau of Economic Analysis, U.S. Department of Commerce, Washington, D.C., Internet Web Site (http://www.bea.doc.gov/bea/regional/reis/).2/ Cash receipts are reported in 1,000 dollars.
(D) Withheld to avoid disclosing data for individual farms.

2003 Minnesota Agricultural Statistics
102 COUNTY HIGHLIGHTS
Number of Farms 740
Total Land in Farms, Acres 241,148
Average Farm Size, Acres 326
Total Cropland, Acres 220,585
Average Age of Farmers 48
674
246,818
366
224,431
50
Corn, Bu. 103,200
Soybeans, Bu. 91,600
All Wheat, Bu. *
Oats, Bu. 2,900
All Hay, Tons 14,600
175.0
52.0
*
73.0
3.9
18,060,000
4,763,200
*
211,700
57,400
26
31
*
21
39
Crops - 2002
Acres
Harvested Yield Production RankCensus of Agriculture 1992 1997
Crops 52,772
Livestock 55,253
Government Payments 16,035
Total 124,060
29
35
40
35
99,000
22,500
1,700
6,500
24
43
69
23
Hogs and Pigs (December 1, 2002)
Cattle (January 1, 2003)
Beef Cows (January 1, 2003)
Milk Cows (January 1, 2003)
Livestock Number RankCash Receipts - 2001 1/ Dollars 2/ Rank
DODGE
2000 Population
17,731
Number of Farms 956
Total Land in Farms, Acres 260,125
Average Farm Size, Acres 272
Total Cropland, Acres 197,850
Average Age of Farmers 52
1,042
267,875
257
200,930
54
Corn, Bu. 47,300
Soybeans, Bu. 71,800
All Wheat, Bu. 18,700
Oats, Bu. 5,900
All Hay, Tons 29,700
150.0
36.0
36.0
49.0
2.8
7,095,000
2,584,800
672,400
289,100
84,200
50
50
17
14
21
Crops - 2002
Acres
Harvested Yield Production RankCensus of Agriculture 1992 1997
Crops 21,051
Livestock 42,280
Government Payments 9,095
Total 72,426
59
45
55
56
16,500
30,500
3,600
9,100
48
29
43
14
Hogs and Pigs (December 1, 2002)
Cattle (January 1, 2003)
Beef Cows (January 1, 2003)
Milk Cows (January 1, 2003)
Livestock Number RankCash Receipts - 2001 1/ Dollars 2/ Rank
DOUGLAS
2000 Population
32,821
Number of Farms 1,016
Total Land in Farms, Acres 414,710
Average Farm Size, Acres 408
Total Cropland, Acres 387,591
Average Age of Farmers 49
878
413,409
471
388,825
51
Corn, Bu. 200,400
Soybeans, Bu. 167,100
All Wheat, Bu. *
Oats, Bu. 1,800
All Hay, Tons 3,400
168.0
50.0
*
82.0
3.2
33,667,200
8,355,000
*
147,600
11,000
4
5
*
37
82
Crops - 2002
Acres
Harvested Yield Production RankCensus of Agriculture 1992 1997
Crops 79,154
Livestock 60,096
Government Payments 27,586
Total 166,836
8
32
9
18
171,000
11,500
1,600
2,200
12
66
71
49
Hogs and Pigs (December 1, 2002)
Cattle (January 1, 2003)
Beef Cows (January 1, 2003)
Milk Cows (January 1, 2003)
Livestock Number RankCash Receipts - 2001 1/ Dollars 2/ Rank
FARIBAULT
2000 Population
16,181
Number of Farms 1,618
Total Land in Farms, Acres 443,496
Average Farm Size, Acres 274
Total Cropland, Acres 332,446
Average Age of Farmers 51
1,546
434,581
281
327,011
52
Corn, Bu. 146,100
Soybeans, Bu. 96,800
All Wheat, Bu. *
Oats, Bu. 10,600
All Hay, Tons 64,700
166.0
51.0
*
91.0
4.1
24,252,600
4,936,800
*
964,600
265,000
14
29
*
3
4
Crops - 2002
Acres
Harvested Yield Production RankCensus of Agriculture 1992 1997
Crops 48,221
Livestock 100,105
Government Payments 21,775
Total 170,101
37
12
22
17
129,000
88,000
18,300
13,200
18
3
1
8
Hogs and Pigs (December 1, 2002)
Cattle (January 1, 2003)
Beef Cows (January 1, 2003)
Milk Cows (January 1, 2003)
Livestock Number RankCash Receipts - 2001 1/ Dollars 2/ Rank
FILLMORE
2000 Population
21,122
* None or no estimates available.1/ Note: 2001 numbers were not available at time of publication. Source: Bureau of Economic Analysis, U.S. Department of Commerce, Washington, D.C., Internet Web Site (http://www.bea.doc.gov/bea/regional/reis/).2/ Cash receipts are reported in 1,000 dollars.
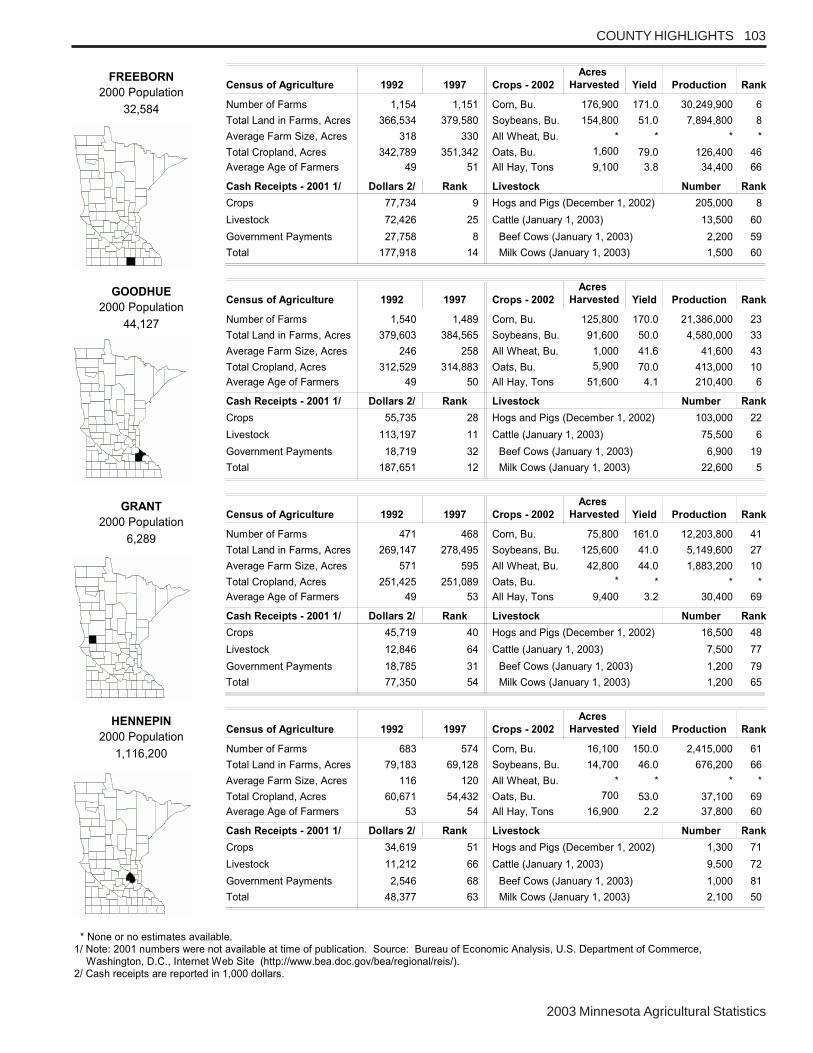
2003 Minnesota Agricultural Statistics
COUNTY HIGHLIGHTS 103
Number of Farms 1,154
Total Land in Farms, Acres 366,534
Average Farm Size, Acres 318
Total Cropland, Acres 342,789
Average Age of Farmers 49
1,151
379,580
330
351,342
51
Corn, Bu. 176,900
Soybeans, Bu. 154,800
All Wheat, Bu. *
Oats, Bu. 1,600
All Hay, Tons 9,100
171.0
51.0
*
79.0
3.8
30,249,900
7,894,800
*
126,400
34,400
6
8
*
46
66
Crops - 2002
Acres
Harvested Yield Production RankCensus of Agriculture 1992 1997
Crops 77,734
Livestock 72,426
Government Payments 27,758
Total 177,918
9
25
8
14
205,000
13,500
2,200
1,500
8
60
59
60
Hogs and Pigs (December 1, 2002)
Cattle (January 1, 2003)
Beef Cows (January 1, 2003)
Milk Cows (January 1, 2003)
Livestock Number RankCash Receipts - 2001 1/ Dollars 2/ Rank
FREEBORN
2000 Population
32,584
Number of Farms 1,540
Total Land in Farms, Acres 379,603
Average Farm Size, Acres 246
Total Cropland, Acres 312,529
Average Age of Farmers 49
1,489
384,565
258
314,883
50
Corn, Bu. 125,800
Soybeans, Bu. 91,600
All Wheat, Bu. 1,000
Oats, Bu. 5,900
All Hay, Tons 51,600
170.0
50.0
41.6
70.0
4.1
21,386,000
4,580,000
41,600
413,000
210,400
23
33
43
10
6
Crops - 2002
Acres
Harvested Yield Production RankCensus of Agriculture 1992 1997
Crops 55,735
Livestock 113,197
Government Payments 18,719
Total 187,651
28
11
32
12
103,000
75,500
6,900
22,600
22
6
19
5
Hogs and Pigs (December 1, 2002)
Cattle (January 1, 2003)
Beef Cows (January 1, 2003)
Milk Cows (January 1, 2003)
Livestock Number RankCash Receipts - 2001 1/ Dollars 2/ Rank
GOODHUE
2000 Population
44,127
Number of Farms 471
Total Land in Farms, Acres 269,147
Average Farm Size, Acres 571
Total Cropland, Acres 251,425
Average Age of Farmers 49
468
278,495
595
251,089
53
Corn, Bu. 75,800
Soybeans, Bu. 125,600
All Wheat, Bu. 42,800
Oats, Bu. *
All Hay, Tons 9,400
161.0
41.0
44.0
*
3.2
12,203,800
5,149,600
1,883,200
*
30,400
41
27
10
*
69
Crops - 2002
Acres
Harvested Yield Production RankCensus of Agriculture 1992 1997
Crops 45,719
Livestock 12,846
Government Payments 18,785
Total 77,350
40
64
31
54
16,500
7,500
1,200
1,200
48
77
79
65
Hogs and Pigs (December 1, 2002)
Cattle (January 1, 2003)
Beef Cows (January 1, 2003)
Milk Cows (January 1, 2003)
Livestock Number RankCash Receipts - 2001 1/ Dollars 2/ Rank
GRANT
2000 Population
6,289
Number of Farms 683
Total Land in Farms, Acres 79,183
Average Farm Size, Acres 116
Total Cropland, Acres 60,671
Average Age of Farmers 53
574
69,128
120
54,432
54
Corn, Bu. 16,100
Soybeans, Bu. 14,700
All Wheat, Bu. *
Oats, Bu. 700
All Hay, Tons 16,900
150.0
46.0
*
53.0
2.2
2,415,000
676,200
*
37,100
37,800
61
66
*
69
60
Crops - 2002
Acres
Harvested Yield Production RankCensus of Agriculture 1992 1997
Crops 34,619
Livestock 11,212
Government Payments 2,546
Total 48,377
51
66
68
63
1,300
9,500
1,000
2,100
71
72
81
50
Hogs and Pigs (December 1, 2002)
Cattle (January 1, 2003)
Beef Cows (January 1, 2003)
Milk Cows (January 1, 2003)
Livestock Number RankCash Receipts - 2001 1/ Dollars 2/ Rank
HENNEPIN
2000 Population
1,116,200
* None or no estimates available.1/ Note: 2001 numbers were not available at time of publication. Source: Bureau of Economic Analysis, U.S. Department of Commerce, Washington, D.C., Internet Web Site (http://www.bea.doc.gov/bea/regional/reis/).2/ Cash receipts are reported in 1,000 dollars.

2003 Minnesota Agricultural Statistics
104 COUNTY HIGHLIGHTS
Number of Farms 974
Total Land in Farms, Acres 272,049
Average Farm Size, Acres 279
Total Cropland, Acres 157,637
Average Age of Farmers 51
954
298,173
313
186,799
54
Corn, Bu. 50,100
Soybeans, Bu. 25,100
All Wheat, Bu. *
Oats, Bu. 5,500
All Hay, Tons 50,300
166.0
48.0
*
77.0
4.0
8,316,600
1,204,800
*
423,500
200,600
48
60
*
9
7
Crops - 2002
Acres
Harvested Yield Production RankCensus of Agriculture 1992 1997
Crops 18,495
Livestock 55,098
Government Payments 8,822
Total 82,415
61
36
57
53
25,000
56,500
10,800
9,400
38
9
7
13
Hogs and Pigs (December 1, 2002)
Cattle (January 1, 2003)
Beef Cows (January 1, 2003)
Milk Cows (January 1, 2003)
Livestock Number RankCash Receipts - 2001 1/ Dollars 2/ Rank
HOUSTON
2000 Population
19,718
Number of Farms 387
Total Land in Farms, Acres 112,412
Average Farm Size, Acres 290
Total Cropland, Acres 61,907
Average Age of Farmers 53
431
130,530
303
71,086
55
Corn, Bu. 9,600
Soybeans, Bu. *
All Wheat, Bu. *
Oats, Bu. 2,600
All Hay, Tons 21,500
159.0
*
*
27.0
1.7
1,526,400
*
*
70,200
36,900
66
*
*
61
63
Crops - 2002
Acres
Harvested Yield Production RankCensus of Agriculture 1992 1997
Crops 16,618
Livestock 6,830
Government Payments 1,536
Total 24,984
66
77
75
72
2,300
11,000
4,500
700
65
68
34
76
Hogs and Pigs (December 1, 2002)
Cattle (January 1, 2003)
Beef Cows (January 1, 2003)
Milk Cows (January 1, 2003)
Livestock Number RankCash Receipts - 2001 1/ Dollars 2/ Rank
HUBBARD
2000 Population
18,376
Number of Farms 680
Total Land in Farms, Acres 131,563
Average Farm Size, Acres 193
Total Cropland, Acres 95,251
Average Age of Farmers 52
746
139,417
187
99,017
52
Corn, Bu. 30,600
Soybeans, Bu. 31,300
All Wheat, Bu. 1,000
Oats, Bu. 900
All Hay, Tons 16,600
126.0
34.0
26.4
35.0
2.5
3,855,600
1,064,200
26,400
31,500
41,700
55
61
46
72
58
Crops - 2002
Acres
Harvested Yield Production RankCensus of Agriculture 1992 1997
Crops 12,392
Livestock 9,041
Government Payments 4,430
Total 25,863
70
69
64
71
5,000
8,500
2,000
1,600
62
74
61
58
Hogs and Pigs (December 1, 2002)
Cattle (January 1, 2003)
Beef Cows (January 1, 2003)
Milk Cows (January 1, 2003)
Livestock Number RankCash Receipts - 2001 1/ Dollars 2/ Rank
ISANTI
2000 Population
31,287
Number of Farms 420
Total Land in Farms, Acres 107,810
Average Farm Size, Acres 257
Total Cropland, Acres 59,348
Average Age of Farmers 54
415
103,716
250
55,433
55
Corn, Bu. *
Soybeans, Bu. *
All Wheat, Bu. *
Oats, Bu. 700
All Hay, Tons 29,600
*
*
*
55.0
1.5
*
*
*
38,500
43,900
*
*
*
68
55
Crops - 2002
Acres
Harvested Yield Production RankCensus of Agriculture 1992 1997
Crops 1,236
Livestock 4,122
Government Payments 157
Total 5,515
84
82
83
84
200
10,500
4,600
300
81
70
32
80
Hogs and Pigs (December 1, 2002)
Cattle (January 1, 2003)
Beef Cows (January 1, 2003)
Milk Cows (January 1, 2003)
Livestock Number RankCash Receipts - 2001 1/ Dollars 2/ Rank
ITASCA
2000 Population
43,992
* None or no estimates available.1/ Note: 2001 numbers were not available at time of publication. Source: Bureau of Economic Analysis, U.S. Department of Commerce, Washington, D.C., Internet Web Site (http://www.bea.doc.gov/bea/regional/reis/).2/ Cash receipts are reported in 1,000 dollars.
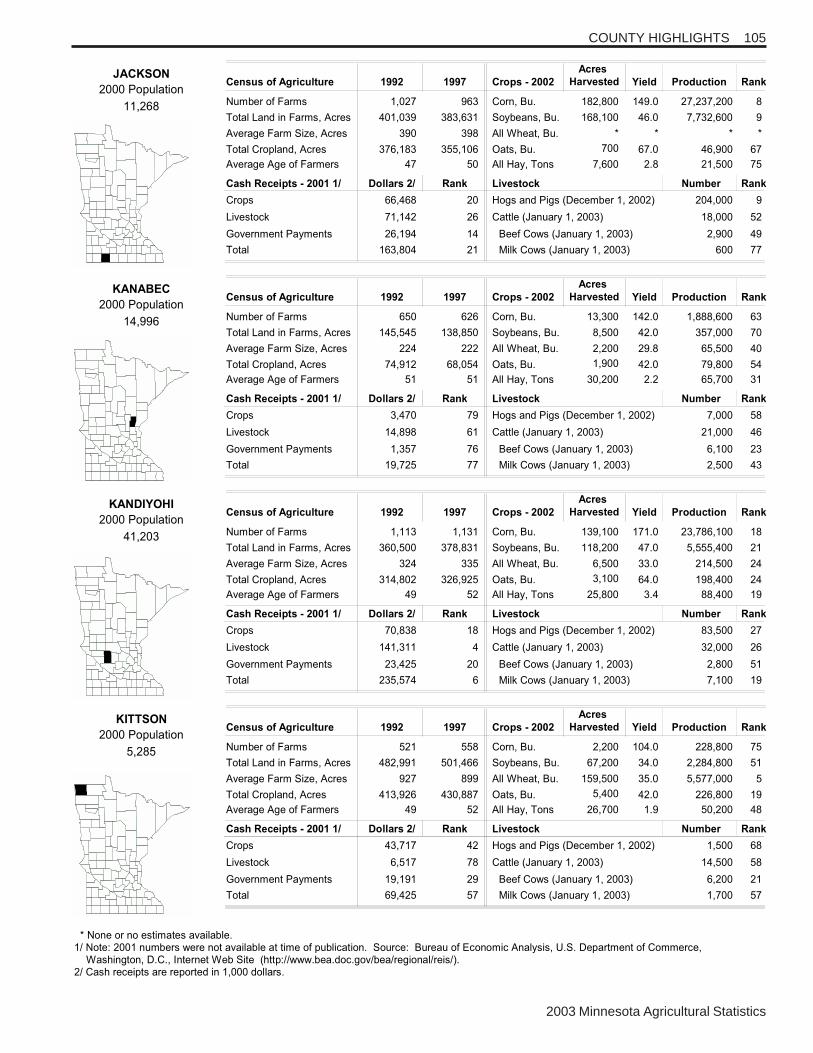
2003 Minnesota Agricultural Statistics
COUNTY HIGHLIGHTS 105
Number of Farms 1,027
Total Land in Farms, Acres 401,039
Average Farm Size, Acres 390
Total Cropland, Acres 376,183
Average Age of Farmers 47
963
383,631
398
355,106
50
Corn, Bu. 182,800
Soybeans, Bu. 168,100
All Wheat, Bu. *
Oats, Bu. 700
All Hay, Tons 7,600
149.0
46.0
*
67.0
2.8
27,237,200
7,732,600
*
46,900
21,500
8
9
*
67
75
Crops - 2002
Acres
Harvested Yield Production RankCensus of Agriculture 1992 1997
Crops 66,468
Livestock 71,142
Government Payments 26,194
Total 163,804
20
26
14
21
204,000
18,000
2,900
600
9
52
49
77
Hogs and Pigs (December 1, 2002)
Cattle (January 1, 2003)
Beef Cows (January 1, 2003)
Milk Cows (January 1, 2003)
Livestock Number RankCash Receipts - 2001 1/ Dollars 2/ Rank
JACKSON
2000 Population
11,268
Number of Farms 650
Total Land in Farms, Acres 145,545
Average Farm Size, Acres 224
Total Cropland, Acres 74,912
Average Age of Farmers 51
626
138,850
222
68,054
51
Corn, Bu. 13,300
Soybeans, Bu. 8,500
All Wheat, Bu. 2,200
Oats, Bu. 1,900
All Hay, Tons 30,200
142.0
42.0
29.8
42.0
2.2
1,888,600
357,000
65,500
79,800
65,700
63
70
40
54
31
Crops - 2002
Acres
Harvested Yield Production RankCensus of Agriculture 1992 1997
Crops 3,470
Livestock 14,898
Government Payments 1,357
Total 19,725
79
61
76
77
7,000
21,000
6,100
2,500
58
46
23
43
Hogs and Pigs (December 1, 2002)
Cattle (January 1, 2003)
Beef Cows (January 1, 2003)
Milk Cows (January 1, 2003)
Livestock Number RankCash Receipts - 2001 1/ Dollars 2/ Rank
KANABEC
2000 Population
14,996
Number of Farms 1,113
Total Land in Farms, Acres 360,500
Average Farm Size, Acres 324
Total Cropland, Acres 314,802
Average Age of Farmers 49
1,131
378,831
335
326,925
52
Corn, Bu. 139,100
Soybeans, Bu. 118,200
All Wheat, Bu. 6,500
Oats, Bu. 3,100
All Hay, Tons 25,800
171.0
47.0
33.0
64.0
3.4
23,786,100
5,555,400
214,500
198,400
88,400
18
21
24
24
19
Crops - 2002
Acres
Harvested Yield Production RankCensus of Agriculture 1992 1997
Crops 70,838
Livestock 141,311
Government Payments 23,425
Total 235,574
18
4
20
6
83,500
32,000
2,800
7,100
27
26
51
19
Hogs and Pigs (December 1, 2002)
Cattle (January 1, 2003)
Beef Cows (January 1, 2003)
Milk Cows (January 1, 2003)
Livestock Number RankCash Receipts - 2001 1/ Dollars 2/ Rank
KANDIYOHI
2000 Population
41,203
Number of Farms 521
Total Land in Farms, Acres 482,991
Average Farm Size, Acres 927
Total Cropland, Acres 413,926
Average Age of Farmers 49
558
501,466
899
430,887
52
Corn, Bu. 2,200
Soybeans, Bu. 67,200
All Wheat, Bu. 159,500
Oats, Bu. 5,400
All Hay, Tons 26,700
104.0
34.0
35.0
42.0
1.9
228,800
2,284,800
5,577,000
226,800
50,200
75
51
5
19
48
Crops - 2002
Acres
Harvested Yield Production RankCensus of Agriculture 1992 1997
Crops 43,717
Livestock 6,517
Government Payments 19,191
Total 69,425
42
78
29
57
1,500
14,500
6,200
1,700
68
58
21
57
Hogs and Pigs (December 1, 2002)
Cattle (January 1, 2003)
Beef Cows (January 1, 2003)
Milk Cows (January 1, 2003)
Livestock Number RankCash Receipts - 2001 1/ Dollars 2/ Rank
KITTSON
2000 Population
5,285
* None or no estimates available.1/ Note: 2001 numbers were not available at time of publication. Source: Bureau of Economic Analysis, U.S. Department of Commerce, Washington, D.C., Internet Web Site (http://www.bea.doc.gov/bea/regional/reis/).2/ Cash receipts are reported in 1,000 dollars.
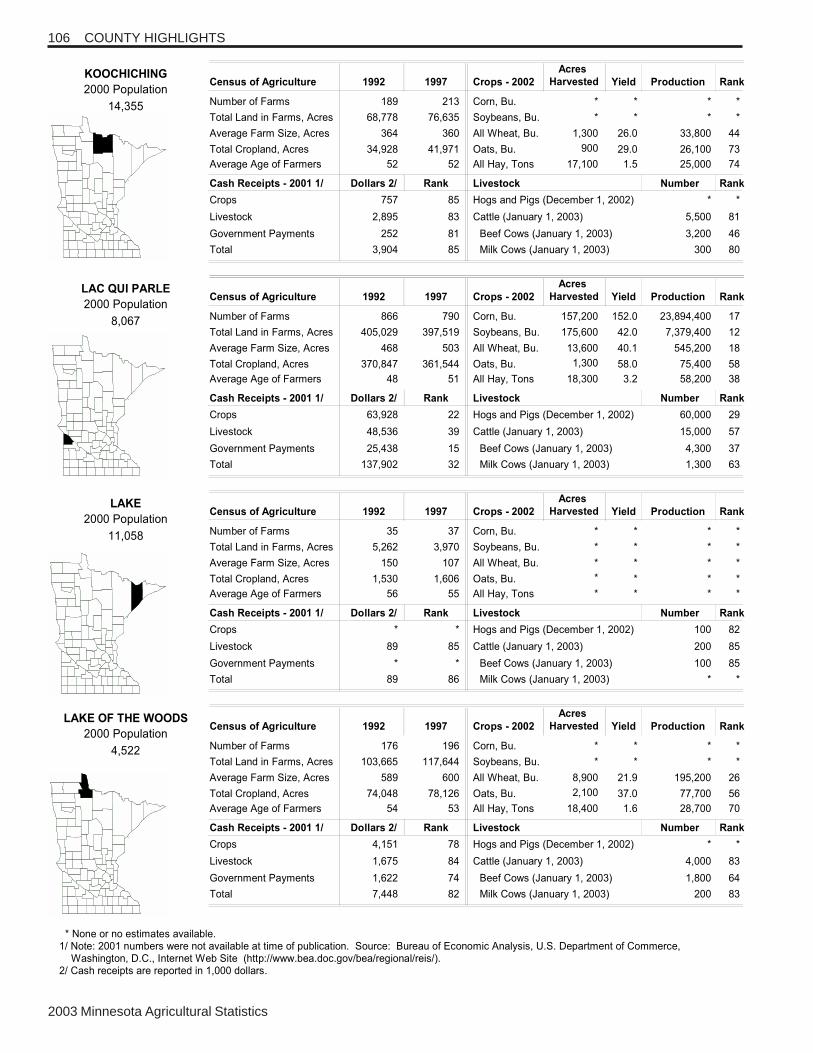
2003 Minnesota Agricultural Statistics
106 COUNTY HIGHLIGHTS
Number of Farms 189
Total Land in Farms, Acres 68,778
Average Farm Size, Acres 364
Total Cropland, Acres 34,928
Average Age of Farmers 52
213
76,635
360
41,971
52
Corn, Bu. *
Soybeans, Bu. *
All Wheat, Bu. 1,300
Oats, Bu. 900
All Hay, Tons 17,100
*
*
26.0
29.0
1.5
*
*
33,800
26,100
25,000
*
*
44
73
74
Crops - 2002
Acres
Harvested Yield Production RankCensus of Agriculture 1992 1997
Crops 757
Livestock 2,895
Government Payments 252
Total 3,904
85
83
81
85
*
5,500
3,200
300
*
81
46
80
Hogs and Pigs (December 1, 2002)
Cattle (January 1, 2003)
Beef Cows (January 1, 2003)
Milk Cows (January 1, 2003)
Livestock Number RankCash Receipts - 2001 1/ Dollars 2/ Rank
KOOCHICHING
2000 Population
14,355
Number of Farms 866
Total Land in Farms, Acres 405,029
Average Farm Size, Acres 468
Total Cropland, Acres 370,847
Average Age of Farmers 48
790
397,519
503
361,544
51
Corn, Bu. 157,200
Soybeans, Bu. 175,600
All Wheat, Bu. 13,600
Oats, Bu. 1,300
All Hay, Tons 18,300
152.0
42.0
40.1
58.0
3.2
23,894,400
7,379,400
545,200
75,400
58,200
17
12
18
58
38
Crops - 2002
Acres
Harvested Yield Production RankCensus of Agriculture 1992 1997
Crops 63,928
Livestock 48,536
Government Payments 25,438
Total 137,902
22
39
15
32
60,000
15,000
4,300
1,300
29
57
37
63
Hogs and Pigs (December 1, 2002)
Cattle (January 1, 2003)
Beef Cows (January 1, 2003)
Milk Cows (January 1, 2003)
Livestock Number RankCash Receipts - 2001 1/ Dollars 2/ Rank
LAC QUI PARLE
2000 Population
8,067
Number of Farms 35
Total Land in Farms, Acres 5,262
Average Farm Size, Acres 150
Total Cropland, Acres 1,530
Average Age of Farmers 56
37
3,970
107
1,606
55
Corn, Bu. *
Soybeans, Bu. *
All Wheat, Bu. *
Oats, Bu. *
All Hay, Tons *
*
*
*
*
*
*
*
*
*
*
*
*
*
*
*
Crops - 2002
Acres
Harvested Yield Production RankCensus of Agriculture 1992 1997
Crops *
Livestock 89
Government Payments *
Total 89
*
85
*
86
100
200
100
*
82
85
85
*
Hogs and Pigs (December 1, 2002)
Cattle (January 1, 2003)
Beef Cows (January 1, 2003)
Milk Cows (January 1, 2003)
Livestock Number RankCash Receipts - 2001 1/ Dollars 2/ Rank
LAKE
2000 Population
11,058
Number of Farms 176
Total Land in Farms, Acres 103,665
Average Farm Size, Acres 589
Total Cropland, Acres 74,048
Average Age of Farmers 54
196
117,644
600
78,126
53
Corn, Bu. *
Soybeans, Bu. *
All Wheat, Bu. 8,900
Oats, Bu. 2,100
All Hay, Tons 18,400
*
*
21.9
37.0
1.6
*
*
195,200
77,700
28,700
*
*
26
56
70
Crops - 2002
Acres
Harvested Yield Production RankCensus of Agriculture 1992 1997
Crops 4,151
Livestock 1,675
Government Payments 1,622
Total 7,448
78
84
74
82
*
4,000
1,800
200
*
83
64
83
Hogs and Pigs (December 1, 2002)
Cattle (January 1, 2003)
Beef Cows (January 1, 2003)
Milk Cows (January 1, 2003)
Livestock Number RankCash Receipts - 2001 1/ Dollars 2/ Rank
LAKE OF THE WOODS
2000 Population
4,522
* None or no estimates available.1/ Note: 2001 numbers were not available at time of publication. Source: Bureau of Economic Analysis, U.S. Department of Commerce, Washington, D.C., Internet Web Site (http://www.bea.doc.gov/bea/regional/reis/).2/ Cash receipts are reported in 1,000 dollars.

2003 Minnesota Agricultural Statistics
COUNTY HIGHLIGHTS 107
Number of Farms 845
Total Land in Farms, Acres 205,031
Average Farm Size, Acres 243
Total Cropland, Acres 178,474
Average Age of Farmers 49
877
214,652
245
183,523
52
Corn, Bu. 88,200
Soybeans, Bu. 84,400
All Wheat, Bu. 2,000
Oats, Bu. 1,500
All Hay, Tons 10,400
159.0
48.0
46.0
70.0
3.6
14,023,800
4,051,200
92,000
105,000
37,700
36
40
37
49
61
Crops - 2002
Acres
Harvested Yield Production RankCensus of Agriculture 1992 1997
Crops 36,065
Livestock 47,848
Government Payments 14,479
Total 98,392
48
40
44
48
77,000
18,500
1,800
3,000
28
51
64
37
Hogs and Pigs (December 1, 2002)
Cattle (January 1, 2003)
Beef Cows (January 1, 2003)
Milk Cows (January 1, 2003)
Livestock Number RankCash Receipts - 2001 1/ Dollars 2/ Rank
LE SUEUR
2000 Population
25,426
Number of Farms 696
Total Land in Farms, Acres 255,453
Average Farm Size, Acres 367
Total Cropland, Acres 225,490
Average Age of Farmers 50
724
269,646
372
233,699
53
Corn, Bu. 83,200
Soybeans, Bu. 98,700
All Wheat, Bu. 10,900
Oats, Bu. 2,500
All Hay, Tons 23,300
133.0
40.0
42.0
65.0
3.6
11,065,600
3,948,000
457,600
162,500
83,200
43
42
21
30
22
Crops - 2002
Acres
Harvested Yield Production RankCensus of Agriculture 1992 1997
Crops 37,047
Livestock 42,031
Government Payments 15,714
Total 94,792
46
46
41
50
53,000
28,000
5,100
2,700
31
34
29
41
Hogs and Pigs (December 1, 2002)
Cattle (January 1, 2003)
Beef Cows (January 1, 2003)
Milk Cows (January 1, 2003)
Livestock Number RankCash Receipts - 2001 1/ Dollars 2/ Rank
LINCOLN
2000 Population
6,429
Number of Farms 947
Total Land in Farms, Acres 395,023
Average Farm Size, Acres 417
Total Cropland, Acres 360,644
Average Age of Farmers 47
931
403,001
433
365,967
50
Corn, Bu. 171,700
Soybeans, Bu. 167,400
All Wheat, Bu. 4,500
Oats, Bu. 2,200
All Hay, Tons 14,400
153.0
43.0
33.0
66.0
4.0
26,270,100
7,198,200
148,500
145,200
58,300
9
15
32
41
37
Crops - 2002
Acres
Harvested Yield Production RankCensus of Agriculture 1992 1997
Crops 71,663
Livestock 86,635
Government Payments 25,224
Total 183,522
17
21
16
13
163,000
42,500
5,200
1,300
13
14
27
63
Hogs and Pigs (December 1, 2002)
Cattle (January 1, 2003)
Beef Cows (January 1, 2003)
Milk Cows (January 1, 2003)
Livestock Number RankCash Receipts - 2001 1/ Dollars 2/ Rank
LYON
2000 Population
25,425
Number of Farms 1,114
Total Land in Farms, Acres 250,507
Average Farm Size, Acres 255
Total Cropland, Acres 225,505
Average Age of Farmers 50
1,008
250,244
248
222,561
52
Corn, Bu. 97,800
Soybeans, Bu. 95,800
All Wheat, Bu. 4,300
Oats, Bu. 2,600
All Hay, Tons 16,800
168.0
43.0
38.3
57.0
3.0
16,430,400
4,119,400
164,500
148,200
50,100
32
39
31
36
49
Crops - 2002
Acres
Harvested Yield Production RankCensus of Agriculture 1992 1997
Crops 46,334
Livestock 42,504
Government Payments 13,745
Total 102,583
39
44
46
47
25,000
32,500
2,100
9,100
38
25
60
14
Hogs and Pigs (December 1, 2002)
Cattle (January 1, 2003)
Beef Cows (January 1, 2003)
Milk Cows (January 1, 2003)
Livestock Number RankCash Receipts - 2001 1/ Dollars 2/ Rank
MCLEOD
2000 Population
34,898
* None or no estimates available.1/ Note: 2001 numbers were not available at time of publication. Source: Bureau of Economic Analysis, U.S. Department of Commerce, Washington, D.C., Internet Web Site (http://www.bea.doc.gov/bea/regional/reis/).2/ Cash receipts are reported in 1,000 dollars.
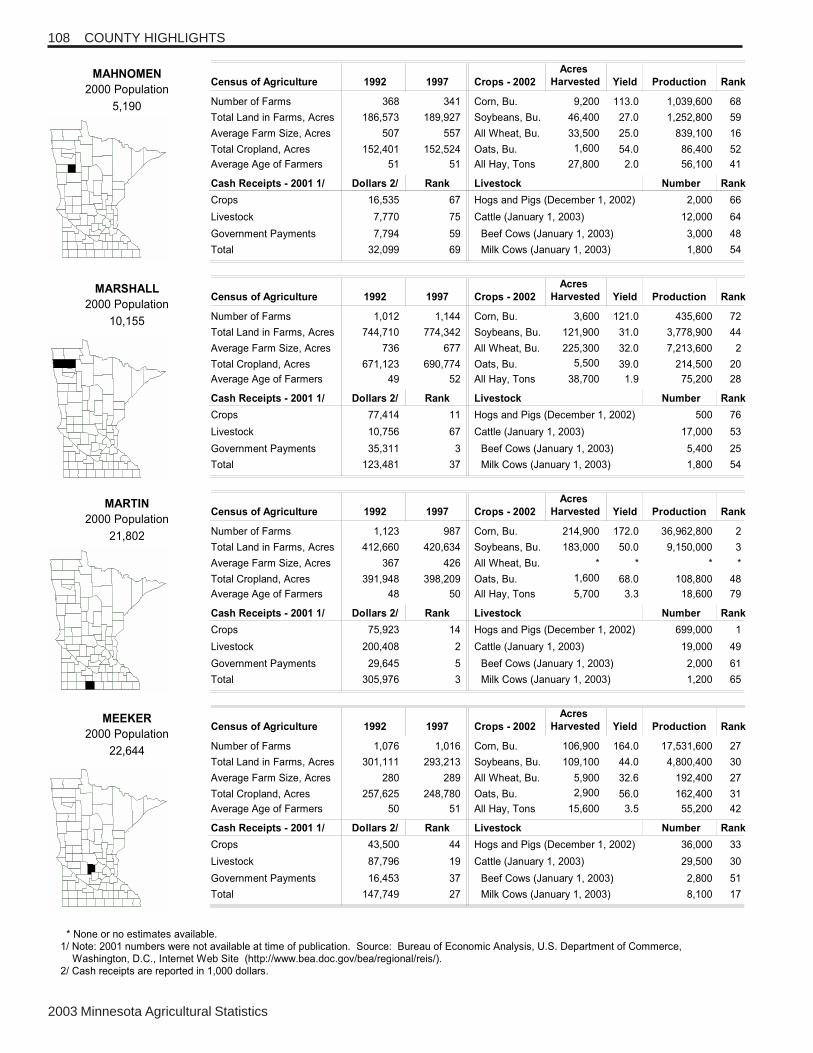
2003 Minnesota Agricultural Statistics
108 COUNTY HIGHLIGHTS
Number of Farms 368
Total Land in Farms, Acres 186,573
Average Farm Size, Acres 507
Total Cropland, Acres 152,401
Average Age of Farmers 51
341
189,927
557
152,524
51
Corn, Bu. 9,200
Soybeans, Bu. 46,400
All Wheat, Bu. 33,500
Oats, Bu. 1,600
All Hay, Tons 27,800
113.0
27.0
25.0
54.0
2.0
1,039,600
1,252,800
839,100
86,400
56,100
68
59
16
52
41
Crops - 2002
Acres
Harvested Yield Production RankCensus of Agriculture 1992 1997
Crops 16,535
Livestock 7,770
Government Payments 7,794
Total 32,099
67
75
59
69
2,000
12,000
3,000
1,800
66
64
48
54
Hogs and Pigs (December 1, 2002)
Cattle (January 1, 2003)
Beef Cows (January 1, 2003)
Milk Cows (January 1, 2003)
Livestock Number RankCash Receipts - 2001 1/ Dollars 2/ Rank
MAHNOMEN
2000 Population
5,190
Number of Farms 1,012
Total Land in Farms, Acres 744,710
Average Farm Size, Acres 736
Total Cropland, Acres 671,123
Average Age of Farmers 49
1,144
774,342
677
690,774
52
Corn, Bu. 3,600
Soybeans, Bu. 121,900
All Wheat, Bu. 225,300
Oats, Bu. 5,500
All Hay, Tons 38,700
121.0
31.0
32.0
39.0
1.9
435,600
3,778,900
7,213,600
214,500
75,200
72
44
2
20
28
Crops - 2002
Acres
Harvested Yield Production RankCensus of Agriculture 1992 1997
Crops 77,414
Livestock 10,756
Government Payments 35,311
Total 123,481
11
67
3
37
500
17,000
5,400
1,800
76
53
25
54
Hogs and Pigs (December 1, 2002)
Cattle (January 1, 2003)
Beef Cows (January 1, 2003)
Milk Cows (January 1, 2003)
Livestock Number RankCash Receipts - 2001 1/ Dollars 2/ Rank
MARSHALL
2000 Population
10,155
Number of Farms 1,123
Total Land in Farms, Acres 412,660
Average Farm Size, Acres 367
Total Cropland, Acres 391,948
Average Age of Farmers 48
987
420,634
426
398,209
50
Corn, Bu. 214,900
Soybeans, Bu. 183,000
All Wheat, Bu. *
Oats, Bu. 1,600
All Hay, Tons 5,700
172.0
50.0
*
68.0
3.3
36,962,800
9,150,000
*
108,800
18,600
2
3
*
48
79
Crops - 2002
Acres
Harvested Yield Production RankCensus of Agriculture 1992 1997
Crops 75,923
Livestock 200,408
Government Payments 29,645
Total 305,976
14
2
5
3
699,000
19,000
2,000
1,200
1
49
61
65
Hogs and Pigs (December 1, 2002)
Cattle (January 1, 2003)
Beef Cows (January 1, 2003)
Milk Cows (January 1, 2003)
Livestock Number RankCash Receipts - 2001 1/ Dollars 2/ Rank
MARTIN
2000 Population
21,802
Number of Farms 1,076
Total Land in Farms, Acres 301,111
Average Farm Size, Acres 280
Total Cropland, Acres 257,625
Average Age of Farmers 50
1,016
293,213
289
248,780
51
Corn, Bu. 106,900
Soybeans, Bu. 109,100
All Wheat, Bu. 5,900
Oats, Bu. 2,900
All Hay, Tons 15,600
164.0
44.0
32.6
56.0
3.5
17,531,600
4,800,400
192,400
162,400
55,200
27
30
27
31
42
Crops - 2002
Acres
Harvested Yield Production RankCensus of Agriculture 1992 1997
Crops 43,500
Livestock 87,796
Government Payments 16,453
Total 147,749
44
19
37
27
36,000
29,500
2,800
8,100
33
30
51
17
Hogs and Pigs (December 1, 2002)
Cattle (January 1, 2003)
Beef Cows (January 1, 2003)
Milk Cows (January 1, 2003)
Livestock Number RankCash Receipts - 2001 1/ Dollars 2/ Rank
MEEKER
2000 Population
22,644
* None or no estimates available.1/ Note: 2001 numbers were not available at time of publication. Source: Bureau of Economic Analysis, U.S. Department of Commerce, Washington, D.C., Internet Web Site (http://www.bea.doc.gov/bea/regional/reis/).2/ Cash receipts are reported in 1,000 dollars.
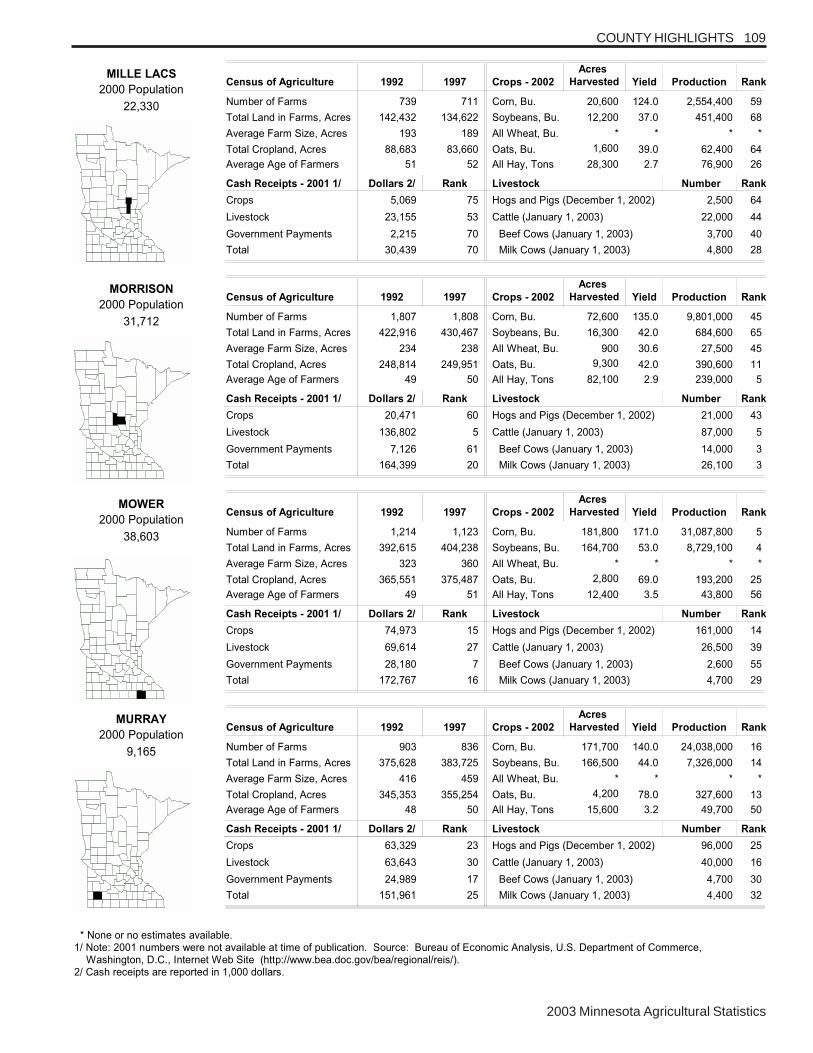
2003 Minnesota Agricultural Statistics
COUNTY HIGHLIGHTS 109
Number of Farms 739
Total Land in Farms, Acres 142,432
Average Farm Size, Acres 193
Total Cropland, Acres 88,683
Average Age of Farmers 51
711
134,622
189
83,660
52
Corn, Bu. 20,600
Soybeans, Bu. 12,200
All Wheat, Bu. *
Oats, Bu. 1,600
All Hay, Tons 28,300
124.0
37.0
*
39.0
2.7
2,554,400
451,400
*
62,400
76,900
59
68
*
64
26
Crops - 2002
Acres
Harvested Yield Production RankCensus of Agriculture 1992 1997
Crops 5,069
Livestock 23,155
Government Payments 2,215
Total 30,439
75
53
70
70
2,500
22,000
3,700
4,800
64
44
40
28
Hogs and Pigs (December 1, 2002)
Cattle (January 1, 2003)
Beef Cows (January 1, 2003)
Milk Cows (January 1, 2003)
Livestock Number RankCash Receipts - 2001 1/ Dollars 2/ Rank
MILLE LACS
2000 Population
22,330
Number of Farms 1,807
Total Land in Farms, Acres 422,916
Average Farm Size, Acres 234
Total Cropland, Acres 248,814
Average Age of Farmers 49
1,808
430,467
238
249,951
50
Corn, Bu. 72,600
Soybeans, Bu. 16,300
All Wheat, Bu. 900
Oats, Bu. 9,300
All Hay, Tons 82,100
135.0
42.0
30.6
42.0
2.9
9,801,000
684,600
27,500
390,600
239,000
45
65
45
11
5
Crops - 2002
Acres
Harvested Yield Production RankCensus of Agriculture 1992 1997
Crops 20,471
Livestock 136,802
Government Payments 7,126
Total 164,399
60
5
61
20
21,000
87,000
14,000
26,100
43
5
3
3
Hogs and Pigs (December 1, 2002)
Cattle (January 1, 2003)
Beef Cows (January 1, 2003)
Milk Cows (January 1, 2003)
Livestock Number RankCash Receipts - 2001 1/ Dollars 2/ Rank
MORRISON
2000 Population
31,712
Number of Farms 1,214
Total Land in Farms, Acres 392,615
Average Farm Size, Acres 323
Total Cropland, Acres 365,551
Average Age of Farmers 49
1,123
404,238
360
375,487
51
Corn, Bu. 181,800
Soybeans, Bu. 164,700
All Wheat, Bu. *
Oats, Bu. 2,800
All Hay, Tons 12,400
171.0
53.0
*
69.0
3.5
31,087,800
8,729,100
*
193,200
43,800
5
4
*
25
56
Crops - 2002
Acres
Harvested Yield Production RankCensus of Agriculture 1992 1997
Crops 74,973
Livestock 69,614
Government Payments 28,180
Total 172,767
15
27
7
16
161,000
26,500
2,600
4,700
14
39
55
29
Hogs and Pigs (December 1, 2002)
Cattle (January 1, 2003)
Beef Cows (January 1, 2003)
Milk Cows (January 1, 2003)
Livestock Number RankCash Receipts - 2001 1/ Dollars 2/ Rank
MOWER
2000 Population
38,603
Number of Farms 903
Total Land in Farms, Acres 375,628
Average Farm Size, Acres 416
Total Cropland, Acres 345,353
Average Age of Farmers 48
836
383,725
459
355,254
50
Corn, Bu. 171,700
Soybeans, Bu. 166,500
All Wheat, Bu. *
Oats, Bu. 4,200
All Hay, Tons 15,600
140.0
44.0
*
78.0
3.2
24,038,000
7,326,000
*
327,600
49,700
16
14
*
13
50
Crops - 2002
Acres
Harvested Yield Production RankCensus of Agriculture 1992 1997
Crops 63,329
Livestock 63,643
Government Payments 24,989
Total 151,961
23
30
17
25
96,000
40,000
4,700
4,400
25
16
30
32
Hogs and Pigs (December 1, 2002)
Cattle (January 1, 2003)
Beef Cows (January 1, 2003)
Milk Cows (January 1, 2003)
Livestock Number RankCash Receipts - 2001 1/ Dollars 2/ Rank
MURRAY
2000 Population
9,165
* None or no estimates available.1/ Note: 2001 numbers were not available at time of publication. Source: Bureau of Economic Analysis, U.S. Department of Commerce, Washington, D.C., Internet Web Site (http://www.bea.doc.gov/bea/regional/reis/).2/ Cash receipts are reported in 1,000 dollars.
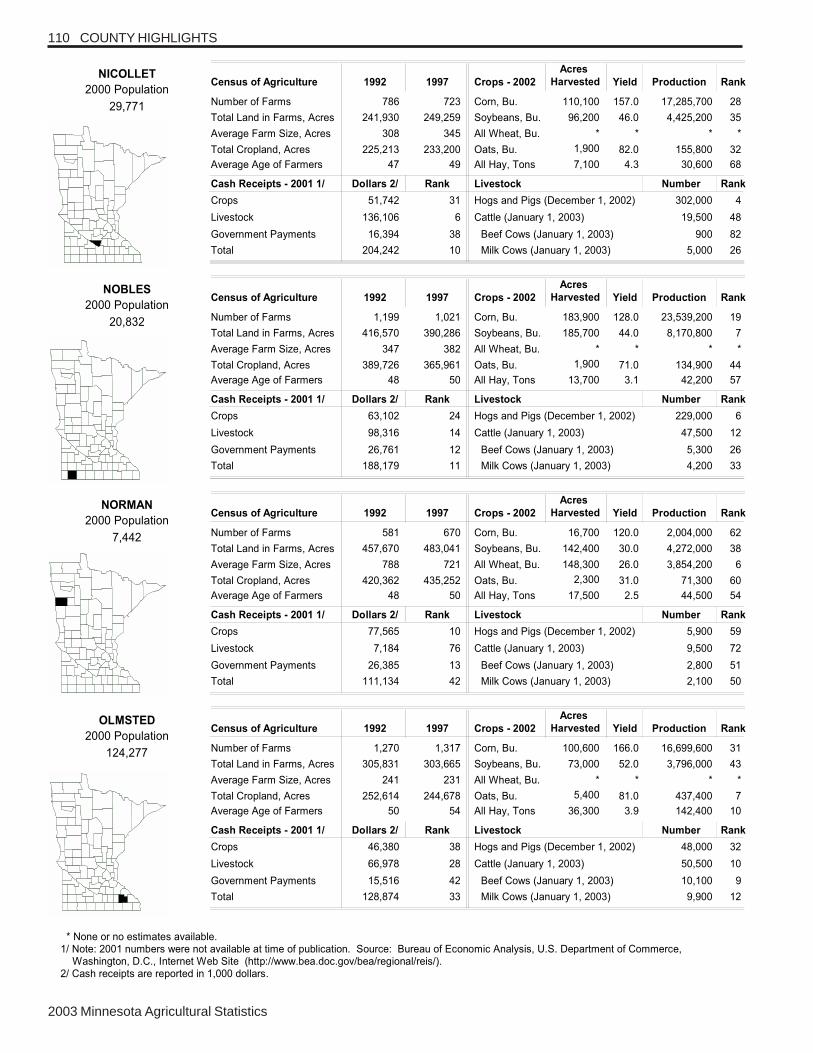
2003 Minnesota Agricultural Statistics
110 COUNTY HIGHLIGHTS
Number of Farms 786
Total Land in Farms, Acres 241,930
Average Farm Size, Acres 308
Total Cropland, Acres 225,213
Average Age of Farmers 47
723
249,259
345
233,200
49
Corn, Bu. 110,100
Soybeans, Bu. 96,200
All Wheat, Bu. *
Oats, Bu. 1,900
All Hay, Tons 7,100
157.0
46.0
*
82.0
4.3
17,285,700
4,425,200
*
155,800
30,600
28
35
*
32
68
Crops - 2002
Acres
Harvested Yield Production RankCensus of Agriculture 1992 1997
Crops 51,742
Livestock 136,106
Government Payments 16,394
Total 204,242
31
6
38
10
302,000
19,500
900
5,000
4
48
82
26
Hogs and Pigs (December 1, 2002)
Cattle (January 1, 2003)
Beef Cows (January 1, 2003)
Milk Cows (January 1, 2003)
Livestock Number RankCash Receipts - 2001 1/ Dollars 2/ Rank
NICOLLET
2000 Population
29,771
Number of Farms 1,199
Total Land in Farms, Acres 416,570
Average Farm Size, Acres 347
Total Cropland, Acres 389,726
Average Age of Farmers 48
1,021
390,286
382
365,961
50
Corn, Bu. 183,900
Soybeans, Bu. 185,700
All Wheat, Bu. *
Oats, Bu. 1,900
All Hay, Tons 13,700
128.0
44.0
*
71.0
3.1
23,539,200
8,170,800
*
134,900
42,200
19
7
*
44
57
Crops - 2002
Acres
Harvested Yield Production RankCensus of Agriculture 1992 1997
Crops 63,102
Livestock 98,316
Government Payments 26,761
Total 188,179
24
14
12
11
229,000
47,500
5,300
4,200
6
12
26
33
Hogs and Pigs (December 1, 2002)
Cattle (January 1, 2003)
Beef Cows (January 1, 2003)
Milk Cows (January 1, 2003)
Livestock Number RankCash Receipts - 2001 1/ Dollars 2/ Rank
NOBLES
2000 Population
20,832
Number of Farms 581
Total Land in Farms, Acres 457,670
Average Farm Size, Acres 788
Total Cropland, Acres 420,362
Average Age of Farmers 48
670
483,041
721
435,252
50
Corn, Bu. 16,700
Soybeans, Bu. 142,400
All Wheat, Bu. 148,300
Oats, Bu. 2,300
All Hay, Tons 17,500
120.0
30.0
26.0
31.0
2.5
2,004,000
4,272,000
3,854,200
71,300
44,500
62
38
6
60
54
Crops - 2002
Acres
Harvested Yield Production RankCensus of Agriculture 1992 1997
Crops 77,565
Livestock 7,184
Government Payments 26,385
Total 111,134
10
76
13
42
5,900
9,500
2,800
2,100
59
72
51
50
Hogs and Pigs (December 1, 2002)
Cattle (January 1, 2003)
Beef Cows (January 1, 2003)
Milk Cows (January 1, 2003)
Livestock Number RankCash Receipts - 2001 1/ Dollars 2/ Rank
NORMAN
2000 Population
7,442
Number of Farms 1,270
Total Land in Farms, Acres 305,831
Average Farm Size, Acres 241
Total Cropland, Acres 252,614
Average Age of Farmers 50
1,317
303,665
231
244,678
54
Corn, Bu. 100,600
Soybeans, Bu. 73,000
All Wheat, Bu. *
Oats, Bu. 5,400
All Hay, Tons 36,300
166.0
52.0
*
81.0
3.9
16,699,600
3,796,000
*
437,400
142,400
31
43
*
7
10
Crops - 2002
Acres
Harvested Yield Production RankCensus of Agriculture 1992 1997
Crops 46,380
Livestock 66,978
Government Payments 15,516
Total 128,874
38
28
42
33
48,000
50,500
10,100
9,900
32
10
9
12
Hogs and Pigs (December 1, 2002)
Cattle (January 1, 2003)
Beef Cows (January 1, 2003)
Milk Cows (January 1, 2003)
Livestock Number RankCash Receipts - 2001 1/ Dollars 2/ Rank
OLMSTED
2000 Population
124,277
* None or no estimates available.1/ Note: 2001 numbers were not available at time of publication. Source: Bureau of Economic Analysis, U.S. Department of Commerce, Washington, D.C., Internet Web Site (http://www.bea.doc.gov/bea/regional/reis/).2/ Cash receipts are reported in 1,000 dollars.

2003 Minnesota Agricultural Statistics
COUNTY HIGHLIGHTS 111
Number of Farms 2,509
Total Land in Farms, Acres 821,073
Average Farm Size, Acres 327
Total Cropland, Acres 582,018
Average Age of Farmers 50
2,647
840,353
317
595,303
53
Corn, Bu. 119,900
Soybeans, Bu. 128,300
All Wheat, Bu. 68,100
Oats, Bu. 22,200
All Hay, Tons 117,300
136.0
37.0
34.0
44.0
2.7
16,306,400
4,750,800
2,313,900
976,800
320,300
33
32
7
2
2
Crops - 2002
Acres
Harvested Yield Production RankCensus of Agriculture 1992 1997
Crops 77,263
Livestock 135,521
Government Payments 22,707
Total 235,491
13
7
21
7
29,000
105,500
16,600
25,500
36
2
2
4
Hogs and Pigs (December 1, 2002)
Cattle (January 1, 2003)
Beef Cows (January 1, 2003)
Milk Cows (January 1, 2003)
Livestock Number RankCash Receipts - 2001 1/ Dollars 2/ Rank
OTTER TAIL
2000 Population
57,159
Number of Farms 480
Total Land in Farms, Acres 280,089
Average Farm Size, Acres 584
Total Cropland, Acres 243,524
Average Age of Farmers 51
528
312,752
592
263,999
54
Corn, Bu. 1,400
Soybeans, Bu. 65,200
All Wheat, Bu. 69,500
Oats, Bu. 5,200
All Hay, Tons 31,100
100.0
30.0
24.3
39.0
2.3
140,000
1,956,000
1,686,200
202,800
70,500
76
54
12
22
30
Crops - 2002
Acres
Harvested Yield Production RankCensus of Agriculture 1992 1997
Crops 17,577
Livestock 5,003
Government Payments 11,381
Total 33,961
63
81
51
66
600
10,000
3,600
600
74
71
43
77
Hogs and Pigs (December 1, 2002)
Cattle (January 1, 2003)
Beef Cows (January 1, 2003)
Milk Cows (January 1, 2003)
Livestock Number RankCash Receipts - 2001 1/ Dollars 2/ Rank
PENNINGTON
2000 Population
13,584
Number of Farms 979
Total Land in Farms, Acres 263,274
Average Farm Size, Acres 269
Total Cropland, Acres 140,539
Average Age of Farmers 51
950
246,804
260
129,411
53
Corn, Bu. 13,900
Soybeans, Bu. 8,700
All Wheat, Bu. *
Oats, Bu. 2,100
All Hay, Tons 50,600
119.0
44.0
*
38.0
2.4
1,654,100
382,800
*
79,800
119,100
64
69
*
54
12
Crops - 2002
Acres
Harvested Yield Production RankCensus of Agriculture 1992 1997
Crops 7,819
Livestock 32,171
Government Payments 1,861
Total 41,851
72
50
72
65
1,500
35,500
7,500
6,200
68
19
17
24
Hogs and Pigs (December 1, 2002)
Cattle (January 1, 2003)
Beef Cows (January 1, 2003)
Milk Cows (January 1, 2003)
Livestock Number RankCash Receipts - 2001 1/ Dollars 2/ Rank
PINE
2000 Population
26,530
Number of Farms 778
Total Land in Farms, Acres 252,658
Average Farm Size, Acres 325
Total Cropland, Acres 223,165
Average Age of Farmers 48
690
243,525
353
213,407
48
Corn, Bu. 94,000
Soybeans, Bu. 93,300
All Wheat, Bu. *
Oats, Bu. 3,200
All Hay, Tons 17,800
131.0
43.0
*
78.0
3.1
12,314,000
4,011,900
*
249,600
55,200
40
41
*
15
42
Crops - 2002
Acres
Harvested Yield Production RankCensus of Agriculture 1992 1997
Crops 36,166
Livestock 99,208
Government Payments 14,010
Total 149,384
47
13
45
26
198,000
36,000
8,900
4,700
10
17
13
29
Hogs and Pigs (December 1, 2002)
Cattle (January 1, 2003)
Beef Cows (January 1, 2003)
Milk Cows (January 1, 2003)
Livestock Number RankCash Receipts - 2001 1/ Dollars 2/ Rank
PIPESTONE
2000 Population
9,895
* None or no estimates available.1/ Note: 2001 numbers were not available at time of publication. Source: Bureau of Economic Analysis, U.S. Department of Commerce, Washington, D.C., Internet Web Site (http://www.bea.doc.gov/bea/regional/reis/).2/ Cash receipts are reported in 1,000 dollars.
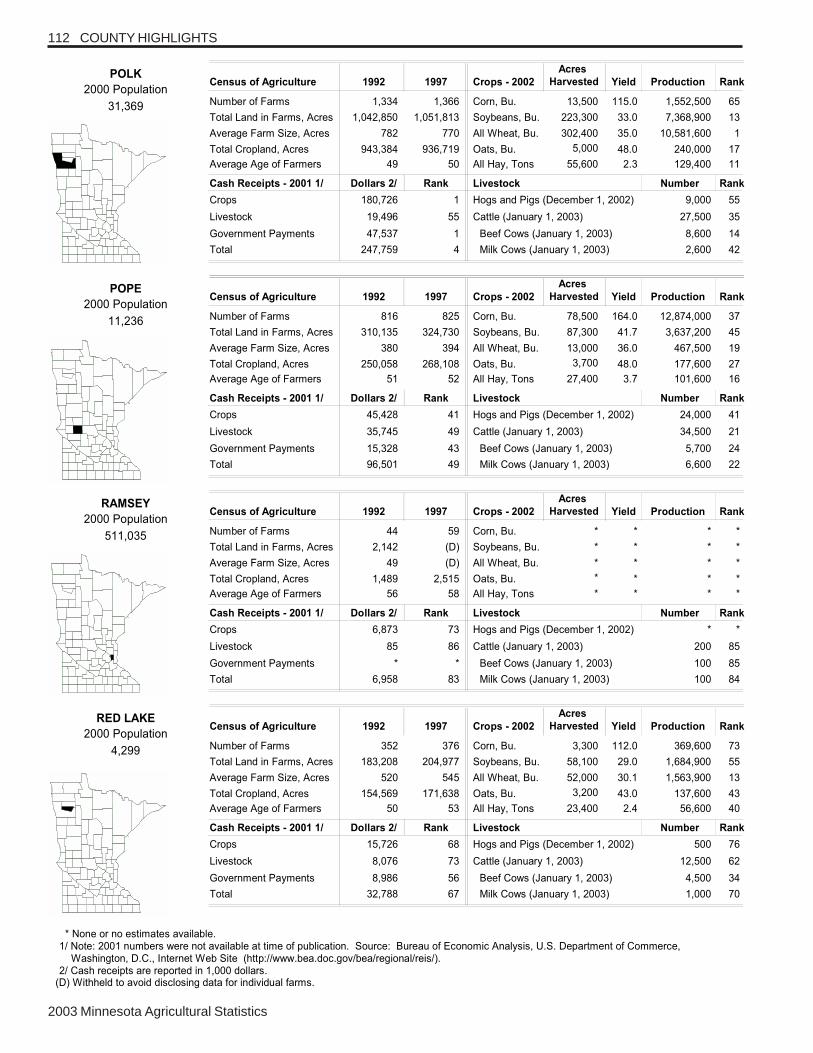
2003 Minnesota Agricultural Statistics
112 COUNTY HIGHLIGHTS
Number of Farms 1,334
Total Land in Farms, Acres 1,042,850
Average Farm Size, Acres 782
Total Cropland, Acres 943,384
Average Age of Farmers 49
1,366
1,051,813
770
936,719
50
Corn, Bu. 13,500
Soybeans, Bu. 223,300
All Wheat, Bu. 302,400
Oats, Bu. 5,000
All Hay, Tons 55,600
115.0
33.0
35.0
48.0
2.3
1,552,500
7,368,900
10,581,600
240,000
129,400
65
13
1
17
11
Crops - 2002
Acres
Harvested Yield Production RankCensus of Agriculture 1992 1997
Crops 180,726
Livestock 19,496
Government Payments 47,537
Total 247,759
1
55
1
4
9,000
27,500
8,600
2,600
55
35
14
42
Hogs and Pigs (December 1, 2002)
Cattle (January 1, 2003)
Beef Cows (January 1, 2003)
Milk Cows (January 1, 2003)
Livestock Number RankCash Receipts - 2001 1/ Dollars 2/ Rank
POLK
2000 Population
31,369
Number of Farms 816
Total Land in Farms, Acres 310,135
Average Farm Size, Acres 380
Total Cropland, Acres 250,058
Average Age of Farmers 51
825
324,730
394
268,108
52
Corn, Bu. 78,500
Soybeans, Bu. 87,300
All Wheat, Bu. 13,000
Oats, Bu. 3,700
All Hay, Tons 27,400
164.0
41.7
36.0
48.0
3.7
12,874,000
3,637,200
467,500
177,600
101,600
37
45
19
27
16
Crops - 2002
Acres
Harvested Yield Production RankCensus of Agriculture 1992 1997
Crops 45,428
Livestock 35,745
Government Payments 15,328
Total 96,501
41
49
43
49
24,000
34,500
5,700
6,600
41
21
24
22
Hogs and Pigs (December 1, 2002)
Cattle (January 1, 2003)
Beef Cows (January 1, 2003)
Milk Cows (January 1, 2003)
Livestock Number RankCash Receipts - 2001 1/ Dollars 2/ Rank
POPE
2000 Population
11,236
Number of Farms 44
Total Land in Farms, Acres 2,142
Average Farm Size, Acres 49
Total Cropland, Acres 1,489
Average Age of Farmers 56
59
(D)
(D)
2,515
58
Corn, Bu. *
Soybeans, Bu. *
All Wheat, Bu. *
Oats, Bu. *
All Hay, Tons *
*
*
*
*
*
*
*
*
*
*
*
*
*
*
*
Crops - 2002
Acres
Harvested Yield Production RankCensus of Agriculture 1992 1997
Crops 6,873
Livestock 85
Government Payments *
Total 6,958
73
86
*
83
*
200
100
100
*
85
85
84
Hogs and Pigs (December 1, 2002)
Cattle (January 1, 2003)
Beef Cows (January 1, 2003)
Milk Cows (January 1, 2003)
Livestock Number RankCash Receipts - 2001 1/ Dollars 2/ Rank
RAMSEY
2000 Population
511,035
Number of Farms 352
Total Land in Farms, Acres 183,208
Average Farm Size, Acres 520
Total Cropland, Acres 154,569
Average Age of Farmers 50
376
204,977
545
171,638
53
Corn, Bu. 3,300
Soybeans, Bu. 58,100
All Wheat, Bu. 52,000
Oats, Bu. 3,200
All Hay, Tons 23,400
112.0
29.0
30.1
43.0
2.4
369,600
1,684,900
1,563,900
137,600
56,600
73
55
13
43
40
Crops - 2002
Acres
Harvested Yield Production RankCensus of Agriculture 1992 1997
Crops 15,726
Livestock 8,076
Government Payments 8,986
Total 32,788
68
73
56
67
500
12,500
4,500
1,000
76
62
34
70
Hogs and Pigs (December 1, 2002)
Cattle (January 1, 2003)
Beef Cows (January 1, 2003)
Milk Cows (January 1, 2003)
Livestock Number RankCash Receipts - 2001 1/ Dollars 2/ Rank
RED LAKE
2000 Population
4,299
* None or no estimates available.1/ Note: 2001 numbers were not available at time of publication. Source: Bureau of Economic Analysis, U.S. Department of Commerce, Washington, D.C., Internet Web Site (http://www.bea.doc.gov/bea/regional/reis/).2/ Cash receipts are reported in 1,000 dollars.
(D) Withheld to avoid disclosing data for individual farms.

2003 Minnesota Agricultural Statistics
COUNTY HIGHLIGHTS 113
Number of Farms 1,259
Total Land in Farms, Acres 491,726
Average Farm Size, Acres 391
Total Cropland, Acres 460,227
Average Age of Farmers 46
1,168
508,129
435
472,615
49
Corn, Bu. 227,600
Soybeans, Bu. 222,300
All Wheat, Bu. 3,300
Oats, Bu. 1,600
All Hay, Tons 12,000
157.0
45.0
35.0
64.0
4.2
35,733,200
10,003,500
115,500
102,400
50,500
3
2
33
50
47
Crops - 2002
Acres
Harvested Yield Production RankCensus of Agriculture 1992 1997
Crops 99,121
Livestock 98,058
Government Payments 32,523
Total 229,702
4
15
4
8
180,000
36,000
6,200
1,800
11
17
21
54
Hogs and Pigs (December 1, 2002)
Cattle (January 1, 2003)
Beef Cows (January 1, 2003)
Milk Cows (January 1, 2003)
Livestock Number RankCash Receipts - 2001 1/ Dollars 2/ Rank
REDWOOD
2000 Population
16,815
Number of Farms 1,302
Total Land in Farms, Acres 600,114
Average Farm Size, Acres 461
Total Cropland, Acres 566,274
Average Age of Farmers 47
1,114
601,103
540
567,231
49
Corn, Bu. 237,500
Soybeans, Bu. 227,300
All Wheat, Bu. 5,300
Oats, Bu. 1,300
All Hay, Tons 9,000
169.0
48.0
36.9
65.0
4.1
40,137,500
10,910,400
195,700
84,500
36,800
1
1
25
53
64
Crops - 2002
Acres
Harvested Yield Production RankCensus of Agriculture 1992 1997
Crops 161,048
Livestock 134,588
Government Payments 36,226
Total 331,862
2
9
2
2
253,000
27,000
1,400
2,800
5
37
75
39
Hogs and Pigs (December 1, 2002)
Cattle (January 1, 2003)
Beef Cows (January 1, 2003)
Milk Cows (January 1, 2003)
Livestock Number RankCash Receipts - 2001 1/ Dollars 2/ Rank
RENVILLE
2000 Population
17,154
Number of Farms 1,099
Total Land in Farms, Acres 227,519
Average Farm Size, Acres 207
Total Cropland, Acres 194,920
Average Age of Farmers 50
1,191
251,031
211
208,613
51
Corn, Bu. 74,900
Soybeans, Bu. 67,000
All Wheat, Bu. *
Oats, Bu. 3,700
All Hay, Tons 17,400
166.0
50.0
*
66.0
3.2
12,433,400
3,350,000
*
244,200
55,000
38
46
*
16
44
Crops - 2002
Acres
Harvested Yield Production RankCensus of Agriculture 1992 1997
Crops 35,894
Livestock 96,297
Government Payments 13,110
Total 145,301
49
16
48
29
220,000
29,500
2,400
8,800
7
30
56
16
Hogs and Pigs (December 1, 2002)
Cattle (January 1, 2003)
Beef Cows (January 1, 2003)
Milk Cows (January 1, 2003)
Livestock Number RankCash Receipts - 2001 1/ Dollars 2/ Rank
RICE
2000 Population
56,665
Number of Farms 791
Total Land in Farms, Acres 270,332
Average Farm Size, Acres 342
Total Cropland, Acres 248,647
Average Age of Farmers 47
704
280,715
399
260,316
48
Corn, Bu. 120,600
Soybeans, Bu. 120,100
All Wheat, Bu. *
Oats, Bu. 1,700
All Hay, Tons 12,600
142.0
44.0
*
74.0
2.9
17,125,200
5,284,400
*
125,800
36,400
29
24
*
47
65
Crops - 2002
Acres
Harvested Yield Production RankCensus of Agriculture 1992 1997
Crops 49,196
Livestock 95,078
Government Payments 18,894
Total 163,168
35
18
30
22
152,000
49,000
7,000
3,300
15
11
18
36
Hogs and Pigs (December 1, 2002)
Cattle (January 1, 2003)
Beef Cows (January 1, 2003)
Milk Cows (January 1, 2003)
Livestock Number RankCash Receipts - 2001 1/ Dollars 2/ Rank
ROCK
2000 Population
9,721
* None or no estimates available.1/ Note: 2001 numbers were not available at time of publication. Source: Bureau of Economic Analysis, U.S. Department of Commerce, Washington, D.C., Internet Web Site (http://www.bea.doc.gov/bea/regional/reis/).2/ Cash receipts are reported in 1,000 dollars.

2003 Minnesota Agricultural Statistics
114 COUNTY HIGHLIGHTS
Number of Farms 891
Total Land in Farms, Acres 536,299
Average Farm Size, Acres 602
Total Cropland, Acres 439,145
Average Age of Farmers 51
1,051
577,455
549
466,711
53
Corn, Bu. 1,300
Soybeans, Bu. 10,600
All Wheat, Bu. 84,300
Oats, Bu. 10,000
All Hay, Tons 53,700
81.0
33.0
21.9
43.0
1.5
105,300
349,800
1,844,200
430,000
82,100
77
71
11
8
24
Crops - 2002
Acres
Harvested Yield Production RankCensus of Agriculture 1992 1997
Crops 24,470
Livestock 20,900
Government Payments 17,676
Total 63,046
55
54
36
59
1,500
27,000
9,600
2,500
68
37
11
43
Hogs and Pigs (December 1, 2002)
Cattle (January 1, 2003)
Beef Cows (January 1, 2003)
Milk Cows (January 1, 2003)
Livestock Number RankCash Receipts - 2001 1/ Dollars 2/ Rank
ROSEAU
2000 Population
16,338
Number of Farms 677
Total Land in Farms, Acres 153,188
Average Farm Size, Acres 226
Total Cropland, Acres 80,397
Average Age of Farmers 52
713
155,452
218
86,902
53
Corn, Bu. *
Soybeans, Bu. *
All Wheat, Bu. *
Oats, Bu. 1,100
All Hay, Tons 48,200
*
*
*
55.0
1.6
*
*
*
60,500
78,100
*
*
*
65
25
Crops - 2002
Acres
Harvested Yield Production RankCensus of Agriculture 1992 1997
Crops 4,723
Livestock 5,720
Government Payments 101
Total 10,544
76
80
84
80
800
11,700
3,800
1,100
73
65
38
69
Hogs and Pigs (December 1, 2002)
Cattle (January 1, 2003)
Beef Cows (January 1, 2003)
Milk Cows (January 1, 2003)
Livestock Number RankCash Receipts - 2001 1/ Dollars 2/ Rank
ST. LOUIS
2000 Population
200,528
Number of Farms 838
Total Land in Farms, Acres 131,753
Average Farm Size, Acres 157
Total Cropland, Acres 110,116
Average Age of Farmers 50
805
117,830
146
99,795
49
Corn, Bu. 38,500
Soybeans, Bu. 34,600
All Wheat, Bu. *
Oats, Bu. 2,200
All Hay, Tons 18,100
169.0
48.0
*
76.0
3.4
6,506,500
1,660,800
*
167,200
61,500
52
56
*
29
34
Crops - 2002
Acres
Harvested Yield Production RankCensus of Agriculture 1992 1997
Crops 18,060
Livestock 27,904
Government Payments 5,935
Total 51,899
62
51
62
62
14,000
21,000
1,500
6,200
52
46
72
24
Hogs and Pigs (December 1, 2002)
Cattle (January 1, 2003)
Beef Cows (January 1, 2003)
Milk Cows (January 1, 2003)
Livestock Number RankCash Receipts - 2001 1/ Dollars 2/ Rank
SCOTT
2000 Population
89,498
Number of Farms 530
Total Land in Farms, Acres 117,701
Average Farm Size, Acres 222
Total Cropland, Acres 86,678
Average Age of Farmers 52
512
105,042
205
77,099
52
Corn, Bu. 27,400
Soybeans, Bu. 16,300
All Wheat, Bu. *
Oats, Bu. 500
All Hay, Tons 8,800
128.0
43.0
*
50.0
2.2
3,507,200
700,900
*
25,000
19,100
56
64
*
74
78
Crops - 2002
Acres
Harvested Yield Production RankCensus of Agriculture 1992 1997
Crops 24,685
Livestock 15,755
Government Payments 3,532
Total 43,972
54
59
65
64
7,900
11,000
1,700
1,000
57
68
69
70
Hogs and Pigs (December 1, 2002)
Cattle (January 1, 2003)
Beef Cows (January 1, 2003)
Milk Cows (January 1, 2003)
Livestock Number RankCash Receipts - 2001 1/ Dollars 2/ Rank
SHERBURNE
2000 Population
64,417
* None or no estimates available.1/ Note: 2001 numbers were not available at time of publication. Source: Bureau of Economic Analysis, U.S. Department of Commerce, Washington, D.C., Internet Web Site (http://www.bea.doc.gov/bea/regional/reis/).2/ Cash receipts are reported in 1,000 dollars.
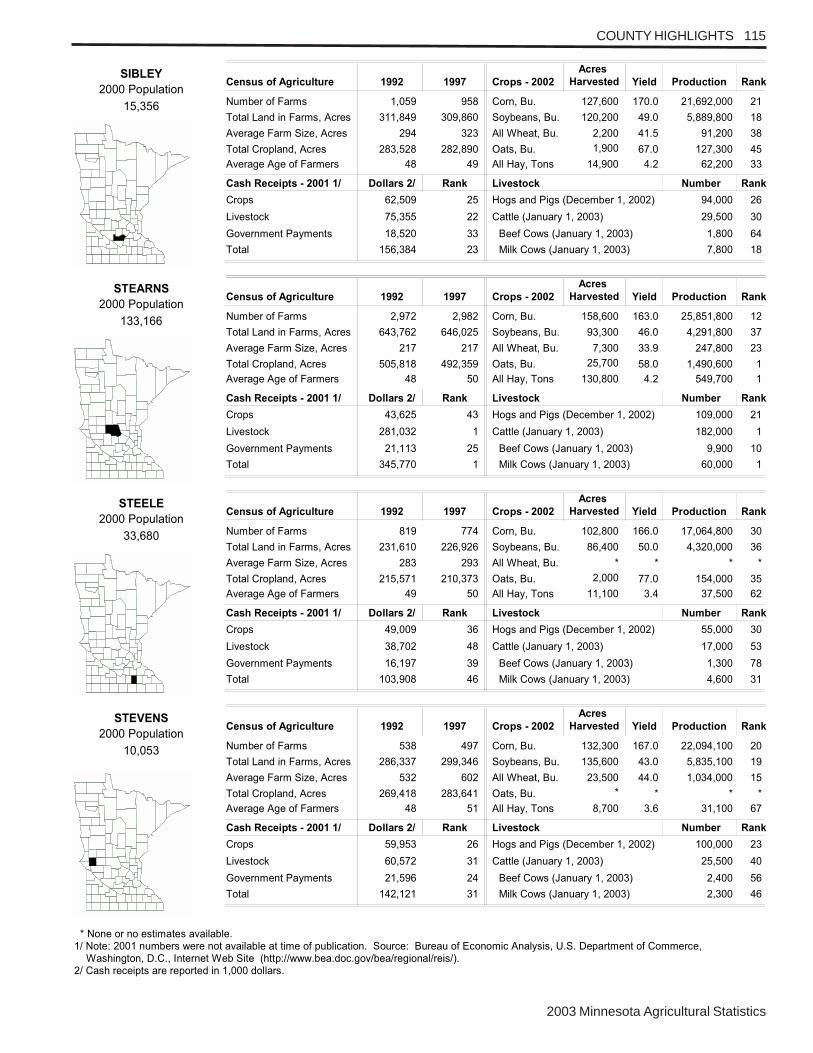
2003 Minnesota Agricultural Statistics
COUNTY HIGHLIGHTS 115
Number of Farms 1,059
Total Land in Farms, Acres 311,849
Average Farm Size, Acres 294
Total Cropland, Acres 283,528
Average Age of Farmers 48
958
309,860
323
282,890
49
Corn, Bu. 127,600
Soybeans, Bu. 120,200
All Wheat, Bu. 2,200
Oats, Bu. 1,900
All Hay, Tons 14,900
170.0
49.0
41.5
67.0
4.2
21,692,000
5,889,800
91,200
127,300
62,200
21
18
38
45
33
Crops - 2002
Acres
Harvested Yield Production RankCensus of Agriculture 1992 1997
Crops 62,509
Livestock 75,355
Government Payments 18,520
Total 156,384
25
22
33
23
94,000
29,500
1,800
7,800
26
30
64
18
Hogs and Pigs (December 1, 2002)
Cattle (January 1, 2003)
Beef Cows (January 1, 2003)
Milk Cows (January 1, 2003)
Livestock Number RankCash Receipts - 2001 1/ Dollars 2/ Rank
SIBLEY
2000 Population
15,356
Number of Farms 2,972
Total Land in Farms, Acres 643,762
Average Farm Size, Acres 217
Total Cropland, Acres 505,818
Average Age of Farmers 48
2,982
646,025
217
492,359
50
Corn, Bu. 158,600
Soybeans, Bu. 93,300
All Wheat, Bu. 7,300
Oats, Bu. 25,700
All Hay, Tons 130,800
163.0
46.0
33.9
58.0
4.2
25,851,800
4,291,800
247,800
1,490,600
549,700
12
37
23
1
1
Crops - 2002
Acres
Harvested Yield Production RankCensus of Agriculture 1992 1997
Crops 43,625
Livestock 281,032
Government Payments 21,113
Total 345,770
43
1
25
1
109,000
182,000
9,900
60,000
21
1
10
1
Hogs and Pigs (December 1, 2002)
Cattle (January 1, 2003)
Beef Cows (January 1, 2003)
Milk Cows (January 1, 2003)
Livestock Number RankCash Receipts - 2001 1/ Dollars 2/ Rank
STEARNS
2000 Population
133,166
Number of Farms 819
Total Land in Farms, Acres 231,610
Average Farm Size, Acres 283
Total Cropland, Acres 215,571
Average Age of Farmers 49
774
226,926
293
210,373
50
Corn, Bu. 102,800
Soybeans, Bu. 86,400
All Wheat, Bu. *
Oats, Bu. 2,000
All Hay, Tons 11,100
166.0
50.0
*
77.0
3.4
17,064,800
4,320,000
*
154,000
37,500
30
36
*
35
62
Crops - 2002
Acres
Harvested Yield Production RankCensus of Agriculture 1992 1997
Crops 49,009
Livestock 38,702
Government Payments 16,197
Total 103,908
36
48
39
46
55,000
17,000
1,300
4,600
30
53
78
31
Hogs and Pigs (December 1, 2002)
Cattle (January 1, 2003)
Beef Cows (January 1, 2003)
Milk Cows (January 1, 2003)
Livestock Number RankCash Receipts - 2001 1/ Dollars 2/ Rank
STEELE
2000 Population
33,680
Number of Farms 538
Total Land in Farms, Acres 286,337
Average Farm Size, Acres 532
Total Cropland, Acres 269,418
Average Age of Farmers 48
497
299,346
602
283,641
51
Corn, Bu. 132,300
Soybeans, Bu. 135,600
All Wheat, Bu. 23,500
Oats, Bu. *
All Hay, Tons 8,700
167.0
43.0
44.0
*
3.6
22,094,100
5,835,100
1,034,000
*
31,100
20
19
15
*
67
Crops - 2002
Acres
Harvested Yield Production RankCensus of Agriculture 1992 1997
Crops 59,953
Livestock 60,572
Government Payments 21,596
Total 142,121
26
31
24
31
100,000
25,500
2,400
2,300
23
40
56
46
Hogs and Pigs (December 1, 2002)
Cattle (January 1, 2003)
Beef Cows (January 1, 2003)
Milk Cows (January 1, 2003)
Livestock Number RankCash Receipts - 2001 1/ Dollars 2/ Rank
STEVENS
2000 Population
10,053
* None or no estimates available.1/ Note: 2001 numbers were not available at time of publication. Source: Bureau of Economic Analysis, U.S. Department of Commerce, Washington, D.C., Internet Web Site (http://www.bea.doc.gov/bea/regional/reis/).2/ Cash receipts are reported in 1,000 dollars.

2003 Minnesota Agricultural Statistics
116 COUNTY HIGHLIGHTS
Number of Farms 760
Total Land in Farms, Acres 389,897
Average Farm Size, Acres 513
Total Cropland, Acres 359,461
Average Age of Farmers 49
739
388,215
525
352,100
51
Corn, Bu. 153,500
Soybeans, Bu. 149,300
All Wheat, Bu. 8,100
Oats, Bu. 2,000
All Hay, Tons 11,100
168.0
42.0
40.9
71.0
4.0
25,788,000
6,274,800
331,600
142,000
44,900
13
16
22
42
53
Crops - 2002
Acres
Harvested Yield Production RankCensus of Agriculture 1992 1997
Crops 74,508
Livestock 43,111
Government Payments 24,735
Total 142,354
16
43
19
30
18,500
21,500
3,100
3,700
46
45
47
35
Hogs and Pigs (December 1, 2002)
Cattle (January 1, 2003)
Beef Cows (January 1, 2003)
Milk Cows (January 1, 2003)
Livestock Number RankCash Receipts - 2001 1/ Dollars 2/ Rank
SWIFT
2000 Population
11,956
Number of Farms 1,768
Total Land in Farms, Acres 395,071
Average Farm Size, Acres 223
Total Cropland, Acres 257,167
Average Age of Farmers 50
1,741
387,462
223
247,689
52
Corn, Bu. 58,800
Soybeans, Bu. 32,700
All Wheat, Bu. 7,000
Oats, Bu. 12,400
All Hay, Tons 72,300
134.0
42.0
27.1
38.0
2.1
7,879,200
1,373,400
189,700
471,200
153,500
49
58
28
6
9
Crops - 2002
Acres
Harvested Yield Production RankCensus of Agriculture 1992 1997
Crops 21,294
Livestock 95,226
Government Payments 7,343
Total 123,863
58
17
60
36
13,000
69,500
11,300
19,600
53
7
6
6
Hogs and Pigs (December 1, 2002)
Cattle (January 1, 2003)
Beef Cows (January 1, 2003)
Milk Cows (January 1, 2003)
Livestock Number RankCash Receipts - 2001 1/ Dollars 2/ Rank
TODD
2000 Population
24,426
Number of Farms 385
Total Land in Farms, Acres 310,184
Average Farm Size, Acres 806
Total Cropland, Acres 298,692
Average Age of Farmers 48
385
315,068
818
300,203
50
Corn, Bu. 99,400
Soybeans, Bu. 144,700
All Wheat, Bu. 46,500
Oats, Bu. *
All Hay, Tons 8,600
159.0
40.0
45.0
*
3.2
15,804,600
5,792,000
2,091,300
*
27,600
34
20
8
*
72
Crops - 2002
Acres
Harvested Yield Production RankCensus of Agriculture 1992 1997
Crops 57,156
Livestock 8,844
Government Payments 19,487
Total 85,487
27
70
28
52
16,000
7,500
1,500
*
50
77
72
*
Hogs and Pigs (December 1, 2002)
Cattle (January 1, 2003)
Beef Cows (January 1, 2003)
Milk Cows (January 1, 2003)
Livestock Number RankCash Receipts - 2001 1/ Dollars 2/ Rank
TRAVERSE
2000 Population
4,134
Number of Farms 928
Total Land in Farms, Acres 245,686
Average Farm Size, Acres 265
Total Cropland, Acres 181,203
Average Age of Farmers 49
963
253,401
263
183,722
50
Corn, Bu. 72,800
Soybeans, Bu. 35,000
All Wheat, Bu. *
Oats, Bu. 9,200
All Hay, Tons 50,800
164.0
56.0
*
72.0
3.9
11,939,200
1,960,000
*
662,400
200,300
42
53
*
4
8
Crops - 2002
Acres
Harvested Yield Production RankCensus of Agriculture 1992 1997
Crops 28,793
Livestock 73,820
Government Payments 9,604
Total 112,217
53
23
54
40
19,000
67,500
9,200
18,400
45
8
12
7
Hogs and Pigs (December 1, 2002)
Cattle (January 1, 2003)
Beef Cows (January 1, 2003)
Milk Cows (January 1, 2003)
Livestock Number RankCash Receipts - 2001 1/ Dollars 2/ Rank
WABASHA
2000 Population
21,610
* None or no estimates available.1/ Note: 2001 numbers were not available at time of publication. Source: Bureau of Economic Analysis, U.S. Department of Commerce, Washington, D.C., Internet Web Site (http://www.bea.doc.gov/bea/regional/reis/).2/ Cash receipts are reported in 1,000 dollars.

2003 Minnesota Agricultural Statistics
COUNTY HIGHLIGHTS 117
Number of Farms 602
Total Land in Farms, Acres 171,412
Average Farm Size, Acres 285
Total Cropland, Acres 94,256
Average Age of Farmers 51
625
174,833
280
99,564
53
Corn, Bu. 19,000
Soybeans, Bu. 3,500
All Wheat, Bu. *
Oats, Bu. 5,500
All Hay, Tons 40,800
133.0
41.0
*
34.0
2.0
2,527,000
143,500
*
187,000
82,300
60
73
*
26
23
Crops - 2002
Acres
Harvested Yield Production RankCensus of Agriculture 1992 1997
Crops 10,376
Livestock 40,254
Government Payments 2,176
Total 52,806
71
47
71
61
600
23,000
4,700
5,000
74
41
30
26
Hogs and Pigs (December 1, 2002)
Cattle (January 1, 2003)
Beef Cows (January 1, 2003)
Milk Cows (January 1, 2003)
Livestock Number RankCash Receipts - 2001 1/ Dollars 2/ Rank
WADENA
2000 Population
13,713
Number of Farms 759
Total Land in Farms, Acres 237,239
Average Farm Size, Acres 313
Total Cropland, Acres 219,426
Average Age of Farmers 49
709
235,351
332
213,468
50
Corn, Bu. 116,100
Soybeans, Bu. 96,200
All Wheat, Bu. *
Oats, Bu. *
All Hay, Tons 8,600
167.0
52.0
*
*
3.3
19,388,700
5,002,400
*
*
28,400
25
28
*
*
71
Crops - 2002
Acres
Harvested Yield Production RankCensus of Agriculture 1992 1997
Crops 50,166
Livestock 57,927
Government Payments 17,941
Total 126,034
33
33
34
34
140,000
12,500
1,200
2,500
16
62
79
43
Hogs and Pigs (December 1, 2002)
Cattle (January 1, 2003)
Beef Cows (January 1, 2003)
Milk Cows (January 1, 2003)
Livestock Number RankCash Receipts - 2001 1/ Dollars 2/ Rank
WASECA
2000 Population
19,526
Number of Farms 647
Total Land in Farms, Acres 100,774
Average Farm Size, Acres 156
Total Cropland, Acres 80,252
Average Age of Farmers 53
653
89,935
138
68,516
55
Corn, Bu. 21,900
Soybeans, Bu. 14,800
All Wheat, Bu. *
Oats, Bu. 1,300
All Hay, Tons 20,600
159.0
42.0
*
40.0
2.7
3,482,100
621,600
*
52,000
54,800
57
67
*
66
45
Crops - 2002
Acres
Harvested Yield Production RankCensus of Agriculture 1992 1997
Crops 50,074
Livestock 8,058
Government Payments 3,006
Total 61,138
34
74
67
60
1,000
7,500
1,800
1,200
72
77
64
65
Hogs and Pigs (December 1, 2002)
Cattle (January 1, 2003)
Beef Cows (January 1, 2003)
Milk Cows (January 1, 2003)
Livestock Number RankCash Receipts - 2001 1/ Dollars 2/ Rank
WASHINGTON
2000 Population
201,130
Number of Farms 663
Total Land in Farms, Acres 249,731
Average Farm Size, Acres 377
Total Cropland, Acres 233,285
Average Age of Farmers 49
576
255,994
444
237,082
50
Corn, Bu. 120,700
Soybeans, Bu. 113,100
All Wheat, Bu. *
Oats, Bu. *
All Hay, Tons 2,400
163.0
46.0
*
*
3.5
19,674,100
5,202,600
*
*
8,300
24
25
*
*
83
Crops - 2002
Acres
Harvested Yield Production RankCensus of Agriculture 1992 1997
Crops 50,988
Livestock 54,225
Government Payments 17,793
Total 123,006
32
37
35
38
118,000
8,500
800
900
19
74
84
72
Hogs and Pigs (December 1, 2002)
Cattle (January 1, 2003)
Beef Cows (January 1, 2003)
Milk Cows (January 1, 2003)
Livestock Number RankCash Receipts - 2001 1/ Dollars 2/ Rank
WATONWAN
2000 Population
11,876
* None or no estimates available.1/ Note: 2001 numbers were not available at time of publication. Source: Bureau of Economic Analysis, U.S. Department of Commerce, Washington, D.C., Internet Web Site (http://www.bea.doc.gov/bea/regional/reis/).2/ Cash receipts are reported in 1,000 dollars.
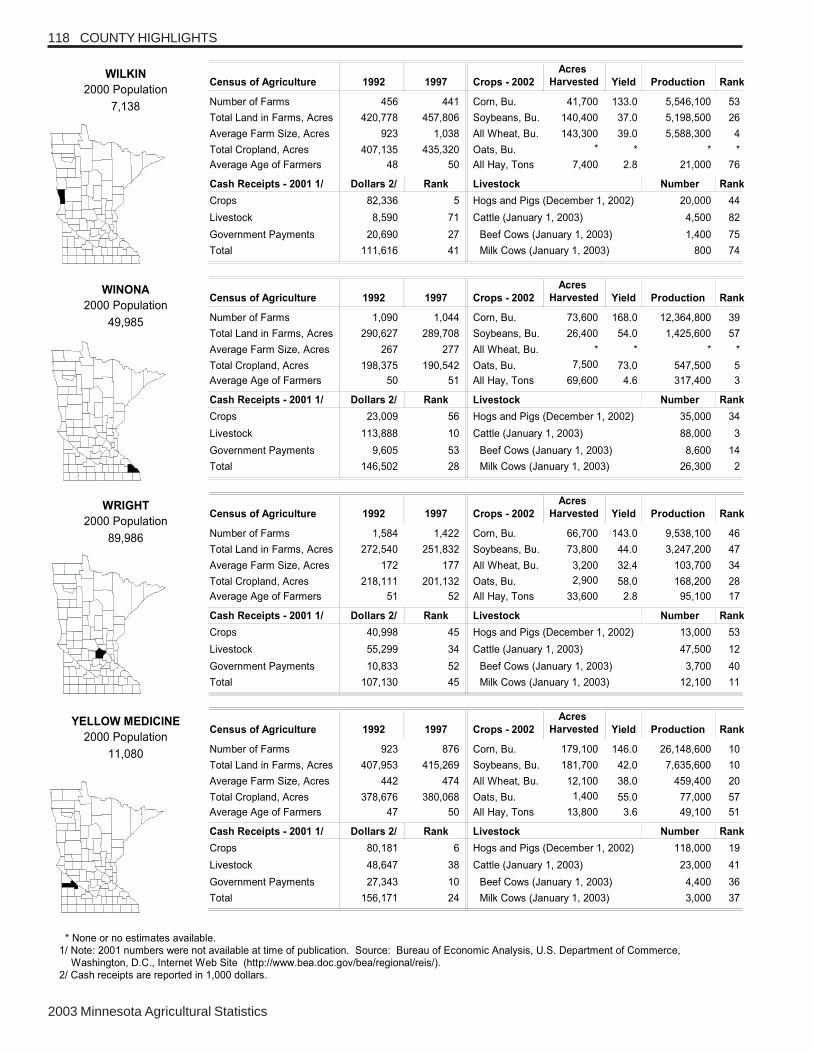
2003 Minnesota Agricultural Statistics
118 COUNTY HIGHLIGHTS
Number of Farms 456
Total Land in Farms, Acres 420,778
Average Farm Size, Acres 923
Total Cropland, Acres 407,135
Average Age of Farmers 48
441
457,806
1,038
435,320
50
Corn, Bu. 41,700
Soybeans, Bu. 140,400
All Wheat, Bu. 143,300
Oats, Bu. *
All Hay, Tons 7,400
133.0
37.0
39.0
*
2.8
5,546,100
5,198,500
5,588,300
*
21,000
53
26
4
*
76
Crops - 2002
Acres
Harvested Yield Production RankCensus of Agriculture 1992 1997
Crops 82,336
Livestock 8,590
Government Payments 20,690
Total 111,616
5
71
27
41
20,000
4,500
1,400
800
44
82
75
74
Hogs and Pigs (December 1, 2002)
Cattle (January 1, 2003)
Beef Cows (January 1, 2003)
Milk Cows (January 1, 2003)
Livestock Number RankCash Receipts - 2001 1/ Dollars 2/ Rank
WILKIN
2000 Population
7,138
Number of Farms 1,090
Total Land in Farms, Acres 290,627
Average Farm Size, Acres 267
Total Cropland, Acres 198,375
Average Age of Farmers 50
1,044
289,708
277
190,542
51
Corn, Bu. 73,600
Soybeans, Bu. 26,400
All Wheat, Bu. *
Oats, Bu. 7,500
All Hay, Tons 69,600
168.0
54.0
*
73.0
4.6
12,364,800
1,425,600
*
547,500
317,400
39
57
*
5
3
Crops - 2002
Acres
Harvested Yield Production RankCensus of Agriculture 1992 1997
Crops 23,009
Livestock 113,888
Government Payments 9,605
Total 146,502
56
10
53
28
35,000
88,000
8,600
26,300
34
3
14
2
Hogs and Pigs (December 1, 2002)
Cattle (January 1, 2003)
Beef Cows (January 1, 2003)
Milk Cows (January 1, 2003)
Livestock Number RankCash Receipts - 2001 1/ Dollars 2/ Rank
WINONA
2000 Population
49,985
Number of Farms 1,584
Total Land in Farms, Acres 272,540
Average Farm Size, Acres 172
Total Cropland, Acres 218,111
Average Age of Farmers 51
1,422
251,832
177
201,132
52
Corn, Bu. 66,700
Soybeans, Bu. 73,800
All Wheat, Bu. 3,200
Oats, Bu. 2,900
All Hay, Tons 33,600
143.0
44.0
32.4
58.0
2.8
9,538,100
3,247,200
103,700
168,200
95,100
46
47
34
28
17
Crops - 2002
Acres
Harvested Yield Production RankCensus of Agriculture 1992 1997
Crops 40,998
Livestock 55,299
Government Payments 10,833
Total 107,130
45
34
52
45
13,000
47,500
3,700
12,100
53
12
40
11
Hogs and Pigs (December 1, 2002)
Cattle (January 1, 2003)
Beef Cows (January 1, 2003)
Milk Cows (January 1, 2003)
Livestock Number RankCash Receipts - 2001 1/ Dollars 2/ Rank
WRIGHT
2000 Population
89,986
Number of Farms 923
Total Land in Farms, Acres 407,953
Average Farm Size, Acres 442
Total Cropland, Acres 378,676
Average Age of Farmers 47
876
415,269
474
380,068
50
Corn, Bu. 179,100
Soybeans, Bu. 181,700
All Wheat, Bu. 12,100
Oats, Bu. 1,400
All Hay, Tons 13,800
146.0
42.0
38.0
55.0
3.6
26,148,600
7,635,600
459,400
77,000
49,100
10
10
20
57
51
Crops - 2002
Acres
Harvested Yield Production RankCensus of Agriculture 1992 1997
Crops 80,181
Livestock 48,647
Government Payments 27,343
Total 156,171
6
38
10
24
118,000
23,000
4,400
3,000
19
41
36
37
Hogs and Pigs (December 1, 2002)
Cattle (January 1, 2003)
Beef Cows (January 1, 2003)
Milk Cows (January 1, 2003)
Livestock Number RankCash Receipts - 2001 1/ Dollars 2/ Rank
YELLOW MEDICINE
2000 Population
11,080
* None or no estimates available.1/ Note: 2001 numbers were not available at time of publication. Source: Bureau of Economic Analysis, U.S. Department of Commerce, Washington, D.C., Internet Web Site (http://www.bea.doc.gov/bea/regional/reis/).2/ Cash receipts are reported in 1,000 dollars.
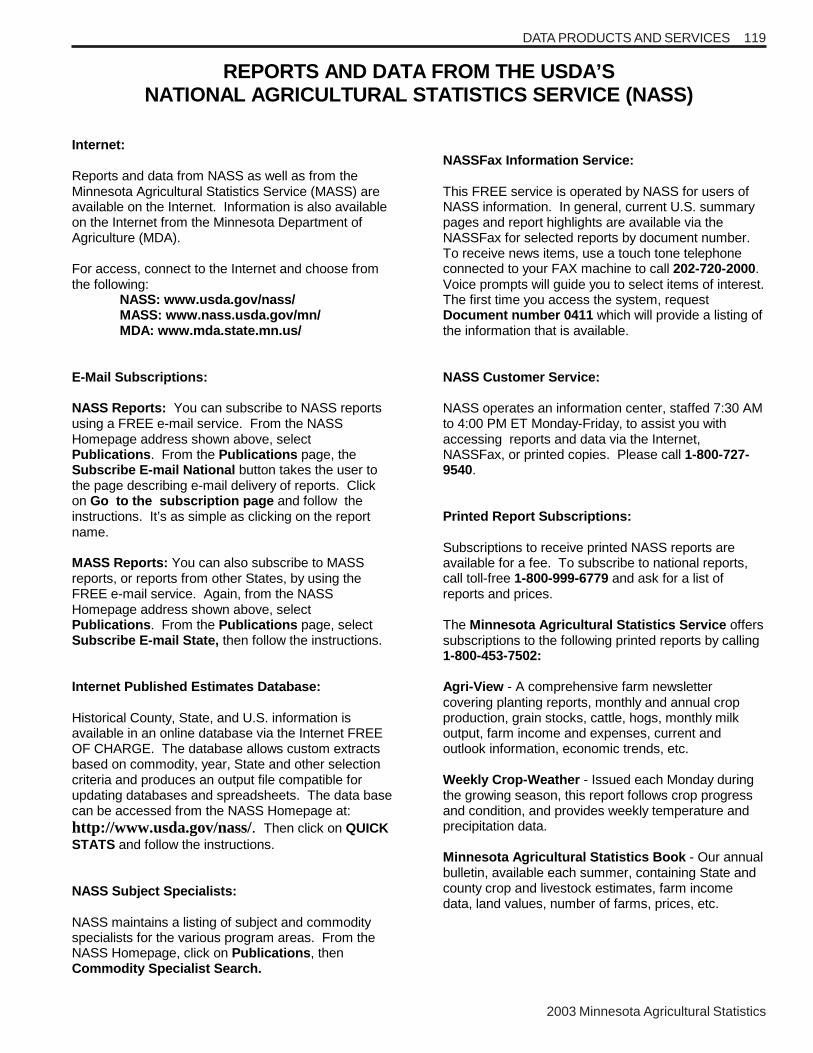
2003 Minnesota Agricultural Statistics
119DATA PRODUCTS AND SERVICES
REPORTS AND DATA FROM THE USDA’S NATIONAL AGRICULTURAL STATISTICS SERVICE (NASS)
Internet: Reports and data from NASS as well as from the Minnesota Agricultural Statistics Service (MASS) are available on the Internet. Information is also available on the Internet from the Minnesota Department of Agriculture (MDA). For access, connect to the Internet and choose from the following: NASS: www.usda.gov/nass/ MASS: www.nass.usda.gov/mn/ MDA: www.mda.state.mn.us/ E-Mail Subscriptions: NASS Reports: You can subscribe to NASS reports using a FREE e-mail service. From the NASS Homepage address shown above, select Publications. From the Publications page, the Subscribe E-mail National button takes the user to the page describing e-mail delivery of reports. Click on Go to the subscription page and follow the instructions. It’s as simple as clicking on the report name. MASS Reports: You can also subscribe to MASS reports, or reports from other States, by using the FREE e-mail service. Again, from the NASS Homepage address shown above, select Publications. From the Publications page, select Subscribe E-mail State, then follow the instructions. Internet Published Estimates Database: Historical County, State, and U.S. information is available in an online database via the Internet FREE OF CHARGE. The database allows custom extracts based on commodity, year, State and other selection criteria and produces an output file compatible for updating databases and spreadsheets. The data base can be accessed from the NASS Homepage at: http://www.usda.gov/nass/. Then click on QUICK STATS and follow the instructions. NASS Subject Specialists: NASS maintains a listing of subject and commodity specialists for the various program areas. From the NASS Homepage, click on Publications, then Commodity Specialist Search.
NASSFax Information Service: This FREE service is operated by NASS for users of NASS information. In general, current U.S. summary pages and report highlights are available via the NASSFax for selected reports by document number. To receive news items, use a touch tone telephone connected to your FAX machine to call 202-720-2000. Voice prompts will guide you to select items of interest. The first time you access the system, request Document number 0411 which will provide a listing of the information that is available. NASS Customer Service: NASS operates an information center, staffed 7:30 AM to 4:00 PM ET Monday-Friday, to assist you with accessing reports and data via the Internet, NASSFax, or printed copies. Please call 1-800-727-9540. Printed Report Subscriptions: Subscriptions to receive printed NASS reports are available for a fee. To subscribe to national reports, call toll-free 1-800-999-6779 and ask for a list of reports and prices. The Minnesota Agricultural Statistics Service offers subscriptions to the following printed reports by calling 1-800-453-7502: Agri-View - A comprehensive farm newsletter covering planting reports, monthly and annual crop production, grain stocks, cattle, hogs, monthly milk output, farm income and expenses, current and outlook information, economic trends, etc. Weekly Crop-Weather - Issued each Monday during the growing season, this report follows crop progress and condition, and provides weekly temperature and precipitation data. Minnesota Agricultural Statistics Book - Our annual bulletin, available each summer, containing State and county crop and livestock estimates, farm income data, land values, number of farms, prices, etc.
2003 Minnesota Agricultural Statistics
120 INDEX
Agricultural Chemical Usage ........................................................... 31-33 Apples ................................................................................................14, 27 Assets, Farm ............................................................................................15 Barley: Acreage, Yield, Production ...................................................21, 23, 50 Cash Receipts ................................................................................ 14 Cost of Production .............................................................................8 County Estimates..............................................................................50 Marketings .......................................................................................60 Planting & Harvesting Dates.............................................................19 Prices .........................................................................................23, 92 Record Highs ....................................................................................22 Stocks ...............................................................................................59 Value ...............................................................................................23 Varieties ...........................................................................................51 Beans, Dry Edible: Acreage, Yield, Production ........................................................26, 54 Dry Beans By Types ........................................................................26 Cash Receipts .................................................................................14 County Estimates .............................................................................54 Marketings .......................................................................................60 Prices .........................................................................................26, 91 Record Highs ...................................................................................22 Value ...............................................................................................26 Bees, Honey .............................................................................................90 Butter ………......................................................................................82, 83 Canola: Acreage, Yield, Production ..................................................21, 25, 43 County Estimates .............................................................................43 Prices ...............................................................................................25 Value ................................................................................................25 Carrots ………...........................................................................................27 Cash Receipts: County Totals ........................................................................... 97-118 Farm Income ....................................................................................13 Individual Commodities ...................................................................14 Cattle & Calves: Calf Crop ....................................................................................67, 71 Cash Receipts ...........................................................................14, 71 County Estimates: All Cattle & Calves ................................................................ 72-73 Cattle and Calves on Feed ................................................... 72-73 Farms With Cattle & Calves: ...........................................................67 Geographical Distribution .................................................................65 Marketings .......................................................................................71 On Farms ........................................................... 67, 68, 70, 71, 72-73 On Feed ......................................................................... 67, 70, 72-73 Prices .........................................................................................71, 93 Record Highs ...................................................................................69 Slaughter ....................................................................................71, 81 Value … ......................................................................................70, 71 Cheese …… ......................................................................................82, 83 Chickens: Broiler .........................................................................................87, 88 Cash Receipts .................................................................................14 Egg Production .....................................................................87, 88, 89 Hatchery Production ..................................................................88, 89 Number ................................................................................70, 87, 88 Record Highs ...................................................................................69 Value .........................................................................................87, 88 Climate Summary ....................................................................................16 Corn: Acreage, Yield, Production ............................................ 21, 23, 34-37 Cash Receipts .................................................................................14 Chemical Usage ..............................................................................31 Cost of Production .............................................................................7 County Estimates: Corn for Grain ....................................................................... 34-35 Corn for Silage ...................................................................... 36-37 Geographical Distribution ................................................................63 Marketings .......................................................................................60 Objective Yield Data ........................................................................29 Planting & Harvesting Dates ...................................................... 19-20 Prices .........................................................................................23, 91 Record Highs ...................................................................................22 Stocks ..............................................................................................59 Value ...............................................................................................23 (See Also Sweet Corn & Silage, Corn) Cost of Production .............................................................................. 7-12 County Highlights ........................................................................... 97-118 Cows (See Also Dairy, Cattle): County Estimates: Beef Cows ............................................................................. 74-75 Milk Cows .............................................................................. 74-75
Annual Average Milk Cows on Farms ........................................84-85 Cow-Calf Cost of Production ........................................................... 11 Farms with Cows ....................................................................... 67, 68 Geographical Distribution-Milk Cows .............................................. 66 Number ....................................................67, 70, 74-75, 83, 84-85, 86 Prices ....................................................................................... 93, 95 Record Highs .................................................................................. 69 Crops (See Specific Commodity) Crop Summary ........................................................................................ 21 Cropland Cash Rent ................................................................................. 6 Dairy: Cash Receipts ................................................................................. 14 Farms by Type A & B ...................................................................... 86 Income ............................................................................................. 82 Manufactured Products ................................................................... 82 Prices .............................................................................................. 95 (See Also Individual Commodities) Data Products and Services ................................................................ 119 Debt, Farm .............................................................................................. 15 Eggs: Cash Receipts ................................................................................. 14 District Estimates ............................................................................ 88 Prices ........................................................................................ 87, 96 Production ........................................................................... 87, 88, 89 Value ........................................................................................ 87, 88 Electronic Information ......................................................................... 119 Equity, Farm ............................................................................................ 15 Expenses, Farm Production .................................................................. 13 Exports ...................................................................................................... 5 Farm Balance Sheet . .............................................................................. 15 Farm Income ........................................................................................... 13 Farm Labor .............................................................................................. 62 Farms: Number, Land In Farms, Average Size ............................................ 4 Number and Land in Farms by Sales Class ..................................... 4 Livestock ......................................................................................... 67 Grade A & B Dairy Farms ............................................................... 86 Fertilizer Usage ....................................................................................... 61 Flaxseed: Acreage, Yield, Production ....................................................... 24, 56 County Estimates ............................................................................ 56 Prices .............................................................................................. 24 Value .............................................................................................. 24 Floriculture ........................................................................................ 14, 30 Foreward ................................................................................................ 1 Frost Dates .............................................................................................. 17 Geographical Distribution Maps ......................................................63-66 Government Payments .............................................................13, 97-118 Grains: Marketings By Months .................................................................... 60 Stocks .............................................................................................. 59 (See Also Specific Commodities) Storage Capacity ............................................................................. 28 Greenhouse & Nursery ......................................................................... 30 Harvesting Dates ...............................................................................19-20 Hay: Acreage, Yield, Production ............................................21, 25, 46-49 Cash Receipts ................................................................................. 14 County Estimates: All Hay ...................................................................................46-47 Alfalfa .....................................................................................48-49 Geographical Distribution ................................................................ 64 Harvesting Dates ............................................................................. 19 Prices ........................................................................................ 25, 92 Record Highs .................................................................................. 22 Stocks .............................................................................................. 59 Value .............................................................................................. 25 Hogs: Cash Receipts ........................................................................... 14, 77 Cost of Production ........................................................................... 10 County Estimates: All Hogs .................................................................................78-79 Annual Farrowings ................................................................78-79 Annual Pig Crop ....................................................................78-79 Farms With Hogs ............................................................................ 67 Farrowings .................................................................................76-79 Geographical Distribution ................................................................ 65 Marketings ..................................................................................76-77 Number .....................................................................67, 68, 70, 76-79 Pig Crop .........................................................................67, 70, 76-79 Prices ........................................................................................ 77, 94 Record Highs .................................................................................. 69 Slaughter ......................................................................................... 81 Value .... ..................................................................................... 70, 77 Honey ………..................................................................................... 14, 90

2003 Minnesota Agricultural Statistics
121INDEX
Ice Cream … ............................................................................................82 Internet Sites .........................................................................................119 Income, Farm: Cash Receipts ........................................................................... 13-14 Income Per Farm .............................................................................13 (See Also Specific Commodities) Land, Farm Value .................................................................................. 5-6 Land, Cash Rent ........................................................................................6 Labor, Farm .............................................................................................62 Land In Farms ............................................................................................4 Livestock (See Specific Kinds) Livestock Operations by Size Group ....................................................68 Livestock Summary ................................................................................67 Milk: Cash Receipts ..................................................................................82 Cost of Production ...........................................................................12 County Estimates: Annual Average Production Per Cow ................................... 84-85 Total Production .................................................................... 84-85 Grade A & B Farms by County ........................................................86 Income .............................................................................................82 Milkfat 83 Prices ...............................................................................................95 Production ...................................................................... 82, 83, 84-85 Products by Size Groups..................................................................82 Products Manufactured ...................................................................82 Record Highs ...................................................................................69 Mink …. …….. ............................................................................................90 Oats: Acreage, Yield, Production ............................................ 21, 23, 44-45 Cash Receipts .................................................................................14 Cost of Production .............................................................................9 County Estimates ....................................................................... 44-45 Marketings .......................................................................................60 Planting & Harvesting Dates ............................................................19 Prices .........................................................................................23, 92 Record Highs ...................................................................................22 Stocks ..............................................................................................59 Value ...............................................................................................23 Objective Yield Data ...............................................................................29 Onions ……..............................................................................................27 Peas, Green For Processing ......................................................14, 27, 58 Planting Dates ................................................................................... 19-20 Potatoes: Acreage, Yield, Production ........................................................28, 52 Cash Receipts .................................................................................14 County Estimates ........................................................................52 Planting & Harvesting Dates ............................................................19 Prices ...................................................................................28, 52, 91 Record Highs ...................................................................................22 Stocks ..............................................................................................28 Value ...............................................................................................28 Poultry Summary ....................................................................................87 Precipitation ......................................................................................16, 18 Prices: Crop Records ...................................................................................22 Received By Farmers ................................................................ 91-96 (See Also Specific Commodity) Production Expenses .............................................................................13 Rankings, Counties ..................................................................................3 Rankings, States .......................................................................................2 Record Highs: Crop Production ............................................................22 Record Highs: Livestock Production ....................................................69 Rice, Wild ...............................................................................................61 Rye: Acreage, Yield, Production ..............................................................23 Cash Receipts .................................................................................14 Planting & Harvesting Dates ............................................................19 Prices ...............................................................................................23 Value ...............................................................................................23 Sheep & Lambs: Cash Receipts .................................................................................14 County Estimates ....................................................................... 72-73 Farms With Sheep ...........................................................................67 Geographical Distribution ................................................................66 Lamb Crop .................................................................................70, 80 Marketings .......................................................................................80 Number ................................................................... 67, 70, 72-73, 80 Numbers Shorn For Wool ................................................................80 Prices ...............................................................................................94 Record Highs ...................................................................................69 Value .........................................................................................70, 80 Silage, Corn ................................................................................. 23, 36-37 Soybeans: Acreage, Yield, Production ............................................ 21, 23, 38-39
Cash Receipts ................................................................................. 14 Chemical Usage .............................................................................. 32 Cost of Production ............................................................................. 7 County Estimates .......................................................................38-39 Geographical Distribution ................................................................ 63 Marketings ....................................................................................... 60 Objective Yield Data ....................................................................... 29 Planting & Harvesting Dates ......................................................19-20 Prices ........................................................................................ 23, 91 Record Highs .................................................................................. 22 Stocks .............................................................................................. 59 Value .............................................................................................. 23 Sugarbeets: Acreage Yield, Production .................................................. 21, 24, 53 Cash Receipts ................................................................................. 14 Cost of Production ............................................................................. 9 County Estimates ............................................................................ 53 Planting & Harvesting Dates ........................................................... 19 Prices .............................................................................................. 24 Record Highs .................................................................................. 22 Value .............................................................................................. 24 Sunflowers: Acreage, Yield, Production ..................................................25, 55-56 Cash Receipts ................................................................................. 14 County Estimates: All Sunflowers ............................................................................. 55 Oil Sunflowers ............................................................................ 56 Planting & Harvesting Dates ........................................................... 19 Prices ........................................................................................ 25, 91 Record Highs .................................................................................. 22 Value .............................................................................................. 25 Sweet Corn for Processing ....................................................... 14, 27, 57 Temperature ............................................................................................ 16 Turkeys: Cash Receipts ................................................................................. 14 Hatchery Production ................................................................. 87, 89 Numbers .................................................................................... 87, 88 Prices ........................................................................................ 87, 96 Record Highs .................................................................................. 69 Value ...………………………………………………………………87, 88 Value of Land & Buildings ....................................................................... 5 Wage Rates, Farm .................................................................................. 62 Weather Summary .............................................................................16-18 Wheat: Acreage, Yield, Production ............................................21, 24, 40-43 Cash Receipts ................................................................................. 14 Chemical Usage .............................................................................. 33 Cost of Production ............................................................................. 8 County Estimates: All Wheat ...............................................................................40-41 Spring Wheat .........................................................................42-43 Geographical Distribution ................................................................ 64 Marketings ....................................................................................... 60 Objective Yield Data ....................................................................... 29 Planting & Harvesting Dates ......................................................19-20 Prices ........................................................................................ 24, 92 Record Highs .................................................................................. 22 Stocks .............................................................................................. 59 Value .. ............................................................................................. 24 Wild Rice………………. ........................................................................... 61 Wool ………………. .................................................................................. 80