minnesota department of health weekly covid-19 reportminnesota department of health weekly covid- 19...
TRANSCRIPT

Minnesota Department of Health Weekly COVID-19 Report: Updated 5/28/2020 with data current as of 4 p.m. the previous day. 1
Minnesota Department of Health
Minnesota Department of Health | health.mn.gov
This MDH Weekly COVID-19 Report presents data in an easy to interpret way and enhances the information provided in the daily Situation Update for COVID-19 web page with trends and situational insights as well as trends over time.
WEEKLYCOVID-19 REPORT
5/28/2020
▪ Minnesota Situation Update for Coronavirus Disease 2019 (COVID-19) (https://www.health.state.mn.us/diseases/coronavirus/situation.html)Updated daily at 11 a.m.
▪ Coronavirus Disease 2019 (COVID-19) Cases in the U.S (https://www.cdc.gov/coronavirus/2019-ncov/cases-updates/cases-in-us.html) ▪ Neighboring states’ COVID-19 information:
▪ Wisconsin: Outbreaks in Wisconsin (https://www.dhs.wisconsin.gov/outbreaks/index.htm)▪ Iowa: Novel Coronavirus (COVID-19) (https://idph.iowa.gov/Emerging-Health-Issues/Novel-Coronavirus)▪ North Dakota: Coronavirus Cases (https://www.health.nd.gov/diseases-conditions/coronavirus/north-dakota-coronavirus-cases)▪ South Dakota: Novel Coronavirus Updates and Information (https://doh.sd.gov/news/Coronavirus.aspx)

Minnesota Department of Health Weekly COVID-19 Report: Updated 5/28/2020 with data current as of 4 p.m. the previous day. 2
About Minnesota COVID-19 Data
▪ Many people with COVID-19 are not tested, so the laboratory-confirmed cases in this report represent only a fraction of the total number of people in Minnesota who have had COVID-19. Data is for cases that were tested and returned positive.
▪ All data is preliminary and may change as cases are investigated.
▪ Many data points are collected during case interviews. Data presented below is for all cases, regardless of interview status. Data for cases pending interview may be listed as “unknown/missing”.
▪ Numbers listed as cumulative total are cumulative since Jan. 20, 2020.
Minnesota Department of Health | health.mn.gov
Minnesota Department of Health Weekly COVID-19 Report: Updated 5/28/2020 with data current as of 4 p.m. the previous day. 3
Date (Thursday-Thursday) Total positive (cumulative) by date specimen collected Total Hospitalized (cumulative) by date reported by MDH Deaths (cumulative) by date reported by MDH
3/5 1
3/6 1
3/7 2
3/8 2
3/9 5
3/10 11
3/11 21
3/12 43
3/13 62
3/14 87
3/15 125
3/16 175
3/17 242
3/18 265
3/19 283 7
3/20 299 7
3/21 323 12 1
3/22 345 12 1
3/23 389 21 1
3/24 440 21 1
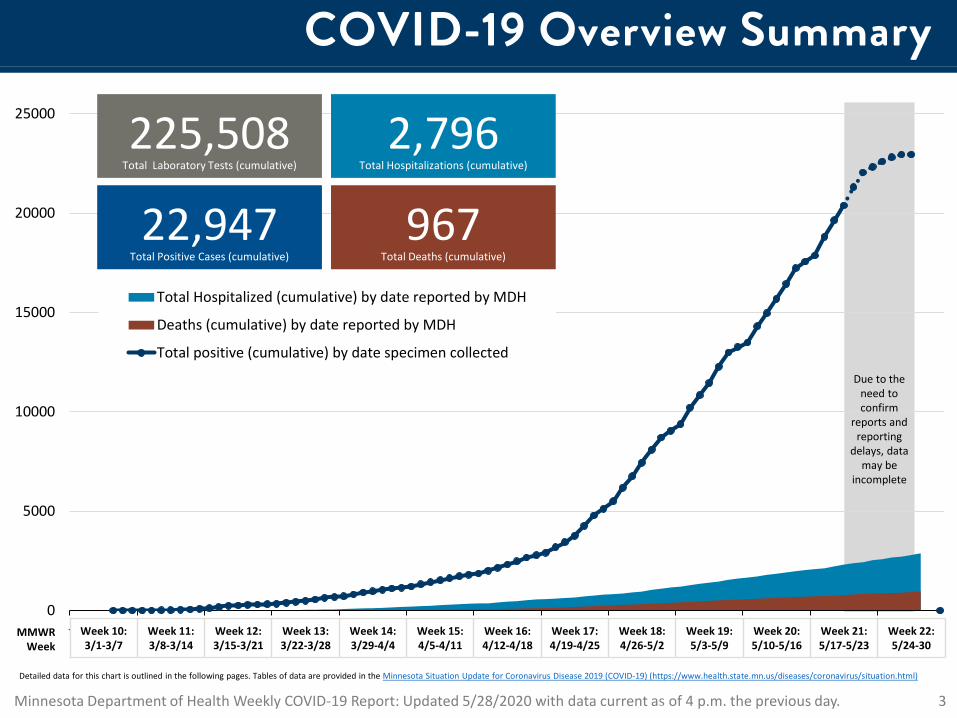
COVID-19 Overview Summary
Detailed data for this chart is outlined in the following pages. Tables of data are provided in the Minnesota Situation Update for Coronavirus Disease 2019 (COVID-19) (https://www.health.state.mn.us/diseases/coronavirus/situation.html)
0
5000
10000
15000
20000
25000
3/1
3/8
3/15
3/22
3/29 4/
5
4/12
4/19
4/26 5/
3
5/10
5/17
5/24
Total Hospitalized (cumulative) by date reported by MDH
Deaths (cumulative) by date reported by MDH
Total positive (cumulative) by date specimen collected
Due to the need to confirm
reports and reporting
delays, data may be
incomplete
22,947Total Positive Cases (cumulative)
2,796Total Hospitalizations (cumulative)
967Total Deaths (cumulative)
225,508Total Laboratory Tests (cumulative)
Week 10:3/1-3/7
Week 11:3/8-3/14
Week 12:3/15-3/21
Week 13:3/22-3/28
Week 14:3/29-4/4
Week 15:4/5-4/11
Week 16:4/12-4/18
Week 17:4/19-4/25
Week 18:4/26-5/2
Week 19:5/3-5/9
Week 20:5/10-5/16
Week 21:5/17-5/23
Week 22:5/24-30
MMWRWeek
Minnesota Department of Health Weekly COVID-19 Report: Updated 5/28/2020 with data current as of 4 p.m. the previous day. 4
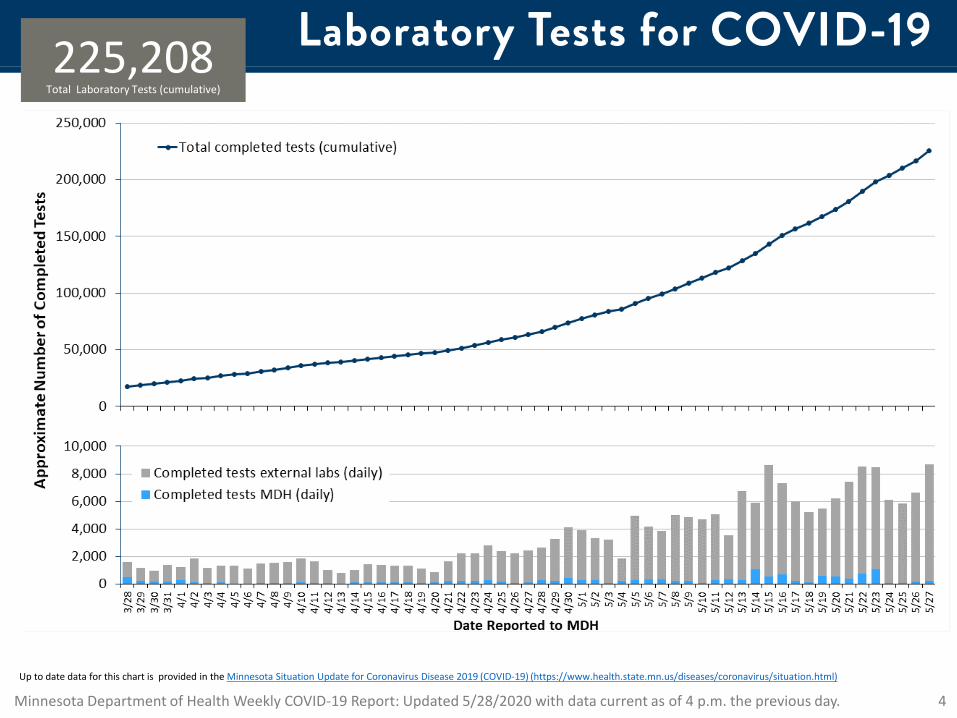
Laboratory Tests for COVID-19
Up to date data for this chart is provided in the Minnesota Situation Update for Coronavirus Disease 2019 (COVID-19) (https://www.health.state.mn.us/diseases/coronavirus/situation.html)
225,208Total Laboratory Tests (cumulative)

Minnesota Department of Health Weekly COVID-19 Report: Updated 5/28/2020 with data current as of 4 p.m. the previous day. 5
Positive COVID-19 Cases22,947Total Positive Cases (cumulative)
Up to date data for this chart is provided in the Minnesota Situation Update for Coronavirus Disease 2019 (COVID-19) (https://www.health.state.mn.us/diseases/coronavirus/situation.html)
Minnesota Department of Health Weekly COVID-19 Report: Updated 5/28/2020 with data current as of 4 p.m. the previous day. 6
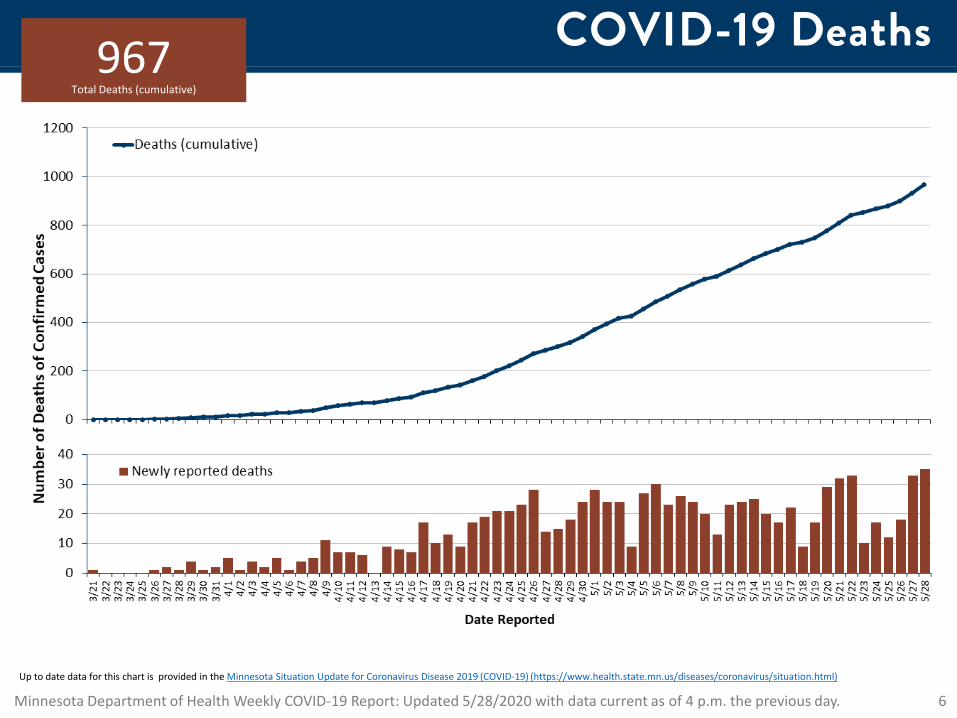
COVID-19 Deaths967Total Deaths (cumulative)
Up to date data for this chart is provided in the Minnesota Situation Update for Coronavirus Disease 2019 (COVID-19) (https://www.health.state.mn.us/diseases/coronavirus/situation.html)

Minnesota Department of Health Weekly COVID-19 Report: Updated 5/28/2020 with data current as of 4 p.m. the previous day. 7
Hospitalizations for COVID-192,880Total Hospitalizations(cumulative)
Up to date data for this chart is provided in the Minnesota Situation Update for Coronavirus Disease 2019 (COVID-19) (https://www.health.state.mn.us/diseases/coronavirus/situation.html)

Minnesota Department of Health Weekly COVID-19 Report: Updated 5/28/2020 with data current as of 4 p.m. the previous day. 8
Demographics: Age
0 - 5years
6 - 19years
20-29years
30-39years
40-49years
50-59years
60-69years
70-79years
80-89years
90-99years
100+years
Unknown/
missingAll cases 2% 7% 18% 20% 16% 15% 9% 5% 5% 3% 0% 0%Hospitalized cases 0% 1% 6% 9% 11% 19% 19% 16% 13% 4% 0% 0%Deaths 0% 0% 0% 1% 1% 5% 11% 20% 34% 26% 2% 0%
2%
7%
18% 20
%
16%
15%
9%
5% 5%
3%
<1%
<1%<1
% 1%
6%
9%
11%
19% 19
%
16%
13%
4%
<1%
<1%
0% 0% 0% 1% 1%
5%
11%
20%
34%
26%
2%
0%
0%
5%
10%
15%
20%
25%
30%
35%
40%Pe
rcen
t of C
ases
, Hos
pita
lizat
ions
, or D
eath
s
0-5 years
6-19 years
20-29 years
30-39 years
40-49 years
50-59 years
60-69 years
70-79years
80-89 years
90-99years
100+ years
Unk/ missing
397 1,536 4,212 4,580 3,660 3,335 2,103 1,243 1,171 662 38 10
14 39 176 273 326 540 554 454 368 128 7 1
0 0 0 6 10 47 110 195 331 248 20 0
Median Age (Range)
All cases 41.7 (<1 month - 109.2)
Non-hospitalized cases 41.3 (<1 month - 109.2)
Hospitalized cases 61.2 (<1 month - 105.0)
Cases hospitalized in ICU 61.6 (<1 month - 99.3)
Deaths 83.6 (30.6 - 109.2)

Minnesota Department of Health Weekly COVID-19 Report: Updated 5/28/2020 with data current as of 4 p.m. the previous day. 9
Demographics: Gender
Male Female Other Unknown/ missingAll cases 48% 50% 0% 2%Hospitalized cases 51% 48% 0% 1%Deaths 51% 48% 0% 1%
48%50%
<1%2%
51%
48%
0%1%
51%
48%
0%1%
0%
10%
20%
30%
40%
50%
60%Pe
rcen
t of C
ases
Male Female Other Unknown/ missing11,051 11,433 8 455
1,472 1,376 0 32
492 465 0 10
Minnesota Department of Health Weekly COVID-19 Report: Updated 5/28/2020 with data current as of 4 p.m. the previous day. 10
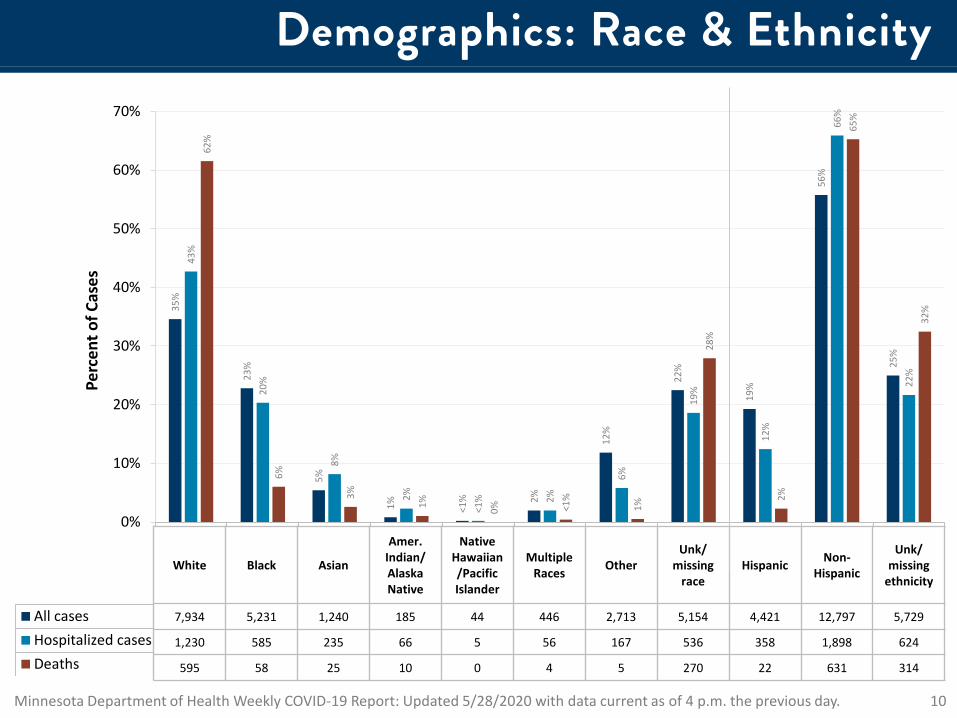
Demographics: Race & Ethnicity
White Black AsianAmericanIndian/Alaska Native
NativeHawaiian/
PacificIslander
MultipleRaces Other
Unknown/missing
raceHispanic Non-
hispanic
Unknown/ missingethnicity
All cases 35% 23% 5% 1% 0% 2% 12% 22% 19% 56% 25%Hospitalized cases 43% 20% 8% 2% 0% 2% 6% 19% 12% 66% 22%Deaths 62% 6% 3% 1% 0% 0% 1% 28% 2% 65% 32%
35%
23%
5%
1% <1% 2%
12%
22%
19%
56%
25%
43%
20%
8%
2%
<1% 2%
6%
19%
12%
66%
22%
62%
6%
3%
1% 0% <1%
1%
28%
2%
65%
32%
0%
10%
20%
30%
40%
50%
60%
70%Pe
rcen
t of C
ases
White Black Asian
Amer. Indian/ AlaskaNative
Native Hawaiian/Pacific Islander
Multiple Races Other
Unk/ missing
raceHispanic Non-
Hispanic
Unk/ missing
ethnicity
7,934 5,231 1,240 185 44 446 2,713 5,154 4,421 12,797 5,729
1,230 585 235 66 5 56 167 536 358 1,898 624
595 58 25 10 0 4 5 270 22 631 314

Minnesota Department of Health Weekly COVID-19 Report: Updated 5/28/2020 with data current as of 4 p.m. the previous day. 11
Race & Ethnicity by PopulationCumulative case rate is the number of cases by race or ethnicity per 100,000 people in Minnesota.
Race/Ethnicity Minnesota Population (2018) Percent of Population Cumulative Case Rate White 4,629,375 83% 156.6Black 367,653 7% 1323.3Asian 273,126 5% 396.2American Indian or Alaska Native 60,983 1% 254.2Native Hawaiian or Pacific Islander 2,396 <1% 1335.6Multiple races 174,832 3% 230.5Hispanic 308,013 5% 1247.7Non-Hispanic 5,303,166 95% 221.9
156.6
1323.3
396.2
254.2
1335.6
230.5
1247.7
221.9
0.0
200.0
400.0
600.0
800.0
1000.0
1200.0
1400.0
1600.0
White Black Asian American Indianor Alaska Native
Native Hawaiianor Pacific Isander
Multiple races Hispanic Non-Hispanic
Cum
ulat
ive
Case
Rat
e
Minnesota Department of Health Weekly COVID-19 Report: Updated 5/28/2020 with data current as of 4 p.m. the previous day. 12
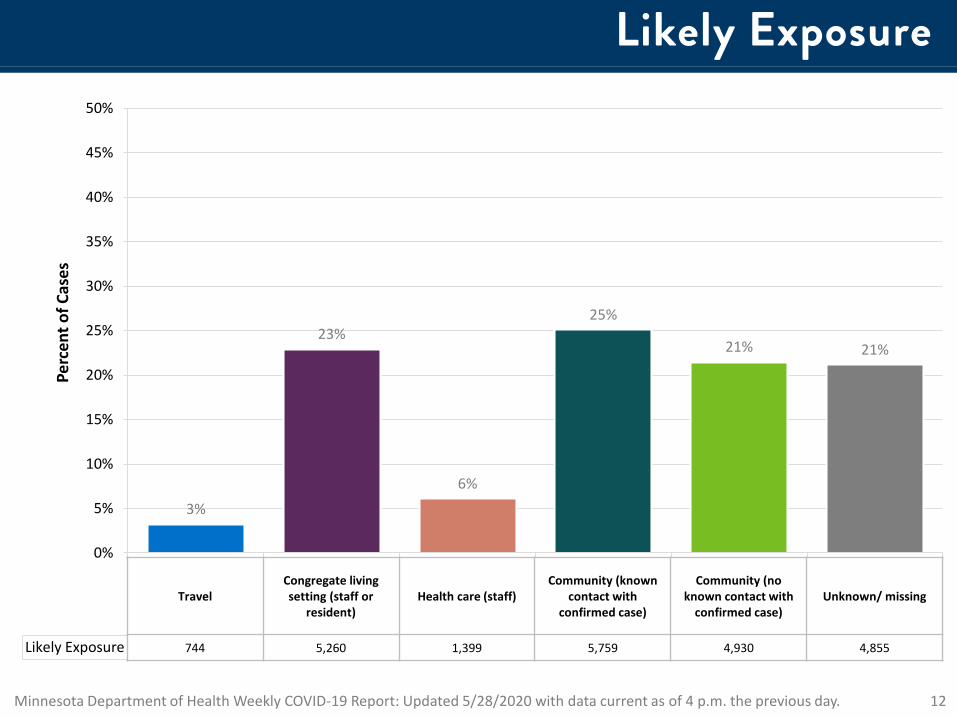
Likely Exposure
TravelCongregate living
setting (staff,resident)
Health care (staff)
Community(known contactwith confirmed
case)
Community (noknown contactwith confirmed
case)
Unknown/missing
Likely Exposure 3% 23% 6% 25% 21% 21%
3%
23%
6%
25%
21% 21%
0%
5%
10%
15%
20%
25%
30%
35%
40%
45%
50%
Perc
ent o
f Cas
es
TravelCongregate living setting (staff or
resident)Health care (staff)
Community (known contact with
confirmed case)
Community (no known contact with
confirmed case)Unknown/ missing
744 5,260 1,399 5,759 4,930 4,855

Minnesota Department of Health Weekly COVID-19 Report: Updated 5/28/2020 with data current as of 4 p.m. the previous day. 13
Specimen collection date Travel Congregate Living Setting (staff or resident) Health Care (staff) Community (known contact with confirmed case) Community (no known contact with confirmed case)
3/1
3/2
3/3
3/4
3/5 1
3/6
3/7 1
3/8
3/9 3
3/10 6
3/11 6 1 3
3/12 19 1 2
3/13 15 4
3/14 24 1
3/15 30 3 2 3
3/16 35 4 4 7
3/17 44 1 4 6 12
3/18 11 2 5 1 4
3/19 11 1 1 5
3/20 9 4 3
3/21 10 2 6 6
3/22 8 4 3 6 1
3/23 19 5 10 5 4
3/24 23 7 11 5 5
3/25 21 14 12 3 8
3/26 19 15 10 5 13
3/27 21 12 21 9 11
3/28 9 8 9 3 18
3/29 9 8 6 3 11
3/30 19 24 32 11 12
3/31 13 32 16 11 19
4/1 10 11 9 5 21
4/2 10 27 14 13 17
4/3 5 28 6 8 14
4/4 2 17 9 4 7
4/5 6 32 3 7 11
4/6 5 66 13 14 14
4/7 8 53 13 6 20
4/8 2 63 12 10 14
4/9 2 52 13 16 16
4/10 61 8 10 14
4/11 1 56 3 7 6
4/12 2 37 5 5 5
4/13 94 18 11 18
4/14 10 82 14 17 23
4/15 7 82 10 31 19
4/16 8 71 17 46 16
4/17 9 87 14 38 24
4/18 2 43 5 49 13
4/19 1 51 4 55 11
4/20 8 118 18 93 24
4/21 4 107 10 90 27
4/22 3 122 24 96 30
4/23 7 143 25 228 46
4/24 6 110 31 234 57
4/25 6 59 12 131 46
4/26 5 71 14 115 43
4/27 9 140 50 197 158
4/28 10 158 27 163 113
4/29 9 133 33 168 130
4/30 7 151 30 161 119
5/1 10 130 20 180 139
5/2 5 52 14 86 68
5/3 5 55 19 85 82
5/4 10 157 50 229 202
5/5 6 135 28 149 170
5/6 11 120 35 163 163
5/7 11 170 39 188 184
5/8 11 151 37 191 202
5/9 4 64 21 64 77
5/10 1 45 20 39 63
5/11 8 168 51 219 229
5/12 6 153 31 173 170
5/13 9 164 37 184 184
5/14 6 218 36 178 217
5/15 7 176 58 221 201
5/16 6 58 27 98 88
5/17 3 67 17 61 86
5/18 22 129 62 257 291
5/19 14 154 36 194 216
5/20 11 106 44 158 210
5/21 10 161 40 267 205
5/22 9 79 39 201 163
5/23 5 38 11 40 51
5/24 3 25 5 19 40
5/25 1 17 1 8 12
5/26 2 1
5/27
5/28
5/29
5/30
Number Cases by Likely Exposure and Date
0
100
200
300
400
500
600
700
800
3/1
3/8
3/15
3/22
3/29 4/
5
4/12
4/19
4/26 5/
3
5/10
5/17
5/24
Num
ber o
f Cas
es
Date of Specimen Collection
Travel Congregate Living Setting (staff or resident)Health Care (staff) Community (known contact with confirmed case)Community (no known contact with confirmed case)
Number of cases by likely exposure by date of specimen collection in Minnesota. Due to the need to confirm
reports and reporting
delays, data may be incomplete
Week 10:3/1-3/7
Week 11:3/8-3/14
Week 12:3/15-3/21
Week 13:3/22-3/28
Week 14:3/29-4/4
Week 15:4/5-4/11
Week 16:4/12-4/18
Week 17:4/19-4/25
Week 18:4/26-5/2
Week 19:5/3-5/9
Week 20:5/10-5/16
Week 21:5/17-5/23
Week 22:5/24-30
Minnesota Department of Health Weekly COVID-19 Report: Updated 5/28/2020 with data current as of 4 p.m. the previous day. 14
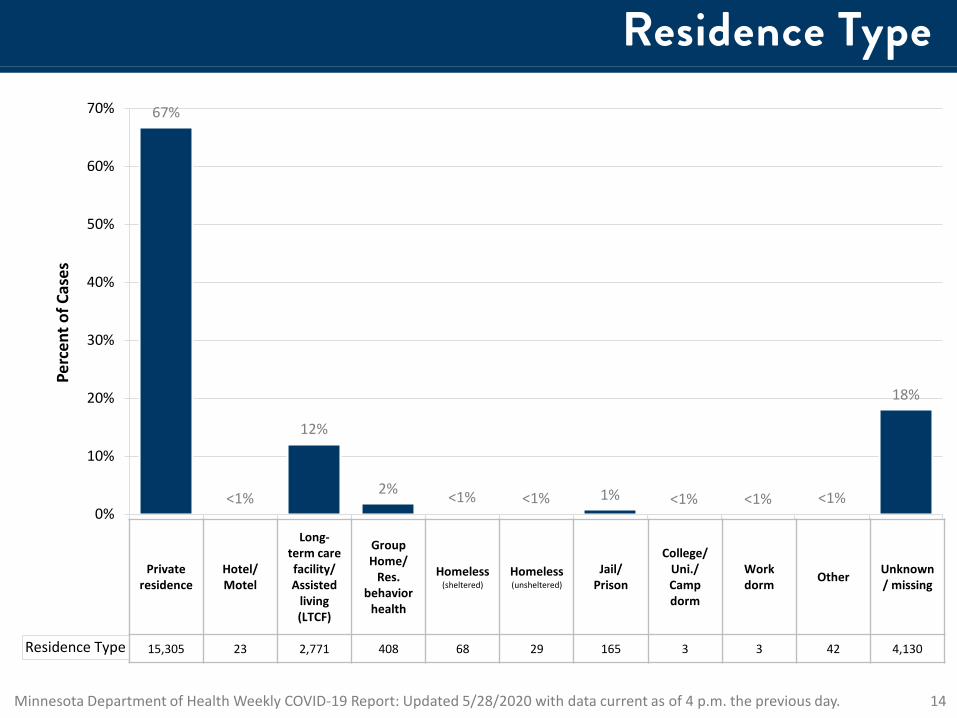
Residence Type
Privateresidence
Hotel/Motel
Long-term carefacility/As
sistedliving(LTCF)
GroupHome/Residential
behavioral health
Homeless/Sheltere
d
Homeless/Unshelte
redJail/prison
College/University/
CampDormitory
Workdormitory Other Unknown
/missing
Residence Type 67% 0% 12% 2% 0% 0% 1% 0% 0% 0% 18%
67%
<1%
12%
2% <1% <1% 1% <1% <1% <1%
18%
0%
10%
20%
30%
40%
50%
60%
70%
Perc
ent o
f Cas
es
Private residence
Hotel/ Motel
Long-term care facility/ Assisted
living (LTCF)
Group Home/
Res.behavior
health
Homeless(sheltered)
Homeless(unsheltered)
Jail/ Prison
College/ Uni./ Camp dorm
Work dorm Other Unknown
/ missing
15,305 23 2,771 408 68 29 165 3 3 42 4,130

Minnesota Department of Health Weekly COVID-19 Report: Updated 5/28/2020 with data current as of 4 p.m. the previous day. 15
Cases by County of Residence
Up to date data for this chart is provided in the Minnesota Situation Update for Coronavirus Disease 2019 (COVID-19) (https://www.health.state.mn.us/diseases/coronavirus/situation.html)
Color
Range
No cases
1-2 cases
3-6 cases
7-20 cases
21-50 cases
51-100 cases
101-1,000 cases
1,001+ cases
County Cases Deaths County Cases DeathsAitkin 7 0 Marshall 9 0Anoka 1289 63 Martin 126 5Becker 36 0 Meeker 44 0Beltrami 14 0 Mille Lacs 19 1Benton 173 3 Morrison 41 0Big Stone 4 0 Mower 231 1Blue Earth 126 1 Murray 36 0Brown 14 2 Nicollet 82 7Carlton 73 0 Nobles 1,496 3Carver 189 2 Norman 11 0Cass 13 2 Olmsted 582 10Chippewa 44 1 Otter Tail 63 0Chisago 54 1 Pennington 17 0Clay 416 25 Pine 89 0Clearwater 3 0 Pipestone 10 0Cook 0 0 Polk 59 2Cottonwood 69 0 Pope 8 0Crow Wing 59 1 Ramsey 2,698 110Dakota 1202 49 Red Lake 4 0Dodge 46 0 Redwood 4 0Douglas 39 0 Renville 5 0Faribault 13 0 Rice 423 2Fillmore 17 1 Rock 22 0Freeborn 102 0 Roseau 2 0Goodhue 60 3 St. Louis 117 14Grant 3 0 Scott 383 2Hennepin 7,695 581 Sherburne 222 2Houston 2 0 Sibley 15 0Hubbard 1 0 Stearns 1,995 12Isanti 32 0 Steele 149 0Itasca 54 8 Stevens 1 0Jackson 39 0 Swift 17 0Kanabec 11 1 Todd 296 0Kandiyohi 476 1 Traverse 3 0Kittson 1 0 Wabasha 17 0Koochiching 7 0 Wadena 8 0Lac qui Parle 3 0 Waseca 25 0Lake 1 0 Washington 576 30Lake of the Woods 0 0 Watonwan 64 0Le Sueur 44 1 Wilkin 11 3Lincoln 5 0 Winona 78 15Lyon 38 0 Wright 280 1McLeod 30 0 Yellow Medicine 6 0Mahnomen 5 1 Unknown/missing 94 0
Sibley
Wash-ing-ton
Lake
Cook
Le Sueur
Rice Goodhue
NoblesRock Jackson Martin Faribault FreebornMower
Fillmore Houston
WinonaOlmstedDodgeSteeleWasecaBlue EarthWatonwanCottonwoodMurrayPipestone
Nicollet
Wabasha
DakotaScott
Chisago
Isanti
Brown
Carver
Hennepin
WrightMeeker
Kandiyohi
Renville
Redwood
Sherburne
LyonLincoln
Yellow Medicine
Lac Qui Parle
Swift
Big Stone
PopeStevensTraverse
Chippewa
Stearns
Benton
Carlton
Pine
Kanabec
MilleLacs
Aitkin
Crow Wing
Morrison
CassHubbard
Wadena
Todd
DouglasGrant
OttertailWilkin
BeckerClay
ClearWater
MahnomenNorman
Red Lake
PenningtonPolk
Beltrami
Marshall
Itasca
Koochiching
Lakeof theWoods
RoseauKittson
St. Louis
McLeod
Ram-sey
Anoka

Minnesota Department of Health Weekly COVID-19 Report: Updated 5/28/2020 with data current as of 4 p.m. the previous day. 16
16 17 18 19 20Aitkin 0.6 0.0 0.0 0.6 1.3
Anoka 0.8 3.0 5.9 7.1 8.3
Becker 0.3 0.3 4.4 3.3 1.2
Beltrami 0.2 0.0 0.0 0.4 0.4
Benton 0.3 2.5 12.6 10.8 9.1
Big Stone 0.0 2.0 0.0 0.0 2.0
Blue Earth 0.3 1.5 3.0 2.0 3.5
Brown 0.4 0.0 0.4 0.4 0.0
Carlton 2.8 3.9 2.5 1.1 1.1
Carver 0.2 0.4 3.8 5.1 2.1
Cass 0.3 0.7 0.0 0.3 1.0
Chippewa 0.8 0.8 2.5 17.5 7.5
Chisago 0.0 0.5 0.9 2.6 2.2
Clay 7.5 11.1 10.0 7.0 12.1
Clearwater 0.0 0.0 0.0 0.0 0.0
Cook
Cottonwood 0.0 11.4 21.1 7.0 7.0
Crow Wing 0.5 0.0 0.0 0.3 2.7
Dakota 0.8 0.8 3.4 6.9 6.7
Dodge 1.0 0.5 1.0 2.4 6.3
Douglas 0.0 0.0 3.2 1.1 1.6
Faribault 0.0 0.7 0.7 0.7 1.4
Fillmore 0.5 0.5 0.0 1.4 1.0
Freeborn 2.3 0.3 1.6 2.6 5.9
Goodhue 0.4 0.0 0.9 0.9 1.5
Grant 0.0 0.0 1.7 1.7 0.0
Hennepin 3.5 4.9 9.3 11.6 12.6
Houston 0.0 0.0 0.0 0.5 0.0
Hubbard 0.0 0.0 0.0 0.0 0.0
Isanti 0.3 0.0 0.3 1.0 2.6
Itasca 0.0 0.4 4.2 4.2 1.5
Jackson 3.0 11.9 9.0 9.0 2.0
Kanabec 0.0 0.6 0.6 4.4 0.0
Kandiyohi 0.2 21.6 32.6 34.5 9.8
Kittson 2.3 0.0 0.0 0.0 0.0
Koochiching 0.0 0.0 0.0 1.6 0.8
Lac qui Parle 0.0 0.0 1.5 0.0 1.5
Lake 0.0 0.0 0.0 0.9 0.0
Lake of the Woods
Le Sueur 0.4 0.7 0.7 1.8 2.1
Lincoln 0.0 1.8 0.0 1.8 0.0
Lyon 0.4 0.4 2.7 2.3 2.3
Mahnomen 0.0 0.0 1.8 3.6 1.8
Marshall 1.1 2.1 4.3 1.1 0.0
Martin 1.0 12.0 23.5 0.5 5.0
McLeod 0.3 0.3 0.6 2.8 0.8
Meeker 0.0 3.9 3.0 2.6 5.6
Mille Lacs 0.4 0.4 1.6 0.4 2.3
Morrison 0.3 1.2 1.8 2.1 4.2
Mower 0.5 0.0 1.8 2.5 6.3
Murray 1.2 14.4 12.0 4.8 4.8
Nicollet 0.3 0.3 2.7 1.8 5.9
Nobles 59.1 305.9 155.2 76.0 46.2
Norman 7.6 3.0 1.5 3.0 0.0
Olmsted 3.3 3.7 4.6 3.6 6.3
Otter Tail 0.3 1.0 1.6 2.1 3.3
Pennington 0.7 0.0 0.0 0.0 1.4
Pine 2.1 15.4 1.4 4.1 3.4
Pipestone 1.1 0.0 3.3 2.2 3.3
Polk 5.7 5.1 2.8 3.8 0.3
Pope 0.0 0.0 1.8 2.7 0.0
Ramsey 1.1 2.5 5.8 9.1 11.9
Red Lake 0.0 0.0 0.0 2.5 2.5
Redwood 0.0 0.0 1.3 0.0 0.0
Renville 0.0 0.7 0.7 0.0 0.0
Rice 0.5 0.8 3.5 17.3 20.2
Rock 4.2 5.3 6.4 1.1 1.1
Roseau 0.0 0.0 0.0 0.0 0.0
Scott 0.6 1.0 3.8 6.8 6.0
Sherburne 0.4 1.6 5.8 4.5 5.0
Sibley 0.0 0.7 0.7 2.0 2.7
St Louis 0.6 0.9 0.6 0.5 0.4
Stearns 0.8 15.7 54.3 30.4 13.7
Steele 0.0 1.6 4.1 11.5 12.3
Stevens
Swift 0.0 1.1 0.0 8.5 3.2
Todd 0.4 1.6 7.4 9.0 27.4
Traverse 0.0 0.0 0.0 3.0 0.0
Wabasha 0.5 0.0 0.9 1.4 1.4
Wadena 0.0 0.7 1.5 0.7 1.5
Waseca 0.0 0.5 2.1 4.8 1.6
Washington 0.6 0.9 2.5 3.8 5.5
Watonwan 0.0 3.6 6.4 12.8 12.8
Wilkin 4.7 1.6 0.0 0.0 0.0
Winona 5.5 1.4 0.4 0.0 0.4
Wright 0.8 0.7 2.4 4.1 5.1
Yellow Medicine 0.0 0.0 0.0 0.0 1.0
Number of Cases by County of Residence and PopulationNumber of cases by county of residence per 10,000 people by week in Minnesota by week of specimen collection.
Week 16:4/12-4/18
Week 17:4/19-4/25
Week 18:4/26-5/2
Week 19:5/3-5/9
Week 20:5/10-5/16

Minnesota Department of Health Weekly COVID-19 Report: Updated 5/28/2020 with data current as of 4 p.m. the previous day. 17
Occupational Related Cases: Health Care
1,399Total Health Care Workers with
Likely Exposure as Health Care Staff (cumulative)
6 - 19 years 20-29 years 30-39 years 40-49 years 50-59 years 60-69 years 70-79 years 80-89 years Unknown/missing
All cases 7% 18% 20% 16% 15% 9% 5% 5% 0%Health Care (staff) 3% 23% 27% 20% 18% 8% 1% 0% 0%
7%
18%20%
16%15%
9%
5% 5%
0%
3%
23%
27%
20%
18%
8%
1% 0% 0%0%
5%
10%
15%
20%
25%
30%
35%
40%
Perc
ent o
f Cas
es
All Cases and Health Care Cases by Age Group
6-19 years 20-29 years
30-39 years
40-49 years
50-59 years
60-69 years
70-79 years
80-89years
Unknown/ missing
1,536 4,212 4,580 3,660 3,335 2,103 1,243 1,171 10
73 585 683 517 461 215 14 1 0
158Total Health Care Staff Hospitalized
(cumulative)
This data is for all cases with an occupation as health care staff. Not all health care workers have a likely exposure as health care staff.
2,549Total Health Care Workers
(cumulative)