minneapolis, minnesota 55455, usa - u of mn · …€¦ · 1 imaging mechanisms in dynamic force...
TRANSCRIPT
1
Imaging Mechanisms in Dynamic Force Microscopy of Polymers
Greg D. Haugstad
Center for Interfacial Engineering, University of Minnesota Minneapolis, Minnesota 55455, USA
Applications of scanning force microscopy (SFM) in polymer studies have flourished in this decade, reflecting (a) sensitivity to both structure and properties on the nanometer scale, and (b) ease of operation in ambient environments without sample pretreatment.1 One drawback in SFM of soft materials has been damage incurred during the imaging process. The problem was alleviated by the development of dynamic force microscopy (DFM), in which the probe spends little or no time in contact with the polymer surface and shear forces are minimized. This mode of operation has been dubbed “tapping”, “intermittent contact”, “non-contact”, “near-contact”, etc. As studies proliferated, it became apparent that different researchers were using different terms to refer to the same apparent imaging mechanism, or the same term to refer to different imaging mechanisms. This quandary derived from a poor understanding of exactly how the DFM probe interacts with the sample surface. In the past two years a flurry of experimental and theoretical work has shed light on the problem.2-17 It is now established that many images collected under “light tapping”, for example, do not involve solid (repulsive) contact between probe and sample.2-11
The key to understand dynamic imaging modes is the concept of a “de-tuned” oscillator. The cantilever support is driven sinusoidally very near the resonance frequency of the cantilever. In air the quality factor of this oscillator is typically 300 or greater, so that the cantilever amplitude drops precipitously at frequencies slightly off resonance. Typically the driving frequency is held constant and the cantilever resonance frequency altered by interactions between probe and sample, yielding amplitude reduction. Images are generated by rastering the sample (or probe support) in the X-Y plane and displacing the Z position of sample (or probe support) under feedback to maintain constant amplitude reduction. Apparent surface topographs Z(X,Y) are actually surfaces of constant amplitude damping. The phase lag of cantilever relative to driving oscillation is simultaneously imaged. A slight shift in the resonance frequency can translate into a dramatic change in phase. The typical convention is that a positive phase shift results from an increase in resonance frequency, reflecting an overall positive "interaction stiffness". In some cases attractive forces between probe and sample yield negative interaction stiffness. Indeed amplitude reduction may result from purely attractive forces,2-11 precluding solid-solid contact and information on sample modulus. The magnitude of amplitude reduction is nonetheless sufficient to enable topographic imaging in the nominal "non-contact" regime.
Here it is demonstrated that changes in (a) the nature of tip-sample interaction, or (b) driving modulation parameters, can yield jumps between imaging mechanisms, i.e. between intermittent solid contact and nominal non-contact. Moreover, on heterogeneous films of polyvinyl alcohol, some regions can be imaged in intermittent solid contact while others in nominal non-contact within a single image, in strictly reversible and stable fashion. This is determined by measuring cantilever amplitude and phase relative to driving modulation while approaching the sample to the oscillating probe. By mapping these “dynamic force spectroscopy” (DFS) measurements across the sample surface, local imaging regimes and height artifacts were identified.
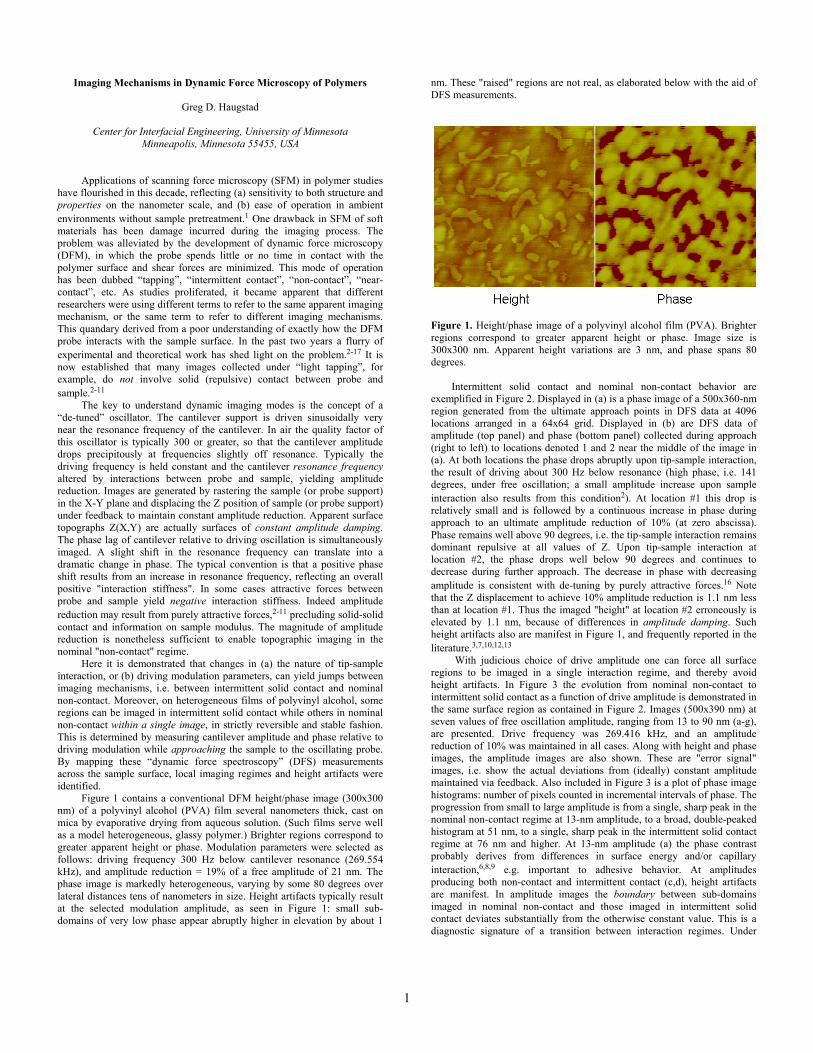
Figure 1 contains a conventional DFM height/phase image (300x300 nm) of a polyvinyl alcohol (PVA) film several nanometers thick, cast on mica by evaporative drying from aqueous solution. (Such films serve well as a model heterogeneous, glassy polymer.) Brighter regions correspond to greater apparent height or phase. Modulation parameters were selected as follows: driving frequency 300 Hz below cantilever resonance (269.554 kHz), and amplitude reduction = 19% of a free amplitude of 21 nm. The phase image is markedly heterogeneous, varying by some 80 degrees over lateral distances tens of nanometers in size. Height artifacts typically result at the selected modulation amplitude, as seen in Figure 1: small sub-domains of very low phase appear abruptly higher in elevation by about 1
nm. These "raised" regions are not real, as elaborated below with the aid of DFS measurements.
Figure 1. Height/phase image of a polyvinyl alcohol film (PVA). Brighter regions correspond to greater apparent height or phase. Image size is 300x300 nm. Apparent height variations are 3 nm, and phase spans 80 degrees.
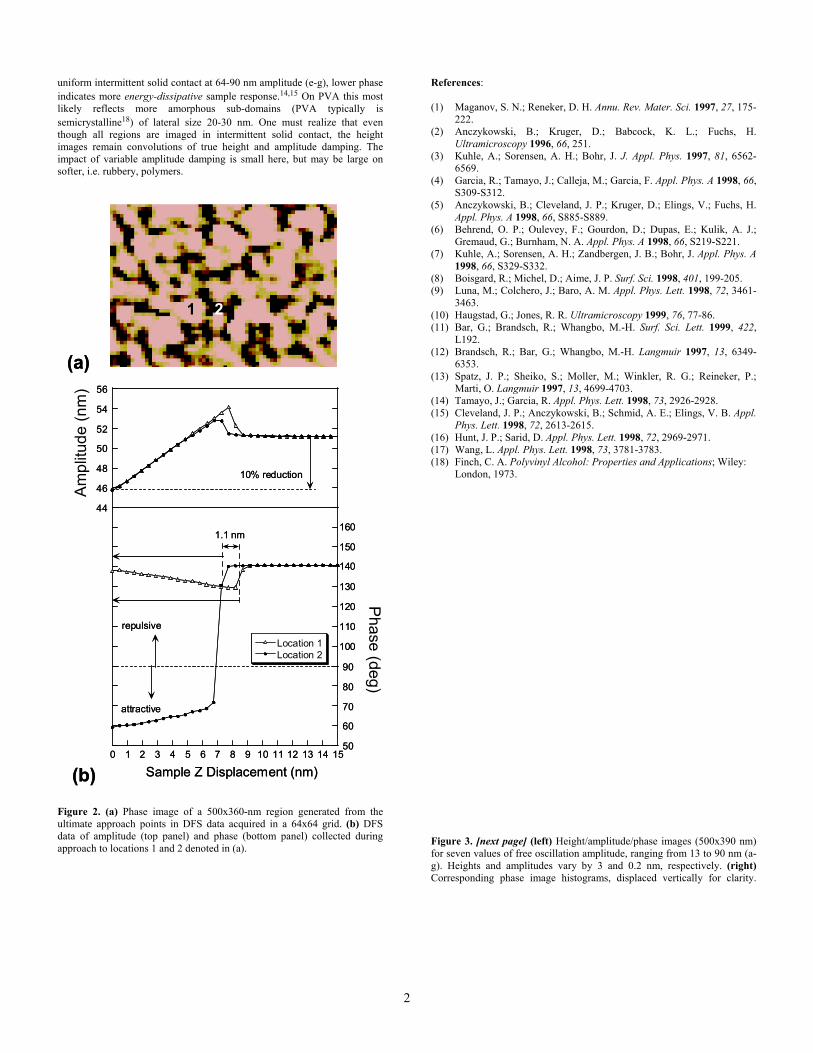
Intermittent solid contact and nominal non-contact behavior are exemplified in Figure 2. Displayed in (a) is a phase image of a 500x360-nm region generated from the ultimate approach points in DFS data at 4096 locations arranged in a 64x64 grid. Displayed in (b) are DFS data of amplitude (top panel) and phase (bottom panel) collected during approach (right to left) to locations denoted 1 and 2 near the middle of the image in (a). At both locations the phase drops abruptly upon tip-sample interaction, the result of driving about 300 Hz below resonance (high phase, i.e. 141 degrees, under free oscillation; a small amplitude increase upon sample interaction also results from this condition2). At location #1 this drop is relatively small and is followed by a continuous increase in phase during approach to an ultimate amplitude reduction of 10% (at zero abscissa). Phase remains well above 90 degrees, i.e. the tip-sample interaction remains dominant repulsive at all values of Z. Upon tip-sample interaction at location #2, the phase drops well below 90 degrees and continues to decrease during further approach. The decrease in phase with decreasing amplitude is consistent with de-tuning by purely attractive forces.16 Note that the Z displacement to achieve 10% amplitude reduction is 1.1 nm less than at location #1. Thus the imaged "height" at location #2 erroneously is elevated by 1.1 nm, because of differences in amplitude damping. Such height artifacts also are manifest in Figure 1, and frequently reported in the literature.3,7,10,12,13
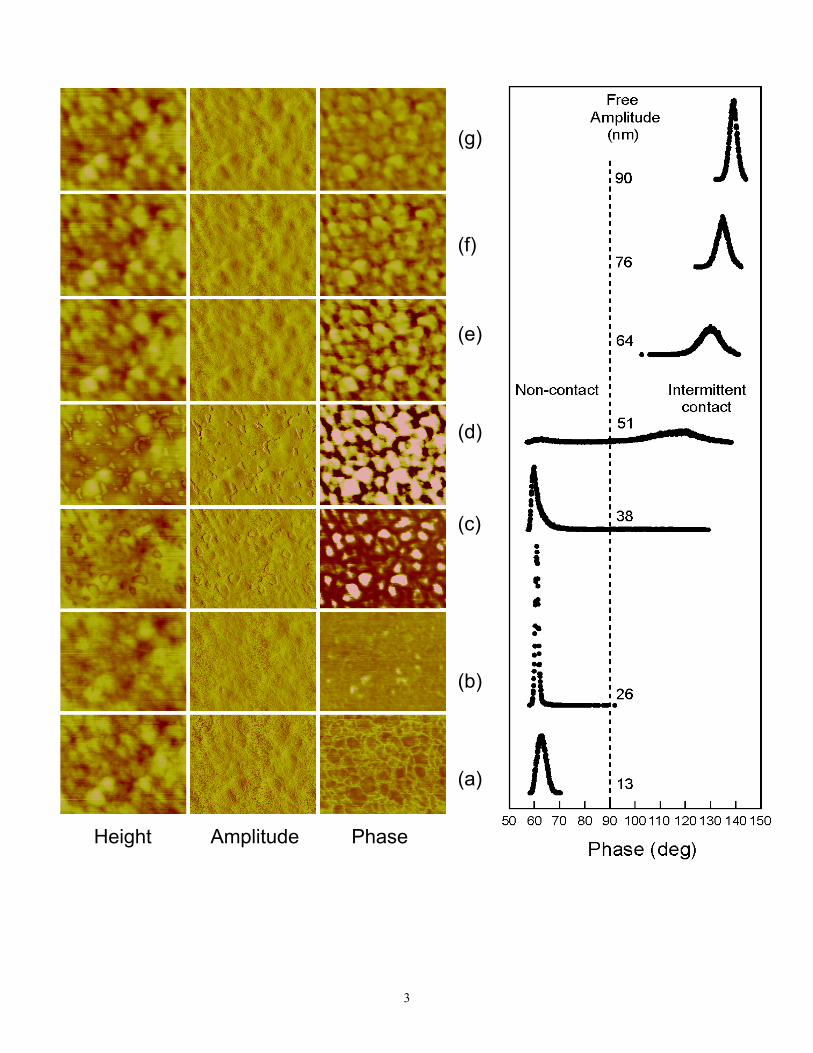
With judicious choice of drive amplitude one can force all surface regions to be imaged in a single interaction regime, and thereby avoid height artifacts. In Figure 3 the evolution from nominal non-contact to intermittent solid contact as a function of drive amplitude is demonstrated in the same surface region as contained in Figure 2. Images (500x390 nm) at seven values of free oscillation amplitude, ranging from 13 to 90 nm (a-g), are presented. Drive frequency was 269.416 kHz, and an amplitude reduction of 10% was maintained in all cases. Along with height and phase images, the amplitude images are also shown. These are "error signal" images, i.e. show the actual deviations from (ideally) constant amplitude maintained via feedback. Also included in Figure 3 is a plot of phase image histograms: number of pixels counted in incremental intervals of phase. The progression from small to large amplitude is from a single, sharp peak in the nominal non-contact regime at 13-nm amplitude, to a broad, double-peaked histogram at 51 nm, to a single, sharp peak in the intermittent solid contact regime at 76 nm and higher. At 13-nm amplitude (a) the phase contrast probably derives from differences in surface energy and/or capillary interaction,6,8,9 e.g. important to adhesive behavior. At amplitudes producing both non-contact and intermittent contact (c,d), height artifacts are manifest. In amplitude images the boundary between sub-domains imaged in nominal non-contact and those imaged in intermittent solid contact deviates substantially from the otherwise constant value. This is a diagnostic signature of a transition between interaction regimes. Under
2
uniform intermittent solid contact at 64-90 nm amplitude (e-g), lower phase indicates more energy-dissipative sample response.14,15 On PVA this most likely reflects more amorphous sub-domains (PVA typically is semicrystalline18) of lateral size 20-30 nm. One must realize that even though all regions are imaged in intermittent solid contact, the height images remain convolutions of true height and amplitude damping. The impact of variable amplitude damping is small here, but may be large on softer, i.e. rubbery, polymers.
Figure 2. (a) Phase image of a 500x360-nm region generated from the ultimate approach points in DFS data acquired in a 64x64 grid. (b) DFS data of amplitude (top panel) and phase (bottom panel) collected during approach to locations 1 and 2 denoted in (a).
References: (1) Maganov, S. N.; Reneker, D. H. Annu. Rev. Mater. Sci. 1997, 27, 175-
222. (2) Anczykowski, B.; Kruger, D.; Babcock, K. L.; Fuchs, H.
Ultramicroscopy 1996, 66, 251. (3) Kuhle, A.; Sorensen, A. H.; Bohr, J. J. Appl. Phys. 1997, 81, 6562-
6569. (4) Garcia, R.; Tamayo, J.; Calleja, M.; Garcia, F. Appl. Phys. A 1998, 66,
S309-S312. (5) Anczykowski, B.; Cleveland, J. P.; Kruger, D.; Elings, V.; Fuchs, H.
Appl. Phys. A 1998, 66, S885-S889. (6) Behrend, O. P.; Oulevey, F.; Gourdon, D.; Dupas, E.; Kulik, A. J.;
Gremaud, G.; Burnham, N. A. Appl. Phys. A 1998, 66, S219-S221. (7) Kuhle, A.; Sorensen, A. H.; Zandbergen, J. B.; Bohr, J. Appl. Phys. A
1998, 66, S329-S332. (8) Boisgard, R.; Michel, D.; Aime, J. P. Surf. Sci. 1998, 401, 199-205. (9) Luna, M.; Colchero, J.; Baro, A. M. Appl. Phys. Lett. 1998, 72, 3461-
3463. (10) Haugstad, G.; Jones, R. R. Ultramicroscopy 1999, 76, 77-86. (11) Bar, G.; Brandsch, R.; Whangbo, M.-H. Surf. Sci. Lett. 1999, 422,
L192. (12) Brandsch, R.; Bar, G.; Whangbo, M.-H. Langmuir 1997, 13, 6349-
6353. (13) Spatz, J. P.; Sheiko, S.; Moller, M.; Winkler, R. G.; Reineker, P.;
Marti, O. Langmuir 1997, 13, 4699-4703. (14) Tamayo, J.; Garcia, R. Appl. Phys. Lett. 1998, 73, 2926-2928. (15) Cleveland, J. P.; Anczykowski, B.; Schmid, A. E.; Elings, V. B. Appl.
Phys. Lett. 1998, 72, 2613-2615. (16) Hunt, J. P.; Sarid, D. Appl. Phys. Lett. 1998, 72, 2969-2971. (17) Wang, L. Appl. Phys. Lett. 1998, 73, 3781-3783. (18) Finch, C. A. Polyvinyl Alcohol: Properties and Applications; Wiley:
London, 1973. Figure 3. [next page] (left) Height/amplitude/phase images (500x390 nm) for seven values of free oscillation amplitude, ranging from 13 to 90 nm (a-g). Heights and amplitudes vary by 3 and 0.2 nm, respectively. (right) Corresponding phase image histograms, displaced vertically for clarity.
2
1 2
44
46
48
50
52
54
56
0 1 2 3 4 5 6 7 8 9 10 11 12 13 14 15
Location 1Location 2
Sample Z Displacement (nm)
repulsive
attractive
1.1 nm
90
60
70
80
140
130
120
110
100
160
150
50
10% reduction
Ampl
itude
(nm
)
Phase (deg)
(a)
(b)
1 2
44
46
48
50
52
54
56
0 1 2 3 4 5 6 7 8 9 10 11 12 13 14 15
Location 1Location 2
Sample Z Displacement (nm)
repulsive
attractive
1.1 nm
90
60
70
80
140
130
120
110
100
160
150
50
10% reduction
Ampl
itude
(nm
)
Phase (deg)
(a)
(b)
3
(a)
(b)
(c)
(g)
(f)
(e)
(d)
Height Amplitude Phase