ministry of finance planning and economic development · · 2018-01-11ministry of finance...
TRANSCRIPT
Quarter 1 Macroeconomic Report FY2017/18
1
Q1 FY 2017/18
Q1 FY 2017/18
MINISTRY OF FINANCE PLANNING
AND ECONOMIC DEVELOPMENT
MINISTRY OF FINANCE PLANNING
AND ECONOMIC DEVELOPMENT
QUARTERLY MACROECONOMIC REPORT
JULY-SEPTEMBER 2017
MACROECONOMIC POLICY DEPARTMENT
QUARTERLY MACROECONOMIC REPORT
JULY-SEPTEMBER 2017
MACROECONOMIC POLICY DEPARTMENT

Quarter 1 Macroeconomic Report FY2017/18
2
Table of Contents
REAL SECTOR DEVELOPMENTS ...........................................................................................................7
Economic Growth................................................................................................................................ 7
Inflation ............................................................................................................................................. 10
FINANCIAL SECTOR DEVELOPMENTS ................................................................................................. 13
Interest rates ..................................................................................................................................... 14
Private Sector Credit ......................................................................................................................... 15
Primary Market Yields on Treasury Instruments .............................................................................. 16
EXTERNAL SECTOR DEVELOPMENTS ................................................................................................. 18
Exchange Rate ................................................................................................................................... 19
Merchandise trade balance .............................................................................................................. 20
Merchandise exports .................................................................................................................... 20
Destination of exports .................................................................................................................. 21
Imports .......................................................................................................................................... 22
Origin of Imports ........................................................................................................................... 23
International reserves ....................................................................................................................... 24
FISCAL SECTOR DEVELOPMENTS ....................................................................................................... 25
Revenue performance ...................................................................................................................... 27
Expenditure Performance ................................................................................................................. 28
Domestic Financing (Treasury Instruments) ..................................................................................... 28
Quarter 1 Macroeconomic Report FY2017/18
3
List of Acronyms and Abbreviations
BTI Business Tendency Index
CBR Central Bank Rate
CIEA Composite Index of Economic Activity
CIF Cost Insurance &Freight
EAC East African Community
EFU Energy Fuel and Utilities
EU European Union
FY Financial Year
GDP Gross Domestic Product
HIPC Heavily Indebted Poor Countries
HPPs Hydro Power Projects
PSC Private Sector Credit
SCT Single Customs Territory
OSBPs One Stop Border Posts
URA Uganda Revenue Authority
USD United States Dollars
VAT Value Added Tax
Shs/UGX Ugandan Shilling
NPL Non-performing loans
IMF International Monetary Fund
AIA Appropriations in Aid
PAF Poverty Alleviation Fund
PTA Preferential Trade Area
CFR Charter for Fiscal Responsibility

Quarter 1 Macroeconomic Report FY2017/18
4
HIGHLIGHTS
Economic Activity: The first quarter of the Financial Year 2017/18 exhibited
improvement in economic activity as evidenced by the composite index of economic
activity (CIEA).
Inflation: Inflationary pressures eased during the quarter under review as annual
headline inflation declined considerably to a 5.4 percent quarterly average in
Quarter 1 of the Financial Year 2017/18 from 6.8 percent in the previous quarter. A
decomposition of headline inflation shows that the decline was on account of a
reduction in both core and food crop inflation.
Exchange Rate: The Uganda shilling remained relatively stable against the dollar
recording an official average mid-rate of Shs 3602.48 per US dollar from Shs
3611.1per US dollar in the preceding quarter, representing a marginal appreciation
of 0.24 percent.
Interest Rates and Private Sector Credit: The stock of outstanding private sector
credit (PSC) increased from Shs.12,118.1 billion at the end of the Financial Year
2016/17 to Shs.12,350.7 billion at the end of Quarter 1 Financial Year 2017/18,
registering a growth of 2 percent over the quarter. The recovery in PSC is attributed
to the sustained monetary policy easing by the central bank and a sound financial
system. Both the Central Bank rate and the Commercial Bank lending rates declined
in Quarter 1 2017/18 compared to the previous quarter.
Merchandise Trade Balance: The merchandise trade deficit narrowed by 14.8 percent
on an annual basis, from a deficit of US$ 525.4 million in Quarter 1 Financial Year
2016/17 to a deficit of US$ 447.6 million in Quarter 1 Financial Year 2017/18. This
was due to a slow recovery in the import bill coupled with an increase in the value
of exports from growth in volumes and prices.
Quarter 1 Macroeconomic Report FY2017/18
5
Fiscal Sector Developments: The overall fiscal deficit (including grants) for Quarter
1 Financial Year 2017/18 was registered at Shs1,386.55 billion. Total expenditure
was below the program by Shs 631.99 billion due to a poor performance in external
development expenditure. Additionally, revenue and grants registered a short fall
of Shs. 472.29 billion due to both lower disbursements and taxes.

Quarter 1 Macroeconomic Report FY2017/18
6
REAL SECTOR DEVELOPMENTS

Quarter 1 Macroeconomic Report FY2017/18
7
REAL SECTOR DEVELOPMENTS
Economic Growth
The Global economy experienced a recovery towards the end of 2017 and is now
expected to grow at 3.7 percent in 2017 and continue strengthening to 3.8 in 2018
compared to 3.2 percent in 2016. Significant recovery in the euro area, Japan,
emerging Asia, emerging Europe, and Russia more than offset downward revisions
for the United States and the United Kingdom. The stronger recovery in economic
activity is supported by growth in investment, trade and industrial production as
well as business and consumer confidence. However; it is worth noting that whereas
the short-term outlook on global growth is strong, the medium-term outlook is a
rather cautious one as growth and inflation in many countries remain below
expected targets. Additionally; in Sub-Saharan Africa, economic growth has been
slowed down by country specific factors in the region’s largest economies as well as
slow implementation of policy adjustments. Furthermore, fuel exporting countries
continue to adjust to significant losses in foreign earnings
Subsequently; Uganda’s economy grew by 4 percent in the Financial Year 2016/17,
higher than the preliminary release of 3.9 percent at the end of the Financial Year
16/17, but significantly lower than the 4.7 percent growth in the previous Financial
Year 15/16. By sector, all three sectors of the economy registered slower growth
compared to the last financial year. Services sector grew at 5.7 percent down from 5.9
percent, while industry grew at 3.3 percent down from the 4.6 percent and
Agriculture, forestry and fishing grew at 1.6 percent compared to 2.8 percent growth
registered the previous financial year. By subsector; Trade and repairs, Transport
and storage, Financial and Insurance Services contributed to the slowdown in
growth of the services sector while Mining and quarrying and construction
accounted for the slowdown in growth in industry.

Quarter 1 Macroeconomic Report FY2017/18
8
Figure 1: Global Economic Growth rates: 2010-2017
Source: IMF&MOFPED
Economic growth in the Financial Year 2017/18 is expected to pick up after three
successive years of slowing down. The economy is projected to grow at 5.0 percent.
The return of normal weather conditions as forecast by the Meteorological Authority
and improvement in the global and domestic economic conditions are expected to
boost growth. Specifically; favourable weather conditions are expected to facilitate
recovery in agriculture, forestry and fishing, critical public investments and the
current supportive monetary and fiscal policy stance coupled with the reduction in
non-Performing loans is also expected to encourage commercial banks to lend more
to the private sector and rejuvenate economic activity. Relative stability of the
exchange rate is also expected to boost trade and manufacturing. Additionally, the
first quarter of the Financial Year 2017/18 showed some improvement in economic
activity based on the Composite Index of economic activity (CIEA) as well as better
prospects for the future based on the Business Tendency Index (BTI1).
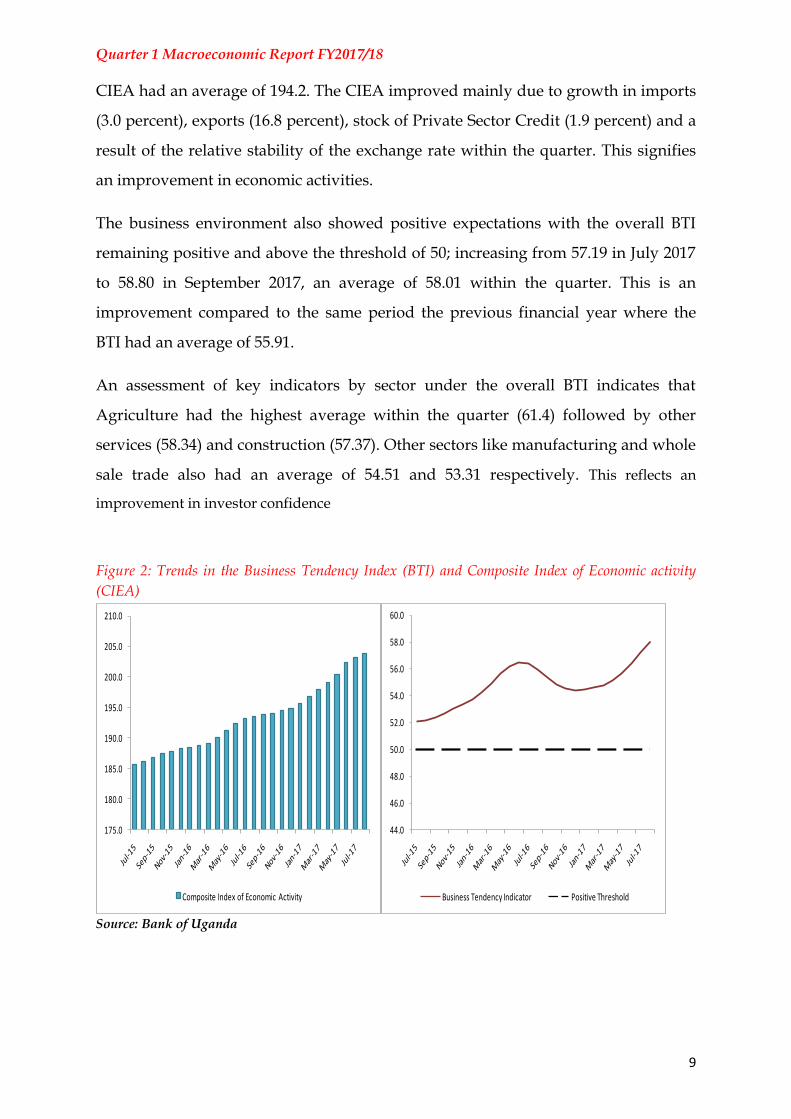
The CIEA2 remained positive during the quarter increasing from 203.14 in July 2017
to 204.61 in September 2017 having an average of 203.87 within the quarter. This is
an improvement compared to quarter one of the previous financial year where the
1 Business Tendency Index less than 50 implies negative expectations/pessimistic and index greater than 50
implies positive expectations/optimistic
2 The CIEA captures the underlying changes in economic activity in the economy. It is constructed using ten
variables which are: currency in circulation; VAT on domestic goods and services; exports; imports; government expenditure on goods and services; sales; cement production; excise taxes; PAYE; and private sector credit.
0
1
2
3
4
5
6
7
8
9
10
2010 2011 2012 2013 2014 2015 2016 2017
Uganda
Sub-Saharan Africa
World
Quarter 1 Macroeconomic Report FY2017/18
9
CIEA had an average of 194.2. The CIEA improved mainly due to growth in imports
(3.0 percent), exports (16.8 percent), stock of Private Sector Credit (1.9 percent) and a
result of the relative stability of the exchange rate within the quarter. This signifies
an improvement in economic activities.
The business environment also showed positive expectations with the overall BTI
remaining positive and above the threshold of 50; increasing from 57.19 in July 2017
to 58.80 in September 2017, an average of 58.01 within the quarter. This is an
improvement compared to the same period the previous financial year where the
BTI had an average of 55.91.
An assessment of key indicators by sector under the overall BTI indicates that
Agriculture had the highest average within the quarter (61.4) followed by other
services (58.34) and construction (57.37). Other sectors like manufacturing and whole
sale trade also had an average of 54.51 and 53.31 respectively. This reflects an
improvement in investor confidence
Figure 2: Trends in the Business Tendency Index (BTI) and Composite Index of Economic activity
(CIEA)
Source: Bank of Uganda
175.0
180.0
185.0
190.0
195.0
200.0
205.0
210.0
Composite Index of Economic Activity
44.0
46.0
48.0
50.0
52.0
54.0
56.0
58.0
60.0
Business Tendency Indicator Positive Threshold

Quarter 1 Macroeconomic Report FY2017/18
10
Inflation
The quarter ending September 2017 registered a decline in inflation, with annual
headline inflation slowing down to a quarterly average of 5.4 percent from 6.8
percent in the previous quarter. The slowdown in annual headline inflation during
Quarter 1 of the financial year was driven by declines in both Core and food crop
inflation.
Figure 3: Quarterly inflation trends in Q4 FY2016/17 and Q1 FY 2017/18
SOURCE: Uganda Bureau of Statistics.
Average annual core inflation dropped to 4.3 percent in Quarter 1 of the financial
year from 5 percent in the previous quarter. This decline is attributed to a return to
stability of the exchange rate and subdued domestic demand.
Food crop inflation declined to a quarterly average of 11.4 percent from 21.0 percent
in the previous quarter. This was on account of increased food supplies to markets as
the negative effects of the recent drought on agricultural production receded.
In the same period, EFU inflation rose to an 8.8 percent average from 6.0 percent the
previous quarter, nonetheless this increase was not enough to offset the decline in
both food crop and core inflation. The increase in EFU inflation was mainly due to
an increase in prices of solid fuels (charcoal and firewood). The two fuels registered
respective average annual price increases of 8.4 percent and 9.7 percent during the
quarter from 0.3 percent and 4.5 percent the previous quarter. Liquid Energy Fuels

Quarter 1 Macroeconomic Report FY2017/18
11
(paraffin, diesel, petrol) however registered lower inflation rates during the quarter
at 5.9 percent on average compared to 8.2 percent the previous quarter.
Annual Headline inflation is projected to remain low and stable in the Financial Year
2017/18 expected at an annual average of 4.9 percent. This is on account of projected
low food crop and core inflation rates. Food crop inflation is expected to remain low
on account of increased food supply as a result of a return to favourable weather
conditions. Core Inflation as well is projected to remain stable owing to low demand
pressures and stability in the exchange rate. Accommodative monetary policy is
likely to gradually increase demand pressures and hence push core inflation slightly
upwards towards the end of the financial year. Nonetheless, the average annual core
inflation shall remain within the Central Banks Medium term target of 5
Inflation across the East African Region
Regionally, there was a decline in annual headline inflation across all six partner
states. This was mainly on account of a decline in food crop inflation as most of the
partner states recovered from the effects of the wide spread drought that reduced
agricultural output in the Financial Year 2016/17. Recovery from the drought
largely was experienced in the final quarter of the Financial Year 2016/17, food
supplies gradually increased across the region leading to the general decline in food
crop inflation during the quarter under review.
Nonetheless, inflation in South Sudan remained highest. The country has grappled
with insecurity since the civil war broke out in 2013; this has hampered food
production and disrupted markets across the country hence leading to
hyperinflation.

Quarter 1 Macroeconomic Report FY2017/18
12
Figure 4: Inflation rates across the east African region
Source: Respective Country Central Statistical Organisations
0.0%
2.0%
4.0%
6.0%
8.0%
10.0%
12.0%
14.0%
16.0%
18.0%
20.0%
Burundi Kenya Rwanda Tanzania Uganda
Q4-FY 2016/17 Q1-FY 2017/18
0.0%
50.0%
100.0%
150.0%
200.0%
250.0%
300.0%
350.0%
Q4-FY2016/17
Q1-FY2017/18
Q4-FY 2016/17
Q1-FY 2017/18

Quarter 1 Macroeconomic Report FY2017/18
13
FINANCIAL SECTOR
DEVELOPMENTS

Quarter 1 Macroeconomic Report FY2017/18
14
MONETARY AND FINANCIAL SECTOR
Interest rates
Over the quarter, the Central Bank Rate (CBR) was reduced to 10.0 percent from 14
percent prevailing through most Quarter 4 Financial Year 2016/17. The continued
easing of monetary policy was mostly influenced by reduced inflationary pressures
in the economy during the quarter and the need to support a recovery in private
sector credit to spur economic activity.
Figure 5: Movements in key interest rates
Source: Bank of Uganda
Though lending rates remain sticky downwards, they are gradually responding to
the monetary policy easing, falling from 23.7 percent at the end of Quarter 1
Financial Year 16/17 to 20.9 percent in Quarter 1 Financial Year 17/18. This
reduction in the cost of credit is expected to encourage increased borrowing.
In addition, the ratio of Non-performing loans to gross loans reduced from 10.47
percent in Quarter 2 Financial Year 16/17 to 7.24 percent in Quarter 1 Financial Year
2017/18. This improvement in loan performance will most likely improve
willingness to extend credit by commercial banks. Furthermore, the banking system
remained strongly capitalized, with a core capital adequacy ratio of 21.54 percent as
of September 2017 compared to 19.83 percent as of September 2016 as a result of
growth in retained earnings; this ratio is far higher than the statutory minimum of 8
0
5
10
15
20
25
30
CBR(%) Lending rate(%)

Quarter 1 Macroeconomic Report FY2017/18
15
percent. The robust capital levels offer a high degree of resilience against systemic
distress.
Private Sector Credit
Subsequently, the stock of outstanding private sector credit (PSC) increased from
Shs.12.1 trillion at the end of Financial Year 2016/17 to Shs.12.3 trillion at the end of
Quarter 1 Financial Year 2017/18, registering a growth of 2 percent over the quarter.
The distribution of the stock of outstanding PSC at the end of Quarter 1 Financial
Year 17/18 by sector shows that Trade accounted for the largest share of outstanding
credit at 21 percent, followed by the building, mortgage, construction and real estate
sector at 20 percent and Personal Loans and Household loans at 18 percent. Other
notable holders of PSC by sector include; manufacturing (13 percent) and agriculture
(12 percent).
Figure 6: Share of Total PSC at the end of Q1FY17/18 by Sector.
Source: Bank of Uganda
There was growth in PSC for all sectors in Quarter 1 Financial Year 17/18 except,
other services which declined by 32.8 percent, Transport and Communication which
declined by 9.4 percent and Electricity and Water which declined by 2.0 percent.
These sectors however together only accounted for 9.3 percent of the total stock of
Agriculture 12%
Mining and Quarrying
1%
Manufacturing 13%
Trade 21%
Transport and Communication
6%
Electricity and Water
2%
Building, Mortgage,
Construction and Real Estate
20%
Business Services
4%
Community, Social & Other
Services 3%
Personal Loans and Household
Loans 18%
Other Services 0%

Quarter 1 Macroeconomic Report FY2017/18
16
outstanding credit at the end of Quarter 4 16/17, and therefore did not have a
significant impact on the overall growth of PSC for the quarter under review.
Table 1: Growth in PSC in key sectors for Q1 FY2017/18
Source: Bank of Uganda
Primary Market Yields on Treasury Instruments
The primary market was characterised by a decline in yields across all tenors. The
average weighted yields to maturity for Quarter 1 2017/18 were 9.9 percent, 10.2
percent and 11.1 percent compared to 15 percent, 15.9 percent and 16.7 percent in
Quarter 1 2016/17 for the 91, 182 and 364 day tenors, respectively. The yields edged
downwards due to excess liquidity in money market and high demand for
government paper.
SECTOR Q1’16/17 Q2’16/17 Q3’16/17 Q4’16/17 Q1’17/18
Agriculture 0.50% 5.00% 8.70% 3.10% 3.70%
Mining and Quarrying -21.00% 0.20% 17.90% 13.50% 4.60%
Manufacturing -4.20% 2.90% -5.80% 4.20% 0.30%
Trade 4.60% 3.80% -0.20% 3.60% 4.80%
Transport and Communication 4.50% 6.50% -8.20% -1.00% -9.40%
Electricity and Water -0.70% 2.50% -21.80% 24.80% -2.00%
Building, Mortgage,
Construction and Real Estate 0.40% 4.30% -10.00% 1.40% 1.20%
Business Services 1.10% 7.30% 16.20% -10.10% 5.40%Community, Social & Other
Services 3.20% 6.80% -8.00% 1.00% 3.40%Personal Loans and Household
Loans 5.40% 3.50% 4.50% 3.80% 4.50%
Other Services -31.00% -8.70% 67.40% -45.80% -32.80%
Total 1.20% 4.10% -1.50% 1.90% 1.90%

Quarter 1 Macroeconomic Report FY2017/18
17
Figure 7: Primary Market Yields of Treasury Bills
Source: Bank of Uganda
7.0
9.0
11.0
13.0
15.0
17.0
19.0
Jul-
16
Au
g-1
6
Sep
-16
Oct
-16
No
v-1
6
De
c-1
6
Jan
-17
Feb
-17
Mar
-17
Ap
r-1
7
May
-17
Jun
-17
Jul-
17
Au
g-1
7
Sep
-17
%
91 Days 182 Days 364 Days

Quarter 1 Macroeconomic Report FY2017/18
18
EXTERNAL SECTOR
DEVELOPMENTS
Quarter 1 Macroeconomic Report FY2017/18
19
EXTERNAL SECTOR
Exchange Rate
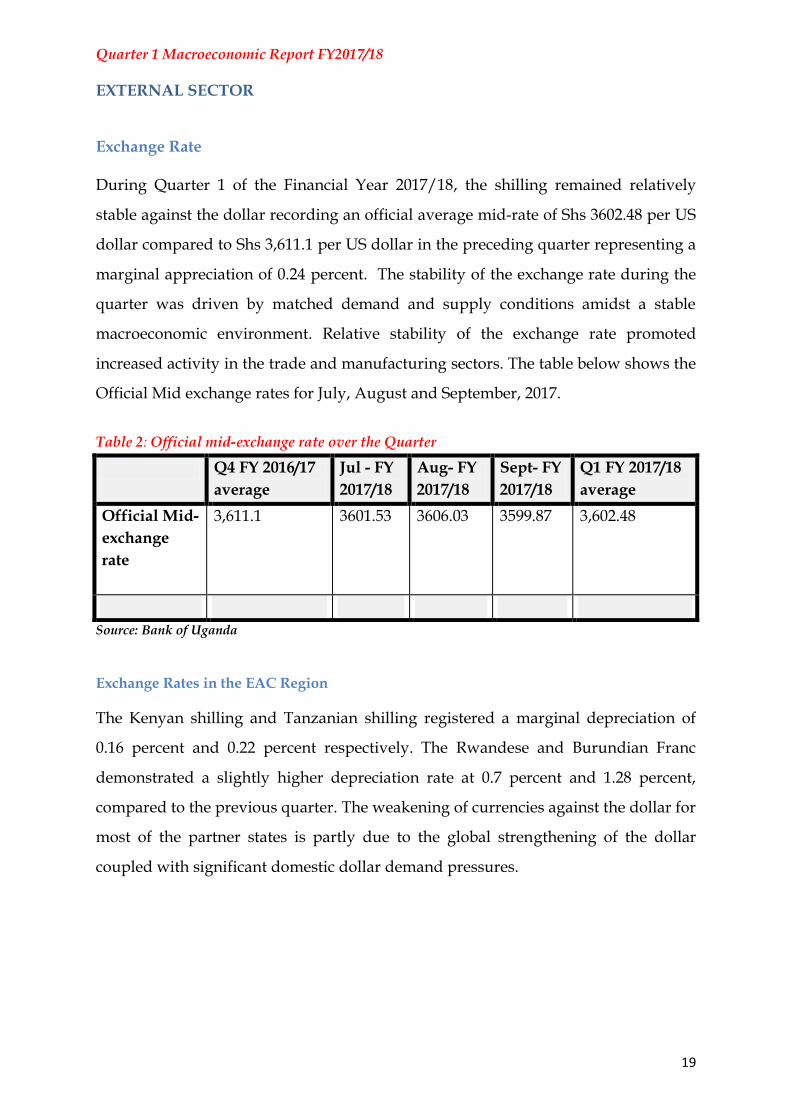
During Quarter 1 of the Financial Year 2017/18, the shilling remained relatively
stable against the dollar recording an official average mid-rate of Shs 3602.48 per US
dollar compared to Shs 3,611.1 per US dollar in the preceding quarter representing a
marginal appreciation of 0.24 percent. The stability of the exchange rate during the
quarter was driven by matched demand and supply conditions amidst a stable
macroeconomic environment. Relative stability of the exchange rate promoted
increased activity in the trade and manufacturing sectors. The table below shows the
Official Mid exchange rates for July, August and September, 2017.
Table 2: Official mid-exchange rate over the Quarter
Q4 FY 2016/17
average
Jul - FY
2017/18
Aug- FY
2017/18
Sept- FY
2017/18
Q1 FY 2017/18
average
Official Mid-
exchange
rate
3,611.1 3601.53 3606.03 3599.87 3,602.48
Source: Bank of Uganda
Exchange Rates in the EAC Region
The Kenyan shilling and Tanzanian shilling registered a marginal depreciation of
0.16 percent and 0.22 percent respectively. The Rwandese and Burundian Franc
demonstrated a slightly higher depreciation rate at 0.7 percent and 1.28 percent,
compared to the previous quarter. The weakening of currencies against the dollar for
most of the partner states is partly due to the global strengthening of the dollar
coupled with significant domestic dollar demand pressures.

Quarter 1 Macroeconomic Report FY2017/18
20
Figure 8: Quarterly Changes in exchange rates in EAC Partner states
Source: Respective Central Banks
Merchandise trade balance
The merchandise trade deficit narrowed by 14.8 percent on an annual basis from a
deficit of US$ 525.4 million in Quarter 1 of the Financial Year 2016/17 to a deficit of
US$ 447.6 million in Quarter 1 of the Financial Year 2017/18 as a result of slow
recovery in the import bill coupled with an increase in exports.
Merchandise exports
The total value of exports grew by 16.8 percent during the quarter to US$ 791.10
million compared to US$ 677.11 the same quarter the previous financial year; this
was largely attributed to a rise in the value of exports of coffee (68.9 percent), maize
(55.3 percent), beans (221.4 percent) and electricity (139.5 percent). This performance
is explained by an increase in international coffee prices and improvements in the
export volumes of coffee 3 (54.5 percent), beans (281.1 percent) and maize (66.7
percent). Coffee was the major export, contributing about 17.1 percent of total
3 The increase in the volumes of coffee is on account of newly planted coffee that has started yielding
and the biennial cycle of Arabica coffee production.
-0.37
0.03
-0.61
-0.44
-1.15
0.24
-0.16
-0.70
-0.22
-1.28 -1.4
-1.2
-1
-0.8
-0.6
-0.4
-0.2
0
0.2
0.4
UGANDA KENYA RWANDA TANZANIA BURUNDI
<--D
ep
reci
atio
n |
Ap
pre
ciat
ion
-->
Q4 2016/17 Q1 2017/18
Quarter 1 Macroeconomic Report FY2017/18
21
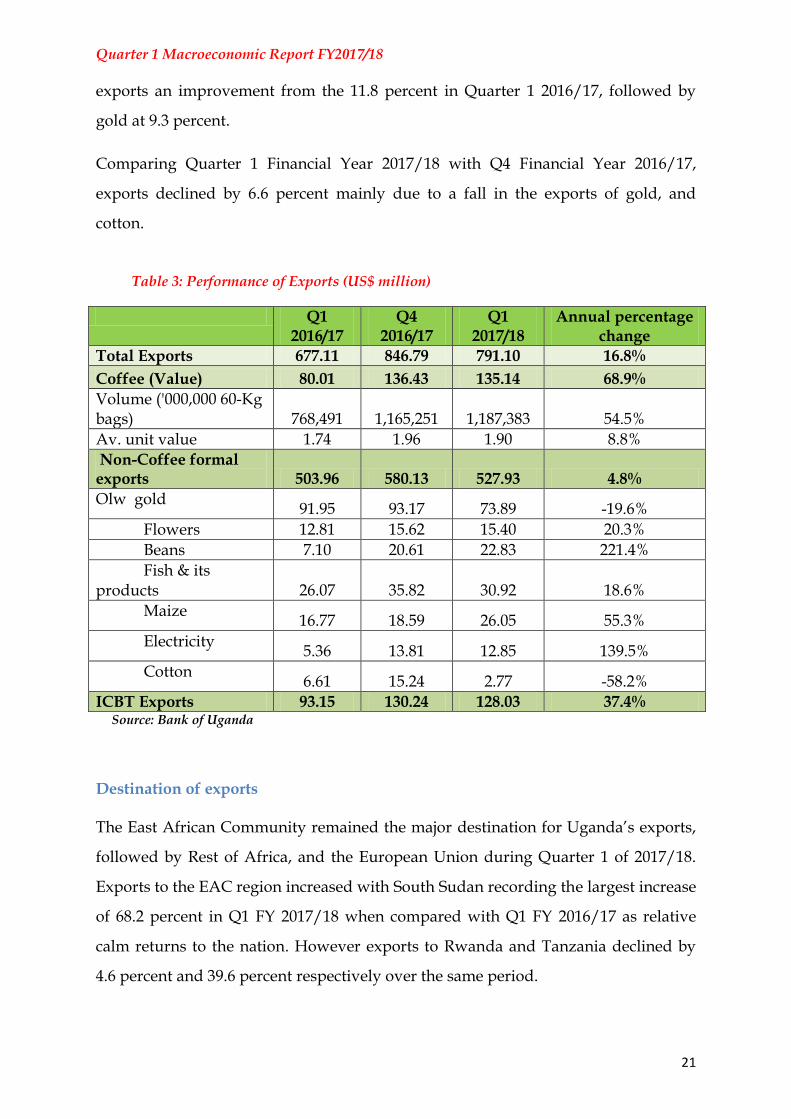
exports an improvement from the 11.8 percent in Quarter 1 2016/17, followed by
gold at 9.3 percent.
Comparing Quarter 1 Financial Year 2017/18 with Q4 Financial Year 2016/17,
exports declined by 6.6 percent mainly due to a fall in the exports of gold, and
cotton.
Table 3: Performance of Exports (US$ million)
Q1 2016/17
Q4 2016/17
Q1 2017/18
Annual percentage change
Total Exports 677.11 846.79 791.10 16.8%
Coffee (Value) 80.01 136.43 135.14 68.9%
Volume ('000,000 60-Kg bags) 768,491 1,165,251 1,187,383 54.5%
Av. unit value 1.74 1.96 1.90 8.8%
Non-Coffee formal exports 503.96 580.13 527.93 4.8%
Olw gold 91.95 93.17 73.89 -19.6%
Flowers 12.81 15.62 15.40 20.3%
Beans 7.10 20.61 22.83 221.4%
Fish & its products 26.07 35.82 30.92 18.6%
Maize 16.77 18.59 26.05 55.3%
Electricity 5.36 13.81 12.85 139.5%
Cotton 6.61 15.24 2.77 -58.2%
ICBT Exports 93.15 130.24 128.03 37.4% Source: Bank of Uganda
Destination of exports
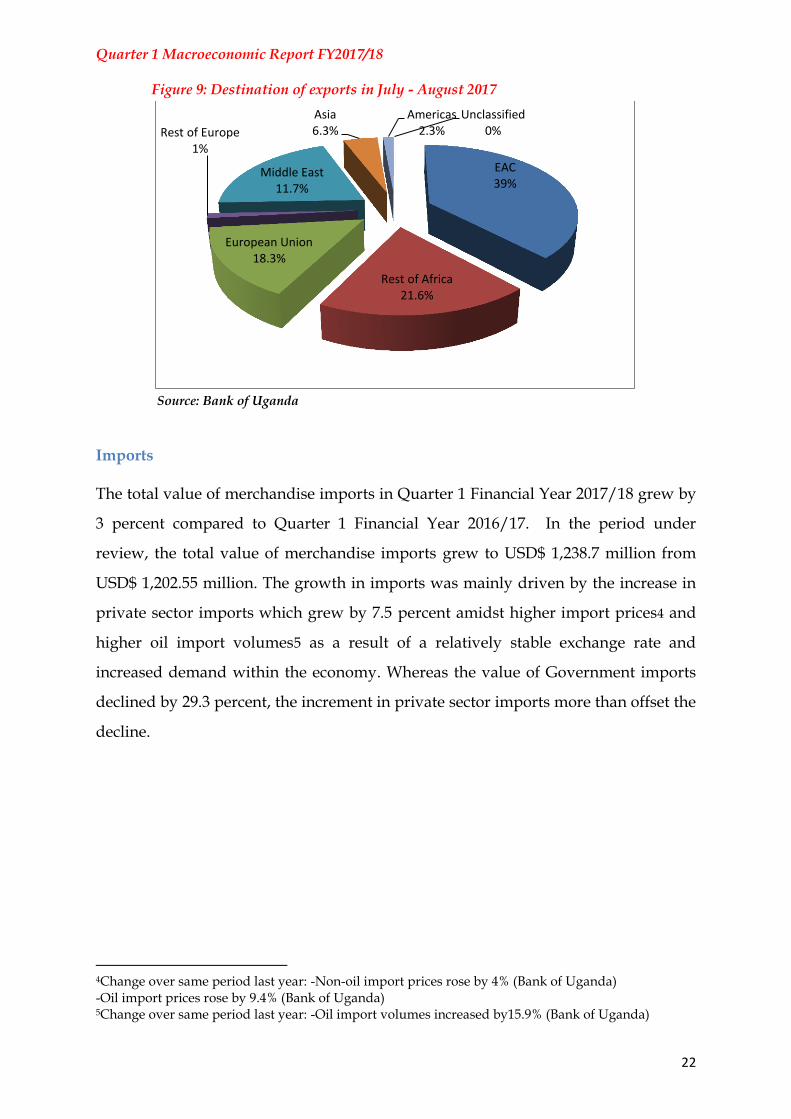
The East African Community remained the major destination for Uganda’s exports,
followed by Rest of Africa, and the European Union during Quarter 1 of 2017/18.
Exports to the EAC region increased with South Sudan recording the largest increase
of 68.2 percent in Q1 FY 2017/18 when compared with Q1 FY 2016/17 as relative
calm returns to the nation. However exports to Rwanda and Tanzania declined by
4.6 percent and 39.6 percent respectively over the same period.
Quarter 1 Macroeconomic Report FY2017/18
22
Figure 9: Destination of exports in July - August 2017
Source: Bank of Uganda
Imports
The total value of merchandise imports in Quarter 1 Financial Year 2017/18 grew by
3 percent compared to Quarter 1 Financial Year 2016/17. In the period under
review, the total value of merchandise imports grew to USD$ 1,238.7 million from
USD$ 1,202.55 million. The growth in imports was mainly driven by the increase in
private sector imports which grew by 7.5 percent amidst higher import prices4 and
higher oil import volumes5 as a result of a relatively stable exchange rate and
increased demand within the economy. Whereas the value of Government imports
declined by 29.3 percent, the increment in private sector imports more than offset the
decline.
4Change over same period last year: -Non-oil import prices rose by 4% (Bank of Uganda) -Oil import prices rose by 9.4% (Bank of Uganda) 5Change over same period last year: -Oil import volumes increased by15.9% (Bank of Uganda)
EAC 39%
Rest of Africa 21.6%
European Union 18.3%
Rest of Europe 1%
Middle East 11.7%
Asia 6.3%
Americas 2.3%
Unclassified 0%
Quarter 1 Macroeconomic Report FY2017/18
23
Table 4: Quarterly Performance of Merchandise imports (Million $ USD)
Q1 FY
2016/17
Q1 FY
2017/18
Quarterly Performance
Comparison
Total Imports (fob)6 1202.55 1238.71 3%
Government Imports 148.01 104.62 -29.3%
Project 134.60 102.30 -24.0%
Non-Project 13.41 2.33 -82.6%
Formal Private Sector Imports 968.78 1052.39 8.6%
Oil imports 154.51 195.82 26.7%
Non-oil imports 814.28 856.57 5.2%
Estimated Private Sector Imports 85.76 81.69 -4.7%
Total Private Sector Imports 1054.54 1134.09 7.5%
Source: Bank of Uganda
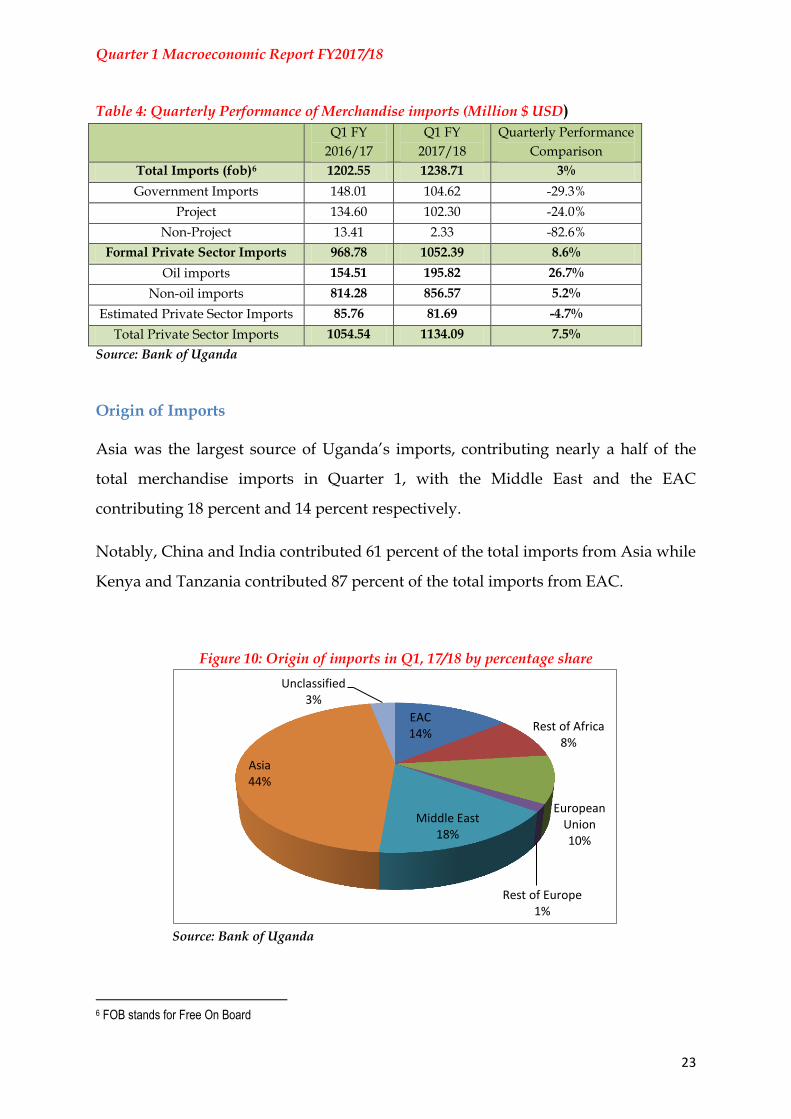
Origin of Imports
Asia was the largest source of Uganda’s imports, contributing nearly a half of the
total merchandise imports in Quarter 1, with the Middle East and the EAC
contributing 18 percent and 14 percent respectively.
Notably, China and India contributed 61 percent of the total imports from Asia while
Kenya and Tanzania contributed 87 percent of the total imports from EAC.
Figure 10: Origin of imports in Q1, 17/18 by percentage share
Source: Bank of Uganda
6 FOB stands for Free On Board
EAC 14%
Rest of Africa 8%
European Union 10%
Rest of Europe 1%
Middle East 18%
Asia 44%
Unclassified 3%

Quarter 1 Macroeconomic Report FY2017/18
24
International reserves
International reserves held by the Central bank stood at 5.2 months of imports of
goods and services as at the end of Quarter 1 Financial Year 2017/18 compared to a
reserve cover of 5.3 months of imports held at the end of Quarter 1 Financial Year
2016/17. This is largely in line with the targeted reserve cover as stipulated by the
EAMU protocol.
Quarter 1 Macroeconomic Report FY2017/18
25
FISCAL SECTOR
DEVELOPMENTS
Quarter 1 Macroeconomic Report FY2017/18
26
FISCAL SECTOR
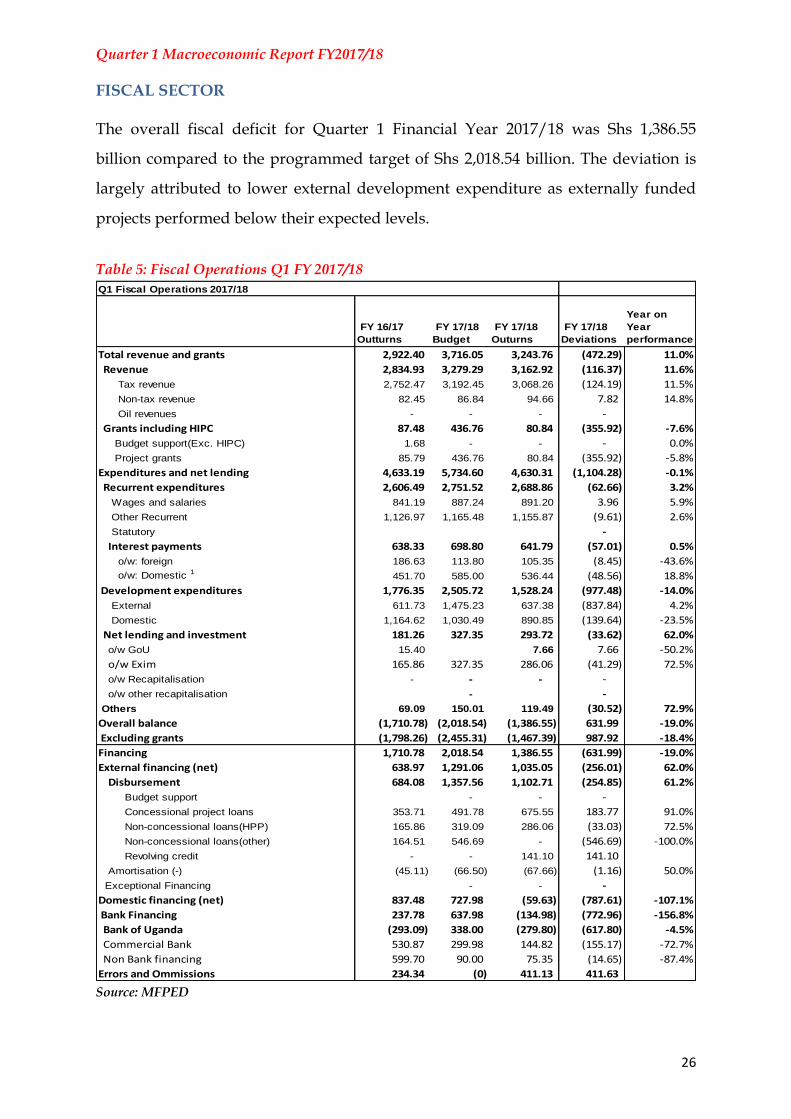
The overall fiscal deficit for Quarter 1 Financial Year 2017/18 was Shs 1,386.55
billion compared to the programmed target of Shs 2,018.54 billion. The deviation is
largely attributed to lower external development expenditure as externally funded
projects performed below their expected levels.
Table 5: Fiscal Operations Q1 FY 2017/18
Source: MFPED
Q1 Fiscal Operations 2017/18
FY 16/17
Outturns
FY 17/18
Budget
FY 17/18
Outurns
FY 17/18
Deviations
Year on
Year
performance
Total revenue and grants 2,922.40 3,716.05 3,243.76 (472.29) 11.0%
Revenue 2,834.93 3,279.29 3,162.92 (116.37) 11.6%
Tax revenue 2,752.47 3,192.45 3,068.26 (124.19) 11.5%
Non-tax revenue 82.45 86.84 94.66 7.82 14.8%
Oil revenues - - - -
Grants including HIPC 87.48 436.76 80.84 (355.92) -7.6%
Budget support(Exc. HIPC) 1.68 - - - 0.0%
Project grants 85.79 436.76 80.84 (355.92) -5.8%
Expenditures and net lending 4,633.19 5,734.60 4,630.31 (1,104.28) -0.1%
Recurrent expenditures 2,606.49 2,751.52 2,688.86 (62.66) 3.2%
Wages and salaries 841.19 887.24 891.20 3.96 5.9%
Other Recurrent 1,126.97 1,165.48 1,155.87 (9.61) 2.6%
Statutory -
Interest payments 638.33 698.80 641.79 (57.01) 0.5%
o/w: foreign 186.63 113.80 105.35 (8.45) -43.6%
o/w: Domestic 1451.70 585.00 536.44 (48.56) 18.8%
Development expenditures 1,776.35 2,505.72 1,528.24 (977.48) -14.0%
External 611.73 1,475.23 637.38 (837.84) 4.2%
Domestic 1,164.62 1,030.49 890.85 (139.64) -23.5%
Net lending and investment 181.26 327.35 293.72 (33.62) 62.0%
o/w GoU 15.40 7.66 7.66 -50.2%
o/w Exim 165.86 327.35 286.06 (41.29) 72.5%
o/w Recapitalisation - - - -
o/w other recapitalisation - -
Others 69.09 150.01 119.49 (30.52) 72.9%
Overall balance (1,710.78) (2,018.54) (1,386.55) 631.99 -19.0%
Excluding grants (1,798.26) (2,455.31) (1,467.39) 987.92 -18.4%
Financing 1,710.78 2,018.54 1,386.55 (631.99) -19.0%
External financing (net) 638.97 1,291.06 1,035.05 (256.01) 62.0%
Disbursement 684.08 1,357.56 1,102.71 (254.85) 61.2%
Budget support - - -
Concessional project loans 353.71 491.78 675.55 183.77 91.0%
Non-concessional loans(HPP) 165.86 319.09 286.06 (33.03) 72.5%
Non-concessional loans(other) 164.51 546.69 - (546.69) -100.0%
Revolving credit - - 141.10 141.10
Amortisation (-) (45.11) (66.50) (67.66) (1.16) 50.0%
Exceptional Financing - - -
Domestic financing (net) 837.48 727.98 (59.63) (787.61) -107.1%
Bank Financing 237.78 637.98 (134.98) (772.96) -156.8%
Bank of Uganda (293.09) 338.00 (279.80) (617.80) -4.5%
Commercial Bank 530.87 299.98 144.82 (155.17) -72.7%
Non Bank financing 599.70 90.00 75.35 (14.65) -87.4%
Errors and Ommissions 234.34 (0) 411.13 411.63

Quarter 1 Macroeconomic Report FY2017/18
27
Revenue performance
Tax collections during Quarter 1 Financial Year 2017/18 posted a shortfall of
Shs.124.19 billion. This was largely due to an under performance in indirect
domestic taxes which performed at 94 percent; and taxes on international trade and
transactions which performed at 97 percent of their respective programs. The
shortfalls in indirect taxes were realized in both VAT and Excise duty.
Excise duty was mainly affected by performance of sugar, cigarettes, phone talk
time, cement and beer. Phone talk time declined due to, increased use of data over
airtime to make calls and deactivation of un-registered sim-cards. Sugar on the other
side was affected by strikes among sugar growers over low prices offered by the
sugar companies which resulted into reduction in sugar production.
The performance of international trade taxes was attributed to decline in taxable
imports during the quarter such as rice, footwear, ethyl alcohol, tiles. However, it
should be noted that there has been growth in imports volumes in the country in
Quarter 1 Financial Year 2017/18 compared to the same period in the previous
financial year, though most of these imports originate from within the EAC
boundaries and are duty free because of the trade integration agreements.
Although direct taxes performed below target, withholding tax performed higher
than the target due to more securities maturing within the quarter. Never the less,
the tax performance for the first quarter of 2017/18 was higher compared to the
performance in the first quarter of 2016/17 by 16 percent. This was partly due to the
introduction of new measures and strengthening of tax administrative measures
which raised Shs 47.65 billion by end of the first quarter of 2017/18. The tax measure
of reinstating VAT on wheat grain at 18 percent raised Shs 27.7 billion in the first
quarter.
Grant disbursements during the first quarter of the financial year amounted to
Shs80.84 billion against the programmed Shs 436.76 billion. Project grants performed
at only 19 percent of the program due to low project absorption. This is an 8 percent

Quarter 1 Macroeconomic Report FY2017/18
28
decline from the grant disbursements received during the first quarter of the
Financial Year 2016/17
Expenditure Performance
Total expenditure and net lending in Quarter 1 Financial Year 2017/18 amounted to
Shs 4,630.31 billion which is lower than planned by Shs 1,104.28 billion. This
performance was attributed to lower than anticipated external development
expenditure which performed at only 43 percent and domestic development which
performed at 86 percent respectively.
Recurrent expenditure performed below the planned program level of Shs 2,751.52
billion by Shs62.66 billion. This was due to lower than anticipated interest payments
and other current expenditure. Salaries on the other hand were higher than the
program by Shs 3.96 billion due to additional cash limits provided to Universities.
External disbursements amounted to Shs 1,102.71 billion against the program of Shs
1,357.56 billion in the period. Of this Shs. 286.06 was received for Hydro Power
Projects (Karuma). A total of USD 39.1 million from the PTA loan that was
previously budgeted for in the Financial Year 2016/17 was received in this quarter.
Domestic Financing (Treasury Instruments)
In Quarter 1 Financial Year 2017/18, Shs. 1661.9 billion (at cost) was raised. Of the
total amount raised, Shs. 1,048.1 billion was from Treasury Bills while Shs. 613.8
billion was from Treasury Bonds. Shs. 1271.5 billion was used for refinancing
maturing securities whilst Shs 390.5 billion went towards financing the Government
budget.
Table 6: Details for Domestic Financing for FY 2017/18, Shs.bn
UGX Total
issuance
Net domestic
financing Refinancing
July 2017 494.4 198.2 296.3
August 2017 666.7 133.9 532.8
September 2017 500.8 58.4 442.4
Total 1661.9 390.5 1271.5
Source: Auction results, MoFPED

Quarter 1 Macroeconomic Report FY2017/18
29