ministry of environment and energy second national ... · dr. mizna mohamed ali shareef. zammath...
TRANSCRIPT

Second National Communication of Maldives October 2016
MINISTRY OF ENVIRONMENT AND ENERGY
to the United Nations Framework Convention on Climate Change

Second National Communication of Maldives October 2016
MINISTRY OF ENVIRONMENT AND ENERGY
to the United Nations Framework Convention on Climate Change

iii
SNC TeamCoordinating Lead Authors:Dr. Mizna MohamedAli ShareefZammath KhaleelMareer Mohamed HusnyAishath Aileen NiyazAmjad Abdulla
Review Editors:Ahmed WaheedHamdhoon MohamedAishath Hassan
Peer Reviewer:Ahmed Jameel
Contributing Authors:Hussein Zahir Mohamed Asif Ahmed Rasheed Dr. Zahid Mohamed Musthafa Aishath Thimna Latheef Ibrahim Mohamed
Survey and Data Collection Team:Abdul RasheedAhmed MurthazaAhmed ShanHassan AzharLuayyu AdamMahid Abdul RahmanMariyam UmanaMohamed ShujuanShama RasheedShurufa NaseerAhmed FalahAli MishalHussain ShufranAminath InayaWater Solutions Pvt Ltd (DEM)
Concept Design and Layout by
Ma.Raahaa, Koarukendi MaguMale, Maldives
Ministry of Environment and Energy, 2016Published by Ministry of Environment and EnergyGreen Building, Handhuvaree Hingun, MaafannuMale’, 20392Republic of Maldiveswww.environment.gov.mv
ISBN: 978-99915-59-30-8
Please cite this report as:MEE, (2016). Second National Communication of Maldives to the United Nations Framework Convention on Climate Change: Ministry of Environment and Energy

Second National Communication of Maldives to the United Nations Framework Convention on Climate Changeiv
Aknowledgements The Second National Communications of the Maldives to the United Nations Framework is prepared by the Climate Change Department of the Ministry of Environment and Energy (MEE). The underlying data collections, analysis and assessments were carried with the generous assistance from the respective stakeholders. Ministry wishes to acknowledge the invaluable contribution from the Global Environment Facility (GEF) and the United Nations Environment Program (UNEP) in provision of the finance and technical guidance in preparation of this report.
The authors would like to thank His Excellency Mr. Thoriq Ibrahim, Minister of Environment and Energy, His Excellency Mr. Abdullahi Majeed, Minister of State for Environment and Energy and Mr. Ajwad Musthafa, Permanent Secretary of the Ministry of Environment and Energy for their continuous support and guidance during the process.
The authors are also grateful to the respective government Ministries and agencies and other stakeholders across several sectors for their involvement during the course of the preparation of the report. The authors also thanks and recognizes the generous contribution by the Water Solutions Pvt Ltd for their work in undertaking the field data collection and for the SNC team for their dedication and hardwork.

v
ForewordIt is an undeniable fact that Maldives is one of the lowest lying island nations in the world. Climate change poses serious challenges to our development on multiple fronts. Our geography, developmental challenges and the narrow economy is aggravating the issue further.
In recent times, we have been hearing that each successive year keeps breaking previous records for high temperatures. The recent scientific assessments gave bleak prospects on climate change reconfirming that SIDS are among the most vulnerable and least defensible to the projected impacts of climate change and associated sea level rise. Climate change not only poses a development challenge, but an existential threat for Maldives and many other small island states. This inevitable and urgent global challenge need to be addressed urgently and swiftly.
The hope for international cooperation in addressing climate change was renewed with historic Paris Agreement in December 2015, Maldivians are determined that with the support of the international community, we can still tackle climate change. Even though we are a miniscule contributor to its causes, we strive to lead by example in both mitigation and adaptation. Since our initial National Communication in 2001, we have made significant progress in both aspects. We are investing immense effort and resources in adaptation measures and actions ranging from enhancing water security and coastal protection, to building resilient infrastructure and communities among others. We have made strides in transforming our energy sector towards renewables. We are making the necessary policy changes to flourish an enabling and a trusted environment to attract the public and the private sector investments in low emission and climate resilient developments. In this respect, I Thank the President for his continuous support and his encouragement for the protection of our environment.
As climate change does not respect borders, the issue cannot be tackled without serious action at the global level. As such, for the past three decades, Maldives has been a strong advocate for international climate action. The leadership we have demonstrated in establishing the Alliance of Small Island States and as the current Chair truly demonstrated our commitment and dedication for climate action.
Maldives will continue our efforts at both local and global levels. Addressing climate change will be necessary for our sustainable development and the wellbeing of the generations to come.
Thoriq Ibrahim
Minister of Environment and Energy

Second National Communication of Maldives to the United Nations Framework Convention on Climate Changevi
ADB Asian Development BankADRC Asian Disaster Reduction CenterAFOLU Agriculture, Forestry and Land Use ARI Acute Respiratory InfectionBAU Business As UsualCO2e Carbon dioxide equivalentDHF Dengue Haemorrhagic feverDHI Danish Hydraulic InstituteDNP Department of National PlanningDSS Dengue Sudden Shock SyndromeENSO El-Nino Southern OscillationsERC Environment Research CenterFAD Fish Aggregating DevicesFAO Food and Agricultural OrganizationGCF Green Climate FundGDP Gross Domestic ProductGEF Global Environment FacilityGCM Global Climate ModelGg Giga GramsGHG Greenhouse GasGNI Gross National IndexGWP Global Warming PotentialHDI Human Development IndexHPA Health protection AgencyICAO International Civil Aviation
OrganizationIOD Indian Ocean DipoleIPCC Intergovernmental Panel on Climate
ChangeJCM Joint Crediting MechanismkWh Kilo Watt HourLCOE Levelized Cost of ElectricityLDCF Least Developed Countries FundMASPLAN Fisheries Master planMEE Ministry of Environment and EnergyMEEW Ministry of Environment Energy and
WaterMHAHE Ministry of Home Affairs Housing and
EnvironmentMHE Ministry of Housing and EnvironmentMHTE Ministry of Housing Transport and
EnvironmentMJO Madden-Jullian Oscillation
MMS Maldives Meteorological ServicesMoFA Ministry of Fisheries and AgricultureMoFT Ministry of Finance and TreasuryMoH Ministry of HealthMoHG Ministry of Health and GenderMoT Ministry of TourismMoTAC Ministry of Tourism Arts and CultureMPND Ministry of Planning and National
DevelopmentMRC Marine Research CenterMWSA Maldives Water and Sanitation AuthorityNAI Non Annex INAPA National Adaptation Program of ActionNBS National Bureau of StatisticsNCSA National Capacity Self-AssessmentNCD Non Communicable DiseasesNDMC National Disaster Management CenterNEAP National Environmental Action PlanNGIS National Geographic Information SystemNSDS National Sustainable Development
StrategyOTEC Ocean Thermal Energy Conversion PPP Power Purchasing ParitySAARC South Asian Association for Regional
CooperationSGP Small Grants ProgrammeSIDAS SEARO Integrated Data Analysis SystemSIDS Small Island Developing StatesSLCP Shot Lived Climate PollutantsSRES Special Report on Emissions ScenariosRIMES Regional Integrated Multi-Hazard Early
Warning SystemTNA Technology Needs AssessmentToe Tons of Oil EquivalentUNFCCC United Nations Framework Convention
on Climate ChangeWB World BankWTE Waste to Energy
Acronyms

vii
ContentsAknowledgements ����������������������������������������������������������������������������� ivForeword ������������������������������������������������������������������������������������������ vAcronyms ���������������������������������������������������������������������������������������� viExecutive Summary ����������������������������������������������������������������������������� 2
National Circumstance ------------------------------------------------------------------------------------ 2Current and Future Climate projections ----------------------------------------------------------------- 3Natural Disasters and Extreme Events ------------------------------------------------------------------- 3National GHG Inventory ---------------------------------------------------------------------------------- 4Mitigation of GHGs --------------------------------------------------------------------------------------- 4Vulnerability to Climate Change ------------------------------------------------------------------------- 4
Land loss, Beach Erosion and Human Settlements ------------------------------------------------- 4Critical Infrastructure ------------------------------------------------------------------------------- 5Water Resources -------------------------------------------------------------------------------------- 5Coral Reefs -------------------------------------------------------------------------------------------- 5Agriculture and Food Security ---------------------------------------------------------------------- 5Human Health --------------------------------------------------------------------------------------- 6Fisheries ----------------------------------------------------------------------------------------------- 6Tourism ----------------------------------------------------------------------------------------------- 6
Adaptation to Climate Change --------------------------------------------------------------------------- 6Land loss, Beach Erosion and Human Settlements ------------------------------------------------- 6Water Resources -------------------------------------------------------------------------------------- 7Coral Reefs -------------------------------------------------------------------------------------------- 7Agriculture and Food Security ----------------------------------------------------------------------- 7Fisheries ----------------------------------------------------------------------------------------------- 7Human Health ---------------------------------------------------------------------------------------- 7Population and Development Consolidation -------------------------------------------------------- 8Tourism ----------------------------------------------------------------------------------------------- 8
Other Information ----------------------------------------------------------------------------------------- 8Constraints -------------------------------------------------------------------------------------------- 8
1. Introduction ���������������������������������������������������������������������������������� 101.1 Institutional arrangements ---------------------------------------------------------------------------11
2. National Circumstances �������������������������������������������������������������������� 142.1 Geography of Maldives -------------------------------------------------------------------------------142.2 Climate ------------------------------------------------------------------------------------------------17
2.2.1 Temperature ------------------------------------------------------------------------------------172.2.2 Wind --------------------------------------------------------------------------------------------172.2.3 Rainfall -----------------------------------------------------------------------------------------17

Second National Communication of Maldives to the United Nations Framework Convention on Climate Changeviii
2.3 Biodiversity -------------------------------------------------------------------------------------------182.3.1 Terrestrial Biodiversity -------------------------------------------------------------------------182.3.2 Marine Biodiversity ----------------------------------------------------------------------------19
2.4 Socio-Economic circumstances ----------------------------------------------------------------------192.4.1 Demography ------------------------------------------------------------------------------------192.4.2 Human Development -------------------------------------------------------------------------202.4.3 The Economy -----------------------------------------------------------------------------------21
2.5 Tourism -----------------------------------------------------------------------------------------------232.6 Fisheries -----------------------------------------------------------------------------------------------242.7 Food Security and Agriculture ----------------------------------------------------------------------252.8 Water Resources --------------------------------------------------------------------------------------262.9 Waste Management -----------------------------------------------------------------------------------272.10 Health ------------------------------------------------------------------------------------------------27
2.10.1 Burden of Diseases ----------------------------------------------------------------------------282.10.2 Health Care System ---------------------------------------------------------------------------28
3. Current and Future Climate Projections �������������������������������������������������303.1 Current trends ----------------------------------------------------------------------------------------30
3.1.1 Rainfall -----------------------------------------------------------------------------------------303.1.4 Sea surface temperatures -----------------------------------------------------------------------313.2 Future climate projections -----------------------------------------------------------------------313.2.2 Temperature ------------------------------------------------------------------------------------323.2.3 Sea level change --------------------------------------------------------------------------------323.2.4 Sea surface temperature -----------------------------------------------------------------------34
4. Natural Disasters and Extreme Events����������������������������������������������������364.1 Earthquakes and Tsunami events -------------------------------------------------------------------374.2 Cyclones and thunderstorms ------------------------------------------------------------------------384.3 Flooding due to rain ----------------------------------------------------------------------------------394.4 Drought -----------------------------------------------------------------------------------------------404.5 Storm surges ------------------------------------------------------------------------------------------414.6 Strong winds and tornados --------------------------------------------------------------------------42
5. National Greenhouse Gas Inventory ������������������������������������������������������445.1 Methodology ----------------------------------------------------------------------------------------- 44
5.1.1 Key Category Analysis -------------------------------------------------------------------------455.1.2 Data Collection ---------------------------------------------------------------------------------455.1.3 Uncertainty and Assumptions-----------------------------------------------------------------455.1.4 Verification and Validation --------------------------------------------------------------------465.2 Maldives GHG emission 2011 -------------------------------------------------------------------465.2.1 Energy use --------------------------------------------------------------------------------------465.2.1.1 Electricity Generation ------------------------------------------------------------------------475.2.1.2 Transport -------------------------------------------------------------------------------------475.2.1.3 Other Energy Sectors ------------------------------------------------------------------------485.2.2 Waste -------------------------------------------------------------------------------------------48
5.3 GHG Emission Trends -------------------------------------------------------------------------------49

ix
5.4 Comparison of GHG emission -----------------------------------------------------------------------506. Mitigation �������������������������������������������������������������������������������������52
6.1 Energy Sector -----------------------------------------------------------------------------------------526.1.1.2 Energy Efficiency -----------------------------------------------------------------------------576.1.2 Transport ---------------------------------------------------------------------------------------586.1.3 Others Energy Sectors -------------------------------------------------------------------------596.2 Waste ---------------------------------------------------------------------------------------------59
6.3 International Cooperation ---------------------------------------------------------------------------606.4 Measures for future consideration -------------------------------------------------------------------60
7. Vulnerability to Climate Change ����������������������������������������������������������647.1 Land Loss, Beach Erosion and Human Settlements ------------------------------------------------67
7.1.1 Coastal Erosion and Land Loss ----------------------------------------------------------------677.1.2 Coastal inundation under future projections -------------------------------------------------677.1.3 Human Settlements ----------------------------------------------------------------------------687.1.4 Critical Infrastructure--------------------------------------------------------------------------69
7.2 Freshwater Resources ---------------------------------------------------------------------------------707.2.1 Groundwater -----------------------------------------------------------------------------------707.2.2 Rainwater ---------------------------------------------------------------------------------------74
7.3 Coral Reef ---------------------------------------------------------------------------------------------757.3.1 Impact of Sea Surface Temperature (SST) on coral reef --------------------------------------76
7.3.1.1 Bleaching episodes from 1998–2010 ----------------------------------------------------777.3.1.2 Impacts with future projections of sea surface temperature --------------------------77
7.3.2 Impact of ocean acidification on coral reef ---------------------------------------------------777.4 Food Security and Agriculture -----------------------------------------------------------------------78
7.4.1 Limited Agricultural Production -------------------------------------------------------------787.4.2 Heavy import dependency --------------------------------------------------------------------797.4.3 Storage and distribution challenges -----------------------------------------------------------79
7.5 Human Health ----------------------------------------------------------------------------------------817.5.1 Direct health impacts --------------------------------------------------------------------------817.5.2 Indirect impacts --------------------------------------------------------------------------------82
7.5.2.2 Air Quality -------------------------------------------------------------------------------837.6 Fisheries -----------------------------------------------------------------------------------------------84
7.6.1 Impact of Increased sea surface temperatures on fisheries -----------------------------------847.6.2 Impact of Ocean acidification on fisheries ----------------------------------------------------85
7.7 Tourism ------------------------------------------------------------------------------------------------867.7.2 Increase in extreme events ---------------------------------------------------------------------867.7.3 Sea level Rise ------------------------------------------------------------------------------------867.7.4 Increase in Sea Surface Temperatures ---------------------------------------------------------877.7.5 Impact of Mitigation action --------------------------------------------------------------------87
8. Adaptation to Climate Change ������������������������������������������������������������928.1 Land Loss and Beach Erosion -----------------------------------------------------------------------92
8.1.1 ‘Hard’Engineered Measures -------------------------------------------------------------------938.1.2 Soft Measures: ----------------------------------------------------------------------------------93

Second National Communication of Maldives to the United Nations Framework Convention on Climate Changex
8.2 Water Resource ---------------------------------------------------------------------------------------948.2.2 Groundwater protection -----------------------------------------------------------------------958.2.3 Storm water management ---------------------------------------------------------------------958.2.4 Desalination ------------------------------------------------------------------------------------95
8.3 Coral Reefs --------------------------------------------------------------------------------------------968.3.1 Coral Reef Monitoring: -----------------------------------------------------------------------968.3.2 Coral Reef Valuation: -------------------------------------------------------------------------978.3.3 Marine Protected Areas (MPAs): -------------------------------------------------------------97
8.4 Food security -----------------------------------------------------------------------------------------998.4.1 Increased local production and reduce import dependency ---------------------------------998.4.2 Storage and distribution --------------------------------------------------------------------- 100
8.5 Fisheries --------------------------------------------------------------------------------------------- 1008.5.1 Improve fish finding and fish harvesting and handling ----------------------------------- 1018.5.2 Establish aquaculture/mariculture ---------------------------------------------------------- 1018.5.3 Live bait sustainability ----------------------------------------------------------------------- 1018.5.4 Integrated reef fishery management. ------------------------------------------------------ 102
8.6 Human Health -------------------------------------------------------------------------------------- 1028.6.1 Public Health Surveillance ------------------------------------------------------------------ 1028.6.2 Control of vector borne disease ------------------------------------------------------------- 1038.6.3 Access to health care ------------------------------------------------------------------------- 103
8.7 Population and development consolidation ------------------------------------------------------ 1048.8 Tourism --------------------------------------------------------------------------------------------- 105
8.8.1 Community based adaptation --------------------------------------------------------------- 1068.8.2 Introduction of climate proof technologies ------------------------------------------------- 1068.8.3 Risk management ---------------------------------------------------------------------------- 106
9. Other Information ������������������������������������������������������������������������� 1089.1 Activities relating to technology transfer ---------------------------------------------------------- 1089.2 Climate change research and systematic observation -------------------------------------------- 1099.3 Information on research programmes --------------------------------------------------------------1119.4 Information on education, training and public awareness --------------------------------------- 1129.5 Capacity building ----------------------------------------------------------------------------------- 1139.6 Information and networking ------------------------------------------------------------------------114
10. Constraints, Gaps, Financial and Technical Capacity Needs �����������������������11610.1 Data availability and quality ----------------------------------------------------------------------116
10.1.1 Constraints and gaps -------------------------------------------------------------------------11610.1.2 Capacity building needs ---------------------------------------------------------------------117
10.2 Adaptation and Mitigation Technology Gaps-----------------------------------------------------11710.2.1 Constraints and gaps ------------------------------------------------------------------------11710.2.2 Capacity building needs ---------------------------------------------------------------------117
10.3 Institutional and Individual Capacity -------------------------------------------------------------11810.3.1 Constraints and gaps ------------------------------------------------------------------------11810.3.2 Capacity building needs ---------------------------------------------------------------------118
10.4 Financial and Technical Assistance Received ---------------------------------------------------- 119

xi
Annex A. References ������������������������������������������������������������������������� 122Annex B. GHG Inventory 2011 ������������������������������������������������������������������������� 130Annex C. List of historical disasters ������������������������������������������������������������������� 133Annex D. Vulnerability and Adaptation Assessment Methodology� Coastal Vulnerability �� 137Annex E. Vulnerability and Adaptation Assessment Methodology � Fresh Water Resources � 139Annex F. Rainfall threshold categories and associated impacts ����������������������������������� 140Annex G. Bleaching Risk Assessment Tool (BRAT) ��������������������������������������������������141

Second National Communication of Maldives to the United Nations Framework Convention on Climate Changexii
List Of TablesTable 2�1: Water levels of the tide stations. Sea level data are obtained from the University of Hawaii
Sea Level Center database. The best available years of continous data as in the table is used in the analysis ----------------------------------------------------------------------------------------18
Table 2�2: Concentration of population in islands (adapted from NBS, 2015a). --------------------------20
Table 2�3: Incidence of selected communicable diseases 2011-2015 (data source: HPA, 2016a)----------28
Table 2�4: Distribution of government health facilities at primary, Regional, Atoll and tertiary levels of care -------------------------------------------------------------------------------------28
Table 5�1: Global Warming Potential (GWP) values from Second Assessment Report (SAR) -----------45
Table 5�2: Data sources for GHG inventory Sectoral approach --------------------------------------------45
Table 5�3: Uncertainties and assumptions in the GHG Inventory 2011 -----------------------------------46
Table 5�4: 2011 GHG emission Summary Table ------------------------------------------------------------46
Table 5�5: Comparison of GHG inventory for 1994 and 2011 ---------------------------------------------49
Table 6�1: Generation system efficiencies around the country (adapted from MEA, 2014) --------------58
Table 7�1: Case study islands for assessing coastal vulnerability ------------------------------------------67
Table 7�2: Criteria for coastal vulnerability -----------------------------------------------------------------69
Table 7�3: Indicators of groundwater quality in study islands ---------------------------------------------71
Table 7�4: Rate of reef recovery from 1998-2012------------------------------------------------------------76
Table 7�5: Food storage facilities operated by STO ---------------------------------------------------------80
Table 7�6: Summary findings of health related impacts ---------------------------------------------------82
Table 7�7: Major climate change impacts on the Maldives tourism sector --------------------------------86
Table 7�8: Impact of introducing a carbon price on ticket price and demand for air travel -------------87
Table 9�1: Maldives observation network ----------------------------------------------------------------- 110
Table 9�2: Summary of membership initiatives -----------------------------------------------------------114
Table 10�1: Key financial assistance received to address the climate change issues -------------------- 119

xiii
List Of FiguresFigure 1�1: Institutional arrangement for the National Communication Process. -----------------------12
Figure 2�1: Map and location of Maldives ------------------------------------------------------------------14
Figure 2�2: The geological structure of Maldives (adapted from Kench, 2011). ---------------------------14
Figure 2�3: Spatial variation in the characteristics of the atolls (adapted from Kench, 2011) ------------14
Figure 2�4: Map of Maldives (source: Water Solutions Pvt Ltd 2016). ------------------------------------16
Figure 2�5: Monthly long-term mean temperature --------------------------------------------------------17
Figure 2�6: Spatial distribution of wind speed and directions from 2003-2012. Data from MMS.------17
Figure 2�7: Regional variation of mean monthly rainfall in the Maldives --------------------------------17
Figure 2�8: Spatial distribution of mean annual rainfall (1992 – 2012). ----------------------------------18
Figure 2�9: Tide observed in Maldives is mixed diurnal in nature ----------------------------------------18
Figure 2�10: Growth of population and projected population excluding expatriates (data source: Department of National Planning, 2015). ----------------------------------------------------20
Figure 2�11: Population age group distribution for 2006 and 2014 census (adapted from NBS, 2015a) -20
Figure 2�12: Population density of the capital islands (population based on 2014 census) --------------20
Figure 2�13: Maldives compared to the rest of the world on HDI (adapted from UNDP, 2014) ---------20
Figure 2�14: Comparison of the regional HDI within Maldives (adapted from UNDP, 2014) -----------21
Figure 2�15: GDP per capita at 2003 constant prices (USD) and growth rate (data source: NBS, 2015c). ---------------------------------------------------------------------21
Figure 2�16: Share of the main sectors to the GDP (data source: NBS, 2015c) ----------------------------22
Figure 2�18: Annual rate of inflation (data source: NBS, 2016) -------------------------------------------22
Figure 2�17: Real GDP growth at 1995 constant prices 1985-2010. Source (MED, 2013). ----------------22
Figure 2�19: Maldives balance of payment 1986-2012 (adapted from MED, 2013) -----------------------22
Figure 2�20: Tourist arrival 2000-2014 (data source: NBS, 2015c) -----------------------------------------23
Figure 2�21: Reasons why Maldives is chosen as a holiday destination by tourists (data source: MoTAC, 2012) --------------------------------------------------------------------------------------------23
Figure 2�22: Bed occupancy in peak season and off season -----------------------------------------------24
Figure 2�24: Fish landing from 1970 to 2014 (data source: DNP) -----------------------------------------24
Figure 2�23: Trends in Export and local Consumption of fish from 2000-2013 (data source; Maldives Customs Data and Fisheries statistics years books, Ministry of Fisheries and Agriculture). -------------------------------------------------------24

Second National Communication of Maldives to the United Nations Framework Convention on Climate Changexiv
Figure 2�25: GDP value contribution from Agriculture from 2003 to 2014 (data source: NBS, 2015c) -25
Figure 2�26: Food items imported to the Maldives from 2010 to 2014 (data source: MCS, 2010; 2011; 2012; 2013). -------------------------------------------------------------------------------------26
Figure 2�27: Schematic showing a typical water lens of an island(adapted from White et al., 2007) ----26
Figure 2�28: Infant mortality rate 1984-2014 (data source: DNP, 2010; 2015c; HPA, 2016b) -------------27
Figure 3�1: Annual rainfall anomaly over the Maldives from 1967-2012 ---------------------------------30
Figure 3�2: Time series of annual number of rain days ----------------------------------------------------30
Figure 3�3: Time series of annual mean temperature -----------------------------------------------------31
Figure 3�4: Regional sea level anomaly for the Maldives from 1991 to 2012 -----------------------------31
Figure 3�5: Sea surface trend in central Maldives (1951-2010) (data source: Rayner et al., 2003) --------31
Figure 3�6: Dissagregation of regional zones used for climate projections (adopted from MEE, 2015a) 32
Figure 3�7: Changes in monsoonal rainfall from IPRC RegCM scenario for time slices (2021-2050) and (2082-2100) from baseline (1980-2000). Rainfall change for months MJJASO in %. (adopted from MEE, 2015a) ---------------------------------------------------------------------32
Figure 3�8: IPRC RegCM annual mean temperature projections (SRES A1B: 2021-2050 & 2082-2100)(adopted from MEE, 2015a) --------------------------------------------------------------------33
Figure 3�9: Changes in temperature from IPRC RegCM scenario for time slices (2021-2050) and (2082-2100). Baseline is (1980-2000). Temperature change for months MJJASO in degree Celsius. (adapted from MEE, 2015a) --------------------------------------------------------------------33
Figure 3�10: Annual mean sea surface height projections with respect to MSL. Grey shades indicate the range of uncertainty of maximum sea level (adopted from MEE, 2015a) ------------------33
Figure 3�11: Time series of global mean levels (deviation from the 1980-1999 mean) in the past and as projected for the future. (Adopted from Solomon et al., 2007) ------------------------------34
Figure 3�13: Predicted range for all scenarios of SST change for all zones with respect to baseline(1961-1990 ) ---------------------------------------------------------------------------34
Figure 3�12: Monthly SST projections for 2001-2100 in Maldives over the four zones ------------------34
Figure 4�1: Historic earthquake events (adapted from UNDP, 2006). ------------------------------------37
Figure 4�2: Tsunami on 26th December 2014 where the upper panel is water levels at Hanimaadhoo and lower is for Malé (data from University of Hawaii Sea-level Centre) --------------------37
Figure 4�3: Cyclone tracks which affected the Maldives between 1877 and 2004; (adapted from UNDP, 2006) --------------------------------------------------------------------38
Figure 4�4: Flood and drought years for: (a) northern, (b) central and (c) southern Maldives based on Maldives monsoon rainfall. Cross bars indicate the flood years, dotted bars indicate the drought years. Solid line is the sum of mean and standard deviation and dotted line is the difference between mean and standard deviation. --------------------------------------------39
Figure 4�5: Flood events due to rain and number of islands impacted by floods. ------------------------39

xv
Figure 4�6: Observed and predicted (for years 2025, 2050, 2075 and 2100) return periods for: (a) northern, (b) central and (c) southern Maldives regions based on daily rainfall for the periods 1992-2009 (northern), 1975-2009 (central) and 1980-2009 (southern); (adapted from Zahid, 2011). ------------------------------------------------------------------------------40
Figure 4�7: Maximum consecutive dry days during the months of December to April. -----------------40
Figure 4�8: Reported cases of tidal waves and number of islands flooded due to waves. ----------------41
Figure 4�9: Reported cases due to strong wind. ------------------------------------------------------------42
Figure 4�11: Reported cases of tornado events. -------------------------------------------------------------42
Figure 4�10: Return periods for gust wind speeds ---------------------------------------------------------42
Figure 5�1: Fuel import (data source: MCS, 2010; 2011; 2012) ---------------------------------------------47
Figure 5�2: Distribution of electricity use in different sectors (data source: MEA, 2014) ----------------47
Figure 5�3: Distribution of energy consumption for transport (excluding aviation) in different sectors (data source: MEA, 2014) -----------------------------------------------------------------------48
Figure 5�4: Type of waste generated in Maldives ----------------------------------------------------------48
Figure 5�5: GHG inventory from energy use in Maldives from 2002-2012 ------------------------------49
Figure 5�6: Comparison of Maldives Emission per Capita with other groups of countries -------------50
Figure 5�7: Comparison of Maldives Emission per GDP international $ with other similar groups of countries -----------------------------------------------------------------------------------------50
Figure 6�1: Correlation between energy consumption and GDP in Maldives (2001 – 2011)-------------52
Figure 6�2: Abatement cost curve for mitigation measures identified for Maldives. Source: INDC 2015 ------------------------------------------------------------------------------53
Figure 6�3: Electricity consumption and demand in Malé City from 1995-2011 (Data source: Mohamed, 2012) --------------------------------------------------------------------------------53
Figure 6�4: Maldives solar resource map(adapted from NREL, 2003a) -----------------------------------54
Figure 6�5: Maldives wind resource map (adapted from NREL, 2003b) ----------------------------------55
Figure 6�6: Solar PV array at Gasfinolhu (source: http://www.seattletimes.com) ------------------------57
Figure 6�7: Number of motorcycles and cars in Maldives from 2004-2013 -------------------------------59
Figure 6�8: US retail price for fossil fuel and equivalent biofuels (Data source: U.S. Department of Energy, 2016) ------------------------------------------------------------------------------------61
Figure 7�1: Shoreline analysis of the case study islands showing net erosion and accretion zones ( images: Google Earth). ------------------------------------------------------------------------65
Figure 7�2: Inundation of Hithaadhoo island under future climate change scenarios -------------------68
Figure 7�3: Electrical conductivity map of Baa Hithaadhoo -----------------------------------------------72
Figure 7�4: Electrical conductivity map of Gn. Fuvahmulah ----------------------------------------------73
Figure 7�5: Rainwater storage capacity by atolls ------------------------------------------------------------74
Figure 7�6: Deficit water storage with respect to current storage capacity. -------------------------------75

Second National Communication of Maldives to the United Nations Framework Convention on Climate Changexvi
Figure 7�7: Number of requests made for emergency water during the dry period from 2005-2014. ---75
Figure 7�8: Summary by month of measured pH of water quality from MCOH (adapted from (Das et al., 2011). -----------------------------------------------------------------------------------------75
Figure 7�9: Monthly variation of SST across Maldives. Blue diamond show the 1951- 2010 mean monthly SST ± 95% CI (closed bars).Mean monthly SSTs during 1998, 2005 and 2010 are shown separately --------------------------------------------------------------------------------76
Figure 7�10: Atoll specific pattern of recovery of coral reef sites. ------------------------------------------76
Figure 7�11: Coral bleaching episodes from 1998-2010. Data by ReefBase. -------------------------------77
Figure 7�12: Projected impacts of coral bleaching. (Adapted from MEE, 2015a). ------------------------77
Figure 7�13: Distribution of food imports into Maldives based on type and origin(Data source: MCS, 2010; 2011; 2012; 2013) -------------------------------------------------------------------------79
Figure 7�14: Spatial distribution of secondary and tertiary health facilities in the Maldives. -----------81
Figure 7�15: Total number of reported cases. ---------------------------------------------------------------82
Figure 7�16: Reported dengue cases and long term mean rainfall (2005- 2013). -------------------------83
Figure 7�17: Scrub Typhus cases reported monthly from 2011-2013 --------------------------------------83
Figure 7�18: Reported Chikungunya cases -----------------------------------------------------------------83
Figure 7�19: Yellowfin tuna catch per unit effort (CPUE) from 1997 to 2012. Values are annual average catch + standard deviations. The colour horizontal lines indicate El Nino based climate variations (source: www.cpc.ncep.noaa.gov/products/analysis_monitoring/enso_advisory) --------------------------------------------------------------------------------------------------84
Figure 7�20: Skipjack tuna catch per unit effort (CPUE) from 1997 to 2012. Values are annual average catch + standard deviations. The colour horizontal lines indicate El Nino based climate variations (source: www.cpc.ncep.noaa.gov/products/analysis_monitoring /enso_advisory) --------------------------------------------------------------------------------85
Figure 7�21: Bandos inundation model for SRES scenarios (B1, A1B and A2) for 2100 ------------------88
Figure 7�22: Coral reef recovery trend at Bandos (data source: MRC). -----------------------------------89
Figure 8�1: Schematic flow on analysing coastal adaptation measures to be implemented and executed. (adapted from MEE, 2014a) ---------------------------------------------------------------------92
Figure 8�2: Cost comparison among the hard engineering solution for coastal adaptation (data source: MEE, 2015d) -------------------------------------------------------------------------------------93
Figure 8�3: Cost comparison of soft engineering solutions for coastal adaptation -----------------------93
Figure 8�4: Concept of IWRM applicable to small islands (Maldives) ------------------------------------94

Second National Communication of Maldives to the United Nations Framework Convention on Climate Change1
Shan

Executive Summary 2
Executive Summary
National CircumstanceThe Maldives is an archipelago of islands in a double chain of coral atolls scattered between 7° 6’ 35” N to 0° 42’ 24” S, lying in a narrow band of 72° 32’ 19 E to 73° 46’ 13” E. The Maldives consists of about 1,192 small, low-lying coral islands which are grouped into 26 natural atolls, stretching over 860 km from north to south and 80 to 120 km from east to west. The total reef area of approximately 4,513 km2 is the seventh largest reef system in the world and the largest in the Indian Ocean.
The Maldives enjoys a warm and humid tropical climate, with the weather mainly being dominated by two monsoon periods: the southwest monsoon (the wet season, from May to November); and the northeast monsoon (the dry period, from January to March). Annual rainfall over the country varies between 1779 - 2218 mm per year, while average temperatures range from 25°C to 31°C.
The population of the Maldives, according to the 2014 census is 338,434 exclusive of the expatriates. The
population is distributed in 194 islands, while Malé City is the most densely populated with a population of 23,165 persons/km2.
Improvements in healthcare is evident from increase of life expectancy at birth from M70.2 and F70.7 to M73.13 and F74.77 years between 2001 and 2014. Maldives is in an epidemiological transition, moving from a higher burden of communicable diseases towards an increasing burden of non-communicable diseases.
The Maldives is known to have the highest GDP per capita within the South Asian region with the GDP per capita of 3846 dollars for 2013. Tourism, comprising of 28.2%, is the main contributor to the GDP. Though the contribution of fisheries and agriculture to the GDP has declined to 3.5% and 1.7% respectively, these sectors are main source of income for rural communities. Other important contributors to the economy include communication, construction and real estate.
The First National Communication (FNC) of the Maldives was submitted to the United Nations Framework Convention on Climate Change (UNFCCC) in 2001 as part of the obligation under Article 4.1 (a) and Article 12 of the Convention UNFCCC. The Second National Communication (SNC) builds on the activities undertaken during the First National Communication (FNC) and provides the developments in efforts made to address climate change in the Maldives. The SNC was prepared in accordance with the guidelines provided under the Convention. It contains the results of technical and scientific studies, observations and findings of assessments conducted through field work. The national process to develop the SNC was institutionalized at the Climate Change Department of the Ministry of Environment and Energy, which is the national focal point to the UNFCCC.
The SNC consists of eight main chapters. They are:
1. National circumstance; 2. Current and future climate projections; 3. Natural disasters and extreme events; 4. National GHG inventory;
5. Mitigation of GHG emissions;6. Vulnerability to climate change; 7. Adaptation to climate change and 8. Other information.
Second National Communication of Maldives to the United Nations Framework Convention on Climate Change3
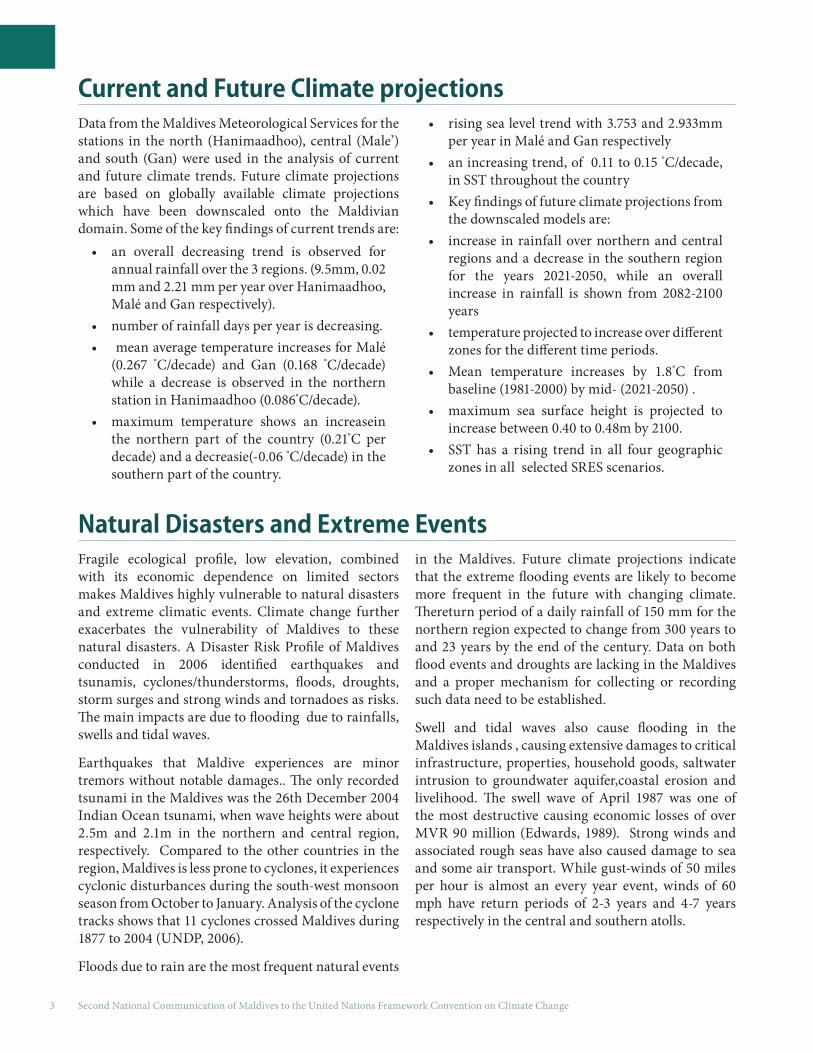
Current and Future Climate projectionsData from the Maldives Meteorological Services for the stations in the north (Hanimaadhoo), central (Male’) and south (Gan) were used in the analysis of current and future climate trends. Future climate projections are based on globally available climate projections which have been downscaled onto the Maldivian domain. Some of the key findings of current trends are:
• an overall decreasing trend is observed for annual rainfall over the 3 regions. (9.5mm, 0.02 mm and 2.21 mm per year over Hanimaadhoo, Malé and Gan respectively).
• number of rainfall days per year is decreasing. • mean average temperature increases for Malé
(0.267 °C/decade) and Gan (0.168 °C/decade) while a decrease is observed in the northern station in Hanimaadhoo (0.086°C/decade).
• maximum temperature shows an increasein the northern part of the country (0.21°C per decade) and a decreasie(-0.06 °C/decade) in the southern part of the country.
• rising sea level trend with 3.753 and 2.933mm per year in Malé and Gan respectively
• an increasing trend, of 0.11 to 0.15 °C/decade, in SST throughout the country
• Key findings of future climate projections from the downscaled models are:
• increase in rainfall over northern and central regions and a decrease in the southern region for the years 2021-2050, while an overall increase in rainfall is shown from 2082-2100 years
• temperature projected to increase over different zones for the different time periods.
• Mean temperature increases by 1.8°C from baseline (1981-2000) by mid- (2021-2050) .
• maximum sea surface height is projected to increase between 0.40 to 0.48m by 2100.
• SST has a rising trend in all four geographic zones in all selected SRES scenarios.
Natural Disasters and Extreme EventsFragile ecological profile, low elevation, combined with its economic dependence on limited sectors makes Maldives highly vulnerable to natural disasters and extreme climatic events. Climate change further exacerbates the vulnerability of Maldives to these natural disasters. A Disaster Risk Profile of Maldives conducted in 2006 identified earthquakes and tsunamis, cyclones/thunderstorms, floods, droughts, storm surges and strong winds and tornadoes as risks. The main impacts are due to flooding due to rainfalls, swells and tidal waves.
Earthquakes that Maldive experiences are minor tremors without notable damages.. The only recorded tsunami in the Maldives was the 26th December 2004 Indian Ocean tsunami, when wave heights were about 2.5m and 2.1m in the northern and central region, respectively. Compared to the other countries in the region, Maldives is less prone to cyclones, it experiences cyclonic disturbances during the south-west monsoon season from October to January. Analysis of the cyclone tracks shows that 11 cyclones crossed Maldives during 1877 to 2004 (UNDP, 2006).
Floods due to rain are the most frequent natural events
in the Maldives. Future climate projections indicate that the extreme flooding events are likely to become more frequent in the future with changing climate. Thereturn period of a daily rainfall of 150 mm for the northern region expected to change from 300 years to and 23 years by the end of the century. Data on both flood events and droughts are lacking in the Maldives and a proper mechanism for collecting or recording such data need to be established.
Swell and tidal waves also cause flooding in the Maldives islands , causing extensive damages to critical infrastructure, properties, household goods, saltwater intrusion to groundwater aquifer,coastal erosion and livelihood. The swell wave of April 1987 was one of the most destructive causing economic losses of over MVR 90 million (Edwards, 1989). Strong winds and associated rough seas have also caused damage to sea and some air transport. While gust-winds of 50 miles per hour is almost an every year event, winds of 60 mph have return periods of 2-3 years and 4-7 years respectively in the central and southern atolls.

Executive Summary 4
National GHG InventoryNational Greenhouse Gas (GHG) Inventory of Maldives was prepared for the year 2011 using the Tier 1 approach from 2006 IPCC Guideline. Electricity generation, transport, fisheries and domestic/commercial food preparation and waste are the key categories considered for the 2011 GHG inventory.
The main GHG emissions reported in the inventory are CO2, CH4 and N2O. The total emission in 2011 is 1225.598 Gg CO2e, of which 1152.869 Gg CO2e and 72.729 Gg CO2e are from the energy and waste sectors
respectively. CO2 comprises about 94.8% of the total GHG emissions for the Maldives. The total emissions for energy sector using the reference approach was 1146.512 Gg CO2e.
GHG emissions have increased from 152.98 Gg CO2e in 1994 to 1225.6 Gg CO2e in 2011 which yield s an annual growth rate of 16%. The specific emissions increased from 625 kg CO2e per capita to 3697 kg CO2e per capita in the same period. Maldives emission in 2011 makes up less than 0.0035% of the total global emissions.
Mitigation of GHGsMaldives intends to reduce its emissions by 24 % from business as usual (BAU) by 2030 with international support. Various policy measures as well as programmes, with assistance from development partners, are being implemented by the government to realize this goal. Mitigation actions in electricity generation can be broadly classified to renewable energy and energy efficiency interventions while increasing efficiency in transport systems are the main mitigation measures in the transport sector. Finally for the the waste sector improvement on waste management practices are considered key to reducing methane emissions.
Mitigation measures undertaken/planned in Maldives include;
• a policy decision to meet 30% of peak day-time demand by solar PV for inhabited islands by 2018.
• Accelerating Sustainable Private Investments in Renewable Energy programme was initiated in 2014 to reduce risks for private sector
investment in renewable energy.• Preparing Outer Islands for Sustainable Energy
Development was initiated to transform the existing energy grids in the Maldives into a hybrid (solar-diesel) renewable energy system.
• Removal of import duty from all renewable energy equipment,
• Introducing RE investments conducive regulations like feed-in tarrif, net metering and IPP.
• Piloting financing mechanism through the commercial banks to facilitate RE
• promoting energy efficient practices/technologies at public building and incorporation of energy efficiency measures to the building code
• Regulations to improve standards of vehicles on street using emission standards as well as age restrictions on vehicles
Vulnerability to Climate ChangeThe small size and low-lying nature of the Maldivian islands make the island nation system highly exposed and sensitive to climate change impacts. The vulnerability assessment for the SNC identified eight areas of vulnerability.
Land loss, Beach Erosion and Human Settlements With about 80% of islands being lower than one metre above the mean sea level, the islands of the Maldives are extremely vulnerable to climate change and its associated impacts, particularly sea level rise. The severity and frequency of observed erosion incidents have increased. The case study islands for

Second National Communication of Maldives to the United Nations Framework Convention on Climate Change5
the assessment show an overall land loss between 0.81-3.66 ha during the observation periods. Both climate change and anthropogenic modification of coastal environments are attributed as causes of this erosion. Inundation analysis of case study islands showed there is high risk of flooding with significant damage to human settlements and infrastructure.
Critical Infrastructure Critical Infrastructures such as utility services, hospitals, transport and communication Infrastructures and waste management centres are located within very close proximity to coastline. These infrastructures are exposed to coastal hazards such as sea swells, storm surges and related coastal flooding. This vulnerability was highlighted in 2004 Indian Ocean Tsunami where one of the most significant impacts of the tsunami was the complete shutdown of the only international airport for several days.
Water Resources Groundwater and rainwater are the main sources of freshwater in the Maldives. climatic and non-climatic factors such as population growth, population concentration and pollution impacts freshwater resources in the Maldives. Conductivity measurements in sample islands show that the groundwater is relatively fresh and below the maximum allowable limit of the World Health Organization drinking water guideline. However, contamination of groundwater makes it unusable for potable uses. Inundation models further identified the increased risk of salinizing of the groundwater. Desalinated water using reverse osmosis (RO) technology is increasingly being utilised as a means to provide clean and safe water to the communities. The percentage of the population with access to desalinated water has increased from 25% in 2001 to over 48% in 2012.
Future climate projections show that the Maldives would experience issues with adequate availability of rainwater. The northern and central islands are currently more vulnerable to elongated dry periods with the need for emergency water supplied during dry periods. The vulnerability assessment showed that the quality of rainwater was also an issue.
Coral Reefs The Maldivian atolls are the seventh largest reef system in the world and the largest in the Indian Ocean. The most critical impact on coral reefs are due to the increase in sea surface temperature (SST). The 1998 coral bleaching event was the most severe on record causing whole or partial bleaching of more than 90% of corals. Since then, coral cover has been increasing with the northern atolls showing increases from 1 % in year 2000 to over 36% in 2012. This recovery is hindered by consecutive bleaching events related to ENSO events. The severity of bleaching events will increase significantly with projected climate change.
Ocean acidification is also identified as a growing threat to the coral reef communities. International studies show that calcification rates may decrease by up to 60% with a doubling of atmospheric CO2 concentrations by end of 21st century. This pose threats of net erosion of reef structures with long-term implications for coastal protection and degradation of reef framework that provides habitats for several organisms that form part of the overall ecosystem.
Agriculture and Food Security Limited agricultural production, heavy import dependency, limitations in storage and challenges in the distribution of food across the nation are major threats to national food security. The small size of islands and limited freshwater availability limit local agricultural production. Extreme weather events further exacerbate this vulnerability, especially when flooding due to surges or sea swells and high waves impact the freshwater lens.
About 90% of the food consumed in the country is imported and any impact on food production in the source countries/regions will directly affect our food security. In addition, any disruptions to transportation of food due to extreme climate events would put a halt to food supplies into the country. Extreme events would also impact food distribution within the country as inter island transport is mainly by sea. The vulnerability assessment identified the need to increase food storage in local islands..

Executive Summary 6
Human Health Climate change will have direct and indirect impact on human health. In Maldives heat and extreme weather events, especially floods due to heavy rainfall have direct health impacts. Indirect health effects of climate change include secondary effects caused by changes in ecology and social systems. Vector borne diseases are the most prominent indirect impacts on the human health for the Maldives. Vector borne diseases such as Malaria and Filaria has been eradicated in Maldives but Dengue, Chikungunya and Scrub typhus are vector borne diseases of immediate concern due to changing climate.
Accessibility to health care is also a concern for the Maldives, especially due to the dispersed nature of the islands. Primary health facilities are available at each inhabited island but access to higher tiered facilities are limited to atoll capitals and population centres. At the event of extreme weather events, access to higher tiered health care facilities becomes a challenge.
Fisheries Changes in sea surface temperature and ocean pH are the main factors likely to affect fisheries in the Maldives.
The Maldives fisheries is predominantly dependent on tuna fisheries. Tuna fishery of the Maldives is affected by the seasonal monsoon and other oceanographic variations. Analysis of catch rates shows that ENSO variations influence that tuna fisheries in Maldives.. During the El Nino years the skipjack catch rates noticeably decreased, while the yellow fin and other tuna species increased. During La Niña years, this trend is seen to reverse. Further research is needed to understand the severity of such impacts on tuna and related species. As over 90% of export is marine products, especially tuna, any significant change in the abundance and catch-ability of tuna will have economic consequences.
Tourism As the sea, sand and sun is a major pull factor for tourists to visit the Maldives, the tourism product is highly vulnerable to effects of climate change. The major climate change impacts on the Maldives tourism sector include impacts due to increased temperatures, increased extreme events, sea level and SST rise and changes to marine biodiversity. Tourism being the main contributor to the Maldivian economy, any negative impacts on the tourism sector would have dire economic consequences.
Adaptation to Climate ChangeDespite the fact challenges, Maldives is determined to adapt to the adverse impacts of climate change. Adaptation measures in the Maldives are limited and further hindered by limited, financial and human capacity. However, considerable work has been undertaken to increase the resilience to climate change. In addition to specific adaptive measures within the sectors, there is a need to increase adaptive capacities and opportunities.
Land loss, Beach Erosion and Human Settlements Maldivians have historically used shore protection measures or moving the entire population to a safer or less vulnerable island as adaptation measures. Given the small land area of all islands, shore protection/elevation is the only adaptation option for the Maldives.
Both hard and soft shoreline protection measures are practiced in the country.
Despite the difficulty in implementing and high cost of hard-engineered structures, their high durability and effectiveness make them the most common protection option. Commonly used hard engineering solutions in Maldives are near shore and foreshore coastal protection methods, land reclamation and land elevation Protection of all inhabited islands, using these measures, would cost up to USD 8.8 billion. Soft coastal measures practiced in the Maldives include beach nourishment, preservation of coastal ridge, temporary seawalls/revetments, land use controls/setbacks, coastal vegetation, raised ridges and artificial reefs.
A coastal protection guideline was established in 2015 which outlines the standards and protocols for selection, design, implementation and maintenance

Second National Communication of Maldives to the United Nations Framework Convention on Climate Change7
of the appropriate coastal protection measures. The main options identified in the guideline are hold the line, move seaward, manage realignment, limited intervention or do nothing. The height of newly reclaimed lands are also set above 2 m from MSL as an adaptation to sea-level rise.
Water ResourcesProtection of groundwater, increasing rainwater harvesting and storage and storm water management are key adaptation options in the water sector. Maldives is moving towards an integrated water resource management (IWRM) approach that utilize as cost-effective adaptation measure to water issues. IWRM systems are being piloted in six islands, integrating available water resources at an island by enhancing availability of groundwater, increase storage of rainwater and supplementary use of desalination systems to increase the availability and reliability of fresh water at an affordable cost.
Coral Reefs The main adaptive measures to reduce vulnerability of coral reefs are continued monitoring of reef health, increased conservation effort and reduction of impacts of human activities. Understanding the value of reef systems and disseminating that information is also key to motivate public to take part in these adaptive measures. In terms of monitoring, since 1998 MRC monitors sample reefs under national coral reef monitoring program and efforts are underway to increase these monitoring with participation of resorts and dive centers around the country through a Coral Reef Monitoring Framework with a web-enabled database with remote data entry capabilities has been established.
Maldives have designated 42 Marine Protect areas (24,494 hectares) and identified 274 environmentally sensitive areas. The UNESCO Biosphere Reserve established in 2011, highlights the benefits of environmental conservation for local economy and livelihood in Baa Atoll. In addition, several coral restoration projects are implemented in island communities, resort islands and NGOs throughout the country.
Agriculture and Food SecurityThe government has undertaken a number of activities in the past decade to enhance food security through increased agricultural productivity and improve storage and distribution. A national strategy to address food security has been drafted in 2012 to synergise the different adaptation measures. One such measure is to introduce an integrated farming approach. Alternative technologies such as hydroponics and auto-pot systems have been successfully piloted to address the limited production. Efforts have been made in the last five years to improve the storage distribution and supply chain. Three storage and distribution centres, with supplies of staples for 2-3 months, exist in the northern, central and southern regions of the country.
FisheriesSix main adaptation measures has been identified for the fisheries sector. These include 1) Improving fish finding, harvesting and handling, 2) establish aquaculture/mariculture to diversify the sector and adapt to impacts of changing tuna abundance, 3) undertaking research and disseminate information on fisheries and climate change, 4) experimenting new and alternative species and breeding / handling methods for live bait, 5) integrated reef fishery management and 6) exploiting alternative sources of protein to reduce dependency on tuna. Fisheries master plan (MASPLAN) currently developed by the Ministry of Fisheries and Agriculture incorporates many of these measures.
Human HealthRecent health policies, guidelines and master plans recognizes the importance of adaptation to impacts of climate change. One of the key achievements in adaptation of the health sector is the establishment of an integrated disease surveillance system (SIDAS) throughout the country. Other adaptation measures considered to reduce vulnerability of the sector to climate change includes control of vector borne diseases and increasing accessibility to improved healthcare.

Executive Summary 8
Population and Development ConsolidationThe estimated cost of hard engineered, coastal protection for all inhabited islands is between USD 0.5 to 8.8 billion. The government has identified population and development consolidation to migrate from small vulnerable islands to larger islands, with increased land by reclamation and shore protection, with better economic opportunities as a means to adapt. Population consolidation is already implemented in number of islands and there is a growing interest with in public, although there were number of social challenges in the past.
Tourism Tourism in the Maldives is highly dependent on the pristine natural environment, “sea, sand and sun”. All standards, policies and measure in tourism sector have applied highest environmental standards in tourist resort. The sector have developed policies, standards to ensure that climate change adaptation is integrated or aligned in the tourist resort development in all service sectors, including, critical infrastructure, tourist buildings/bungalows, waste, water, food. The sector is further improving regulatory and policy framework to ensure that high quality tourism product is provided to the tourist. The sector is further developing and investing high quality, climate proof infrastructure. High priority is given on building resilience of the sector and services including supporting community based adaptation projects in local communities, investing in climate proofing operational infrastructures in tourist operators and contributing to conservation and protection of the bio-diversity.
Other InformationMany other synergetic efforts have been carried out at the national level to address the impacts of climate change. Such efforts are:
• Establishing of the Maldives Climate Change Policy Framework adopted in 2015
• A national climate change research strategy was established in 2012
• Incorporating elements of climate change into the formal curriculum.
• Identifying critical capacity constraints and priority capacity needs faced by the Maldives through National Capacity Self-Assessment in 2009.
• Introduction of green tax in the tourism sector.
ConstraintsEfforts against climate change in Maldives is severely restricted by capacity, financial and technical constraints. Quality of available data within sectors was one of the barriers for vulnerability assessment and GHG inventory. Lack of institutionalized data collection and quality control leads to poor data quality and inconsistent data formats. Both mitigation and adaptation measures requires transformative levels
of technology transfer. This is impeded by the lack of necessary financial resources, human and technical capacity. Weak inter sectoral coordination and over-lapping mandates for different institutions creates additional barriers for implementation.
For a successful implementation of the convention, in addition to adequate finance and technology transfer, the capacity of the individuals and the respective institutions needs to be enhanced. There is need to enhance technical capacity of institutions and individual staffs data collection, analysis and research that would lead to effective implementation of climate change adaptation and mitigation efforts and mainstream climate change solutions in to development planning.
For the effective implementation of the convention to address the climate change issues, various donor assistance and state funding were utilized. Some of the key assistance from donors sums up to more than USD 192 million among others.

Second National Communication of Maldives to the United Nations Framework Convention on Climate Change9
01
Ministry of Environment and Energy

1. Introduction 10
1. IntroductionThe United Nations Framework Convention on Climate Change (UNFCCC) was adopted at the 1992 United Nations Conference on Environment and Development in Rio de Janeiro. In keeping with Article 4.1 (a) and Article 12 of the Convention, all Parties to this Convention are required to submit reports on the progress of its implementation of the Article 2 (Objectives) of the Convention. The essence of these national communications rests with comprehensive information on anthropogenic emissions of greenhouse gases and risk reduction, adaptation and mitigation measures undertaken or envisaged by the Party in the implementation of the Convention in order to overcome climate changes and its adverse effects.
The preparation of the National Communication (NC) for Maldives is a forward-looking, progressive step towards the implementation of the UNFCCC at national level and in compliance with Article 12 of the Convention. The First National Communication (FNC) of the Maldives was submitted in 2001 to the United Nations Framework Convention on Climate Change. The central objective of this submission was to provide comprehensive information towards achieving the ultimate objective and to realise the spirit of the Convention in accordance with principle of ‘common and differentiated responsibility’ and respective capabilities and their social and economic conditions on addressing global environmental issues.
The Second National Communication (SNC) is prepared in accordance with the guidelines on national communications outlined in UNFCC (2003)1, and the methods proposed by UNFCC (2007)2, on integrating information into Second and subsequent national communications. Given this, progressive developments under the SNC builds on the measures and policies undertaken during the development of the FNC, which defined and elucidated the ground work for Maldives commitment to address climate change and its adverse effects, in particular to low-lying small island countries. Hence, the SNC is anticipated to provide information on the progress made since then and offers valuable insights into the particular vulnerabilities of the Island nation and describes the extent of its efforts made to adapt and mitigate and overcome the challenges. The report also reveals the fragility of our ecosystems and the extraordinary challenges faced by the country and raises the seriousness of the issues involved in making the Maldives a more resilient and adaptable nation for future generations. The findings of the report provide broader avenues for tangible future strategies and underscore the importance of mainstreaming climate change into Sustainable Development Goals.
In particular, the SNC provides information on the GHG inventory of the country and the mitigation efforts undertaken to minimize the GHG emissions. The SNC report is the outcome of a greater national stakeholder collaboration process steered by the Ministry of Environment and Energy, the national focal point to the UNFCCC. For clarity, this report is structured into the following component parts:
1. National circumstances ;2. Current and future climate projections ;3. Natural disasters and extreme events ;4. National Greenhouse Gas Inventory ;5. mitigation measures; 6. Vulnerability to climate change ;7. Adaptation Measures ; and8. Other information related to technology transfer, research and systematic observation, capacity building,
awareness and education 1 UNFCC, 2003. Reporting on Climate Change: User Manual for the Guidelines on National Communications for Non Annex 1 Parties.2 UNFCC, 2007 Integration of Information Contained in National Adaptation Programmes of Action into Second and Subsequent National Communications

Second National Communication of Maldives to the United Nations Framework Convention on Climate Change11
01
1.1 Institutional arrangementsAt the national level, the Climate Change Department (CCD) of the Ministry of Environment and Energy is designated to be the focal point for the development of SNC, which is mandated to “Carry out the obligations of International treaties and activities related to organizations that the Maldives is party to” ( Ministry of Environment, 2013) and is national focal point for UNFCCC and climate change issues.
The Secretariat for the SNC headed by the Project Director, with support from administrative and financial personnel ensures the day to day implementation of activities.
Headed by thematic Coordinators, the two technical working groups, the Inventory and Mitigation Team and the Vulnerability and Adaptation Team undertakes special studies and provide technical guidance for the development of the SNC, reports to the National Secretariat. The Inventory Mitigation Team consists of the Transport Authority, Maldives Airports authority, Public Utilities and Airport. The Vulnerability Adaptation Team consists of government institutions such as the Ministry of Tourism, Ministry of fisheries
and Agriculture, Ministry of Health, Public Utilities, Ministry of Housing and infrastructure, Environment Protection Agency, Local Government Authority, Maldives Meteorological Services, Maldives National University, Airports and the Private Sector and Civil Society Organisations.
A Project Steering Committee Chaired (PSC) by the Project Director facilitates coordination between the relevant government ministries, the Non- Governmental Organisation, private sector. The PSC is composed of stakeholder representatives from government, civil society and private sector, was entrusted with ensuring the continuity of activities under the SNC.
These mechanisms ensured the efficiency and smoothness of inter-ministerial coordination, engagement of technical experts and the participation of relevant stakeholders, including the private sector, NGOs and the Maldives National University. The hierarchy of these institutional arrangements for the National Communication Process as discussed is illustrated in Figure 1–1.

1. Introduction 12
01
Figure 1-1: Institutional arrangement for the National Communication Process.

Second National Communication of Maldives to the United Nations Framework Convention on Climate Change13
02
Water Solutions

2. National Circumstances 14
2. National Circumstances2.1 Geography of MaldivesThe Maldives is an archipelago of islands in a double chain of coral atolls , comprising 1,192 small low lying
small islands in the Indian Ocean, scattered between 7° 6’ 35” N to 0° 42’ 24” S, lying in a narrow band of 72° 32’ 19” E to 73° 46’ 13” E (Figure 2–1). The islands are grouped into 26 natural coral atolls, stretched over 860 km from north to south and the width varies about 80 to 120 km from east to west. The Maldivian atolls are the seventh largest reef system in the world and the largest in the Indian Ocean.
Maldives has a total reef area of 4,513 km2 (Naseer & Hatcher, 2004). The size of the biggest island is approximately 6 km2 (MEEW, 2007).
Maldives composes the central part of the Laccadives-Maldives-Chagos submarine ridge. This submarine ridge is a part of the large volcanic active zone in the Reunion. An elevated outer rim forms providing the double chain character of the atoll where these double
chains are separated by inner sea basin as in Figure 2–2 (Kench, 2011).
Marked spatial variations in the atolls are also seen along the north south gradient. Northern atolls are dominant of open type atolls with more patch reefs and faros with lagoon depths of 40-50 m. Southern atolls are more dominant of closed reefs with continuous reef rims with deeper lagoons of 70-80 m (Figure 2–3).
The shapes of the islands are governed by the physical wave c o n d i t i o n s . Island size vary from small s a n d b a n k s , e l o n g a t e d stripes or r e l a t i v e l y circular with v e g e t a t i o n cover.
Figure 2-1: Map and location of Maldives
Figure 2-2: The geological structure of Maldives (adapted from Kench, 2011).
Figure 2-3: Spatial variation in the characteristics of the atolls (adapted from Kench, 2011)

Second National Communication of Maldives to the United Nations Framework Convention on Climate Change15
02

2. National Circumstances 16
02
Figu
re 2
-4:
Map
of M
aldi
ves (
sour
ce: W
ater
Solu
tions
Pvt
Ltd
201
6).

Second National Communication of Maldives to the United Nations Framework Convention on Climate Change17
02
2.2 ClimateMaldives being located over the equator in the Indian Ocean, experiences a typical equatorial monsoonal climate. The southwest monsoon (wet-season) normally extends from mid-May to November. The northeast monsoon (dry-season) extends from January to March. The month of December and April are considered as the monsoon transitional periods.
The climate trend over the country is based on meteorological data available from the weather stations at Hanimaadhoo (north), Malé (central) and Gan (south) (as in Figure 2–4). The time series used for different parameters varies depending on the best available data from Maldives Meteorological Services for the respective stations.
2.2.1 TemperatureMaldives experiences warm and humid climate throughout the year. Temperature is moderated by the presence of vast sea and oceans surrounding the small islands. The average temperature ranges from 25°C to 31°C. With the influence of the monsoon, seasonal fluctuations are observed throughout the year. The warmest period are observed during March, April and May with higher temperatures in the north (Figure 2– 5).
2.2.2 WindThe prevailing wind over the Maldives represents typical South Asian monsoonal characteristics. It follows the traditional definition of monsoon as seasonal reversal of wind direction by more than 120° between the months January and July. Looking at annual variations, westerly winds are predominant throughout the country, varying between west-southwest and west-northwest (Figure 2–6).
2.2.3 RainfallThe rainfall over the Maldives varies during the two monsoon periods with more rainfall during the southwest monsoon. These seasonal characteristics can be seen from Figure 2–7, which shows the mean
monthly rainfall observed over north, central and southern atolls. Looking across the length of the Maldives, the amount of annual rainfall received increases from the north to the south (Figure 2–8). On average, the southern atolls receive about 2,218 mm of rainfall per year, while the annual rainfalls over central
Figure 2-5: Monthly long-term mean temperature
Figure 2-6: Spatial distribution of wind speed and directions from 2003-2012. Data from MMS.
Figure 2-7: Regional variation of mean monthly rainfall in the Maldives
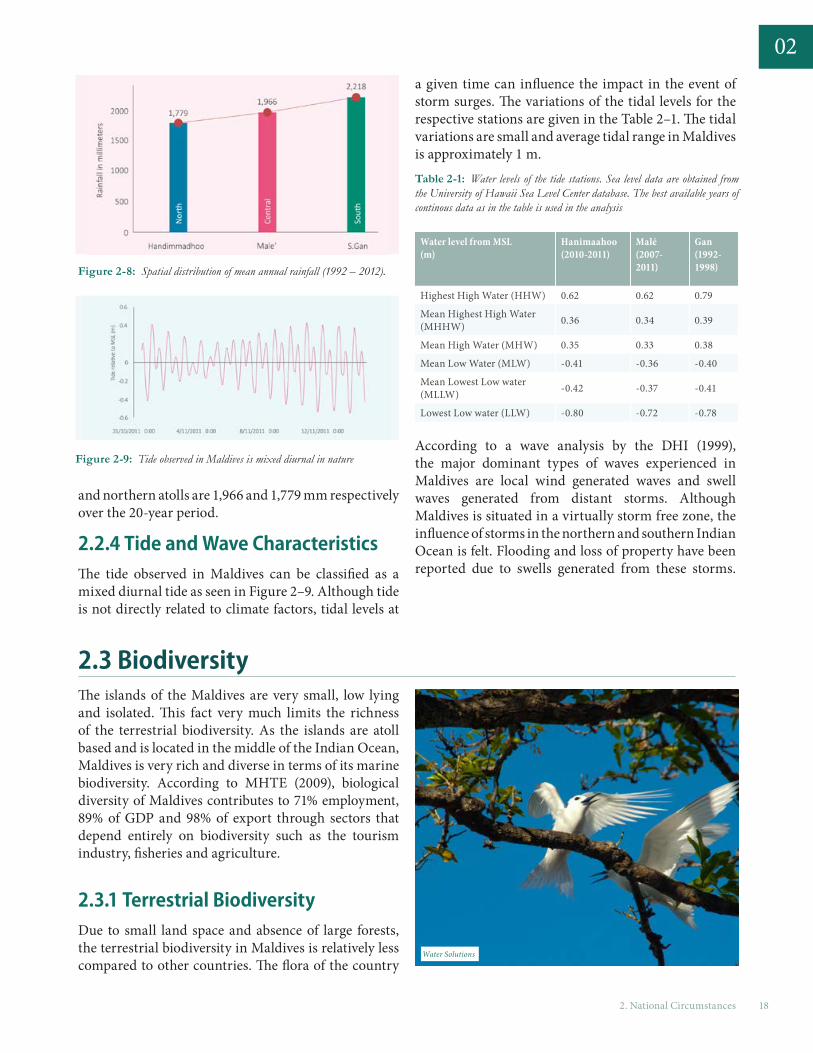
2. National Circumstances 18
02
and northern atolls are 1,966 and 1,779 mm respectively over the 20-year period.
2.2.4 Tide and Wave CharacteristicsThe tide observed in Maldives can be classified as a mixed diurnal tide as seen in Figure 2–9. Although tide is not directly related to climate factors, tidal levels at
a given time can influence the impact in the event of storm surges. The variations of the tidal levels for the respective stations are given in the Table 2–1. The tidal variations are small and average tidal range in Maldives is approximately 1 m.
According to a wave analysis by the DHI (1999), the major dominant types of waves experienced in Maldives are local wind generated waves and swell waves generated from distant storms. Although Maldives is situated in a virtually storm free zone, the influence of storms in the northern and southern Indian Ocean is felt. Flooding and loss of property have been reported due to swells generated from these storms.
2.3 BiodiversityThe islands of the Maldives are very small, low lying and isolated. This fact very much limits the richness of the terrestrial biodiversity. As the islands are atoll based and is located in the middle of the Indian Ocean, Maldives is very rich and diverse in terms of its marine biodiversity. According to MHTE (2009), biological diversity of Maldives contributes to 71% employment, 89% of GDP and 98% of export through sectors that depend entirely on biodiversity such as the tourism industry, fisheries and agriculture.
2.3.1 Terrestrial BiodiversityDue to small land space and absence of large forests, the terrestrial biodiversity in Maldives is relatively less compared to other countries. The flora of the country
Table 2-1: Water levels of the tide stations. Sea level data are obtained from the University of Hawaii Sea Level Center database. The best available years of continous data as in the table is used in the analysis
Water level from MSL (m)
Hanimaahoo(2010-2011)
Malé(2007-2011)
Gan(1992-1998)
Highest High Water (HHW) 0.62 0.62 0.79
Mean Highest High Water (MHHW) 0.36 0.34 0.39
Mean High Water (MHW) 0.35 0.33 0.38
Mean Low Water (MLW) -0.41 -0.36 -0.40
Mean Lowest Low water (MLLW) -0.42 -0.37 -0.41
Lowest Low water (LLW) -0.80 -0.72 -0.78
Figure 2-8: Spatial distribution of mean annual rainfall (1992 – 2012).
Figure 2-9: Tide observed in Maldives is mixed diurnal in nature
Water Solutions

Second National Communication of Maldives to the United Nations Framework Convention on Climate Change19
02has 583 vascular plants (MEE, 2015b). Cultivated plant species account for 55% while 45% accounts for native and neutralized plants. Mangroves are seen on 150 islands either in enclosed or semi-enclosed brackish water (Saleem & Nileysha, 2011).
As the land area is limited, Maldives do not have an abundant wildlife (Webb, 1988). One or two types of the reptilian species of lizards (Hemidactylus spp), gecko (Calotes versicolor), frog (Rana breviceps), toad (Bufo melanostictus) and snakes (Lycodon aulicus and Typhlops braminus) are found throughout the country. One species in IUCN red list, black turtle, are seen in a very few locations of the country. The only native mammals found in the country are two subspecies of fruit bats (Pteropus). In addition to this, 167 bird species are recorded in Maldives (Ash & Shafeeg, 1994; Anderson & Baldock, 2001). Some of these species are known to nest and a breed in Maldives while others are immigrant species.
2.3.2 Marine BiodiversityMaldives is very rich in its marine flora and fauna. Over 1200 species of reef fish, 250 species of hermatypic corals and 258 species of algae have been identified in the Maldives (MEE, 2002). Among animal groups that are internationally threatened are populations of green (Chelonia mydas) and hawksbill (Eretmochelys imbricata) turtles; the Maldives is perhaps the most important feeding area for hawksbill turtles in the Indian Ocean. It is also home to globally significant populations of whale shark (Rhincodon typus), reef sharks and manta rays (Manta alfredi), as well as several species of wales and dolphins. Other globally significant coral reef species include the Napoleon wrasse (Cheilinus undulatus), Giant Grouper (Epinephelus lanceolatus), giant clam (Tridacna squamosa) and black coral (Antipatharia). In addition to coral reefs, the Maldivian atoll ecosystems are comprised of a variety of other habitats including extensive shallow
and deep lagoons, deep slopes, sandy beaches, and limited mangrove and sea grass areas.
The coral reefs of the Maldives support a high diversity of reef organisms, with several hundred species of corals (stony and soft corals) and over a thousand species reef associated fish species. Earliest accounts on the diversity of corals were provided Pillai and Scheer (1976), study providing the first checklist of stony corals, from samples collected in 1957 and 1958. The second significant contribution was the coral list proposed by Sheppard (1987) as a compilation of scleractinian species for various areas of Indian Ocean, including coral fauna of the Maldives. Finally, the most recent taxonomic census has been realized by Pichon & Benzoni (2007), based on 2002/2003 field observations, after the 1998 regional bleaching event that seriously impacted coral communities of Maldives (Zahir et al., 2006; Lasagna et al., 2009). Species richness reported for Baa Atoll (refer to Box 5) is consistent with Scleractinian richness reported in other Maldives areas.
2.4 Socio-Economic circumstances
2.4.1 DemographyAccording to the 2014 census, the population was 338,434 exclusive of the expatriates. The results indicated that there was a population growth rate of
1.69% per year. The population projection as shown in Figure 2–10 indicates that the population will reach approximately more than 400 thousand by 2025.
Considering the current trends of 2014 and the
Mahir

2. National Circumstances 20
02population of 2006, an analysis of the distribution of the population age group is presented in Figure 2–11. It shows the age distributions based on the 2006 census and the 2014 population census. It is seen that the majority of the population is very young being below 30 years.
Some islands are already over populated compared to the island size. The majority of the population in any given atoll usually dwells in or near the atoll capital. Figure 2–12 shows that Malé City has the highest population density among the capital islands with a 23,165 persons/km2. Malé City hosts more than 38% of the entire population as of 2014 census.
Availability of the better facilities and economic opportunities in the capital Malé has resulted in the population of other islands to migrate to the capital. Population being this dense and concentrated in one island has started to cause many environmental, social and health issues. To address the issue of population pressure, several efforts are being undertaken by the government. However, there are significant challenges in the development given the geographically dispersed nature of the population thereby increasing their vulnerability. As can be seen in Table 2–2, bulk of the inhabited islands houses a very small population. Only 16 out of 194 islands have a population more than 2,000. This is a development challenge as dispersal in small island communities exerts diseconomies of scale.
2.4.2 Human Development A snap shot of how the country has been performing in the context of human development is given by the Human Development Index (HDI). HDI is an index based on three primary variables, life expectancy, access to knowledge and Gross National Income (GNI) per capita converted based on the Power Purchasing Parity (PPP) rates (UNDP, 2014). An index of 0.688 was obtained in year 2012, which is a 16% increase
Table 2-2: Concentration of population in islands (adapted from NBS, 2015a).
Population size range Number of islands
Administrative islands 194
<500 72
500-999 66
1000-1999 42
2000-4999 12
5000-24999 3
25000 and over 1
Non-administrative islands*
100-399 111
Figure 2-10: Growth of population and projected population excluding expatriates (data source: Department of National Planning, 2015).
Figure 2-11: Population age group distribution for 2006 and 2014 census (adapted from NBS, 2015a)
Figure 2-12: Population density of the capital islands (population based on 2014 census)
Figure 2-13: Maldives compared to the rest of the world on HDI (adapted from UNDP, 2014)

Second National Communication of Maldives to the United Nations Framework Convention on Climate Change21
02since the year 2000, indicating that Maldives is under the medium development category compared to other 187 countries among the ranking was performed as shown in Figure 2–13. The average HDI of the Small Island Developing States (SIDS) was 0.648, indicating that Maldives performed better than the average SIDS (UNDP, 2014)
A comparison of the domestic HDI was performed by UNDP (2014) shows a significant disparity exists among the domestic groupings. An HDI of 0.734 was observed in the capital Malé City when compared to the cumulative value of 0.627 of all the other atolls.
2.4.3 The EconomyA varying and fluctuating growth in the Gross Domestic Product (GDP) have been observed in the past 10 years as shown in Figure 2–15. With its development portfolio, Maldives is known to have the highest GDP per capita within the South Asian region with the GDP per capita of USD 3,846 for 2013.
The main contributors to the economy are tourism, communication, transport, construction and real estate, fisheries and agriculture (Figure 2–16). Since its introduction tourism has always been a major contributor to the economy making up 28.2% of the GDP in 2013. This is followed by communication and transport contributing 9.9% and 9.3% to the GDP in 2013. The construction and real estate sector performance had declined since economic crisis in 2008 making up 7.6% and 7.8% of 2013 GDP. Fisheries and agriculture contributed to about 3.5% and 1.7% respectively in 2013. Although the contribution of these sectors to the GDP is low, these two sectors are the main sources of income in the rural communities.
Figure 2-15: GDP per capita at 2003 constant prices (USD) and growth rate (data source: NBS, 2015c).
Figure 2-14: Comparison of the regional HDI within Maldives (adapted from UNDP, 2014)
Department of foreign Affairs and Trade Australia
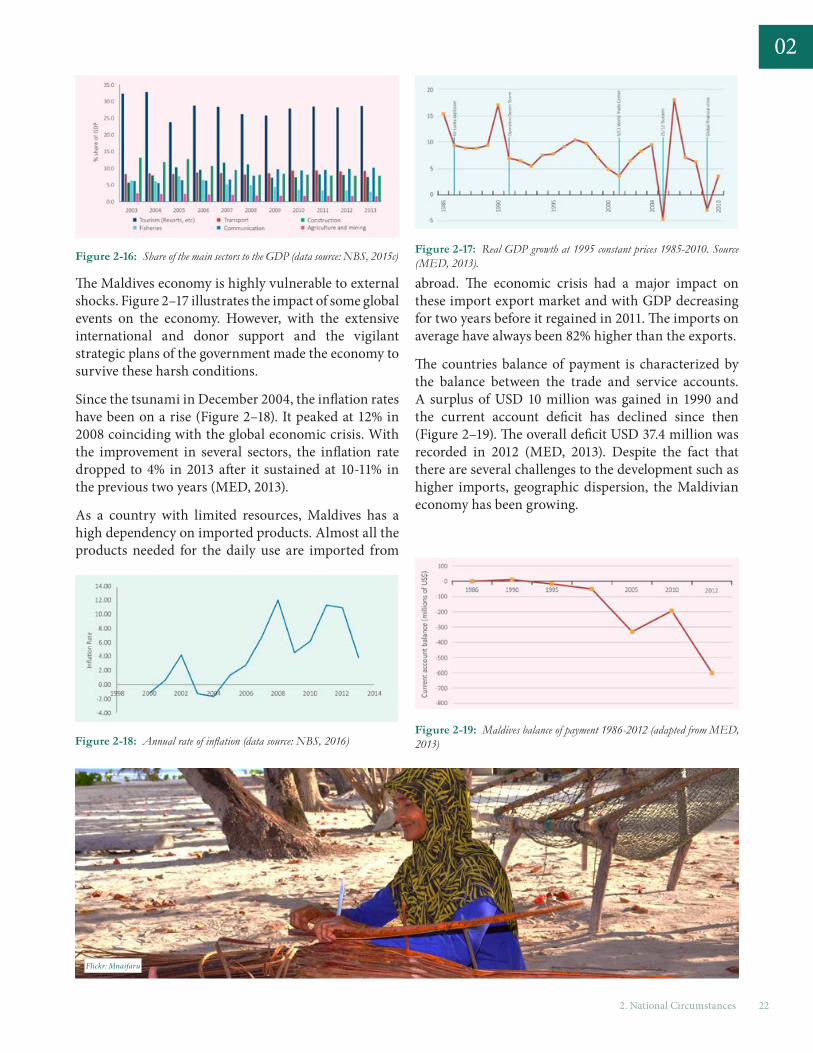
2. National Circumstances 22
02
The Maldives economy is highly vulnerable to external shocks. Figure 2–17 illustrates the impact of some global events on the economy. However, with the extensive international and donor support and the vigilant strategic plans of the government made the economy to survive these harsh conditions.
Since the tsunami in December 2004, the inflation rates have been on a rise (Figure 2–18). It peaked at 12% in 2008 coinciding with the global economic crisis. With the improvement in several sectors, the inflation rate dropped to 4% in 2013 after it sustained at 10-11% in the previous two years (MED, 2013).
As a country with limited resources, Maldives has a high dependency on imported products. Almost all the products needed for the daily use are imported from
abroad. The economic crisis had a major impact on these import export market and with GDP decreasing for two years before it regained in 2011. The imports on average have always been 82% higher than the exports.
The countries balance of payment is characterized by the balance between the trade and service accounts. A surplus of USD 10 million was gained in 1990 and the current account deficit has declined since then (Figure 2–19). The overall deficit USD 37.4 million was recorded in 2012 (MED, 2013). Despite the fact that there are several challenges to the development such as higher imports, geographic dispersion, the Maldivian economy has been growing.
Figure 2-16: Share of the main sectors to the GDP (data source: NBS, 2015c) Figure 2-17: Real GDP growth at 1995 constant prices 1985-2010. Source (MED, 2013).
Figure 2-18: Annual rate of inflation (data source: NBS, 2016) Figure 2-19: Maldives balance of payment 1986-2012 (adapted from MED, 2013)
Flickr: Mnaifaru

Second National Communication of Maldives to the United Nations Framework Convention on Climate Change23
02
2.5 TourismTourism in the Maldives started in 1972 with just two resort islands. Since then, the industry has grown rapidly. The tourist bed capacity has increased from 280 in 1972 to 27,538 in 2012 (MoT, 2015a).Tourist arrivals also mirror this growth (Figure 2–20). Tourism is the main economic linchpin of the country and accounts for more than a fifth of employment (NBS, 2015b). By the end of 2014 there are 109 resorts and 104 under construction (MoT, 2016).
Although tourism was not a major contributor to the economy in its initial years, a great emphasis was given by the government for the development of the sector. The First Tourism Master Plan (FTMP) was developed in 1983 where it laid the foundation of a sustainable tourism and giving a special emphasis on environmental protection. Policies and regulatory standards began to be enforced in resort development.
The Second Tourism Master Plan (STMP) was developed in 1995 with focus on expanding sectors development into more regions across the country. The Third Tourism Master Plan (TTMP) was launched in 2007 and opened the opportunity for development of city hotels and guest houses, introducing local tourism where the benefit of tourism can be reached to a wider social community. The Forth Tourism Master Plan (4th TMP) that is being implemented from 2013-2017, has a focus on increasing sustainability of the sector, which includes implementing climate change adaptation and mitigation programmes and enhance tourism sector’s community-social responsibility.
Strategic planning measures adopted for the tourism development made Maldives to be a world renowned tourist destination. The pristine natural environment
Flickr_Muha
Figure 2-21: Reasons why Maldives is chosen as a holiday destination by tourists (data source: MoTAC, 2012)
Figure 2-20: Tourist arrival 2000-2014 (data source: NBS, 2015c)
Flickr: Muha

2. National Circumstances 24
02
of the Maldives is the main backbone of the Maldivian tourism product. The main reasons for choosing the Maldives as a holiday destination is shown in (Figure 2–21). This significant reliance on the natural environment, subjects the sector and thus the economy to the wider risks of climate change impacts.
Tourism industry in Maldives usually operates on a seasonal basis with peak season running from late
October till March and off season from May till August. This is highly corresponding with season changes in northern hemisphere. Coincidentally, it aligns with the general climate trend of dry season and rainy season of Maldives respectively. However, as seen in Figure 2–22 bed occupancy in off season has increased more drastically compared to peak season. This means the prominent seasonality trend is moving towards a year round occupancy.
2.6 FisheriesFishing is an important part of Maldivian lifestyle and remains as the primary industry for most locals, occupying men and women alike. While fish remain a main source of protein for Maldivians, it is also important economic activity as fish is the main export
for Maldives. Figure 2–23 shows the trend of local consumption and export of fisheries products in the Maldives from 2000 to 2013. It shows that with a few exceptional years fish products produced in Maldives is split approximately equally between local consumption
Figure 2-22: Bed occupancy in peak season and off season
Figure 2-23: Trends in Export and local Consumption of fish from 2000-2013 (data source; Maldives Customs Data and Fisheries statistics years books, Ministry of Fisheries and Agriculture).
Figure 2-24: Fish landing from 1970 to 2014 (data source: DNP)

Second National Communication of Maldives to the United Nations Framework Convention on Climate Change25
02and export. Overall 40% of the fish caught during this 14 year are locally consumed. According to Sinan (2011), Maldivians are among the highest consumers of fish as a protein source with per capita fish consumption at 181 kg/year.
Fish products being the main export, it is one of the key sources of foreign exchange. Maldivian fish products are mainly exported to Europe, Japan, Thailand and Sri Lanka. The decline of export seen in Figure 2–23 is attributed to economic crisis. Fisheries is a key primary productivity sector making up 3.5% of the GDP in 2013 and contributed to approximately 20% of the domestic employment with over 14500 fishers. The fisheries sector contribution to the GDP has shown a declining trend with the initiation of the tourism sector. In 1978, the fisheries contribution to the GDP was estimated at about 22% and by 1999 this figure has decreased to 6.5% (MHAHE, 2001).
The fishery of Maldives is predominantly based on tuna and related species followed by reef associated fisheries. Fish production has been steadily increasing since the 1980s with the catch peaking in 2005 (Figure 2–24). Fisheries sector also recovered more quickly than other sectors after the 2004 Indian Ocean Tsunami and fish production increased by 17 per cent in 2005 compared to 2004. However, the amount of fish landing has been constantly declining since 2006. Nevertheless, since 2010 fish landings increased at an approximate annual rate of 12.5% till 2013. This increase is attributed to increase in Yellowfin Tuna fisheries. Several species of reef associated fishes are caught as baitfish for the pole and line tuna fishery. The main species of bait fish include sprats (43%), fusiliers (37%), cardinals (10%) and anchovies (7%) (DNP, 2010). It is estimated that 10-15 MT of bait fish is required annually to sustain the current quantity of fish captured.
2.7 Food Security and AgricultureTraditionally Maldivians have been utilizing fish and use locally available food sources on the islands for food. The main staples traditionally grown included taro, cassava, sweet potato and breadfruit, grains, such as corn and finger millet, and a number of tropical fruits and
vegetables. In addition, sugar made from coconut toddy
was commonly used. Main source of protein was fish.
As highlighted in the MHAHE (2001), the limited cultivable land area, poor quality of the soil and scarce sources of
fresh water makes it a challenge for traditional agriculture in the Maldives.
The main constraint to the sector is the limited availability of cultivable land. The
small size of islands, with an average of 0.5 to 2 km2, provides only 30 km2 of cultivable land dispersed throughout the archipelago, limiting agricultural production (Shabau, 2006).
Agriculture is a small sector in terms of economic activity contributing 1.7% to the GDP in 2013 (refer Figure 2–16). However, GDP figures for the sector show a growth of about 0.7 million international dollars3 per year (Figure 2–25).
The small agriculture opportunities mean diversity of crops and food supplies are limited leading to high dependency on imported foods. About 90% of the country’s food demand is catered from imported food (Shabau, 2006). Figure 2–26 shows the expenditures for main food imports into the Maldives from 2010 to 2013. It shows steady increase in expenses for food import in these 4 years.
3. International dollar - An international dollar would buy in the cited country a comparable amount of goods and services a U.S. dollar would buy in the United States. This term is often used in conjunction with Purchasing Power Parity (PPP) data - https://datahelpdesk.worldbank.org/knowledgebase/articles/114944-what-is-an-international-dollar
Figure 2-25: GDP value contribution from Agriculture from 2003 to 2014 (data source: NBS, 2015c)
Water Solutions

2. National Circumstances 26
02In addition to the high import dependency for food security, the dispersed nature of the Maldivian islands poses further challenges in distributing and storing food. Distributions of food supply, both locally produced and imported stock, within the country is mainly by sea transport. Often severe and extreme weather incidents disrupt the supply of food within the country. To ensure continued supplies of staple food, the government also maintains a reserve stock suitable for 2-3 months.
2.8 Water ResourcesDue to geological formation of coral islands in the Maldives, the country does not have surface water resources such as rivers, lakes and streams. Surface water is not common in Maldives except few wetlands in the form of fresh or brackish water bodies. The bulk of the available fresh water exists as shallow water lenses within few meters of the ground surface (Figure 2–27). Groundwater aquifers on islands lie at an average depth of 1-1.5m below the ground surface. On average, the general thickness of the freshwater lens in the islands varies from 3-5 m. However, the thickness of freshwater lens in larger islands is recorded to be almost 25m (MPND, 2002).
Traditionally people used to extract water from these shallow aquifers using open wells. However, in many inhabited islands, groundwater aquifers have been contaminated as a result of salt water intrusion from over extraction, disposal of untreated wastewater into ground and unplanned disposal of solid waste on land. According to the MWSA (2008), use of groundwater for drinking and cooking in the Maldives is less than 2%. In addition to potable use, ground water is also used for non-potable purposes such as irrigation and other domestic purposes.
Rainwater is one of the abundant sources of water available for potable uses. Particularly in the outer islands, it is the main source of drinking water. Ferro cement and steel tanks were mainly used to store harvested rainwater both at household and community level. In 1994 High Density Polyethylene (HDPE) tanks were introduced to replace the ferro cement and steel tanks due to the robustness of these tanks. The capacities of these tanks are 2500 and 5000 litres for household and community tanks respectively. The total rainwater storage capacity in 2009 is estimated to be 116,865m3. After the devastating Indian Ocean tsunami of December 2004, the government initiated a program
to replace the damaged household and community
tanks, thereby distributing a total number of 40,738 household tanks and 3004 community tanks. This program was mainly supported by IFRC, UNICEF and also government of Maldives.
Desalinated water was introduced in Malé City in the 1980s. Desalinated water has been widely introduced to high densely populated islands with limited area as an additional source of portable water after the Indian Ocean Tsunami which caused huge damages to the island’s groundwater acquirers and storage facilities of the affected islands. Desalination plants within the country currently cater 48% of the population (EPA, 2012). In comparison, MHAHE (2001) reports for approximately a quarter of the population had access to desalinated water in 2001. In addition, both locally produced and imported bottled water is widely consumed.
Figure 2-26: Food items imported to the Maldives from 2010 to 2014 (data source: MCS, 2010; 2011; 2012; 2013).
Figure 2-27: Schematic showing a typical water lens of an island(adapted from White et al., 2007)

Second National Communication of Maldives to the United Nations Framework Convention on Climate Change27
02
2.9 Waste ManagementThe waste generated coupled with the geographic nature of the Maldives with small island populations spread over large areas and with limited technology provides a distinct challenge for solid waste management in the Maldives. Solid waste management has been one of the biggest environmental threats. Disposal and treatment capacity available in the country is insufficient. It is estimated that 312,075 metric tons of solid waste are generated per year throughout the country (MoTAC, 2013).
The waste management in the islands varies among islands depending on the availability of disposal facilities and local custom. The segregation of waste by householders is not commonly practiced. The common practice is to take wastes from houses to the informal waste sites where it is openly burnt. The waste collected in Malé City and nearby islands (mostly islands in Kaafu
atoll) and resorts is transferred to an artificially built industrial island named Thilafushi near the capital city of Malé. The waste collected is transferred to Thilafushi by vessels and burnt on a daily basis. Ash and residue from this process is used as landfill material.
The government has undertaken several initiatives to address waste management issues. National Solid Waste Management Policy was formulated in 2008 and a Waste Management Regulation was enacted in 2013. National Solid Waste Management Policy was further revised in 2015. Under these policies waste management centres at islands, regional waste management facilities, systematic waste collection mechanism and pilot waste to energy project are implemented. The most recent development in the waste management sector is the development of Regional Waste Management facility on R. Vandhoo. This facility covers the four northern atolls and plans to process 52 tons of waste daily for 45 inhabited islands, 15 operational resorts, 15 resorts in development, and nine industrial islands (MHTE, 2010).
2.10 HealthThe health status of the people of Maldives has been improved in the past decades. Infant mortality rate (Figure 2–28), has significantly reduced. Access to better health care and expansion of health services to the atoll populations and effective immunization programs played a major role in the fall of mortality rates while life expectancy has increased. Life expectancy at birth has increased from 70.2 (M) and 70.7 (F) years to 73.13 (M) and 74.77 (F) years between 2001 and 2014 for male and female respectively, which is a major achievement over a short period of time. Maldivian health care system has significantly reduced spread of communicable diseases with improved technology and access to health care. Malaria has been eradicated since 1984. Similarly, diseases such as polio, neonatal tetanus,
whooping cough and diphtheria.
Figure 2-28: Infant mortality rate 1984-2014 (data source: DNP, 2010; 2015c; HPA, 2016b)
Ministry of Environment and Energy
Water Solutions

2. National Circumstances 28
022.10.1 Burden of DiseasesThe Maldives is in an epidemiological transition, moving from a higher burden of communicable diseases towards an increasing burden of non-communicable diseases. Table 2–3 shows the annual incidence of some of the prevalent communicable diseases. Diseases such as dengue fever, seasonal influenza and diarrheal diseases have emerged as the major causes of morbidity among the different sections of the population.
With the emerging lifestyle changes associated with development; chronic non-communicable diseases (NCD) account for up to 70% of all deaths have emerged as the main cause of morbidity and mortality in the country.
2.10.2 Health Care SystemThe health care delivery system of Maldives is organized into a four-tier referral system with the island level health facilities referring patients to higher level health facilities in the atolls, regions and to central level depending on the need and service availability. Table 2–4 provide distribution of government funded health care facilities and their levels. The government is committed to improving the health services in the country and increasing the accessibility of services at the very peripheral levels, which due to the dispersed
nature of the population in very small islands exerts diseconomies of scale (MoHG, 2014).
The Government of Maldives is committed to improving the health sector. To improve the affordability and ensure better access to healthcare, government has introduced state sponsored universal health insurance for all Maldivians under the name “Aasandha”. Similarly, private health insurance schemes are also available and mainly targeted to corporate sector.
* Dengue fever includes DHF (Dengue Hemorrhagic fever) and DSS (Dengue Sudden Shock Syndrome) ** Cases of Mumps laboratory confirmatory tests were not done. ***Tetanus reported among adults only
Table 2-3: Incidence of selected communicable diseases 2011-2015 (data source: HPA, 2016a)
Disease 2011 2012 2013 2014 2015
Acute Respiratory Infection 113834 156009 160112 173437 208910
Viral Fever 70608 69974 57796 74931 94124
Acute Gastro Enteritis /Diarrhoea 18979 22796 25949 19954 30442
Conjunctivitis 2878 4224 5181 19370 10174
Chickenpox 1186 1561 2261 1753 2228
Dengue Fever* 2909 1083 681 775 1866
Hand Foot and Mouth Disease 71 79 408 2598 1312
Typhoid Fever 23 81 143 145 134
Scrub Typhus 91 55 77 54 43
Mumps** 69 18 17 57 43
Poliomyelitis /AFP(Acute Flaccid Paralysis) 4 4 2 1 5
Tetanus*** 0 0 0 0 0
Rubella 0 0 0 0 3
Measles 0 0 0 0 0
Table 2-4: Distribution of government health facilities at primary, Regional, Atoll and tertiary levels of care
Care Level
Primary (Island health centres) 165
Regional 6
Atoll hospitals 13
Tertiary (in the capital only) 3

Second National Communication of Maldives to the United Nations Framework Convention on Climate Change29
03
Water Solutions
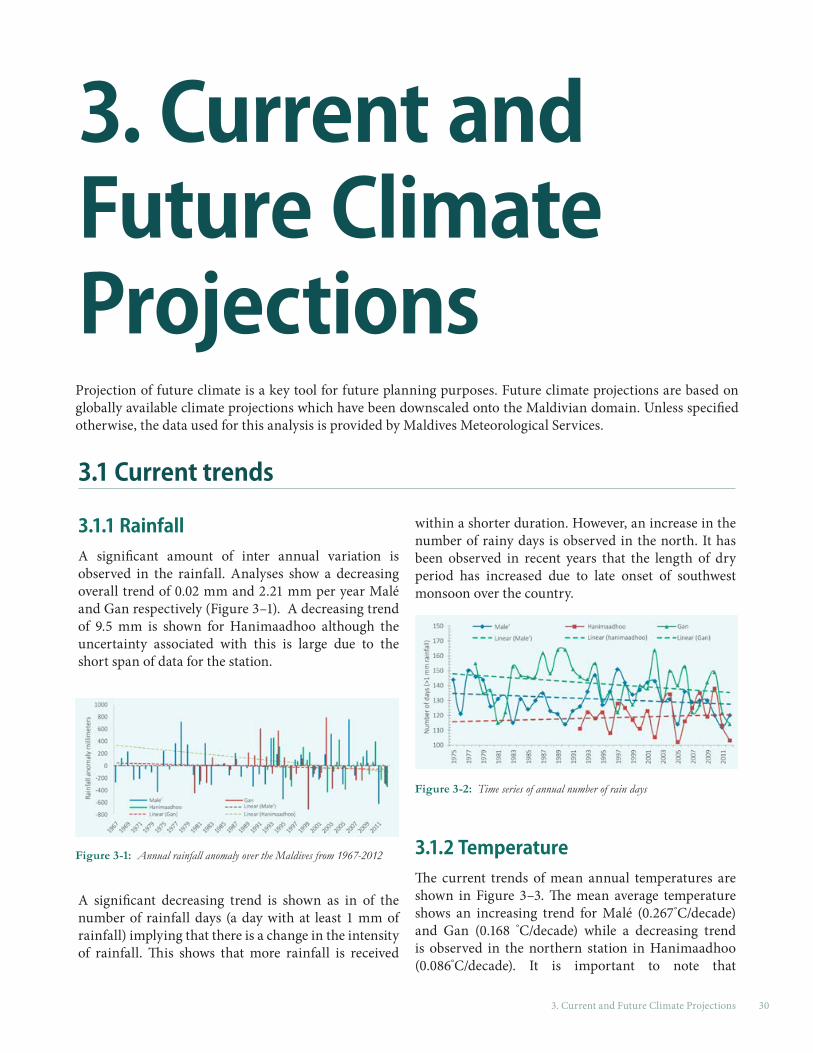
3. Current and Future Climate Projections 30
3. Current and Future Climate Projections
3.1 Current trends
3.1.1 Rainfall A significant amount of inter annual variation is observed in the rainfall. Analyses show a decreasing overall trend of 0.02 mm and 2.21 mm per year Malé and Gan respectively (Figure 3–1). A decreasing trend of 9.5 mm is shown for Hanimaadhoo although the uncertainty associated with this is large due to the short span of data for the station.
A significant decreasing trend is shown as in of the number of rainfall days (a day with at least 1 mm of rainfall) implying that there is a change in the intensity of rainfall. This shows that more rainfall is received
within a shorter duration. However, an increase in the number of rainy days is observed in the north. It has been observed in recent years that the length of dry period has increased due to late onset of southwest monsoon over the country.
3.1.2 TemperatureThe current trends of mean annual temperatures are shown in Figure 3–3. The mean average temperature shows an increasing trend for Malé (0.267°C/decade) and Gan (0.168 °C/decade) while a decreasing trend is observed in the northern station in Hanimaadhoo (0.086°C/decade). It is important to note that
Projection of future climate is a key tool for future planning purposes. Future climate projections are based on globally available climate projections which have been downscaled onto the Maldivian domain. Unless specified otherwise, the data used for this analysis is provided by Maldives Meteorological Services.
Figure 3-1: Annual rainfall anomaly over the Maldives from 1967-2012
Figure 3-2: Time series of annual number of rain days

Second National Communication of Maldives to the United Nations Framework Convention on Climate Change31
03Hanimaadhoo record is 20 years long and therefore is subject to high uncertainty when deriving decadal trends. However, assessment of maximum temperature shows an increasing trend in the northern part of the country (0.21°C per decade) and a decreasing trend (-0.06°C/decade) in the southern part of the country. And increasing trend is also seen in the minimum temperatures (in the northern a trend of 0.25°C/decade is observed and in the south a steep increase of 0.4°C/decade is observed). In general, the trends show an overall steady rise of temperature over the years.
3.1.3 Sea level riseSea level rise is a one of the main concern for low lying islands of the Maldives. Sea level has been systematically recorded since establishment of tide monitoring stations in Malé and Gan in 1989 and 1992 respectively.
Additional tide monitoring station was established at Hanimaadhoo in 2003. Data from Hanimaadhoo station is not included in this assessment as record is too short. This data shows a rise in sea level of 3.753 and 2.933 mm per year in Malé and Gan respectively (Figure 3–4).
3.1.4 Sea surface temperaturesSea surface temperature (SST) is a crucial factor as it can have a huge impact on the health of the coral reef ecosystem and fisheries. Since there are no in-situ SST data collected, satellite data from National Oceanic and Atmospheric Administration (NOAA) was used to analyse the SST. There is an increasing trend in SST throughout the country as in Figure 3–5. A general trend of 0.11 to 0.15°C/decade is observed. SST is observed to be lower in the north compared to the rest of the country.
3.2 Future climate projectionsA high resolution regional climate model was used to downscale Global Climate Model (GCM) outcomes. The downscaling was carried out by Regional Integrated Multi-Hazard Early Warning System (RIMES) to derive the future projections. GCMs selected for downscaling was chosen based on model performance over Maldives and its ability to simulate monsoon precipitation climatology. GCM outputs of HadCM3, MPI ECHAM 5, MRI CGCM 2.3.2a, GFDL CM2.1 were used.
Predictions were based on the IPCC 4th Assessment Special Report on Emission Scenarios (SRES). Following scenarios were used in the simulations.
• A2 – high emission scenario used for statistical downscaling
• A1B – mid-level emission scenario used for dynamical downscaling
• B1 – low emission scenario used for statistical downscaling
The regional model used for dynamic downscaling IPRC-RegCM with 28 vertical levels with high-
Figure 3-3: Time series of annual mean temperature
Figure 3-4: Regional sea level anomaly for the Maldives from 1991 to 2012
Figure 3-5: Sea surface trend in central Maldives (1951-2010) (data source: Rayner et al., 2003)

3. Current and Future Climate Projections 32
03resolution in the planetary boundary layer. The lowest model level is roughly 25 m above the surface. The model domain extends from 50°S to 55°N, 5°E to 170°E with a grid spacing of 0.25° (approximately 30 km horizontal resolution), in both zonal and meridional directions. The climate projections were carried out for 4 geographic zones as shown in Figure 3–6.
3.2.1 PrecipitationRegional scale precipitation changes may be influenced by anthropogenic aerosol emission and also strongly influenced by natural internal variability. Most of the global models shows warming over South Asia is likely to be above that of global mean, due to which intense monsoon precipitation is very likely to be increased and wet days are likely to be decreased (Christensen et al., 2007). Most of these changes are likely to be associated with increase in frequency and intensity of precipitation events, flash-floods, strong winds associated with tropical Cyclones (Christensen et al., 2007).
Downscaled future projections have simulated and resolved climatological precipitation pattern over different regions of Maldives reasonably well. It shows an increase in precipitation over northern and central regions while a decrease
in precipitation over southern region. However, this pattern is different to what is observed in the current trend. The decrease in rainfall is confined to a few degrees in the equator for the years 2021-2050, while an overall increase in rainfall is shown from 2082-2100 years as in Figure 3–7.
3.2.2 TemperatureTemperature projections shows an increasing trend over different zones for the different time periods which is due to the higher CO2 concentrations considered in the different scenarios (Figure 3–8). Mean annual temperature for the time periods 2021-2050 is 1.8 °C higher compared to the base period (1981-2000). Change in temperature over the northern and central regions from 2082-2100 is higher compared to the southern region (Figure 3–9).
3.2.3 Sea level changeThe current available sea level records are not sufficient to provide sea level projections. Therefore, sea surface height projections from the global models are used to predict the changes in sea surface height.
Figure 3-6: D i s s a g r e g a t i o n of regional zones used for climate projections (adopted from MEE, 2015a)
Figure 3-7: Changes in monsoonal rainfall from IPRC RegCM scenario for time slices (2021-2050) and (2082-2100) from baseline (1980-2000). Rainfall change for months MJJASO in %. (adopted from MEE, 2015a)

Second National Communication of Maldives to the United Nations Framework Convention on Climate Change33
03
The maximum sea surface height changes for central and south is projected to vary between 0.40 to 0.48m from 2001 to 2100 with an uncertainty of 0.36 to 0.5m as shown in Figure 3–10. These include uncertainties in the modelling scenarios and the global models.
Since there are no local projections for the sea level rise, the global projections from the Solomon et al. (2007) was considered. A global sea level change of 0.20m to 0.50m is projected by the end of the 21st century as shown in Figure 3–11. Grey shading shows the uncertainty in the estimated long-term rate of change. Red line is a reconstruction of global mean sea level from tide gauges and the red shading denotes the range of variations from a smooth curve. Green line shows global mean sea level observed from satellite altimetry. The blue shading represents the range of model projections for the 21st century, relative to the 1980 to 1999 mean. Such magnitudes of sea level
Figure 3-8: IPRC RegCM annual mean temperature projections (SRES A1B: 2021-2050 & 2082-2100)(adopted from MEE, 2015a)
Figure 3-9: Changes in temperature from IPRC RegCM scenario for time slices (2021-2050) and (2082-2100). Baseline is (1980-2000). Temperature change for months MJJASO in degree Celsius. (adapted from MEE, 2015a)
Figure 3-10: Annual mean sea surface height projections with respect to MSL. Grey shades indicate the range of uncertainty of maximum sea level (adopted from MEE, 2015a)

3. Current and Future Climate Projections 34
03
change can have a significant impact on small islands like Maldives.
3.2.4 Sea surface temperatureFigure 3–12 shows the SST has a rising trend in all four geographic zones in all 3 selected SRES scenarios. SST for the time slice 2030s is found to be in the range 0.76°C to 1.37°C, for 2050s is 1.01°C to 1.93°C and for 2080s is 1.27°C to 3.07°C from the thirty year (1961-1990) mean annual SST over the four zones. In all GCMs considered the results consistently show that SST rise increases towards south of the country in comparison to the north (Figure 3–13).
Figure 3-11: Time series of global mean levels (deviation from the 1980-1999 mean) in the past and as projected for the future. (Adopted from Solomon et al., 2007)
Figure 3-12: Monthly SST projections for 2001-2100 in Maldives over the four zones
Figure 3-13: Predicted range for all scenarios of SST change for all zones with respect to baseline(1961-1990 )

Second National Communication of Maldives to the United Nations Framework Convention on Climate Change35
04
Flickr: Ali

4. Natural Disasters and Extreme Events 36
04
4. Natural Disasters and Extreme EventsThe geography, natural setting, small size of the coral islands of the Maldives makes the entire population and build their infrastructures to be close proximity to the shorelines. Any impacts due to climate change, extreme events and natural disasters makes us as one of the most vulnerable to these effects. Our economic activities too are based on marine and coastal resources, hence any impact on these both makes our economy also as one of the most vulnerable.
Maldives have experienced number of extreme events, including fury of cyclones, localized or freak storms, flooding or inundation of parts of islands due to strong wind and heavy rainfall according to Manik (1990). Some of these events have lead to relocate entire populations of some of islands and coupled to damage to livelihood and economy.
The close proximity of the entire population and the infrastructure of the Maldives to the coast subjects the entire nation to impacts from climate change and other natural disasters. In recent times natural disasters and extreme whether events had a strong impact on the economy and the Maldivian society.
One of the significant events in recent times are; strong tidal wave which occurred in April 1987, storm surges in May 1991 among others.
Both physical and economic vulnerability of Maldives have been identified as one of the highest among the world (Pernetta, 1991) due to extreme weather events and natural disasters. The Indian Ocean Tsunami of December 2004, provided a snap shot of long term slow onset events due to impacts of climate change and sea level rise and vulnerability of Maldives to natural disasters. It was another wakeup call to be more prepared in the event of extreme events and natural disaster. Fragile ecological profile, low elevation, combined with its economic dependence on limited sectors (tourism and fisheries) makes Maldives highly vulnerable to natural disasters.
Disaster Risk Profile of Maldives by UNDP (2006a) identifies following natural disasters as risks to Maldives.• Earthquakes and Tsunamis• Cyclones/Thunderstorms• Floods (due to rain)• Drought (prolonged dry periods) • Storm surges• Strong winds, Tornadoes (waterspouts)

Second National Communication of Maldives to the United Nations Framework Convention on Climate Change37
04
4.1 Earthquakes and Tsunami events Earthquake events have been documented in the archives of Maldives history, where as there is very little recorded evidence of tsunami events. Historical records shows that between 1729 and 1815 Maldives had experienced earthquakes. Although magnitude and exact locations of these historical earthquakes around the Maldives is unavailable, descriptions of the events
indicate extensive damage has been caused (Annex C). In recent times, three major earthquakes of magnitude 7.0 or greater had struck the Maldives region in 1944, 1983 and 2003 (Figure 4–1). Earthquakes are usually felt as tremors without notable damages. However, in 2003 earthquake measuring 7.6 occurring in Carlsberg
Ridge (444 km from most southern atoll-Addu city) had reported some damages in Addu city.
Although 67 tsunamis originated from the Sumatra Subduction zone in the east and 13 from the Makran Coast Zone in the north and Carlsberg Transform Fault Zone in the south since 1816, historical records do not indicate Maldives has been affected by any of these tsunamis. The only record of damages caused by a tsunami in the Maldives is 26th December 2004 Indian Ocean tsunami. This was one of the most apocalyptical natural disasters experienced in the Maldivian history. Wave heights of about 2.5m were recorded in Hanimaadhoo and a wave height of 2.1m
Figure 4-1: Historic earthquake events (adapted from UNDP, 2006).
Figure 4-2: Tsunami on 26th December 2014 where the upper panel is water levels at Hanimaadhoo and lower is for Malé (data from University of Hawaii Sea-level Centre)
Flickr: Hussain Rasheed

4. Natural Disasters and Extreme Events 38
04was observed in the Malé City (Figure 4–2).
It was reported that 26 people missing, 82 dead and more than 2000 homes destroyed with extensive damage to the property and infrastructure (UNDP, 2006). Financial losses were 62% of the GDP which was approximately USD 470 million (ADRC, 2005). The economic repercussions of the tsunami were felt in the following year with a budget deficit of USD 80 million to carry out immediate relief and reconstruction work and drop in the tourism revenues in 2005.
As a result of the tsunami, with the assistance from the international community, the government developed the National Recovery and Reconstruction Plan to address the disaster risk in the post tsunami infrastructure redevelopment in the Maldives. A Safer Island Development Programme was launched to bring comfort to the population which was severely shaken by the tsunami disaster event. The Safer Island Development Programme presents a holistic development agenda of the country bringing together many sectoral developmental initiatives such as the infrastructure and population consolidation (Jameel, 2007).
The key focus of disaster management is to reduce the vulnerability of the communities exposed to hazards and risks and to help them to enhance their resilience. The Hyogo Framework for Action 2005-2015: The Hyogo Declaration(2005) called upon countries to develop strategies to reduce their vulnerabilities by means of integrated environmental and natural resource management approaches that incorporate disaster risk reduction, including structural and non-structural measures and enhance the resilience of the community at the grass root level. In addition, the government undertook several legislative measures and development of projects to address the disaster risk management. This was given a high priority in several key government policy documents and development plans such as the Seventh National Development Plan (2007), the Third National Environmental Action Plan (2009) and the National Sustainable Development Strategy (2009). The Disaster Management Act was enacted in 2015 to strengthen the disaster risk management framework and promote collaboration among various stakeholders so that disaster response measures could be undertaken in a coherent manner.
4.2 Cyclones and thunderstormsAvailable historical records indicate that Maldives has experienced climate/weather related extreme events such as cyclones and storms, floods, droughts, high waves and tornadoes. Compared to the other countries in the region, the islands of Maldives are less prone to cyclones. Occurrences of cyclonic disturbances are observed during the south-west monsoon season from October to January. An analysis of the cyclone tracks shows that 11 cyclones crossed Maldives during 1877 to 2004 (UNDP, 2006). Figure 4–3 shows that northern part of Maldives is more susceptible to cyclones than the south..
The most recent impacts were by cyclones “Nilam” and “Madi” in 2012 and 2013 respectively. Extensive damage due to high wind and flooding due to torrential rain was experienced in several parts of the country during these events.
Figure 4-3: Cyclone tracks which affected the Maldives between 1877 and 2004; (adapted from UNDP, 2006)

Second National Communication of Maldives to the United Nations Framework Convention on Climate Change39
04
4.3 Flooding due to rainAlthough floods due to rain are the most frequent natural events in the Maldives, no criteria exist for the case of the Maldives for declaring flood disasters. Furthermore, no proper mechanism exists for collecting or recording data on flood events and hence it is difficult to determine frequency of floods and their trends for the Maldives. However, studies such as Parthasarathy et al4 (1994) and Zahid (2011) have estimated flood and drought years based on rainfall data. Figure 4–4 shows flood years together with drought years for the three regions of Maldives. It shows that the north and central regions are equally prone to extreme flooding, while the southern region
is less prone to extreme flooding due to rain. It should be noted that this method identifies the likelihood of flooding and actual flood events experienced can be very different.
Figure 4–5 shows an analysis of actual reported cases of flooding due to rain obtained from NDMC, MMS, and other reporting authorities for the period 1990-2013. The highest number of flood events was recorded in 2007 while the highest number of flooded islands
was reported in 2012. There are some discrepancies in similar results from other studies. MEEW (2006) reports that 71 inhabited islands flooded in 2004 alone due to severe weather events. These inconsistencies highlight the need of a proper mechanism for reporting and archiving flood events.
4. Parthasarathy et al (1994) defines excess (wet) or flood year as when monsoon rainfall ( JJAS total rainfall) is Ri≥R +̅S and a deficient (dry) or drought year as when monsoon rainfall ( JJAS total rainfall) is Ri ≤R ̅-S , where Ri is the monsoon rainfall of the ith year,R ̅ is the mean and S is the standard deviation of the data series
Figure 4-5: Flood events due to rain and number of islands impacted by floods.
Water Solutions
Figure 4-4: Flood and drought years for: (a) northern, (b) central and (c) southern Maldives based on Maldives monsoon rainfall. Cross bars indicate the flood years, dotted bars indicate the drought years. Solid line is the sum of mean and standard deviation and dotted line is the difference between mean and standard deviation.

4. Natural Disasters and Extreme Events 40
04
Figure 4-7: Maximum consecutive dry days during the months of December to April.
Based on the extreme rainfall events, a rainfall of more than 50 mm in 24 hour is decided as an extreme rainfall event in the Maldives. The flood impacts associated
with a particular rainfall threshold may depend on geography (whether the island has low lying and flood prone areas), shape, soil type and the depth of the water lens of that particular island. As flash flood impacts associated with particular rainfall threshold values can have different impacts on different islands, rainfall threshold range can be used identifying flood related impacts as in Annex F.
An analysis of the return periods of the extreme rainfall events (Figure 4–6) indicate that the extreme flooding events are likely to become more frequent in the future with changing climate. A daily rainfall of 150 mm for the northern region is a 300 year event which might become a 23 year event by the end of the century. Similarly a 190 mm rainfall for the central region, currently 387 year event, could become a 62 year by the end of the century.
4.4 DroughtSimilar to flood events, no proper mechanism exists for collecting or recording data on drought events in the Maldives, and hence data on drought or prolonged dry periods are lacking. Furthermore, no criteria exist for declaring drought events for the Maldives. As shown in Figure 4–4 the northern and central regions show an equal number of deficit rainfall years (4 deficit rainfall
years), indicating that these two regions are equally prone to drought events.
In order to determine prolonged dry periods, greatest number of consecutive dry days (CDD) (Figure 4–7) between December-April (longest period of consecutive days with no or less than 1 mm precipitation) was
Figure 4-6: Observed and predicted ( for years 2025, 2050, 2075 and 2100) return periods for: (a) northern, (b) central and (c) southern Maldives regions based on daily rainfall for the periods 1992-2009 (northern), 1975-2009 (central) and 1980-2009 (southern); (adapted from Zahid, 2011).
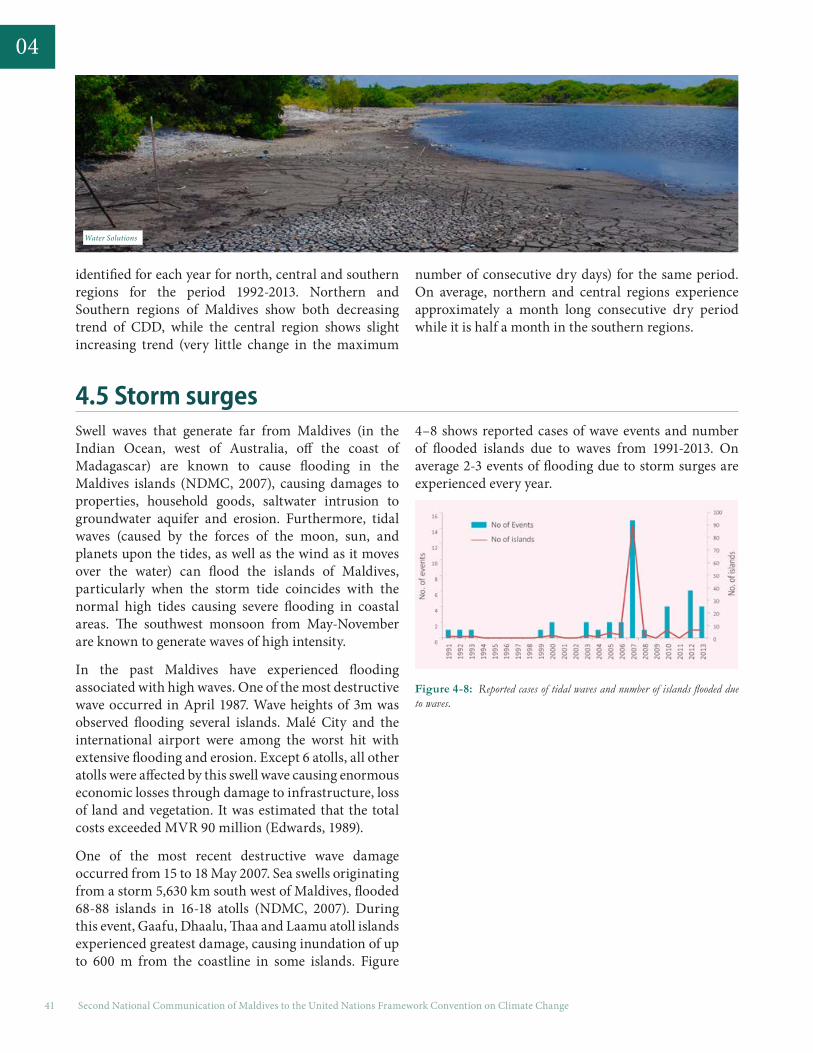
Second National Communication of Maldives to the United Nations Framework Convention on Climate Change41
04
identified for each year for north, central and southern regions for the period 1992-2013. Northern and Southern regions of Maldives show both decreasing trend of CDD, while the central region shows slight increasing trend (very little change in the maximum
number of consecutive dry days) for the same period. On average, northern and central regions experience approximately a month long consecutive dry period while it is half a month in the southern regions.
4.5 Storm surgesSwell waves that generate far from Maldives (in the Indian Ocean, west of Australia, off the coast of Madagascar) are known to cause flooding in the Maldives islands (NDMC, 2007), causing damages to properties, household goods, saltwater intrusion to groundwater aquifer and erosion. Furthermore, tidal waves (caused by the forces of the moon, sun, and planets upon the tides, as well as the wind as it moves over the water) can flood the islands of Maldives, particularly when the storm tide coincides with the normal high tides causing severe flooding in coastal areas. The southwest monsoon from May-November are known to generate waves of high intensity.
In the past Maldives have experienced flooding associated with high waves. One of the most destructive wave occurred in April 1987. Wave heights of 3m was observed flooding several islands. Malé City and the international airport were among the worst hit with extensive flooding and erosion. Except 6 atolls, all other atolls were affected by this swell wave causing enormous economic losses through damage to infrastructure, loss of land and vegetation. It was estimated that the total costs exceeded MVR 90 million (Edwards, 1989).
One of the most recent destructive wave damage occurred from 15 to 18 May 2007. Sea swells originating from a storm 5,630 km south west of Maldives, flooded 68-88 islands in 16-18 atolls (NDMC, 2007). During this event, Gaafu, Dhaalu, Thaa and Laamu atoll islands experienced greatest damage, causing inundation of up to 600 m from the coastline in some islands. Figure
4–8 shows reported cases of wave events and number of flooded islands due to waves from 1991-2013. On average 2-3 events of flooding due to storm surges are experienced every year.
Figure 4-8: Reported cases of tidal waves and number of islands flooded due to waves.
Water Solutions

4. Natural Disasters and Extreme Events 42
04
4.6 Strong winds and tornadosMaldives experience strong winds during monsoon season, from May to November. Strong winds can damage vegetation, houses, communication systems, roads and causeways. Sustained strong winds can lead to rough seas thus disrupting sea transportation, in which most of the Maldivians depend on for commuting between islands and for transporting goods and food items. Rough seas associated with strong winds have caused ship wrecks and boat accidents, causing damages to boats and sometimes threatening lives. Strong winds have disrupted air transportation services in the Maldives. Figure 4–9 shows the reported cases of damage due to strong wind.
Analysis of return periods of wind indicates that gust wind speed of 50 miles per hour is almost an every year
event for the country as a whole (Figure 4–10).
Tornados are not very common in Maldives. However, small in size “weak” tornados have been reported. Figure 4–11 shows the number of reported cases due to damage from tornados. It indicates that number of incidences has increased in recent times.
Figure 4-9: Reported cases due to strong wind. Figure 4-10: Return periods for gust wind speeds
Figure 4-11: Reported cases of tornado events.

Second National Communication of Maldives to the United Nations Framework Convention on Climate Change43
05
Water Solutions

5. National Greenhouse Gas Inventory 44
5. National Greenhouse Gas Inventory
5.1 MethodologyThe guidelines provided in section III of ‘Guidelines for preparation of national communications from Parties not included in Annex 1 to the Convention’6
(NAI NC guidelines) forms the basis for developing and executing the GHG inventory. One deviation from NAI NC guidelines is the use of the more recent ‘2006 Intergovernmental Panel on Climate Change (IPCC) Guidelines for National Greenhouse Gas Inventories’ (2006 IPCC Guideline).
Tier 1 Reference approach from 2006 IPCC Guideline is used to calculate emissions for 2011 which is consistent with the methodology used in (MHAHE, 2001). Tier 1
Sectoral approach is adopted to develop GHG inventory reflective of our national circumstances. Tier 1 of 2006 IPCC guidelines make use of default emission factors to choose from as appropriate. The IPCC Inventory Software was used to develop and archive the national GHG inventory.
The main GHG emissions reported in the inventory are CO2, CH4 and N2O from the energy and waste sectors. Emissions from these different gases are converted to a common unit of CO2 equivalent (CO2e) using the values in Table 5–1.
5. Decisions taken by the 17th Conference of the Parties to the UNFCCC; Decision number 2/CP 17, paragraph 41 (a) and paragraph 58 (b)
6. Decisions taken by the 8th Conference of the Parties to the UNFCCC; Decision number 17/CP.8
Maldives, as a non-Annex party to the UNFCCC and its Kyoto protocol, is not obliged to reduce these emissions. However, it is required to submit a National Greenhouse Gas (GHG) inventory as part of its national communications to the UNFCCC every four years and GHG inventory updates as part of biennial update reports to the Convention every two years. Small Island Developing States (SIDS) are allowed flexibility on the frequency of these reports5 .
The first GHG inventory of the Maldives was reported for the year 1994 for the FNC submitted to the UNFCCC in 2001. The 1994 GHG inventory of the Maldives shows that the main emissions were from the energy sector. The total emissions from the energy sector were estimated to be 128.995 Gg of CO2 and the emission of CH4 from landfills was estimated to be 1.142 Gg of CH4. The total GHG emissions of the Maldives were 152.977 Gg of CO2e which is only 0.0012% of the global emission from the energy sector (MHAHE, 2001).
This chapter provides the estimates of the GHG inventory of the Maldives for the year 2011. The chapter describes the methodology undertaken to develop the GHG emissions inventory, including the uncertainties and assumptions made has been provided in this chapter. GHG emissions are presented by sector and emission type. The current GHG emission trends in the Maldives and a comparison with global and other SIDS are presented.

Second National Communication of Maldives to the United Nations Framework Convention on Climate Change45
05
5.1.1 Key Category AnalysisThe 2006 IPCC Guideline suggested key category analysis is an important part of building a national GHG inventory. This exercise identifies key categories and gases to be reported. Approach 1 Level Assessment is suggested in the 2006 IPCC Guideline when emission inventory is available for one year. However, as 1994 emission was calculated in reference approach, there
is no segregation of emission sector wise or gas wise. (MHAHE, 2001) indicates that most of the energy is used for electricity generation and transport. This is confirmed by later report with sectoral breakdown of energy use (MHE, 2010; MEA, 2014). Based on these reports, following sectors is considered as key categories for Maldives national GHG inventory for 2011.
• Electricity generation• Transport (water borne, land and air)• Other energy use (fisheries and domestic/
commercial food preparation)• Waste
5.1.2 Data CollectionData collection exercise was planned and conducted based on the key category analysis. The exercise initially concentrated in obtaining the information from existing literature. Most of the activity data required for Tier 1 Sectoral approach was available from existing literature. Additional information was collected to fill in gaps in the data and for validation and verification purposes. Table 5–2 below shows the sources of the data used.
5.1.3 Uncertainty and AssumptionsTier 1 Sectoral approach was used in the main emission estimations, due to lack of data in some categories/subcategories. Therefore, the default values of the emission factors given by IPCC and their uncertainty values were used. Uncertainty analysis using trend approach was not feasible due to lack of historical emission data. The main uncertainties and assumptions considered during the inventory process are given in Table 5–3.
Industrial designation or common name
Chemical formula GWP for 100-year time horizon
Carbon dioxide CO2 1
Methane CH4 21
Nitrous oxide N2O 310
Table 5-1: Global Warming Potential (GWP) values from Second Assessment Report (SAR)
Table 5-2: Data sources for GHG inventory Sectoral approach
Sectors Data Sources
Electricity Generation
• National Energy Supply and Demand Report 2010 – 2012
• Power house logs from FENAKA and STELCO
• Data Collected for Carbon Audit 2009
Transport (land, sea and domestic air transport)
• National Energy Supply and Demand Report 2010 – 2012
• Statistical Yearbook 2012 • Data collected from Island Aviation
and Ibrahim Nasir International Airport
• Data Collected for Carbon Audit 2009
Energy - Other sectors
• National Energy Supply and Demand Report 2010 – 2012
• Statistical Yearbook 2012 • Household Income and Expenditure
Study 2009• Import statistics for LPG
Waste
• National Waste Management Policy 2008
• North Province Regional Waste Management Project: Technical and Financial Feasibility Report (2011)
• Malé Waste Audit 2008• Statistical Yearbook 2012 • Data collected from Fuvahmulah
for SNC

5. National Greenhouse Gas Inventory 46
05
5.1.4 Verification and ValidationThe data were complimented with additional information collected including import data from MCS. This is further validated by comparing the results with previous energy balance studies, carbon audit 2009 (MHE, 2010), waste audits (ERC, 2008; IT power India Pvt. Ltd, 2007; MHTE, 2010). Verification of the activity data was carried out through the low-carbon development strategies exercise (MEE, 2014b) and statistical data that was collected by various government institutions. In addition, internal stakeholder interviews were also conducted to verify some of the data.
In addition to the data the results were validated by comparing the outputs of Reference and Sectoral approach for 2011. This method was chosen because calculation was done using two different sources of information. The result shows a marginal difference of 0.42% between the approaches.
5.2 Maldives GHG emission 2011The summary of emissions from sectoral approach by type of GHGs is given in Table 5–4. Full table of emission are provided in Annex B. As can be seen from Table 5–4, CO2 is the main GHG emission for the Maldives accounting for 94.8% of the total emission. Emission from international aviation has been noted but is not accounted in the national totals.
The emissions from the energy and waste sectors were 1152.869 Gg CO2e and 72.729 Gg CO2e respectively and the total emissions was 1225.598 Gg CO2e. From reference approach the total emissions for energy sector was at 1146.512 Gg CO2e.
5.2.1 Energy useEnergy sector contributes 94.1% of total GHG emissions. Maldives has no proven natural or conventional energy sources such as coal, oil or gas. The demand for energy is met by imported fossil fuel. There has been a consistent growth of fossil fuel import as shown in Figure 5–1. The major fuel types imported are diesel, petrol (gasoline), aviation fuel (Jet A-1) and liquefied petroleum gas (LPG). Diesel is mainly used for electricity generation while petrol and aviation fuel is used for domestic transport and LPG is used for cooking purposes.
Sectors Uncertainty/Assumption
Energy Industries(emissions from electricity generation, desalination and LPG for cooking)
• EF Tier 1 is proposed for electricity as tier 2 uses country specific EF which is currently not developed.
• Island wise, emission factors vary and there are significant uncertainties in the energy generation and transmission losses.
• Fugitive emissions have not been recorded in the past and may not be significant.
• Bunkering was considered as this would be needed to check from the reference approach
Transport(emissions from land, sea and domestic air transport)
• National Energy Supply and Demand Report 2010 – 2012
• Statistical Yearbook 2012 • Data collected from Island
Aviation and Ibrahim Nasir International Airport
• Data Collected for Carbon Audit 2009
Waste
• National Energy Supply and Demand Report 2010 – 2012
• Statistical Yearbook 2012 • Household Income and
Expenditure Study 2009• Import statistics for LPG
Table 5-3: Uncertainties and assumptions in the GHG Inventory 2011
Greenhouse gas source and sink categories
Net CO2 (Gg)
CH4 (Gg) N2O (Gg)
Total National Emissions and Removals 1161.573 2.253 0.054
1 - Energy 1146.512 0.083 0.015
1A - Fuel Combustion Activities 1146.512 0.083 0.015
1A1 - Energy Industries 775.820 0.031 0.006
1A3 - Transport 260.673 0.039 0.008
1A4 - Other Sectors 110.019 0.013 0.001
6 - Waste 15.060 2.170 0.039
6C - Waste Incineration 15.060 2.170 0.039
Memo Items
International Bunkers 400.277 0.003 0.011
1A3a1 - International Aviation 400.277 0.003 0.011
Table 5-4: 2011 GHG emission Summary Table
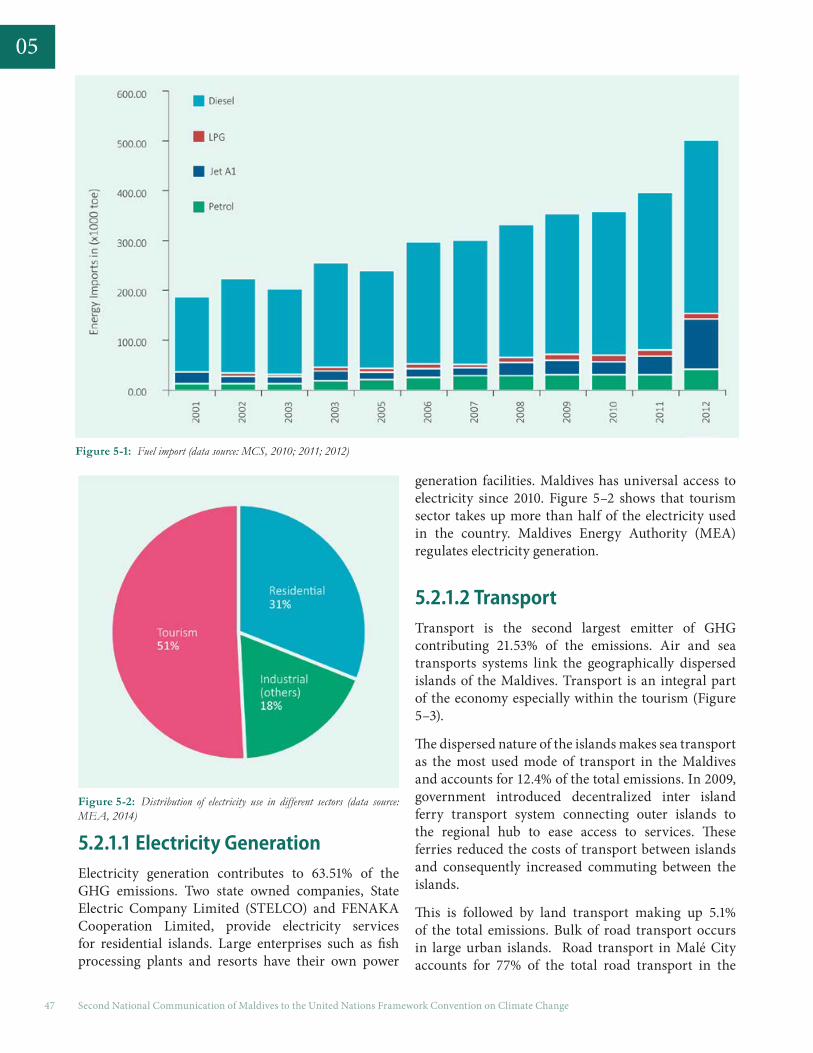
Second National Communication of Maldives to the United Nations Framework Convention on Climate Change47
05
5.2.1.1 Electricity GenerationElectricity generation contributes to 63.51% of the GHG emissions. Two state owned companies, State Electric Company Limited (STELCO) and FENAKA Cooperation Limited, provide electricity services for residential islands. Large enterprises such as fish processing plants and resorts have their own power
generation facilities. Maldives has universal access to electricity since 2010. Figure 5–2 shows that tourism sector takes up more than half of the electricity used in the country. Maldives Energy Authority (MEA) regulates electricity generation.
5.2.1.2 TransportTransport is the second largest emitter of GHG contributing 21.53% of the emissions. Air and sea transports systems link the geographically dispersed islands of the Maldives. Transport is an integral part of the economy especially within the tourism (Figure 5–3).
The dispersed nature of the islands makes sea transport as the most used mode of transport in the Maldives and accounts for 12.4% of the total emissions. In 2009, government introduced decentralized inter island ferry transport system connecting outer islands to the regional hub to ease access to services. These ferries reduced the costs of transport between islands and consequently increased commuting between the islands.
This is followed by land transport making up 5.1% of the total emissions. Bulk of road transport occurs in large urban islands. Road transport in Malé City accounts for 77% of the total road transport in the
Figure 5-1: Fuel import (data source: MCS, 2010; 2011; 2012)
Figure 5-2: Distribution of electricity use in different sectors (data source: MEA, 2014)

5. National Greenhouse Gas Inventory 48
05
Maldives. Transport Authority of Maldives regulates Road and sea transport.
Air transport contributes 4% of the total GHG emission for 2011. In the past 10 years, aviation sector infrastructure has shown a rapid development mainly due to the establishment of domestic airports at various regions of the Maldives. Currently there are four international airports and seven domestic airports operational while two more domestic airports are under development. In addition, there is a large sea plane fleet that operates to resort islands from Ibrahim Nasir International Airport. Being a popular holiday destination, Maldives has a large influx of international flights. Ibrahim Nasir International Airport is well connected with international hubs from Asia and Europe. Civil Aviation Authority regulates air transport.
5.2.1.3 Other Energy SectorsEmissions from the other energy sector makes up 9.02% of the total emission. Most of this emission is attributed to fisheries (including transport) which make up 6.3% of the total emissions. The remainder 2.72% is from domestic and commercial/institutional activities. This is mostly from use of LPG and kerosene for cooking and food preparations.
5.2.2 WasteEmission from waste amounts for 5.9 % of the total emission in 2011. Waste is also the main source of methane (96.3%) and nitrous oxide emissions (72.2%). It is estimated that 860 tons of waste is generated per day in Maldives. Waste from tourism sector is the largest with an average rate of 7.2 kg waste generated per guest per day. In comparison the waste generation in Malé City and other islands is estimated to be 2.8 kg and 1 kg per person per day respectively (MoTAC, 2013). Figure 5–4 below shows the average mix of waste generated in the Maldives based on previous waste audit conducted in different islands and sectors over the past 10 years. Due to the pre-burning and high water table methane emission from Thilafushi landfilling has not been considered in the GHG Inventory.
Figure 5-4: Type of waste generated in Maldives
Figure 5-3: Distribution of energ y consumption for transport (excluding aviation) in different sectors (data source: MEA, 2014)

Second National Communication of Maldives to the United Nations Framework Convention on Climate Change49
05
5.3 GHG Emission Trends The emissions have grown from 152.98 Gg CO2e in 1994 to 1225.6 Gg CO2e in 2011. The specific emissions increased from 625 kg CO2e per capita in 1994 to 3697 kg CO2e per capita in 2011 and from 170 g CO2e per GDP(PPP) $ to 291 g CO2e per GDP (PPP) $. Total emissions have grown at an average rate of 13% per year in the past 16 years (Table 5–5).
However, as seen in Figure 5–5 GHG emission from the energy sector increases at an approximate rate of 7% per year for the last 10 years. Since energy sector is dominant contributor to the total emissions, this
approximate growth rate would be representative of total emission growth in the past 10 year.
According to the MEE (2014b), the Maldives GHG emissions were estimated to increase to about 2,000 Gg CO2e by 2020 while MHE (2010) estimates it to increase up to 2,500 Gg CO2e by 2020. Electricity generation and transport sector would be the main GHG emitters from the Maldives.
Indicators 1994 2011 Annual Growth
Total GHG emission (Gg CO2e) 152.977 1225.598 13.05%
Energy 128.995 1152.869 13.78%
Waste 23.982 72.729 6.75%
Emission per Capita (kg CO2e/ capita) 624.692 3696.604 11.025%
Table 5-5: Comparison of GHG inventory for 1994 and 2011
Figure 5-5: GHG inventory from energ y use in Maldives from 2002-2012

5. National Greenhouse Gas Inventory 50
05
7. Information derived from World Development Indicators 2015, Table 3.8, whereas SAARC and SIDS average is derived from their latest submission to UNFCCC as available online
5.4 Comparison of GHG emissionMaldives is an archipelago or island state and the only SIDS in the South Asian region. The South Asian region also hosts one of the largest emitters, India and the most populous LDC, Bangladesh. Emission indicators such as per capita emission and emission per international GDP $ are used for comparison. Given that, in this inventory emissions from Agriculture, Forestry and Land Use (AFOLU) sectors are excluded, the comparison is made with emission estimates which also exclude these emissions.
Figure 5–67 shows a comparative chart for per capita GHG emission of Maldives with other regions. Maldives per capita emission is lower than the global average and less than half of SIDS average per capita emissions. Figure 5–7 shows that emission intensity against GDP is much closer to SIDS average and almost half of Upper Middle Income countries. It is important to note that in both indicators Maldives is approximately three times larger than the SAARC average.
Figure 5-6: Comparison of Maldives Emission per Capita with other groups of countries
Figure 5-7: Comparison of Maldives Emission per GDP international $ with other similar groups of countries

Second National Communication of Maldives to the United Nations Framework Convention on Climate Change51
06
Ministry of Enviorment and Enrgy

6. Mitigation 52
6. Mitigation
6.1 Energy SectorEnergy sector is the dominant source of GHG emissions in the Maldives. This sector is also closely linked with economic growth (Figure 6–1). By virtue of the fact that more than 99% of the energy sector demand is met with imported fossil fuels, the burden on the economy equates with nearly half a billion dollars being spent on fuel imports in 2014. The chain reaction of this on the economy, makes it highly vulnerable to any volatility within the international fossil fuels markets. Accordingly, mitigation in energy sector would reduce and curtail the vicious cycle of dependency on fossil fuel and maximize the overall energy security. The available options for mitigation entail the proliferation of renewable energy and increasing energy efficiency from operations, production and consumption. Many of the mitigation options available in energy sector are more economically viable and has a significant potential for abatement with negative net costs, or net economic benefits (Figure 6–2).
The total GHG emission for the Maldives for the year 2011 was 1225.598 Gg CO2e which is less than 0.0035% of the global GHG emissions. The total GHG emission for the Maldives for the year 2011 was 1225.598 Gg CO2e which is less than 0.0035% of the global GHG emissions. This is an evidence of its stringent measures undertaken for achieving the ultimate objective of the UNFCC Convention and co-benefits of climate policy. The Maldives intends to reduce its emissions by 24% from business as usual (BAU) by 2030, with support from international partners and includes concerted effort in the development of renewable energy, increased resource efficiency and dis-incentivising the usage of fossil fuels
This chapter recapitulates the status of the existing mitigation measures of the key sectors identified in the GHG inventory of the Maldives. It also outlines the more long term, sustainable measures planned for the future.
Figure 6-1: Correlation between energ y consumption and GDP in Maldives (2001 – 2011)

Second National Communication of Maldives to the United Nations Framework Convention on Climate Change53
06
6.1.1 Electricity GenerationIsolated nature of the islands necessitate that each of the islands operate a power generation facility. The resorts islands produce and consume more than 50% of the national electricity production (refer chapter 5). The administrative Island Malé consumes more than half of the electricity generated in all the inhabited islands. The power demand in the Malé city increases at an annual rate of 10% (Figure 6–3). The levelized cost of electricity (LCOE) varies between USD 0.31- 0.46 /kWh around the country (MEE, 2012b).
Given that the electricity generation is the single largest source of energy consumer in the country, it a sector with an enormous potential for mitigation potential and is a priority area for wide array of mitigation interventions that can be broadly classified into renewable energy and energy efficiency.
6.1.1.1 Renewable EnergyA Renewable energy pilot project was implemented by Ministry of Environment, Energy and Water and with the funding from GEF. As part of this project renewable energy resource assessments were undertaken to identify potential sources of renewable energy and showcased solar photovoltaic (PV) installations and financial scheme for renewable energy.
Solar energy and wind power are the most abundant resources of energy in the Maldives. Studies by NREL (2003a) disclose that the Maldives has plentiful solar energy resources throughout the country, irrespective of the seasonal effects and location (Figure 6–5). Another study by NREL (2003b) elucidates that wind energy resources are found in abundance from the Figure 6-3: Electricity consumption and demand in Malé City from 1995-
2011 (Data source: Mohamed, 2012)
Figure 6-2: Abatement cost curve for mitigation measures identified for Maldives. Source: INDC 2015

6. Mitigation 54
06
Figure 6-4: Maldives solar resource map(adapted from NREL, 2003a)

Second National Communication of Maldives to the United Nations Framework Convention on Climate Change55
06
Figure 6-5: Maldives wind resource map (adapted from NREL, 2003b)

Box 1. First fully solar-powered school in the Maldives
VESHI (Volunteers for Environment, Social Harmony and Improvement) with a grant from the GEF Small Grants Programme (GEF SGP) installed 2.8 kW solar PV at Addu High School as part of renewable energy demonstration project.
The project inspired high school student to understand energy use patterns in their homes and school with a particular emphasis on cooling and lighting – the most significant areas of energy consumption in domestic and business settings. VESHI conducted a series of workshops to teach students how to conduct their own energy audits, facilitated to research on solar energy, LED lights, cooling systems and photovoltaic panels and how renewable energy could be procured locally. The students design and ultimately executed a complete solar energy system capable of powering one classroom via feed-in tariff regulation through the grants provided by SGP. The PV system helped the high school to lower their electricity bill by 7%. This project was nominated and awarded the Abu Dhabi-based Zayed Future Energy Prize, which is aimed at providing solutions to create a sustainable energy future. Using the prize money, Addu High School is installing 48 kW of solar PV to convert 100% of their school’s energy demand to renewable energy.
The GEF SGP was established in 1992 with the aim of promoting sustainable development and environmental conservation through direct action of communities. In the Maldives, SGP was launched in 2010, with USD 150,000 in grant funds. In phase 5 of the programme, USD 1.2 million was given as grants over four years (2011-2014). Funded by the Australian Government Overseas Aid Program (AusAID), the SGP also delivered a specific grant component with the objective to improve the adaptive capacity of communities and to reduce their vulnerability to the impacts of climate change.
6. Mitigation 56
06north-central Maldives to the north of Maldives (Figure 6–6). However, the effective integration of intermittent sources like solar in an electric power grid, with limited storage capacity impacts the stability of the grid and quality of service provided. JICA (2009) ), specifies that solar photovoltaics (PV) without storage can be integrated up to 30% of the demand load. As per MEE (2014b), LCOE generated from grid integrated PV installations with no storage vary between USD 0.21-0.29 /kWh. PV systems with storage, has the potential of completely displacing the diesel power generation. However, LCOE increases up to USD 0.42 /kWh, which only makes it feasible for small and inefficient power systems.
Based on early experiences, government has taken a policy decision that 30% of peak day-time demand to be met by solar PV. To realize this goal, the Government have launched number of projects and programmes with assistance from various development partners. Key regulatory measures taken are;
• Removal of import duty from all renewable energy equipment,
• Introduction of regulation for independent power producers,
• Introduction of feed in tariff and most recently net-metering for domestic scale use of RE.
Furthermore, in order to promote and facilitate investment in renewable energy, the government has established two financial instruments, namely the Fund for Renewable Energy Systems Application (FRESA) and the Renewable Energy Development Fund (RED fund). While the FRESA focus on small scale private sector investment through concessional loans, the RED fund is supplements utility scale renewable energy investments.
By end of 2015, through a wide variety of projects and programs, the government has installed 1.886 MWp of solar PV in Maldives (Mohamed, 2016). At the same time, thriving private sector investments have also installed 2.252 MWp of solar PV by utilizing various opportunities provided. Seemingly, these investments are a threefold increase of renewable installations since 2011.
At present, the government is in a process of implementing the ‘Scaling up Renewable Energy Program’ (SREP) with initial financing from Climate Investment Fund (CIF) aiming to transform the energy sector by increasing the renewable energy share in the energy mix (refer Box 3). This programs aims to facilitate investments of 20MWp and 21MWp of solar PV in Malé city and other inhabited islands. The overall impact of mitigation from this program is envisaged to result in a reduction of 1.9 % from 2030 BAU emission.
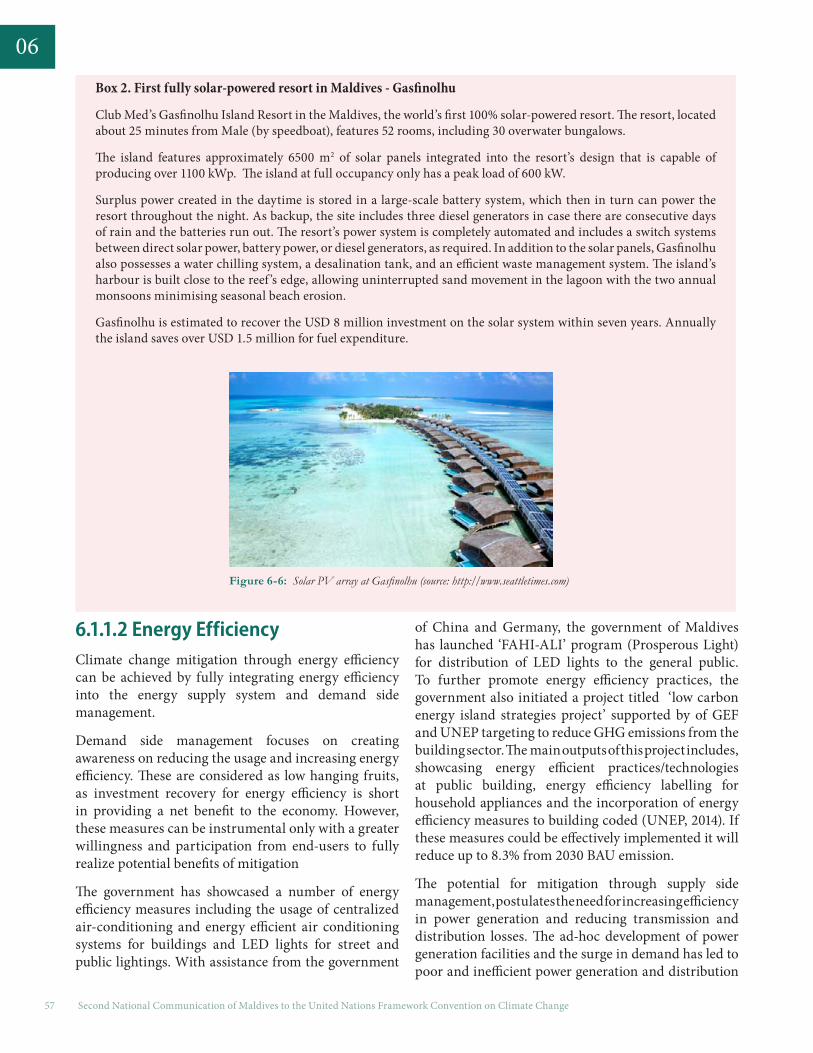
Box 2. First fully solar-powered resort in Maldives - Gasfinolhu
Club Med’s Gasfinolhu Island Resort in the Maldives, the world’s first 100% solar-powered resort. The resort, located about 25 minutes from Male (by speedboat), features 52 rooms, including 30 overwater bungalows.
The island features approximately 6500 m2 of solar panels integrated into the resort’s design that is capable of producing over 1100 kWp. The island at full occupancy only has a peak load of 600 kW.
Surplus power created in the daytime is stored in a large-scale battery system, which then in turn can power the resort throughout the night. As backup, the site includes three diesel generators in case there are consecutive days of rain and the batteries run out. The resort’s power system is completely automated and includes a switch systems between direct solar power, battery power, or diesel generators, as required. In addition to the solar panels, Gasfinolhu also possesses a water chilling system, a desalination tank, and an efficient waste management system. The island’s harbour is built close to the reef ’s edge, allowing uninterrupted sand movement in the lagoon with the two annual monsoons minimising seasonal beach erosion.
Gasfinolhu is estimated to recover the USD 8 million investment on the solar system within seven years. Annually the island saves over USD 1.5 million for fuel expenditure.
Second National Communication of Maldives to the United Nations Framework Convention on Climate Change57
06
6.1.1.2 Energy EfficiencyClimate change mitigation through energy efficiency can be achieved by fully integrating energy efficiency into the energy supply system and demand side management.
Demand side management focuses on creating awareness on reducing the usage and increasing energy efficiency. These are considered as low hanging fruits, as investment recovery for energy efficiency is short in providing a net benefit to the economy. However, these measures can be instrumental only with a greater willingness and participation from end-users to fully realize potential benefits of mitigation
The government has showcased a number of energy efficiency measures including the usage of centralized air-conditioning and energy efficient air conditioning systems for buildings and LED lights for street and public lightings. With assistance from the government
of China and Germany, the government of Maldives has launched ‘FAHI-ALI’ program (Prosperous Light) for distribution of LED lights to the general public. To further promote energy efficiency practices, the government also initiated a project titled ‘low carbon energy island strategies project’ supported by of GEF and UNEP targeting to reduce GHG emissions from the building sector. The main outputs of this project includes, showcasing energy efficient practices/technologies at public building, energy efficiency labelling for household appliances and the incorporation of energy efficiency measures to building coded (UNEP, 2014). If these measures could be effectively implemented it will reduce up to 8.3% from 2030 BAU emission.
The potential for mitigation through supply side management, postulates the need for increasing efficiency in power generation and reducing transmission and distribution losses. The ad-hoc development of power generation facilities and the surge in demand has led to poor and inefficient power generation and distribution
Figure 6-6: Solar PV array at Gasfinolhu (source: http://www.seattletimes.com)

6. Mitigation 58
06
systems, especially in smaller islands (Table 6–1).
While it is both financially and technically viable to upgrade the outer island power systems for reaching overall system efficiency level of 35%, upgrading the existing power infrastructure requires extraordinary initial investments. Supply side efficiency measures are addressed through SREP (MEE, 2012b) by upgrading the current transmission system for solar PV integration. In resorts, the scope for supply side energy efficiency is limited as measures such as waste heat recovery and co-generation are already in place. Supply side energy efficiency measures under taken currently can potentially reduce 2% from 2030 BAU emission.
6.1.2 TransportTransport sector is also a major contributor to the GHG emissions in the Maldives. The geographic uniqueness of the Maldives pose challenges for mitigating emissions from the transport sector. In the absence of mitigation measures in the transport sector, GHG emissions are projected to increase nearly 287% by 2030. While the majority of transport activities are carried by means of sea and air, the lack of feasible mitigation options in air and sea transport, has translated the central focus on air traffic management and increasing the overall efficiency of vessel. Following the resolutions of ICAO (A38-18) the air traffic control at Ibrahim Nasir International Airport provides the shortest and the most direct route available for airplanes to travel in Maldivian airspace. Similarly, sea-ferry operators in Malé City, have coordinated the routes to avoid congestion and reduce idle time on sea. The largest ferry operator, the Maldives Transport and Contracting Company (MTCC), have also made efforts to maximize the distance travelled per litre of diesel in their vessels, by establishing practices such as cruising at optimum speeds. Hence, although the emission amount is relatively limited, the greatest challenge rests with the collection of data for tracking
Table 6-1: Generation system efficiencies around the country (adapted from MEA, 2014)
Thermal Con-version
Technical Loss Overall system efficiency
Malé City 38% 7% 35%
Capital islands 35% 10% 31%
Others NA NA 22% - 39%
Ahmed Zahir

Second National Communication of Maldives to the United Nations Framework Convention on Climate Change59
06the reduction in emission from these operations.
The prospects for mitigation in the land transport is more desirable than in air and sea transport. The Land transport system in the Maldives is dominated by motorcycles followed by an apparent increase in cars in the past few years (Figure 6–7). Taking into account
that much of the land transport is concentrated in Malé City, the government has undertaken a series of initiatives for improving road conditions relating to safety, mobility and liveability reduce congestion and introduce public transport services. In addition, the Transport Authority has also introduced regulations on an age limit for vehicles primarily aimed at retiring old, inefficient and high-emitting vehicles. This step is likely to increase the overall fuel economy of the vehicles on the road and in essence by increasing the overall fuel economy from 15 km/l to 25 km/l, would reduce emissions by 0.73 % from 2030 BAU and in turn save up to USD 10 million from the economy annually (MEE, 2014b).
Transport Authority also plans to revisit and improve their existing regulations to address some environmental concerns and seek further avenues for a more sustainable development of the transport sector.
6.1.3 Others Energy SectorsThis subsection discusses energy usage in the Maldives other than electricity generation and transport. It also presents methods that can be used to mitigate emission in these areas. The consumption of LPG and kerosene in cooking represents 2.72% of the GHG emissions. LPG use is forecasted to grow by 12% p.a. whereas usage of kerosene is foreseen to decrease significantly. Replacing LPG for cooking with electricity would negatively contribute to emissions reductions given the low penetration of renewable energy in grid power systems.
The Maldives fisheries industry is considered as a major emission source under this subsector. The fishing vessels in the Maldives travel far and long for the catch and thus most of the emissions originate from transport sector. In addition, due to long trips vessels also use energy for cooking as well and cold storing of the catch. Although mitigation intervention for fishing vessel transportation component is limited, installation of small PVs to cater for the energy needs (electrical cooking and mini cold storage) on the vessels could reduce GHG emission by 0.13% of the total emission from BAU.
6.2 WasteConsidering the limited land space and the fragility of the ecosystem in the islands, waste management has been a growing concern in the Maldives. The main method of waste management is unmanaged open burning with limited incineration (mainly in resorts) and dumping organic component into the sea (NBS, 2015c). It is also an important sector to mitigate emission of short lived climate pollutants (SLCPs) like methane and nitrous oxide. Mitigation of SLCPs would have immediate co-benefits on health and affects social capital through a reduction of air pollution. It can also improve and maintain a positive mental outlook in the island community.
Although not an indigenous source, waste is considered as renewable source which can be utilized for power generation. It is feasible to generate electricity from waste using existing technologies at large populated islands that can generate 15 tons of waste per day (IT power India Pvt. Ltd, 2007).
The incineration technology can reduce emission from waste exclusive of energy production. Proper incineration technology reduces amount of incomplete combustion found in unmanaged open burning. Incomplete combustion is a key factor in the emission of SLCPs. The main barrier for incineration is the large capital cost and lack of economies of scale. However, these barriers can be minimized by addressing the issue on a regional level.
The waste management policy indicates that waste management should be a two tiered approach in the waste hierarchy and entails an order of preference for action. The first tier, consists of the establishment of Community level waste management system at the islands, can segregate waste into different streams, composting the organics, and recover non-
Figure 6-7: Number of motorcycles and cars in Maldives from 2004-2013

6. Mitigation 60
06contaminated plastics and metals. The second tier, prescribe the development of regional level waste management systems which will receive processed waste from the community level waste management system on the islands Regional waste and further recover the recyclable materials, incinerate the combustible waste and landfill the incinerated and residual waste. This concept is currently being piloted in four atolls in north central region (Noonu, Raa, Baa, Lhaviyani) with R. Vandhoo as the designated regional waste management centre. The waste management centre located in
Vandhoo is equipped with an incineration system with a managed land fill within the island (MHTE, 2010). This regional waste management facility was established under Maldives Environment Management Project with assistance from World Bank.
In addition, government have launched ‘Saafu-Raajje’ (Clean Maldives) initiative, an awareness and behavioural change campaign, and established a public company, Waste Management Corporation, with the exclusive mandate of developing and managing the waste throughout the country.
6.3 International CooperationThe government has established partnership with research and development institutes to explore other potential renewable energy sources and feasible technologies for Maldives. The Government has also orchestrated efforts to attract private sector investments through the range of available international opportunities for adaptation and mitigation. An agreement with Japan was signed in 2012 to establish the Joint Crediting Mechanism (JCM). This is a carbon
market mechanism designed to make mitigation investments in Maldives commercially competitive while promoting the renewable energy and energy efficient technologies. This mechanism has assisted in its plans to introduce state-of-the-art storage technologies to increase renewable technology penetration in the island grids and enabled a greater involvement of the private sector in the national mitigation efforts.
6.4 Measures for future considerationOne the major challenges of mitigation in the Maldives arises due the intermittent nature of the available renewable energy sources. This issue would be addressed through the inclusion of energy storage in the renewable energy systems. However, given the inherent nature of environmental issues associated with currently available energy storage technology and the extraordinary costs associated with it, the application of such an alternative is limited. Even with storage, the issue of space required is an enormous challenge in Maldives. For these reasons, it is vital to identify a more consistent and reliable source of energy to displace fossil fuel for base load demand. The most explored source of energy for this purpose is Waste to Energy (WTE) and Thilafushi waste management centre is the only typical island which can accommodate the supply and demand side.
Another potential energy source relates to marine renewable resources. With more than 90% of the country being the ocean, a recent research by Owen et al., (2011) indicates that there is potential for marine renewable energy resources. There are channels within atolls where
ocean currents could be harnessed although further research needs to be done to estimate how much of these could be exploited for actual use. Ocean thermal energy is also considered to have high potential in Maldives (Uehara & O’Connell, 2011). Ocean Thermal Energy Conversion (OTEC) converts the thermal energy into kinetic energy via turbines. Initial feasibility by Uehara & O’Connell (2011) suggests that OTEC system would be able to provide power and water at a competitive rate and could replace base load power supply in the islands. High initial capital investment remains as a barrier for piloting this technology in the Maldives.
The option of mitigation through introduction of biofuels was explored for the abatement costs analysis (MEE, 2014b). If remaining primary energy demand were covered by 20% biodiesel blend and bio-ethanol blend of 15% could reduce emissions by 7.24% from BAU. However, as bio-ethanol and biodiesel are approximately 29% more expensive than equivalent fossil derivatives (Figure 6–8), the use of biofuel blends is like to increase fuel prices by a margin 5-7%. Although there is no capital investment required the increase in

Second National Communication of Maldives to the United Nations Framework Convention on Climate Change61
06
the recurrent cost makes this mitigation option with the highest abatement cost considered.
Further mitigation activities that could be carried out in transport sector include designing and introduction of an efficient public ferry systems for better speed and fuel economy, capping of the number of vehicles for islands, introduce emission standards and labelling for road transport, promote the use of low emission vehicles such as bicycles, hybrids, and electric vehicles with dedicated RE-based charging stations. The China Maldives Friendship Bridge would provide potential to scale up mitigation of transport in the region mainly due to modal change from the comparatively higher carbon intensive marine transport to land based transport. This bridge also opens the opportunity to interconnect the isolated grids in Malé City (MEE, 2014b) and increase RE penetration to a third of the population.
In order to tap the maximum mitigation potential further actions are needed. This includes strengthening and institutionalised data collection systems to improve reporting of GHG emission trends. Undertake awareness raising activities to private sector and relevant regulatory institutions need to be involved to educated on the importance of mitigation choices and both need to work together to strengthen the reporting mechanisms. Further awareness raising and enhancement of the capacity of the sector is needed in
areas such as economic analysis of low carbon projects, new technologies and techniques available and their implementation and on MRV techniques associated with low carbon emissions projects.
Supportive and regulatory measures for mitigation need to be strengthened. Some of these measures include development and implementation of a mechanism for monitoring, reporting and verification of compliance with targets, establishment of a funding mechanism to facilitate enabling activities for mitigation and facilitate investments in mitigation projects in the sector.
Figure 6-8: US retail price for fossil fuel and equivalent biofuels (Data source: U.S. Department of Energ y, 2016)

Box 3.SREP IP
Scaling up renewable energy programme (SREP) is a Climate Investment Fund (CIF) project to transform the electricity generation sector in Maldives. SREP is implemented in two parts, one is Accelerating Sustainable Private Investments in Renewable Energy (ASPIRE) administered through World Bank and Preparing Outer Islands for Sustainable Energy Development (POISED) administered through Asian Development Bank (ADB) (MEE, 2012b).
ASPIRE facilitates private sector investments and it aims for a 20 MWp of solar PV investment in Malé City. In the first phase investment for 4 MWp solar PV is being considered on Build, Own, Operate and Transfer (BOOT) model (MEE, 2015c). CIF funds are used as investment guarantee and investment risk reduction tool. In addition to PV investments, ASPIRE is also looking into the possibility of Waste-to Energy investment in Thilafushi.
POISED aims to enhance public sector investments in RE. The scope of POISED includes rehabilitation of existing grids and installing a total of 21 MWp of Solar PV to generate 30% of day-time peak demand and where feasible 100% solar PV in small populated islands. Phase 1 of these investments include a rehabilitating grids on 5 islands and investment on 2.5 MWp of solar PV distributed among those 5 islands. Financing for POISED is a mixture of grants, i.e. USD 12 million from CIF and USD 38 million from ADB and concessional loans, i.e. USD 10 million from Islamic Development Bank and USD 50 million from European Investment Bank (Khaleel, 2015). ASPIRE and POISED are scheduled to be completed by the end of 2018.
6. Mitigation 62
06
Fathmath Hamda

Second National Communication of Maldives to the United Nations Framework Convention on Climate Change63
07
Water Solutions

7. Vulnerability to Climate Change 64
07
7. Vulnerability to Climate ChangeThe Intergovernmental Panel on Climate Change (IPCC) defines vulnerability as “the degree to which a system is susceptible to, and unable to cope with, adverse effects of climate change, including climate variability and extremes. Vulnerability is a function of the character, magnitude, and rate of climate change and variation to which a system is exposed, its sensitivity, and its adaptive capacity” (Parry et al., 2007).
The small size and low-lying nature of the Maldivian islands make the island nation highly exposed and sensitive to climate change impacts. Understanding the existing vulnerabilities is important to address issues of climate change. Such an assessment not only help understand the long-term impacts of climate change but can provide vital information to guide our policy making. In this aspect, the Maldives is among one of the most vulnerable countries to the adverse impacts of climate change.
This first vulnerability assessment of the Maldives to the impacts of climate change by MHAHE (2001) identified that in addition to the physical impacts, the social and economic development of the island communities would be heavily impacted as the coastal ecosystem provide the backbone for the development of the island communities of the Maldives.
The first step in the current assessment was to identify what the existing vulnerability areas were. A review of literature enabled the technical team to find out the changes in the vulnerabilities identified by MHAHE (2001). Since then, several climate change related assessments carried out in Maldives. This includes National Capacity Self-Assessment (NCSA), Technology Needs Assessment (TNA) and National Adaptation Plan of Action (NAPA) which were implemented under the Integrated Climate Change Strategy (ICCS).
NAPA process identified eight areas vulnerable to human induced climate change (MEEW, 2007). It was agreed by the SNC technical team that these eight areas would be used for this current assessment of vulnerabilities. It should be noted that many of these are cross-cutting in nature. These eight areas are:
• Land loss, Beach Erosion and Human Settlements• Critical Infrastructure • Water Resources• Agriculture and Food Security • Human Health• Coral Reef Biodiversity• Fisheries • Tourism
The assessments in these areas focused on reviewing the impacts of climate change over the last decade. A key question was to identify the change in level of risk based on more recent scientific evidence available.
of the islands and topographical surveys were used to assess changes in shoreline and inundation modelling respectively. Table 7–1, below provides a description of the study islands.

Second National Communication of Maldives to the United Nations Framework Convention on Climate Change65
07
Figure 7-1: Shoreline analysis of the case study islands showing net erosion and accretion zones ( images: Google Earth).

7. Vulnerability to Climate Change 66
07

Second National Communication of Maldives to the United Nations Framework Convention on Climate Change67
07
7.1 Land Loss, Beach Erosion and Human SettlementsThe coastal systems are identified as a key vulnerable area to the impacts of climate change. The low lying nature of the Maldives, with an elevation lower than one metre above the mean sea level, makes it vulnerable to climate change and its associated impacts, particularly sea level rise (MEEW, 2007). Increase in severity of coastal erosion is associated with increase in coastal vulnerability (Webb & Kench, 2010; Biribo & Woodroffe, 2013) Aerial images
7.1.1 Coastal Erosion and Land LossEven though erosion trends in the Maldives are not regularly monitored due to lack of resources, erosion is a real challenge faced daily by the Maldivian communities. MEE (2015c) showed that reported cases of erosion increased significantly during the late 1980s. The severity and frequency of observed erosion in the Maldives has been attributed to impacts of climate change, anthropogenic modification of coastal environment have provoked degradation of coastal environment (Webb & Kench, 2010). These anthropogenic factors include construction of coastal structures, developmental actions on the coastline and sand mining from shallow lagoons (DNP, 2008; MEE, 2015d; MEE, 2012a; Husny, 2013). Studies done in Maldives shows that islands subjected to modification are more vulnerable to impacts of future climate change and sea-level rise (Kench et al., 2005; Kench et al., 2006).
Erosion of islands beach and changes in sea level rise were used as the main indicators of coastal vulnerability. Aerial images and topography of the case study islands were examined for shoreline changes and inundation
modelling. Details of the assessment method are given in Annex D.
Analysis of historical aerial images of study islands show that processes of both erosion and accretion are taking place. Overall, the islands have experienced a land loss between 0.81-3.66 ha during the observation periods. Figure 7–1 shows the changes in shoreline for the four case study islands. Thuraakunu, Fuvahmulah showed a net increase in land area but this is due to reclamation projects. Thuraakunu also had net erosion prior to reclamation.
As can be seen from the observations both climate and human induced erosion are at play. It is difficult to make a clear distinction between erosion due to climatic and non-climatic factors. Fuvahmulah, where the longest observation period is available, gives some indication that there is more drastic erosion after coastal modifications. It is not a conclusive generalization and there is a need to understand how impacts of climate change and coastal modifications impact the coastal dynamics of the small islands.
7.1.2 Coastal inundation under future projectionsCoastal inundation due to sea level rise as a result of impact of climate change is a major threat to low lying small islands. An inundation analysis was carried out under the future climate change scenarios. The methodologies and assumptions used are discussed in Annex D.
The existing elevations and the inundation analysis
Island Name Location Area (ha) Length (m) Width (m) Type Other notes
H.A. Thuraakunu* 72054’07” E, 070 06’18” N 22 900 380 Inhabited Northern most island
B. Hithaadhoo* 720 55’ 19” E 050 00’ 28” N 25.2 820 500 Inhabited
K. Bandos* 720 54’ 07” E 04°16’10.72”N 19.98 525 444 Resort
Gn. Fuvahmulah* 0°16’45”S 73°24’30”E 420 4420 960 Inhabited One of the few oceanic island
Table 7-1: Case study islands for assessing coastal vulnerability
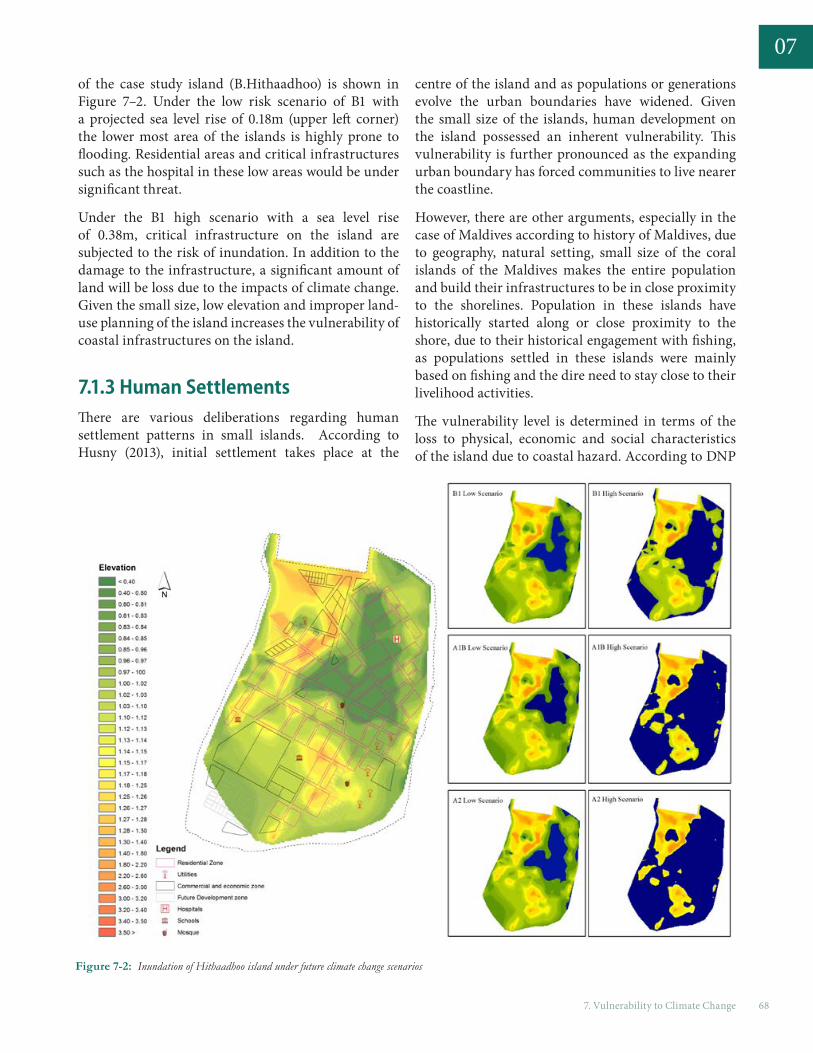
7. Vulnerability to Climate Change 68
07of the case study island (B.Hithaadhoo) is shown in Figure 7–2. Under the low risk scenario of B1 with a projected sea level rise of 0.18m (upper left corner) the lower most area of the islands is highly prone to flooding. Residential areas and critical infrastructures such as the hospital in these low areas would be under significant threat.
Under the B1 high scenario with a sea level rise of 0.38m, critical infrastructure on the island are subjected to the risk of inundation. In addition to the damage to the infrastructure, a significant amount of land will be loss due to the impacts of climate change. Given the small size, low elevation and improper land-use planning of the island increases the vulnerability of coastal infrastructures on the island.
7.1.3 Human SettlementsThere are various deliberations regarding human settlement patterns in small islands. According to Husny (2013), initial settlement takes place at the
centre of the island and as populations or generations evolve the urban boundaries have widened. Given the small size of the islands, human development on the island possessed an inherent vulnerability. This vulnerability is further pronounced as the expanding urban boundary has forced communities to live nearer the coastline.
However, there are other arguments, especially in the case of Maldives according to history of Maldives, due to geography, natural setting, small size of the coral islands of the Maldives makes the entire population and build their infrastructures to be in close proximity to the shorelines. Population in these islands have historically started along or close proximity to the shore, due to their historical engagement with fishing, as populations settled in these islands were mainly based on fishing and the dire need to stay close to their livelihood activities.
The vulnerability level is determined in terms of the loss to physical, economic and social characteristics of the island due to coastal hazard. According to DNP
Figure 7-2: Inundation of Hithaadhoo island under future climate change scenarios

Second National Communication of Maldives to the United Nations Framework Convention on Climate Change69
07
(2008), coastal hazard such as coastal flooding generate a wave height of 0.45 to 1.32m can, lead to flooding of 100 to 200m from the shoreline. Based on these information the coastal vulnerability is determined with the following criteria (Table 7–2);
7.1.4 Critical InfrastructureInfrastructure is key to development of the country. The inherent physical vulnerability of Maldives makes, infrastructures on the islands vulnerable. Critical Infrastructures play an important role in sustaining the economic prosperity of the country. Critical Infrastructures includes airports, roads, utility services, harbours, sea ports, hospitals, communication Infrastructures and waste management centres, which provides essential services to the community. A disruption to the services provided by these facilities will result in a malfunction of the community.
Due to the natural setting, small size of the coral
islands has very little or no option, rather build critical infrastructure in close proximity to the shoreline, hence makes it extremely vulnerable to adverse impacts of climate change.
Major coastal hazards that Maldivians experiences associated with climate change and extreme events are sea swells, storm surges and the related coastal flooding. Historical episodes of coastal hazards had caused significant damage to these critical infrastructures. Among others, cost of damage caused by one of the worst flooding in 1987 to the countries only international airport (Malé International Airport) then was estimated USD 4.5 million. (MEEW, 2007). In incident with a small wave with wave height of approximately 0.5 – 4m (JICA, 1992), caused a significant damage to the national Infrastructure.
Damage to the utility infrastructures have disrupted the services causing severe impact. Heavy rainfall during the southwest monsoon resulted in blockage of the 30% of the water and sewerage network in Ga. Villingli. This lead to increase in number of health related problems and leaving a larger part of the population having no access to proper water and sanitation facilities (DNP, 2008).
The vulnerability and exposure level of all critical Infrastructures including that of airport, transport infrastructure such as harbours, telecommunication infrastructures and tourism infrastructures were demonstrated during the Indian Ocean Tsunami in 2004. It impacted transport sector with a loss of USD
Coastal Vulnerability Criteria
HighHuman settlement remains less than 50 m from the shoreline in a five-year period
Moderate Human settlement remains 50-100 m from the shoreline in a five-year period
LowHuman settlement remains more than 100 m from the shoreline in a five-year period
Table 7-2: Criteria for coastal vulnerability
Water Solutions

7. Vulnerability to Climate Change 70
0720.3 million with destruction of 4,200 m length of quay wall and 15,000 m of harbour or seawalls. Water Infrastructures, housing, health and education were amounted with a direct loss as USD 13.1, 64.8, 5.6 and 15.2 million respectively (WB, ADB, 2005; MEEW, 2007). Due to severe inundation and flooding, the gateway to the world and the gateway to the economy,
Malé International Airport was closed for few days with a tremendous loss to the national economy.
This shows that inundation and flooding related to extreme events can impact the entire livelihood and the economy with the predicted increase in extreme events.
7.2 Freshwater ResourcesFreshwater resources would be directly impacted by the predicted rise in global temperatures, sea level and also possible decrease in rainfall. For small islands like the Maldives, with limited fresh water it is important to realize the possible impacts on water resources from the impacts of climate change. This assessment, using a desk review and field work at selected islands looks at the vulnerability of water resources in the Maldives.
Quality of groundwater and availability of rainwater are used as the main indicators for assessing the vulnerability of the case study islands to the impacts of climate change. The inhabited islands of B. Hithaadhoo, S. Hithadhoo, Gn Fuvahmulah and the uninhabited island G.A. Dhekanbaa were used as case study sites for the assessment. Annex E provides details of tests carried out in the study islands. Freshwater resources in the Maldives are impacted by both climatic and non-climatic factors. The key non-climatic stressors on freshwater resources are population growth, population concentration and point source pollution on the islands freshwater aquifer (USAID, 2012).
7.2.1 GroundwaterKey drivers that impact groundwater in the Maldives are climate and hydrology, sea level movement, island stratification and human activities. Inundation of land and associated saltwater intrusion would reduce the available fresh groundwater in islands. The porous soil structure of the island further adds to this vulnerability making groundwater vulnerable to pollution by solid waste and other pollutants.
Samples taken in the study islands show that groundwater from all four islands were contaminated with faecal coliforms (Table 7–3). According to the surveys conducted none of the islands have a proper sanitation system in place. All households practice onsite sewage and wastewater disposal through septic tanks systems. Studies conducted by Falkland (2001) confirmed wide spread groundwater contamination with domestic sewage due to absence of appropriate sanitation system and uncontrolled pumping of groundwater from wells across Maldives8.
G. Dh. Dhekanbaa, which is an uninhabited island had been included in the FNC as a control site for impacts
5. The impacts of rapid extraction by pumping is quite evident in the capital, Malé. Measurements of electrical conductivity of water in Malé had risen from 2,500 µS/cm in 1985 to 18,247 µS/cm in 2001.
Water Solutions

Second National Communication of Maldives to the United Nations Framework Convention on Climate Change71
07
by human activities. The 2001 assessment showed that the groundwater was not polluted or saline. However, during the field assessment, in June 2013, it was noted that the ground water salinity has increased and was contaminated by faecal coliform. The island is currently being used for sea cucumber processing by residents from nearby islands. This activity involves high rates of water extraction and other human interventions accounting for this increase in salinity and faecal coliform. This shows that uncontrolled human interventions increase the groundwater vulnerability.
Electrical conductivity is also an important parameter used to determine usability of groundwater. Figure 7–3 and Figure 7–4 show the electrical conductivity maps for the study islands of Baa. Hithaadhoo and Gn. Fuvahmulah respectively. The conductivity measurements shows groundwater in both islands are relatively fresh except in few areas.
Although the conductivity levels show to be fresh (<1500µS/cm), it is unusable due to faecal contamination without being treated (Table 7–3). These islands do not have sewerage networks and use of improper sanitation systems has led to pollution of groundwater lenses of the islands.
The freshness decreases towards the shore and low lying areas of the islands. Inundation models suggest that the risk of inundation and flooding becomes higher with the predicted impacts of climate change Figure 7–2. This increases the chances of salinizing the groundwater. Inundation models suggest that the vulnerable spots for salinization would be the freshwater in the low lying areas. The combined effects of human intervention and the low lying elevation increases the vulnerability of the groundwater of the small coral islands.
Water quality parameters (averages) B. Hithaadhoo Hithadhoo, Addu city Gn. Fuvahmulah Ga. Dhekanbaa
pH 8.0 7.5 7.6 8.8
Electrical Conductivity (µS/cm) 1108.3 824.7 687.8 1725.6
Salinity (‰) 0.9 0.5 0.3 12.6
Percentage of samples positive with faecal coliforms (%) 100.0 60.0 100.0 100.0
Faecal Coliform counts (CFU/100ml) 97.0 59 54.0 45.5
Table 7-3: Indicators of groundwater quality in study islands

7. Vulnerability to Climate Change 72
07
Figure 7-3: Electrical conductivity map of Baa Hithaadhoo

Second National Communication of Maldives to the United Nations Framework Convention on Climate Change73
07
Figure 7-4: Electrical conductivity map of Gn. Fuvahmulah

7. Vulnerability to Climate Change 74
077.2.2 RainwaterFuture regional climate change scenario shows that though the Maldives would experience high intensity monsoonal rainfall events, the number of rainy days are likely to decrease (refer to Section 3.2.1). This would have an impact on availability of rainwater for communities as a source of water.
Rainwater is harvested over the roof top via the domestic houses and public buildings. Figure 7–5 shows the total rainwater storage capacity in the atolls and the per capita storage. It is noted that more storage space is available in the north and the south of Maldives
compared to the central Maldives.
Analysis of the dry period showed that the maximum number of observed consecutive dry days are 56, 38 and 32 in the north, central and southern atolls of Maldives respectively. Considering a water consumption of 10 L/capita/day (Falkland, 2002) and the maximum number of consecutive dry days, the required amount of storage to cater the dry period was compared against the current available storage. Figure 7–6 shows that northern and central are more vulnerable to elongated dry periods. These regions with low per capita storage as in Figure 7–5 and the most number of requests made for water during the dry periods as shown in Figure 7–7.
Figure 7-5: Rainwater storage capacity by atolls

Second National Communication of Maldives to the United Nations Framework Convention on Climate Change75
07
During the field investigations, it was found that some of the storage tanks provided were not connected due to capacity constraints and lack of awareness. In addition to the climatic factors, these constraints would further increase the vulnerability of water sector.
While the issue of sufficient availability remains, another important consideration is the quality of rainwater collected. Testing for faecal coliforms was carried out from 10 and 4 well respectively from
Hithadhoo and Fuvahmulah. All samples tested showed contamination level of 43 CFU/100 ml and 55 CFU/100 ml in Hithadhoo and Fuvahmulah, respectively. In previous studies, it was found that there were instances
where rainwater quality was not at acceptable level, for instance studies conducted by Maldives Water and Sanitation Authority (MWSA) in Laamu Gan Island found that 45% of the samples tested were positive for faecal coliforms (MWSA, 2005). Similar studies conducted in Addu Atoll recently, found that rainwater collected in community tanks were contaminated with E.coli bacteria, which the local health authorities believed are due to unsafe harvesting (Haveeru, 2011). It is important that safe methods are used in rainwater harvesting and storage and rooftops are thoroughly cleaned prior to use.
Such on-site contamination is cause for alarm and there is further concern of rainwater contamination by air pollutants. Trans-boundary air pollution, known as the Asian Brown Cloud, from the Indian sub-continent is of concern to the rainwater quality in the Maldives. Das et al. (2011) shows an increase of pollutants (SOx, NOx and Ammonium) and an overall decrease in pH during the months of December and January in rain water during using Maldives Climate Observatory in Hanimaadhoo (MCOH) as seen in Figure 7–8. It is important that mechanisms are established to monitor impacts of such pollution on local rainwater and take appropriate measures.
7.3 Coral ReefThe coral reefs are a significant biodiversity for the Maldives. The formation and protection of islands, livelihoods of the people and economy of the country dependent on our marine environment, in particular the coral reefs. Corals formation have been used to study the changes to the climate and related impacts. Due to the high sensitivity of the reefs to high temperature, they are the first to show signs of ecological stress from global warming. Detecting this change requires
extensive monitoring for biological and physiological changes throughout coral reef regions of the world.
The critical impact on coral reefs is the increase in sea surface temperature (SST). Such has been observed by the series of coral bleaching and mortality events in the Maldives. In addition, ocean acidification is also a growing threat to the coral reef communities.
Figure 7-6: Deficit water storage with respect to current storage capacity.
Figure 7-7: Number of requests made for emergency water during the dry period from 2005-2014.
Figure 7-8: Summary by month of measured pH of water quality from MCOH (adapted from (Das et al., 2011).

7. Vulnerability to Climate Change 76
07The impacts on coral reef was studied for the vulnerability assessment using SST from 15 monitoring sites that has been established after the coral bleaching incident following 1997/1998 El Niño.
7.3.1 Impact of Sea Surface Temperature (SST) on coral reefIncrease in SST has been documented as one of the major factors causing death of corals and other zooxanthelate animals in tropical coral reefs (Wilkinson, 1998). The Maldive-Chagos archipelago is historically the warmest region in the Indian Ocean (Rosen, 1971). Coral bleaching has been observed in the Maldives in 1977, 1983, 1987, 1991, 1995, 1997 and 1998. The 1998 event was the most severe causing unprecedented damage to coral reefs , with more than 90% of corals wholly or partially bleached (Ali & Manik, 1989; MRC, 1998; Riyaz et al., 1998). In recent times similar warm episodes with coral bleaching have been observed in 2005 and 2010 deviating significantly from the long-term (1951-2010) SST mean (Figure 7–9). These recurring events hindered the recovery process from the 1998 bleaching event.
Large parts of coral community in shallow reef areas across the Maldives was intensely bleached due to the 1998 event causing heavy mortality. Comparison of available data from various sources showed that pre bleaching status of the reefs has 40-60% live coral cover
in terms of health of the reefs and plummeted to less than 3% after a bleaching event (Edwards et al., 2001). Since the event, Maldives Marine Research Centre (MRC) started national coral reef monitoring program by continued monitoring of the 15 reefs that were assessed to study impact of bleaching in 1998.
Significant increase in coral cover has been observed since the 1998 bleaching event. Coral cover in the northern atolls has increased from 1% in year 2000 to over 36% in 2012. Similar recovery patterns are observed in other atolls. (Figure 7–10).
However, this variation in reef recovery rates reduced over a longer span of time. Recovery rates from 1998 to 2012 showed rates ranging between 2.1 and 3.5% per year at atoll scale and 2.4 to 2.8 at regional scale (Figure 7–10 and Table 7–4). The data showed that it takes over a decade or perhaps a couple of decades for reefs to attain their former status (40-60% of live coral coverage).
It is apparent that the reefs are in state of recovery. Any other natural or anthropogenic pressure on the reefs will impede this. Increase in SST is likely to escalate recurrence of bleaching.
Figure 7-9: Monthly variation of SST across Maldives. Blue diamond show the 1951- 2010 mean monthly SST ± 95% CI (closed bars).Mean monthly SSTs during 1998, 2005 and 2010 are shown separately
Figure 7-10: Atoll specific pattern of recovery of coral reef sites.
Region Rate of recovery (% per year)
Haa dhaal atoll 2.41
Kaafu atoll 2.14
Ari atoll 3.54
Vaavu atoll 3.18
Addu City 3.04
North region (6 °-7 ° N; 73 °-74 ° E) 2.41
Central region (3°-5 ° N; 73 °-74 ° E) 2.86
South region (1 ° N-1 ° S; 73 °-74 ° E) 2.78
Table 7-4: Rate of reef recovery from 1998-2012

Second National Communication of Maldives to the United Nations Framework Convention on Climate Change77
077.3.1.1 Bleaching episodes from 1998–2010
An analysis of the historic bleaching events were obtained from the Reef Base Data Centre of the Global Coral Reef Monitoring Network (Figure 7–11). It was found that bleaching episodes were observed in January, February, April, May, August, and September. Among all the months, most number of bleaching episodes were observed during May and with a higher severity of bleaching. An in-depth analysis showed that most of the high severity bleaching occurred when the sea surface temperatures reached 33°C (MEE, 2015a).
7.3.1.2 Impacts with future projections of sea surface temperature
Future climate projections of the SST shows and increase over all regions of the Maldives as seen in section 3.2.4. With the historic threshold of SST reaching 33°C for coral bleaching and using the baseline SST and the projected SST, it was found that the severity of bleaching will get higher with change of climate as seen in Figure 7–12 (MEE, 2015a).
7.3.2 Impact of ocean acidification on coral reefOcean acidification is a consequence of absorption of carbon dioxide and is described as the “other impact of high emissions”. Ocean acidification is not a symptom of climate change, rather, it is a threat concurrent with climate change and caused by a common root problem of ongoing anthropogenic CO2 emissions.
Oceans have absorbed at least 30-40% of the excess CO2 produced by human activities (Kleypas et al., 2005; Raven et al., 2005). Over the past 250 years surface ocean pH is estimated to have decreased from approximately 8.25 to 8.14 (Jacobson, 2005). This decreased pH in combination with other ocean biogeochemical changes could undermine the functioning of marine ecosystems
Figure 7-11: Coral bleaching episodes from 1998-2010. Data by ReefBase.
Figure 7-12: Projected impacts of coral bleaching. (Adapted from MEE, 2015a).

7. Vulnerability to Climate Change 78
07and disrupt the provision of many goods and services associated with the ocean. In particular, it decreases the saturation states of carbonate minerals. It is important to note that most tropical reef building corals are aragonite based which is more susceptible to dissolution than calcite (Orr et al., 2005). The reduced saturation states of carbonate significantly reduce the ability of reef-building corals and hence affect reef structures that house hundreds of thousands of marine species.
Several controlled experiments in Great Barrier Reef (GBR) of calcification rates under elevated CO2 levels confirm that calcification rates decrease with increasing CO2 levels (De’ath et al., 2009). These measurements
suggest that calcification rates may decrease by up to 60% with a doubling of atmospheric CO2 concentrations by end of 21st century. This may put reef structures into net erosion with long-term implications for coastal protection, degradation of reef framework that provides habitats for several organisms that form part of the overall ecosystem (Hoegh-Guldberg, 2005). In light of these findings in GBR and elsewhere where coral reefs are exposed to similar condition in the Maldives it is expected that similar suit is likely to follow. Such projected impacts are of a serious concern for the reefs of Maldives where they are already exposed elevated sea surface temperatures.
7.4 Food Security and AgricultureThe natural setting, small size of the coral islands, poses immense challenges in terms of food security. Traditionally, the island communities of Maldives has depended on fisheries and agriculture for food. The main staples grown and used included taro, cassava, sweet potato, breadfruit, and grains such as corn and finger millet. Limited land available for agriculture meant that it was a challenge to meet the demands of an increasing population from only local produce. Today the Maldives population is heavily dependent on imported food.
FNC process highlighted the limited agricultural production, heavy import dependency, limitations in storage and challenges in the distribution of food across the nation (MHAHE, 2001). This section will highlight on the status of these issues at present and current challenges and opportunities in enhancing food security in the Maldives. New challenges such as the impacts of climate change on the economy and transportation sector enhance food insecurity in the Maldives. Data on trends on food import, storage and distribution as well as on agricultural production, food utilization and diet will be used to discuss the current status and issues in food security. Data available from various sources including Maldives Customs Service, Ministry of Fisheries and Agriculture of Maldives and State Trading Organization of the Maldives are.
7.4.1 Limited Agricultural Production Small size of coral islands with porous sand, makes production of agricultural products extremely challenging. According to Shabau (2006) only 30 km2
of cultivable land available throughout the archipelago. This is further exacerbated with limited fresh water available for irrigation on these small islands. Hence, agriculture is limited, making food availability a major concern for the Maldives.
Local production data is important in assessing vulnerability and planning for food security. However, this assessment highlights the lack of a baseline information for local production. The only available data is for local produce traded in Malé City. According to experts and anecdotal evidence, currently only about 60% of locally produced food reach Malé City. The rest is being directly supplied to resorts, and local markets established in major urban centres. For instance, local produce in the northern atolls are taken directly to Kulhudhuffushi, the largest population centre in the north.
The agricultural production and trading faces risk from damages from extreme events. Particularly from storms and its associated winds, rains and surges. This was demonstrated in 2007, when a high number of storm and swell events were recorded. During that year three central atolls (L, B, R) reported agricultural damages from flooding due to rain, while seven atolls (HA, Sh and R in North and L, GDh, Gn and Addu City) reported agricultural damages from flooding due to surges or tidal waves. Effects of flooding due to sea swell are much long lasting due to salt contamination of ground water. In the same year 12 out of 20 atolls reported varying levels of agricultural damages due to strong wind felling fruit bearing trees (papaya, breadfruit, banana and palms). More recently in 2012, in the aftermath of Cyclone Nilam, dense clouds formed

Second National Communication of Maldives to the United Nations Framework Convention on Climate Change79
07over southern atolls brought torrential rain and squally showers to the area. Heaviest rainfall recorded within 24 hours was 132 mm in Fuvahmulah, causing extensive flooding. Fuvahmulah is one of the larger islands which carries out commercial level agricultural activities.
7.4.2 Heavy import dependency About 90% of the country’s food demand is catered from imported food (Shabau, 2006). Figure 7–13 shows the main countries/regions where food is imported from. This heavy import dependency introduces two main types of climate change related risks to food security in Maldives. Firstly, any climate change related impacts on food production in these countries/regions will directly impact our food security. Secondly, any disruption to transportation of food due to extreme climate events would put a halt to food distribution within the country.
Maldives sources it food from many regions around
the world. As seen in Figure 7–13 bulk of cereal related foods, like rice and flour are important from South Asia (74.7%), seafood is sourced mostly from South Asia (34.1%) and West Asia (26.4%), Meat is sourced from South America (27.3%) and Oceania region (21%), Europe (26%) is largest provider of dairy products followed by West Asia (24.5%) and South Asia (36.7%) is the largest source of fruits and vegetables. Global sourcing of foods subjects our food security to their vulnerabilities in agriculture and food production industries. Schnieder et al., (2007) indicates that there are risks from reduced agricultural production potential due to increased drought and increased extreme events resulting from global warming in Asian region. Maldives imports 72.4% of all foods from Asia. Increasing temperatures and associated heat stress and droughts are also likely to negatively impact livestock
(Meat and Dairy) production around the world (Easterling et al., 2007). Food price spikes and volatility is also a growing concern in the Maldives. There has been a constant rise in food prices over the years which directly impacts food security of the Maldives.
Airports and seaports are the main gateways for importing food into the country. These facilities or critical infrastructures are identified as being very vulnerable to impacts of climate change. Any damages to the critical infrastructure or climate events that inhibits the operation/use of any of these structures could impact importation of food into the country. Increase in extreme events due to climate change further impacts the supply and distribution and hence food security in Maldives. In addition to these facilities the entire supply chain from loading ports to the transport routes are also exposed to the direct impacts of climate change and extreme events.
7.4.3 Storage and distribution challengesThe storage and distribution of staple food is mandated to the State Trading Organization PLC (STO). The food is imported and stored in Malé City in the centre, Kulhudhuffushi in north and Addu City in south (Table 7–5). In addition to regional food storage facilities, STO also operates 13 shopping centres throughout the country with smaller storage capacity to cater for the islands they serve. These are redistributed to the other inhabited islands mainly by sea transport. The recent increase in number of domestic airports has allowed more perishable foods to be transported as air cargo. Destructive winds and rough seas cause major disruptions in air and sea transport. These types of events are likely to increase in the future due to the predicted climate change.
To address these potential distribution delays the government maintains a reserve of staple foods (rice, sugar and flour) suitable for 3 months. Despite these efforts supply becomes low due to climate related impacts such as flooding, sea surges and destructive wind that could damage the storage facilities. One such example was seen in 2007, when rain flooding damaged British Red Cross Store room where fish was stored (NDMC records). Shortage of food distribution was experienced in 1980’s and 1990’s during extreme weather conditions. This indicates that current storage practice needs to be reviewed and enhanced to adapt
Figure 7-13: Distribution of food imports into Maldives based on type and origin(Data source: MCS, 2010; 2011; 2012; 2013)

7. Vulnerability to Climate Change 80
07to the impacts of climate change as the climate change impacts are predicted to get worse with more severe extreme events. Storage Site Storage Capacity (months)
Kulhudhuffushi 2
Malé 3
Addu City 2
Table 7-5: Food storage facilities operated by STO
Water Solutions

Second National Communication of Maldives to the United Nations Framework Convention on Climate Change81
07
7.5 Human HealthClimate change can modify ecosystems in ways that not only increase physical disease but also create health burdens that affect mental and social well-being (Comrie, 2007).
The dispersed nature of the islands poses a special challenge in accessing health facilities around Maldives. Although each island has primary health facilities, higher tiered facilities are limited to atoll capitals and population centres. The figure shows spatial vulnerability of communities in accessing secondary and tertiary health care.
7.5.1 Direct health impactsThere has not been an assessment done in the Maldives to find the exact relationship between climate change and health impacts. The anticipated climatic factors that have direct health impacts in Maldives are heat and extreme events.
The climate model downscaling exercise predicts an increase of 1.67-3.72°C in temperature by the end of 21st
century which could lead to an increase in frequency and intensity of heat waves in the future (MHE, 2012).
Figure 7-14: Spatial distribution of secondary and tertiary health facilities in the Maldives.

7. Vulnerability to Climate Change 82
07IPCC concludes heat-related mortality increases in countries with limited adaptive capacities and large exposed populations (Bernstein et al., 2007). A semi-structured interviews conducted under SNC in selected islands to outline their perception on climate change impacts. Table 7–6 summarizes the issues highlighted by the respondents as major concerns and emerging issues facing the islands. Participants raised concerns over increasing temperatures and related health impacts such as skin irritation and dehydration particularly among labourers was also highlighted by many participants. Some participants believe that deaths in elderly populations may have been due to heat.
According to Chapter 4 there is an increase in the extreme events in Maldives. Future climate predictions indicate that frequency and intensity of these events will increase (refer Section 3.2). The relation of health impacts, such as physical injury and mortality from these events have not been studied in the Maldivian context. Lack of information on direct health impacts are hindering factors for such an analysis. In the qualitative survey, participants highlighted disruption of transport and reduced accessibility to health facilities due to extreme events.
7.5.2 Indirect impactsIndirect health effects of climate change include secondary effects caused by changes in ecology and social systems. One of the most prominent indirect impacts is the impacts due to vector borne diseases. Vector borne diseases such as Malaria and Filaria has been eradicated in Maldives. Dengue, Chikungunya and Scrub-typhus are the main vector borne diseases of concern.
Dengue has been endemic in the Maldives since 1979. Since then outbreaks have been recorded almost every year with significant out breaks in some of the years. Historical outbreaks were recorded in 1988, 1998 and 1999 and more recently in 2006, 2007, 2011 and 2015 as seen in Figure 7–15. Relations with dengue outbreaks and ENSO events have been established in various regions. Depending on the severity of the ENSO event, the outbreaks have occurred with a time lag after the actual ENSO event (Gagnon et al., 2001). A similar result is seen in Figure 7–15 indicating that there is close relationship between dengue outbreaks and El-Nino events in Maldives.
In addition to the inter-annual variations such as the El-Nino events, seasonal variations of dengue episodes are observed in (Figure 7–16). A lagged correlation between the rainfall episodes and the dengue outbreaks are evident in the central Maldives. Due to poor quality of data available, this relationship was difficult to establish in the northern and southern regions of Maldives. The results strongly suggest the epidemic dynamics of dengue fever is influenced by climate variability.
Other vector borne diseases that are re-emerging in the Maldives are scrub typhus and chikungunya. The scrub typhus data (Figure 7–17) indicates that cases increases in the Maldives during the monsoon. Chikungunya
Location (Atoll/Island) Main Concerns
HDh. Kulhudhuffushi
• hotter days• dehydration• skin irritation• Urinary Tract Infections• Eye irritation• Respiratory diseases• Increase in dust
accumulation.
AA. Rasdhoo
• Skin diseases (Itchiness, rashes),
• Hotter days
AA. Thoddoo• Respiratory diseases• Dehydration.
Addu City
• Hotter days• Dehydration, • Dryness due to loss of green
vegetation is the reason.
Table 7-6: Summary findings of health related impacts
Figure 7-15: Total number of reported cases.

Second National Communication of Maldives to the United Nations Framework Convention on Climate Change83
07
was first diagnosed in 2006. The most recent outbreaks of Chikungunya was observed in 2009 and 2010 after which it has been drastically reduced as seen in Figure 7–18 indicating that solid measures have been taken to control the outbreak of the disease.
7.5.2.1 Food and Waterborne InfectionsFood and water borne diseases are not commonly seen in Maldives. Heavy rainfall with flooding promotes the transmission of pathogens when there is no secure disposal of faecal waste. Due to the poor sanitation systems and pollution of the groundwater (as seen in 7.2.1), the chances of spreading water borne diseases would be high.
Acute Gastroenteritis is the main food and water borne disease reported in Maldives. It is a bacterial disease transmitted through the ingestion of food or drink contaminated by the faeces or urine of infected people.
Acute Gastroenteritis was also expressed as a concern during flood events among the surveyed population.
7.5.2.2 Air Quality
The most comprehensive air quality assessment was the Comparative Risk Assessment carried out as part of the 2010 Global Burden of Disease Project. It found that the combined health impact of the household exposures to particle air pollution from poor combustion of solid cooking fuels, plus general ambient pollution, was about 6.8 million premature deaths annually, with about 5% overlapping globally. However, in Maldives the main source of cooking fuel is LPG with very limited use of kerosene. The main source of air pollution in Maldives is mobile fuel combustion and open burning of waste in most outer islands, where as in the capital city Malé, it’s mainly from vehicle emissions and cement duct from construction. This pollution is amplified with congestion and high population density.
The poor air quality and the acute respiratory diseases (ARI) is a well-established link globally. Given the small and clustered space available in the Maldives, the chances of exposure to air pollution is high and thus to respiratory diseases. It was seen that, ARI diseases in Maldives are on a rising trend (Table 2–3) but due to lack of information, the causes are not yet established.
Figure 7-16: Reported dengue cases and long term mean rainfall (2005- 2013).
Figure 7-17: Scrub Typhus cases reported monthly from 2011-2013
Figure 7-18: Reported Chikungunya cases

7. Vulnerability to Climate Change 84
07
7.6 FisheriesPredominant proportion of the fishery captures is tuna and tuna related species. Dynamics of marine fish stocks including tuna are linked to the climate variability. As the fishery of Maldives is entirely dependent on coral reef ecosystems, any impacts on these ecosystems will have a direct impact on fisheries sector. For example, tuna fishery is dependent on live bait which is caught from the reefs. In addition, a number of reef fish is extract for the export market and the resorts. The two main factors related to climate change that will impact fisheries are the changes in sea surface temperature and ocean pH.
7.6.1 Impact of Increased sea surface temperatures on fisheriesChanges in ocean climate manifested through variation in sea surface temperature can affect the distribution, migration patterns of tuna and other pelagic fish species. Temperature is also likely to influence the survival of larvae and subsequent recruitment of fish. Large-scale distribution and displacement of skipjack tuna in the equatorial Pacific are well correlated with El-Nino Southern Oscillation (ENSO) events (Lehodey et al., 1997). Similarly, variability in the distribution and catch rates of tuna species has also been observed in association with the Indian Ocean Dipole (IOD). IOD is a basin-scale pattern of sea surface and subsurface temperatures that affect climate in the Indian Ocean. The environmental processes associated with the IOD that drive variability in tuna populations, however, are largely unexplored (Lan et al., 2012).
Therefore, better understanding of ocean variables that influence tuna will help to understand the changes in the distribution and abundance of tuna in the
Maldives. Tuna catch statistics show spatial variations in the abundance and distribution of tuna in relation to north to south of Maldives. This variation distribution and abundance along the atoll chain and around seamounts has been reported in FNC (MHAHE, 2001). It is well documented that ocean upwelling’s (nutrient enrichment) associated with seamounts encourage productivity (Boehlert & Genin, 1987). Although few seamounts are associated with in the Maldives atoll chain, ‘Deraha’ and ‘Sato Raha’ both in one and half degree channel north of equator influencing this productivity, the oceanic ridge that form the basis for the atoll chain also create a barrier across the central Indian Ocean creating an upwelling in the leeward side of the ridge based on the monsoonal winds. In the northeast monsoon when the wind blows from east, there is high concentration of chlorophyll on the west side of the ridge and vice versa during southwest monsoon when the wind blows from west. This near-shore productivity is however, not reflected by tuna catch. Tuna catches are more prevalent on the eastern side of Maldives during northeast monsoon and western side during southwest monsoon.
It has been reported in FNC that tuna fishery of the Maldives is affected by the seasonal monsoon and other oceanographic variations along the long chain of atolls in the archipelago. Anderson (1992) reports that the tuna abundance are also affected by El Nino events. During the El Nino years of 1972-73, 1976, 1982-83, 1987 and 1992-94, the skipjack catch rates noticeably decreased, while the yellow fin and other tuna species increased. During La Niña years, the skipjack catch rates increased while those of the other major tuna species decreased.
Analysis of tuna catch for the two main species, yellow fin and skipjack tuna from 1971 -2012 based on adjusted effort are shown in Figure 7–19 and Figure 7– 20 respectively.
CPUE of skipjack tuna over 43 years was assessed to show whether the abundance of skipjack tuna for the years that have shown strong El Nino signals were same as that of the rest within this time frame. Skipjack tuna abundance during El Nino years was found to be lower compared to other years. Although the mean abundance of skipjack were low in El Nino years compared to non El Nino years, the difference was statistically not significant. Similar results were seen
Figure 7-19: Yellowfin tuna catch per unit effort (CPUE) from 1997 to 2012. Values are annual average catch + standard deviations. The colour horizontal lines indicate El Nino based climate variations (source: www.cpc.ncep.noaa.gov/products/analysis_monitoring/enso_advisory)

Second National Communication of Maldives to the United Nations Framework Convention on Climate Change85
07
with Yellow fin tuna abundance during La Nina years compare to the normal years. Consolidation of the data on tuna abundance since the 2001 reporting based on the prior to 1990s and current assessment (1971-2012) support the general observation on the availability of abundance of tuna and its interaction with large scale climate variables, e.g. ENSO and IOD events. The severity of such impacts on tuna and related species is perhaps largely unknown with current knowledge in this field. For Maldives, where over 90% of export is marine products, especially tuna any significant change in the abundance and catch-ability of tuna will have economic consequences. As one of the highest consumer of fish per capita as their default protein source, decrease in abundance of seafood will not only affect the health but also change food security aspects of the economy.
The oceanographic processes that depicts these decadal scale variations in tuna abundance in the Maldivian waters are not yet known. Also the stock structure of the skipjack and yellow fin in the Indian Ocean is not well known. More research needs to be undertaken in order to find any direct effects of climate change onto the fishery sector.
7.6.2 Impact of Ocean acidification on fisheriesProjections of atmospheric CO2 concentrations show increases from current 380 parts per million (ppm) to concentrations ranging from 540 to 970 ppm by 2100 (IPCC, 2001). As a result of CO2 exchange with seawater (Orr et al., 2005), pH and concentrations of carbonate in seawater will change. The relationship for the absorption of CO2 in seawater is also influenced by temperature (Kleypas et al., 2005) and there is
the potential for calcification to facilitate a negative feedback on atmospheric levels (Riebesell et al., 2000). A drop of 0.5 pH units over the next 50 to 100 years is predicted. This has the potential to affect intracellular processes and the physiology of organisms such as coral development and physical development of planktons, molluscs, crustaceans and fishes. All of these organisms therefore, are at risk from ocean acidification (Orr et al., 2005). This will have an impact on the food production and availability in the food chain.
Literature, on likely impact of change in ocean chemistry on tuna has identified four ways. These include in change in pH would increase change carbonic acid in body fluids that is likely to lower blood pH, a likely factor to change physiology resulting various energy costs. Additional ways that would affect tuna include, effects on growth and formation of ear bones (otholiths) may be susceptible to lower pH because they are aragonite based (Fabry et al., 2008). Otoliths are important for orientation and hearing. Reduced availability of calcium carbonate is also likely to cause indirect effect on the distribution and abundance of tuna by changing availability of species of calcifying planktons within the lower trophic level of the food web that support tuna. Tuna is also likely to be affected by change in acoustics due to change pH.
Figure 7-20: Skipjack tuna catch per unit effort (CPUE) from 1997 to 2012. Values are annual average catch + standard deviations. The colour horizontal lines indicate El Nino based climate variations (source: www.cpc.ncep.noaa.gov/products/analysis_monitoring/enso_advisory)

7. Vulnerability to Climate Change 86
07
7.7 TourismScott et al. (2008) identifies Maldives as a tourism vulnerability hotspot for marine biodiversity loss, sea level rise and increase of travel cost due to mitigation policies. It is also important to note that development of a resort in Maldives involves a high degree of modifications to the natural island and the surrounding environment making it more vulnerable to natural changes.
Vulnerability assessment was done through series of questionnaires which identified the impacts, its severity, frequency, adaptive capacity and adaptation measures taken at the case study resort island. Similarly, information on recorded historical and present events was taken, furthermore, awareness level of tourism operators were identified through survey and analysis of previous publications. Table 7–7 give the major climate change impacts on the Maldives tourism sector that was identified in this assessment.
7.7.1 Increase in TemperaturesSea-Sand-and–Sun is the main tourist product that the Maldives promotes for visitors. Increased global temperatures mean tourists from the colder climates would not need to travel as far to enjoy the warmer climate. This poses the risk of lowering number of visitors to the Maldives. Furthermore, as the temperatures increase, air conditioning costs would increases, hence increasing the operational costs of the tourism sector. Additional taxes on any aviation will further makes the industry vulnerable.
Another threat posed by the increase in temperature is the spread of infectious diseases. Small temperature increases can greatly affect transmission potential. Resort operators as well as live aboard vessels in Maldives indicates that an outbreak of vector borne diseases (e.g. dengue) in nearby community could affect the staff turnover as well as tourist excursions (MoT, 2015a).
7.7.2 Increase in extreme eventsChapter 4 highlights key disaster types or extreme events to the Maldives. Storms and associated rain induced flooding and swell waves are the most common type of climate related extreme events experienced in Maldives. Increasing frequency and intensity of extreme events due to climate change increase the risks for tourism facilities and services. As Maldives tourism sector is slowly evolving from the seasonal destination to a year around destination, these seasonal climate events are likely to have more impact on tourism activities. The disruption to transport services, loss of property is likely to increase with the current climate trends/projections (Solomon et al 2007) (refer to chapter 3).
The low elevation and near shore infrastructure at resorts makes it also very vulnerable to swell waves that are generated in the tropical and extra-tropical regions. In addition to flooding, swell waves also contaminate the groundwater of the islands leaving a lasting damage on the vegetation that is used for either aesthetical or agricultural purposes on the resorts. Another increased risk due to climate change is the increased insurance costs for Maldives.
7.7.3 Sea level RiseOne of the most important and critical assets of a tourist resort islands in Maldives is the beach. Currently 60% of beaches are already facing varying degrees of erosion and encroachment (Scott et al., 2008). Rise in sea level aggravates the erosion issue as well as increase the risk of salt water intrusion into aquifers.
Due to the small size of the islands, the infrastructures on the resort islands are in close proximity to the shore. In addition, in many resorts water bungalows and underwater infrastructures in the shallow lagoons are commonly seen. This subjects the resort infrastructure
Increase in temperatures. Change and unpredictability in seasons, increase in cooling costs, heat stress for tourists, infectious disease increases.
Increasing frequency and intensi-ty of extreme events.
Increased insurance costs/loss of insurability, business interruption costs.
Sea level rise
Coastal erosion, loss of beach area, loss of coastal infrastruc-ture, higher costs to protect and maintain beaches.
Sea surface temperatures rise
Increased coral bleaching and marine resource and aesthetics degradation in dive and snorkel destinations
Changes in marinebiodiversity Loss of natural marine attractions
and species.
Table 7-7: Major climate change impacts on the Maldives tourism sector

Second National Communication of Maldives to the United Nations Framework Convention on Climate Change87
07to a higher degree of risk from sea level rise and extreme events.
The maintenance of natural beach is of paramount importance to attract clients to the resorts and the construction of artificial structures designed to control and limit beach erosion are not aesthetically pleasing and also expensive. A modern resort with a bed capacity of 200 beds would cost a capital investment of more than 43 million dollars (MEEW, 2007). This indicates that a risk of higher economic loss due to sea level rise in resort islands compared to other islands.
7.7.4 Increase in Sea Surface Temperatures Westmacott & Rijsberman (2000) estimates 25% to 35% of the tourists visit Maldives for snorkelling and diving. Due to increase in sea surface temperatures, bleaching of coral reefs in the diving destinations are known to be the most eminent threats in the tourism dependent small low lying destinations (Perch-Nielsen, 2008). The bleaching event of the 1997/1998 El-Nino caused more than 80% coral bleaching in Maldives (Edwards et al., 2001).
In a perception study it has indicated that 68% of the tourist who visited Maldives in 1998-99 were unaware of coral bleaching event in Maldives that season (Westmacott et al., 2000). The estimated economic loss was around USD 3 million for that year. Thus the immediate impacts of coral bleaching due to short episodic events would not affect the industry on a noticeable scale (Westmacott et al., 2000).
However, higher mortality of corals due to increased SST is likely to impact larger and higher profile marine animals which depend on coral reefs (e.g. turtle, sharks and rays). Martin & Hakeem (2006) values the shark based diving industry in Maldives at USD 38.6 million. Anderson et al. (2011) estimated Manta-watching in Maldives to be worth about USD 8.1 million per year in direct revenue. Hence, the long term increase of SST due to climate change is likely to have a higher economic impact.
7.7.5 Impact of Mitigation actionClimate mitigation policies are generally implemented with the intent of reducing GHG emission and slowing down anthropogenic climate change. However, these response measures to climate change have an economic cost and can impact Maldives tourism industry negatively. Mitigation policies can be differentiated in to domestic and cross border policies.
Domestic mitigation options like introduction of renewable portfolio or domestic carbon price have a high initial cost. This increases the financial burden on resort developers and operators which would be ultimately transferred to the customers or tourists. However, showcasing mitigation actions in tourism sector can be used as marketing tool by showing tourism products in Maldives as climate responsible. Further these negative impacts can be managed with providing financial incentives for taking these actions.
The Maldives tourism is also vulnerable to impacts from other countries or international mitigation policies. Examples are the potential cost implication for transport due to the proposed market based mechanism for mitigation by ICAO or the possible inclusion of aviation in EU emission trading scheme. Although the both options are not detailed, it is envisaged that it would increase airfare around the world. The level of increase is dependent on the carbon price used for these options. Table 7–8 below shows the estimated impact of a carbon price made by Faber & Brinke, (2011) on airfare and overall demand. This potential reduction in demand is likely to reflect in the arrival of European visitors in the future.
The International center for Trade and Sustainable Development (ICTSD) 2010 (ICTSD, 2010) study on the trade implications of regulating emissions from international transport reports that a levy of USD 15-30 per ton of CO2 on international maritime causes GDP losses in the range 0.2-1.8% for Small Islands Developing states (SIDs) due to reduction of maritime trade between these countries and EU.
Table 7-8: Impact of introducing a carbon price on ticket price and demand for air travel
Carbon price € 10 € 30 € 50
Ticket price increase 1.3% 4.0% 6.5%
Percentage change in demand
-0.5% -2.4% -2.6%

7. Vulnerability to Climate Change 88
07Box 4. Bandos Island Resort
A case study was conducted to assess the vulnerability and adaptive capacity of Bandos Island Resort. Bandos was developed as the second resort of the Maldives in December 1972. Today, it operates with 225 guest rooms and is located just 15 minutes boat ride away from Ibrahim Nasir International airport.
As an early resort, the island was subjected many coastal modification and hard coastal infrastructure in its development. These changes has subjected the island to varying degrees of erosion over the years. The investment loss due to sea level rise and erosion is a key concern. Capital investment per tourist bed at this resort was estimated to be USD 60,000 in 2014. This is a nearly 43% increase from the valuation made by MHAHE (2001). The value of capital investment is likely to increase at the rate of about 5.39% annually.
To address this issue, the resort have invested in coastal protection measures like Cement bag and coral mound Groynes and carries out beach replenishment. As of 2014, the island spends approximately USD 100,000 for coastal protection, which is a 66.7% increase from estimate made by MHAHE (2001).
The inundation model of Bandos to the future SRES scenario (Figure 7–21) shows that in all scenarios the beaches of the island is going to be affected with a minimum land loss. At the high band of sea level rise scenario show inundation of some infrastructure including the walk way around the island and some beach villas at the west of island. Beach villas and water villas which are located on SW side is not expected to have any impact due to the impacts of climate change.
Figure 7-21: Bandos inundation model for SRES scenarios (B1, A1B and A2) for 2100

Second National Communication of Maldives to the United Nations Framework Convention on Climate Change89
07
Figure 7-22: Coral reef recovery trend at Bandos (data source: MRC).
Mean coral cover at the monitoring sites in Bandos site was 1.98% after 1998 bleaching (Zahir et al., 2006). This cover increased to approximately 6% in 2000 and 33% in 2012 (Figure 7–22). The annual rate of reef recovery as percentage coral cover is estimated as 2.5%. This is slightly below average compared to the central region (2.8%). Revenue generated by coral reef based activities, namely snorkelling and diving at Bandos Island Resort was estimated around USD 1 Million at 2001 and this value at present sums up to about USD 1.5 Million. It shows that the vulnerability of the resort remains unchanged to impacts of biodiversity loss due to climate change.

7. Vulnerability to Climate Change 90
07
www.maldivesholidayoffer.com

Second National Communication of Maldives to the United Nations Framework Convention on Climate Change91
08
Water Solutions

8. Adaptation to Climate Change 92
8. Adaptation to Climate Change
8.1 Land Loss and Beach Erosion Coastal adaptation can be traced backed to first erosion cases in early 1970s. Islanders have used different techniques to address the common problem of erosion. Historically islanders have opted for protection of the island or moving to a safer island. Given the small sizes and the high dynamics of the islands protection of the
islands is the most realistic adaptation option.
In the past coastal protection measures have been practiced in Maldives without a proper guidelines and in an ad-hoc manner. A coastal protection guideline was established in 2015. This guideline outlines
Figure 8-1: Schematic flow on analysing coastal adaptation measures to be implemented and executed. (adapted from MEE, 2014a)
Adaptation is the adjustment in natural or human systems in response to actual or expected climatic stimuli or their effects, which moderates harm or exploits beneficial opportunities. According to FNC, adaptation measures in the Maldives, are limited and further hindered by limited capacity. Since then a considerable amount of work has been done in terms of alleviating the vulnerabilities to climate change and increase the overall adaptive capacity of the country. This chapter reviews the current adaptation practices and identifies further adaptive measures that need to be undertaken.

Second National Communication of Maldives to the United Nations Framework Convention on Climate Change93
08the standards and protocols for selection, design, implementation and maintenance of the appropriate coastal protection measures. The main options identified in the guideline are hold the line, move seaward, manage realignment, limited intervention or do nothing (Figure 8–1).
8.1.1 ‘Hard’Engineered Measures Hard structures are the most widely practiced coastal adaptation measures and are proven to be durable and effective. However, implementing hard measures in highly dynamic environment are shown to be extremely difficult and costly. In addition, these measures are considered to have a significant negative impact on the environment and dynamics. A survey undertaken to identify coastal adaptation in the Maldives (MEE, 2015d) shows that there are near shore and foreshore coastal protection technologies (seawall, groynes breakwaters etc.), land reclamation and causeways/bridges used as hard engineering solutions in Maldives. The life time cost (more than 20-year life cycle cost) of these measures for Maldives are summarized in Figure 8–2
Based on these estimates complete protection of all inhabited islands would cost USD 0.5 to 8.8 billion. While just limiting these measures to the protection of the settlement area will cost approximately USD 0.33 to 5.5 billion depending on the choice of technology. These estimates exclude groynes, jumbo bags, coral mounds and concrete filled barrels since they are effectiveness against multi-hazards are not fully understood. A policy shift was made to use rock boulders for the construction of breakwaters and revetments for public
harbour development and coastal protection projects in the islands when Recovery and Reconstruction Plan was developed in the aftermath of 2004 Indian Ocean Tsunami. Coral mounds can no longer be considered since coral mining is banned.
Land reclamation is generally practiced in Maldives as means to increase land space to reduce congestion and development activities of the island. Historically reclamation is done just above sea level by mining stone/sand within the island lagoon. However due to environmental concerns and following the ban of coral mining, recent reclamation burrows sand from atoll lagoon. In addition to this the height of newly reclaimed lands are set above 2m from MSL as a mitigation measure against projected SLR. The resulting change in drainage pattern is managed by engineered drainage systems.
8.1.2 Soft Measures:The ‘Soft’ coastal measures are described as measures that are built as coastal adaptation measures in an attempt to enhance natural process of coastal environment. Several ‘soft’ coastal measures such measures such as beach replenishments, preservation
Figure 8-2: Cost comparison among the hard engineering solution for coastal adaptation (data source: MEE, 2015d)
Figure 8-3: Cost comparison of soft engineering solutions for coastal adaptation
Water Solutions

8. Adaptation to Climate Change 94
08of coastal ridge, temporary seawalls/revetments, land use controls/setbacks, coastal vegetation, raised ridges and artificial reefs have been undertaken in Maldives (MEE, 2015d). These measures are comparatively cheaper than the hard engineering solutions described above (Figure 8–3). Some of these measures like setbacks are mandated through regulations for land use plans and resort developments. However due to space restriction it is not properly enforced in many of the inhabited islands.
Soft measures are difficult to implement effectively due its high sensitivity to the local environmental conditions such as geomorphology, hydrology and climate. The measures also require frequent and long term commitment to maintain the effectiveness. These measures are not popular in inhabited islands due to low visibility but preferred by resorts in the Maldives that has high priority of maintaining a larger beach and to preserve the aesthetics of the natural coast.
8.2 Water ResourceAs highlighted in Chapter (vulnerability) water resources are at risk from both climatic (sea level rise, drought) and anthropogenic (pollution) factors. These factors need to be considered in adaptation options to ensure water security to the island communities. Some of the measures identified in FNC, namely groundwater protection, increase rainwater harvesting and storage, storm water management, are still valid adaptation options. However, these solutions in isolation are expensive and does not fully address the issue of water vulnerability. Reverse osmosis technology is used as means to provide clean and safe water to the communities. And since 2001, population coverage that receives RO-water increased from nearly 25% to over 48%. However, it is important to note that there are significant challenges in operation of RO plant in small island communities of Maldives.
Currently, Maldives is moving towards an integrated water renouncement management (IWRM) approach to address issues of economic viability and sustainability Figure 8-4: Concept of IWRM applicable to small islands (Maldives)
Water Solutions

Second National Communication of Maldives to the United Nations Framework Convention on Climate Change95
08
in the water sector. IWRM is an emerging concept that integrates available water resources on the island such as groundwater, rainwater and supplemented with desalinated water to produce fresh water at affordable cost to the communities (Figure 8–4). Such systems are being piloted in six islands at different regions of the Maldives.
Key components of IWRM in Maldives includes ground water protection, rainwater harvesting and storage, waste and storm water management and desalinated water to supplement the natural resources.
8.2.1 Rainwater harvesting and storageRainwater harvesting is a traditional practice followed in Maldives. However, current storage capacity is inadequate to meet the water demand in some of the islands. It is important to increase water harvesting and storage capacity to maximum possible extent. In addition to collecting rainwater on individual household roofs for direct use, rainwater will be collected on public roofs. To ensure water quality, the rainwater would be treated properly before use.
8.2.2 Groundwater protectionGroundwater is an important source of water at small coral islands. Groundwater protection is an important element in increasing water security and water availability in islands across Maldives, especially in agricultural communities. Some key aspects of ground water protection are
• Develop island wide sewerage systems to reduce point source pollution
• Use of efficient technologies for water extraction
and recharging of the aquifers • Divert excess rainwater from household roofs
into groundwater wells• Promote skimming galleries for groundwater
extraction
8.2.3 Storm water managementStorm water management is an important adaptation measure to maximise the use of rainwater and address groundwater contaminations from flooding. Adaptation measures for flood management are being implemented in flood prone islands in HDh. Kulhudhufushi, GDh. Thinadhoo, Addu City, and Gn. Fuvahmulah.
8.2.4 DesalinationDesalination in IWRM is used to provide fresh water in the absence of adequate rainfall and fresh groundwater. This reduces the operational cost of the desalination plant. The main type of desalination technology used in Maldives is Reverse Osmosis. However, there is limited use of distillation technologies which uses waste heat or solar heat as energy source in some of the resorts. The cost is further reduced with the integration of RE to operate the power plants.
Desalination system of and IWRM in regional hubs are designed to cater the water demands for that region during extreme events. IWRM concepts are to be replicated in additional 4 islands to ensure safe and clean water in a changing climate with funding from the Green Climate Fund (GCF).
Ministry of Environment
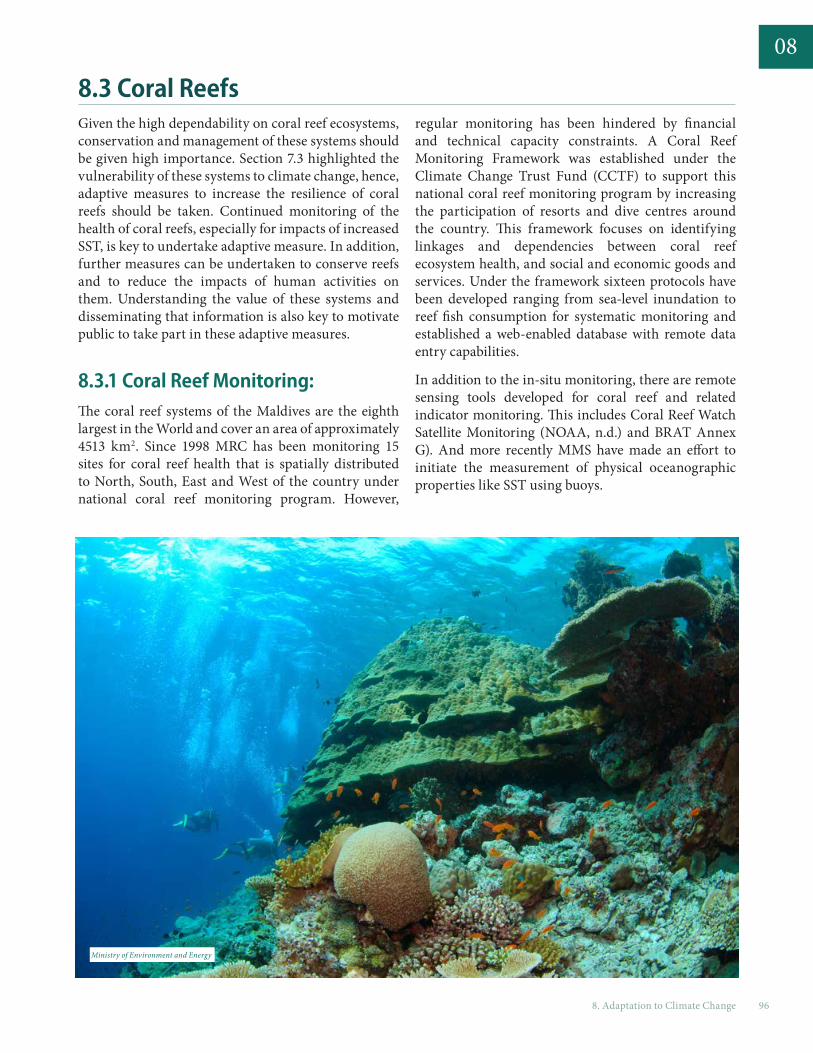
8. Adaptation to Climate Change 96
08
8.3 Coral ReefsGiven the high dependability on coral reef ecosystems, conservation and management of these systems should be given high importance. Section 7.3 highlighted the vulnerability of these systems to climate change, hence, adaptive measures to increase the resilience of coral reefs should be taken. Continued monitoring of the health of coral reefs, especially for impacts of increased SST, is key to undertake adaptive measure. In addition, further measures can be undertaken to conserve reefs and to reduce the impacts of human activities on them. Understanding the value of these systems and disseminating that information is also key to motivate public to take part in these adaptive measures.
8.3.1 Coral Reef Monitoring: The coral reef systems of the Maldives are the eighth largest in the World and cover an area of approximately 4513 km2. Since 1998 MRC has been monitoring 15 sites for coral reef health that is spatially distributed to North, South, East and West of the country under national coral reef monitoring program. However,
regular monitoring has been hindered by financial and technical capacity constraints. A Coral Reef Monitoring Framework was established under the Climate Change Trust Fund (CCTF) to support this national coral reef monitoring program by increasing the participation of resorts and dive centres around the country. This framework focuses on identifying linkages and dependencies between coral reef ecosystem health, and social and economic goods and services. Under the framework sixteen protocols have been developed ranging from sea-level inundation to reef fish consumption for systematic monitoring and established a web-enabled database with remote data entry capabilities.
In addition to the in-situ monitoring, there are remote sensing tools developed for coral reef and related indicator monitoring. This includes Coral Reef Watch Satellite Monitoring (NOAA, n.d.) and BRAT Annex G). And more recently MMS have made an effort to initiate the measurement of physical oceanographic properties like SST using buoys.
Ministry of Environment and Energy
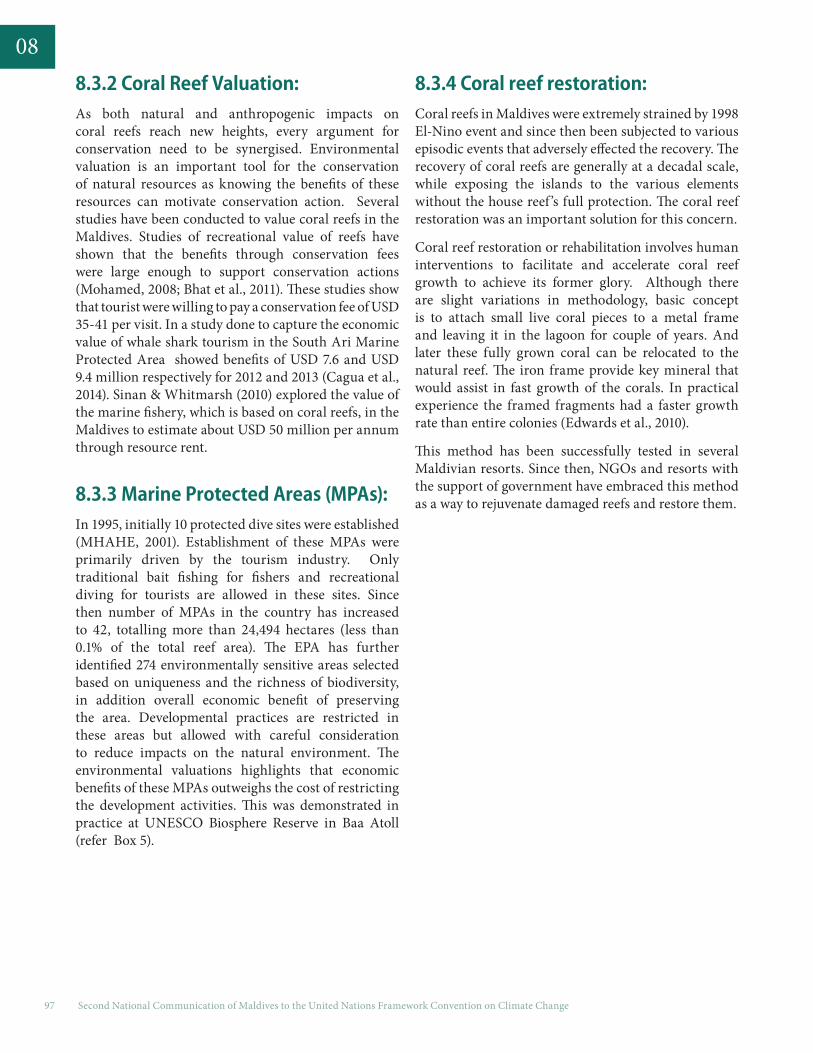
Second National Communication of Maldives to the United Nations Framework Convention on Climate Change97
088.3.2 Coral Reef Valuation: As both natural and anthropogenic impacts on coral reefs reach new heights, every argument for conservation need to be synergised. Environmental valuation is an important tool for the conservation of natural resources as knowing the benefits of these resources can motivate conservation action. Several studies have been conducted to value coral reefs in the Maldives. Studies of recreational value of reefs have shown that the benefits through conservation fees were large enough to support conservation actions (Mohamed, 2008; Bhat et al., 2011). These studies show that tourist were willing to pay a conservation fee of USD 35-41 per visit. In a study done to capture the economic value of whale shark tourism in the South Ari Marine Protected Area showed benefits of USD 7.6 and USD 9.4 million respectively for 2012 and 2013 (Cagua et al., 2014). Sinan & Whitmarsh (2010) explored the value of the marine fishery, which is based on coral reefs, in the Maldives to estimate about USD 50 million per annum through resource rent.
8.3.3 Marine Protected Areas (MPAs): In 1995, initially 10 protected dive sites were established (MHAHE, 2001). Establishment of these MPAs were primarily driven by the tourism industry. Only traditional bait fishing for fishers and recreational diving for tourists are allowed in these sites. Since then number of MPAs in the country has increased to 42, totalling more than 24,494 hectares (less than 0.1% of the total reef area). The EPA has further identified 274 environmentally sensitive areas selected based on uniqueness and the richness of biodiversity, in addition overall economic benefit of preserving the area. Developmental practices are restricted in these areas but allowed with careful consideration to reduce impacts on the natural environment. The environmental valuations highlights that economic benefits of these MPAs outweighs the cost of restricting the development activities. This was demonstrated in practice at UNESCO Biosphere Reserve in Baa Atoll (refer Box 5).
8.3.4 Coral reef restoration:Coral reefs in Maldives were extremely strained by 1998 El-Nino event and since then been subjected to various episodic events that adversely effected the recovery. The recovery of coral reefs are generally at a decadal scale, while exposing the islands to the various elements without the house reef ’s full protection. The coral reef restoration was an important solution for this concern.
Coral reef restoration or rehabilitation involves human interventions to facilitate and accelerate coral reef growth to achieve its former glory. Although there are slight variations in methodology, basic concept is to attach small live coral pieces to a metal frame and leaving it in the lagoon for couple of years. And later these fully grown coral can be relocated to the natural reef. The iron frame provide key mineral that would assist in fast growth of the corals. In practical experience the framed fragments had a faster growth rate than entire colonies (Edwards et al., 2010).
This method has been successfully tested in several Maldivian resorts. Since then, NGOs and resorts with the support of government have embraced this method as a way to rejuvenate damaged reefs and restore them.

8. Adaptation to Climate Change 98
08Box 5. UNESCO Biosphere Reserve:
In 2011 Baa Atoll was declared as a UNESCO Biosphere Reserve. Baa Atoll harbours globally significant biodiversity including significant concentrations of whale sharks and manta rays and also a unique diversity of benthic fauna, including rare pink hydrozoan corals (Distichopora nitida), Bryozoans (Bugula) and sea slugs (Tambja olivaria) that are only recorded from Baa atoll. The Government established Baa Atoll UNESCO Biosphere Reserve Office to lead and coordinate implementation of the Biosphere Reserve Strategy. Biosphere Reserves have three functions: conservation, sustainable development and learning. They provide opportunity for knowledge sharing, research and monitoring, education and training, and participatory decision-making.
The zonation system developed for Baa atoll conservation has adopted the UNESCO World Biosphere Reserve zonation criteria and protocols. This includes a three tiered zonation approach which includes;
Core Areas are areas that have a high ecological significance in terms of marine and terrestrial biodiversity, have a high natural value These areas are highly protected and managed areas where only non-damaging, non-extractive use is allowed. Commercial, artisanal and subsistence extraction of all biological and non-biological resources are prohibited in this area. However, public access is allowed for educational, cultural and recreational uses at a level which will maintain the area in a near natural state.
Buffer Zones are managed areas that by definition (UNESCO) provide conservation and protection support services for Core Areas that maximise biological connectivity whilst allowing the communities and atoll user’s access to appreciate and enjoy these zones. These area also considered to have a high ecological significance in terms of marine and terrestrial biodiversity. Commercial extraction of all biological and non-biological resources. However they allow a range of artisanal and subsistence extractive and non-extractive activities that are compatible with the Core Area conservation objectives. Tourism (e.g. diving, snorkelling) and public access (e.g. picnics) to buffer areas for recreational purposes that are no extractive are permitted.
Transitional Areas that provide for long term sustainable resource (biological and non-biological) utilisation and livelihood activities (commercial, artisanal and subsistence) whilst ensuring these resources are conserved through an integrated ecosystem management program.
Second National Communication of Maldives to the United Nations Framework Convention on Climate Change99
08
8.4 Food securityVulnerability assessment, showed that limited agricultural production, heavy import dependency, limitations in storage are the main vulnerabilities needed to be concerned in addressing vulnerabilities. Number of activities have been undertaken in the past decade to increase agricultural productivity and enhance food security. In order to synergise the benefits of various activities and approaches a national strategy to address climate change and food security has been drafted in 2012.
8.4.1 Increased local production and reduce import dependencyWith an extensive effort both by the government and with the international assistance, several measures have been undertaken to address the issue of climate change in agriculture sector. Agriculture is now practiced on islands where agriculture was non-existent. Community mobilization and awareness have increased the amount of land used for cultivation. Increasing the production and sustainability would lead to an increased food security.
An important initiative undertaken to address the limited production was to introduce alternative technologies of production such as hydroponics (Mittal & Sethi, 2009). Introduction of hydroponics has enabled land-scarce islands and households to grow crops. This technology has been piloted and practiced in different islands such as Lh. Kurendhoo, AA. Ukulhas and Th. Buruni. Cabbage, lettuce and cucumber are produced and sold to the local market.
Auto-pot system is another technology that is has been introduced in Maldives to improve agricultural production. Greenhouse auto-pot systems were introduced as part of an integrated farming project with the assistance of IFAD and UNDP which was conducted from 2008-2013 (UNDP, 2013). The project provided long-term support for economic development of communities through agriculture extension and integrated farming. This project was successful among the communities as it increased the production of fruits and vegetables for local needs and commercial needs at Addu City, G.A Kondey, H.A Baarah and H.A Filladhoo.
Although poultry farming in Maldives was carried in a very traditional manner, commercial scale production
technologies has been introduced to diversify the industry. Poultry farms used for egg production at a commercial scale, sold to the local and tourism market indicates that poultry farming could be practiced to reduce the import dependency. Poultry farms have been established in Ha. Baarah, Th. Veymandoo, B. Hithaadhoo and HDh. Hanimaadhoo. Pilot cases have shown that there are significant challenges in the sustainability due to lack of availability of bird feed and distribution of the produce. However, the pilot case showed that, if the feed can be produced from local products through integrated farming practices it could be viable. Economies of scale is still a challenge for small and medium scale farmers.
To increase the awareness and local capacity, farmer training and research on the evaluation of crops varieties has been carried in several locations. One such recent centres were established in L. Mendhoo and HDh. Hanimaadhoo agricultural centres. Details on suitable varieties for cultivation, crop production, yield and market information was provided. In addition to this, information on commercial development of papaya, watermelon, eggplant and chili were provided. Increasing the commercial potential would have the three-fold benefit of increased production for local use, increased livelihood of the people and reduced import dependency.
Water Solutions

8. Adaptation to Climate Change 100
088.4.2 Storage and distributionA large stock of food items in addition to consumer durables, fuel and other necessary raw materials are distributed from Malé to the islands. Distribution is mainly done using cargo boats and seldom by air from Malé to other islands. The storage distribution and supply chain has been made more efficient during the last five years. STO currently has 3 storage and distribution centres mainly for staple foods. A centre in north at HDh. Kulhudhuffushi, Malé in the centre and Addu City in the south. The storage capacities of these centers are 3 months in the central and 2 months in other regions. In disaster situations such as tsunami
has proven that 3 distribution centres are insufficient due to the limited volume of storage in those centres and difficulty in transportation during these situations. Hence there is need to strategically increase storage capacity and centres to enhance food security.
According to information provided by STO they now use different marine vessel operators making the sea transport more efficient. They have also improved the storage go-downs in Malé city by raising the floor and by placing conveyor belts to address the flooding issues and to make the work effective. In addition, they conduct regular fumigation and the go-downs are well designed with ventilation and are made insect proof to increase the lifetime of the products.
8.5 FisheriesThe fisheries sector of the Maldives is vulnerable to climate change, especially from increased sea surface temperatures. The NAPA process identified main 6 adaptation measures for the fisheries sector:
1. Improve fish finding and fish harvesting and handling.
2. Establish aquaculture/mariculture as an alternative to natural breeding to reduce the economic and social impacts of changing tuna abundance.
3. Undertake research and disseminate information on fisheries and climate change.
4. Experiment new and alternative species and breeding / handling methods for live bait.
5. Integrated reef fishery management
The Ministry of Fisheries and Agriculture, with assistance from JICA is currently in the process of developing a Fisheries Master Plan (MASPLAN) which recognises impacts of climate change as a great concern for the fisheries sector. Undertaking research into climate change impacts on the fisheries sector would be an important component that would be included in the MASPLAN. Similarly, identified adaptation measures that had been highlight in several strategy documents, would be integrated into the sector development. Research into climate change impacts on the fisheries sector is very important and these need to be conducted and disseminated.
Ministry of Environment and Energy

Second National Communication of Maldives to the United Nations Framework Convention on Climate Change101
088.5.1 Improve fish finding and fish harvesting and handling Climate change may potentially impact migratory patterns of tuna. It is important to identify ways to predict these patterns and help fishermen find schools of tuna. Anchored Fish Aggregating Devices (FADs) introduced in the 80’s replaced the tradition methods of searching for tuna schools by means of seabirds and floating objects. There are currently 54 FADs in operation in different regions of the Maldives. Identification of potential fishery zones (PFZ) using satellite data has also now been introduced in the Maldives. A subscription based PFZ service is already provided by Maldives Fishermen’s Association for fishermen in the southern at atolls. The MASPLAN included initiatives to identify other potential fisheries resources such as giant squid that can be exploited at a commercial scale to diversify the fisheries sector of the Maldives.
8.5.2 Establish aquaculture/maricultureTo reduce the impact on the existing stock, mariculture was introduced to diversify the fisheries sector. While strong policies are in place for mariculture development in the Maldives, the growth of maricuture
as an industry is slow. The sea cucumber, Holothuria scabra, has been successfully cultured. The Marine Research Centre conducted research on the culture of certain commercially exploited species of groupers. A government program to develop a multispecies hatchery is underway under the IFAD-Mariculture Enterprise Development Project. The project would develop the infrastructure for hatchery and quarantine facilities, formulation of associated regulations, financing options, training and awareness programs. Once the hatchery is established fingerlings and seed will be sold at subsidized rates to private small holders for the grow out phase.
8.5.3 Live bait sustainabilityLive bait is essential for the success of the tuna fishery. The Maldives fishery is currently facing the issues of live bait sustainability due to inadequate handling practices combined with high levels of bait extraction. Global and regional climatic variations may impact the live bait fisheries of the Maldives. The MoFA/MRC has prepared a “Maldives live bait fishery management plan” which focuses on bait sustainability and reducing over exploitation of live bait species. The MRC is introducing some experimental design changes to fishing vessels to reduce baitfish mortality during handling and thus also lead to reduced level of bait fish exploitation for tuna fisheries. The MRC is conducting research into
Flickr: Ahmed Zahid

8. Adaptation to Climate Change 102
08aquaculture of live bait species. A project is developed with the assistance of World Bank to breed “milk fish” which could be used as bait in longline for yellowfin tuna fishery.
8.5.4 Integrated reef fishery management.Increased demand for reef fish by the tourism industry and development of overseas markets has led to increased levels of exploitation of many reef fish species. The status of reef fish stock and the scale of impact on the stock needs to be studied. Management measures are now in place for groupers and sea cucumbers. A
grouper management plan and regulation is now in place for integrated management of the grouper fishery. Grouper size limits are enforced and 5 grouper spawning sites have been protected under this regulation. Fishing bans are enforced on some reef associated species, such as sharks and giant clams, due to over exploitation. Shark fishery has been totally banned in the Maldives.
The MoFA is developing an aquarium fishery management plan. An integrated reef fish management plan is also included in the Fisheries MASPLAN. The plan will address establishment of managed habitats, reducing fishing pressure by the introduction of harvest control measures, compliance and law enforcement and improvement of data collecting mechanisms.
8.6 Human HealthVulnerability assessment indicated that a strong linkage exists between vector borne outbreaks with rainfall patterns, climate extreme and ENSO events. It is widely accepted and noted that addressing environmentally influenced health related problems such as diseases related to extreme weather event, air quality, rainfall pattern, vector borne diseases and water borne diseases remain as a challenge. Improved adaption measures in other sectors including waste, water and sanitation, air pollution and infrastructure will bring positive changes to human health. Even though human health is a co-dependent on several other sectors mentioned above, the sector has undertaken measures in coping with environmental challenges.
Several policies, guidelines and master plans of the sector, recognize the importance of environment in human health. One of the key policy documents is the National Environmental Health Action Plan (NEHAP). In 1996-7, the initial effort of preparing a NEHAP was attempted to address the health issues/concerns arising out the national development process while the 2010 and 2014 revisions gave a special focus on addressing the detriments of climate change on human health. Thus the revised NEHAP links health action to the targeted objectives of the six key results of NEAP3 which addresses the downside of the climate change consequences. Similarly Maldives Health Master Plan (MHMP) for 2016 to 2025 identify climate change as a key issue and intends to address it via “monitoring health impacts of climate change and developing strategies for reorienting programmes to address the emerging health issues” (MoH, 2014). In addition,
MHMP also highlights key activities and targets which would increase the overall resiliency of the health sector to impacts of climate change.
8.6.1 Public Health SurveillanceMHAHE (2001) highlighted a lack of proper health data record system in its assessment. In 2006 an integrated disease surveillance system (SIDAS) was established throughout the country. A focal point in each atoll ensures that the island-level data from respective atolls are regularly collected and uploaded to the system. Currently the system is only for communicable diseases. The information available from this database was key to identify inter- and intra-annual epidemiological trends of communicable diseases. There is still a need to improve quality of data collected. It needs further development for early response such as including auto-alert functions and improving event-based surveillance.
A comprehensive disease surveillance network for communicable diseases, non-communicable diseases, population parameters and risk factors need to be established. It is only through robust surveillance, can we properly monitor progress of health indicators and take necessary public health action. Laboratory surveillance, surveillance for hospital acquired infections and antimicrobial resistance also needs to be developed (MoHG, 2014).

Second National Communication of Maldives to the United Nations Framework Convention on Climate Change103
088.6.2 Control of vector borne diseaseOngoing seasonal outbreaks of dengue and other vector borne diseases led to the enforcement of the ‘Mosquito Control Regulations’ by the government in 2007. This is regarded as the first direct climate change and environmental related regulations made to control vector borne diseases in Maldives. The main aim of this regulation is to reduce mosquito breeding grounds at household levels, constructional sites, industrial islands including tourist islands, social places. The regulations also promote actions to apply insecticides to larvae stage mosquitoes. Under the regulation, local councils are mandated to regularly undertake education and awareness session for general public about risk of these climate change related diseases such as dengue.
The NAPA identified the need to strengthen regulatory and institutional capacity for vector control as an immediate need (MEEW, 2007). The National Public Health Protection Act (7/2012) of 2012 gives importance to addressing of environmental and climate change related diseases. The Act includes guidance for the health sector on how to operate during emergency situations such as outbreak of Dengue.
8.6.3 Access to health careThe NAPA identifies the strengthening of health care delivery as one of the adaptation action that needs to be undertaken (MEEW, 2007). While the geographic dispersion of islands makes it challenging to provide tertiary level care at each island, primary level care is available in all inhabited islands. Establishment of these facilities have led to mortality related to vector borne diseases such as dengue and other and water borne diseases in the small communities which are far away from the specialized hospitals. Recently the government have started a program in Maldives to ensure that basic essential drugs are available from each islands. This program has helped communities in tackling with human health problems including those caused by the impacts of climate change.
The introduction of universal social health insurance schemes has improved accessibility to healthcare throughout the country. Since its introduction in 2009, the schemes underwent several policy changes. The current scheme Aasanda is public owned and runs from national budgets under set guidelines of National Social Protection Agency (NSPA). Even though Aasanda remains as the main social insurance mechanism in Maldives, private sector schemes are being introduced.
Water Solutions

8. Adaptation to Climate Change 104
08
8.7 Population and development consolidation As indicated above, implementing coastal protection measures for the inhabited islands can cost up to USD 8.8 billion. This is approximately 316% of the GDP (compared to GDP of 2013 at current price). However, given the importance to develop other sectors, expenditure for coastal protection at this cost would be a huge economic burden to a small and fragile economy like Maldives. To minimize this burden and to meet the economies of scale, government has a strategy of consolidating the population and development to larger islands where the necessary facilities could be provided. Population and development consolidation produces benefits from lower costs of service delivery and is part of a strategy for adaptation to climate change. If implemented, it could be one of the most cost effective measures of adaption as the adaptation measures in all the sectors would be dealt within the consolidation strategy.
Following the 2004 Indian Ocean Tsunami, the population development programme was revisited and the programme was redeveloped as the Safer Island Development Programme (SIDP). The idea of the Safe Islands is to extend the population consolidation approach to incorporate the aspect of extreme vulnerability and develop measures to reduce ecological disasters. This will enable the communities to sustain social and economic development in times of emergencies and disasters, by providing ecologically safe zones. These are intended principally to reduce tsunami hazards and other disasters by establishing building and construction codes that would enable vertical evacuation if and when necessary, and provide all basic services in an emergency, including particularly health, communication and transport infrastructure, as
well as ensuring a buffer stock of basic food and water.
The SIDP seeks to provide the infrastructure necessary to adapt to climate change and to be better prepared for natural disasters. A Safer Island will have better coastal protection, elevated pubic buildings for vertical evacuation, emergency supplies, an appropriate harbour, and more reliable communications systems. These islands should also serve their neighbouring islands in the event of a disaster. This overarching policy will be the backbone of long-term development and is also in line with the broad government policy of “building back better” following the tsunami. After India Ocean Tsunami, few of smaller island population moved to larger and urban centres in different regions of the Maldives.
Population consolidation is already implemented. However, population consolidation comes with its own challenges. As the strategy encourages people to move voluntarily and the government has to address its mounting public debt, the program will require a huge amount of resources and tackle the social problems related to this.

Second National Communication of Maldives to the United Nations Framework Convention on Climate Change105
08
8.8 Tourism Tourism sector being the back bone of the economy, consideration must be given to ensure the safety and sustainability of the industry. So far the tourism sector has shown to be substantively resilient to the environmental changes. The Ministry of Tourism has developed several policy measures within the sector which increase resilience of the sector to impacts of climate change.
According to current rules and regulations of tourist resort development, stringent environmental guidance are mandatory. Among others include; the maximum amount of land space which could be utilised for built-up area is 30% of the island while the built-up area has to be within 5m from the vegetation line. In addition, the use of groundwater by the resorts are prohibited to preserve the natural ground water lens. Any over water structures are to be built with the minimal disturbance for the shoreline dynamics. Proper waste management facility with incineration and proper handling of fuel are mandatory. These are some of the policy measures which are in place to preserve the natural environment of the resort islands.
All standards, policies and measure in tourism sector
have applied highest environmental standards in tourist resort. The sector have developed policies, standards to ensure that climate change adaptation is integrated or aligned in the tourist resort development in all service sectors, including, critical infrastructure, tourist buildings/bungalows, waste, water, food. The sector is further improving regulatory and policy framework to ensure that high quality tourism product is provided to the tourist. The sector is further developing and investing high quality, climate proof infrastructure.
The Ministry of Tourism is also taking further initiatives to enhance climate change adaptation to increase the resilience of the sector. A GEF assisted project “Tourism Adaptation Project” (TAP) was initiated in 2012. The project facilitated and provided support to bring about the required amendments to the existing laws and regulations that govern the tourism sector.
Tourism operations in Maldives are intimately connected to other sectors such as agriculture, fisheries, manufacturing, construction, transport, communication, energy, water and waste management. At the same time the tourism sector maintains critical economic linkages with remote and highly dispersed
Ministry of Environment and Energy

8. Adaptation to Climate Change 106
08inhabited islands. Hence, adaptation to climate change in the tourism sector need to focus on resilience of these sectors and communities. For this reason the TAP project also focus on implementing activities that can help adaptation of these areas.
8.8.1 Community based adaptationTourism sector projects identified and supported community-based adaptation projects in tourism-associated communities. It demonstrated how tourism operators and tourism-dependent communities can cooperate on joint initiatives to reduce common vulnerabilities. One of the successful community based adaptation was through “Sustainable Water Management and Community Awareness in Maalhos Island, Baa Atoll”. The project implemented integrated water management facility in the island of B. Maalhos. Rainwater is harvested and piped to distribution points and an RO plant is used as a backup to cater during shortage and dry period. In addition to this, a bottling plant in collaboration with the resort is established where glass bottled water is catered to the resort. This creates a cleaner environment to reduce the use of plastic water bottles and create new jobs for the community.
Another activity conducted was to enhance the agricultural production by with hydroponics and water dripping system in farms of AA. Thoddu Island by a guesthouse operator. The project encouraged farmer on efficient usage of fresh water in their farms by using hydroponics and water dripping system to ensure the sustainability of the yield and to protect the freshwater lens of the island. A farm would be able to produce to cater the local guesthouses demands with a view to extend the market to the resorts.
8.8.2 Introduction of climate proof technologiesRecent tourism sector projects established new investment projects to climate proof operational infrastructures in tourist resorts and safari vessels to showcase the economic and environmental benefits of no-regrets adaptation in tourism operations.
One of the project conducted was “Pilot Alternative Mechanisms to Fossil Fuel Consumption for Sea Transportation”. Under this a vessel with a parallel hybrid system that would generate electrical energy from the rotating propeller was developed. This will
showcase the economic viability and feasibility of transformation of the existing technologies for clean energy production and for a cleaner environment.
A waste to energy generation is piloted in Chaayaa Lagoon Hakuraa Huraa resort by compact bio gas system. The food waste that is produced in the resort is utilized to turn into cooking gas. This project addresses the issue of management of food waste and provides a clean source of energy for cooking.
8.8.3 Risk managementGiven the high investment made in the tourism sector, significant concerns by the investors are made for a protection mechanism of the investment. Although the investments are currently under some form of insurance, the climate related hazards are vaguely covered (MoT, 2015b) in these insurances. A key focus is given to considered means to incentivize private sector investments in climate change adaptation in the tourism sector to strengthen the capacity of the Ministry of Tourism, and tourism businesses to recognize evident climate risk issues in tourism operations and adopt appropriate adaptation measures to address them.
To cover the residual catastrophic risks, the project aimed to develop the capacity of the government and the tourism industry to assess the feasibility of market-based risk financing mechanisms (such as weather index insurance) to ensure that tangible private-sector investments can be leveraged.

Second National Communication of Maldives to the United Nations Framework Convention on Climate Change107
09
Water Solutions

9. Other Information 108
9. Other Information
9.1 Activities relating to technology transferWhile the Maldives has not submitted a Technology Needs Assessment to the UNFCCC, assessments were undertaken in 2006 which identified priority technology needs for mitigation. According to the assessment, energy and transport are priority areas requiring technology transfer. Priorities for the energy sector includes both energy generation and energy use. For the transport sector, marine and land transport were identified as priorities.
Priority needs in energy generation include technology support for renewable energy, improvement of transmission, demand side management and co-generation. Likewise, priority areas for energy use include energy efficient air conditioning, green building design and energy efficient building materials, among others.
For the transport sector, the priority technology needs identified include scheduled inter island ferry system, regional ports and hubs and organized cargo delivery. Under land transport the priority technology options were vehicle inspection and testing, public transport system and urban traffic and landscaping.
The barriers identified for access to technology in the energy sector are high upfront capital costs, lack of investment capital and financing instruments, lack of information, and lack of clarity in policies, plans and targets, as well as institutional and administrative coordination barriers. Similar barriers were identified for adoption of clean and efficient technologies in transport sector in addition to lack of efficient technology and road space constraints.
A number of initiatives have been undertaken to enhance enabling environments for technology transfer in energy generation. The Accelerating Sustainable Private Investments in Renewable Energy (ASPIRE) programme initiated in 2014 aims to reduce risks for private sector investment in renewable energy. Under the programme, a guarantee mechanism has been established to cover risks including of those related to payment defaults, termination and currency conversion. These guarantees are being provided through funds made available by the Scaling up Renewable Energy Investment Programme (SREP), International Development Agency as well as Partial Risk Guarantee facility of the World Bank. Under the programme, a legal framework is being developed for
This section provides an overview of national efforts in the following areas in the context of addressing climate change:
• Steps taken to align or in-cooperate climate change into relevant social economic and environmental policies
• Activities related to technology transfer• Climate Change research and systematic observations• Research to adapt to and mitigate climate change• Information on education, training and public awareness• Information on capacity-building at the national, regional and subregional levels• Efforts to promote information sharing
Second National Communication of Maldives to the United Nations Framework Convention on Climate Change109
09sourcing of guarantee funds, with guarantees backed by the government and the World Bank.
Similarly, the Preparing Outer Islands for Sustainable Energy Development (POISED) implemented with support from the Asian Development Bank aims to transform the existing energy grids in the Maldives into a hybrid (solar-diesel) renewable energy system, to reduce the need for diesel to generate electricity. The project entails instalment of energy management and control systems, energy storage and improvements in distribution networks.
To further facilitate investment in renewable energy, import duties on renewable energy products have been eliminated. In addition, the Net Metering Regulation was gazetted in December 2015. The regulation encourages the general public to utilize the clean energy sources available in the country and reduce greenhouse gas emissions. Furthermore, fossil fuel subsidies for the energy sector were removed from January 2016. The step was taken in parallel with an awareness campaign, combined with facilitation of access to financing for alternate energy sources and energy efficiency investments for individuals and private sector through the Bank of Maldives Green Loan launched in February 2016.
A great success has been achieved in advancing adaptation technologies in past 15 years. The less effective methods used in coastal protection have been replaced by effective technologies following the
“building back better” reconstruction programme implemented following the Indian Ocean Tsunami in 2004.. For example, the cement bags used for breakwater and seawall construction protection of islands from coastal erosion has been replaced with rock boulders and concrete S-section blocks. Auto-pot systems, hydroponics and organic composting technologies have been introduced to enhance food production. Technologies for coral rehabilitation was proven to be a success and has been widely accepted. The FAD which was introduced in the 80’s and due to the success, this was further replicated in different parts of the country. Furthermore, various types of fish finding technologies were introduced and integrated to assist the fishermen to increase the efficiency and output. Mari-culture technologies have also been introduced and commercialized to enhance fisheries productivity. Vessel Monitoring System (VMS) was introduced in 2012 that enhances security of fishermen and wayfarers during weather events. There are plans to integrate additional data collection (such as fish catch) in real time through the VMS. To enhance the water security various desalination technologies (distillation and reverse osmosis) were introduced into the outer atolls. Household level water purification system has become commercially available.
Maldives has also benefitted from bilateral cooperation on technology transfer, such as through a bilateral agreement with government of Japan on Joint Crediting Mechanism.
9.2 Climate change research and systematic observationAs Maldives works towards developing evidence based policies and plans to address climate change, the lack of proper scientific research is a major challenge. Understanding climate change processes, trends and impacts through proper scientific research is an essential ingredient for the national, regional and local decision making and planning processes. Lack of staff capacity, funds and research facilities are major constraints for national research and systematic observations.
Some climate change related activities are ongoing in the Maldives. However, these researches are carried in an uncoordinated manner, mainly by external agencies or research institutes. The level of local engagement in conducting such research is low. There are institutional weaknesses in facilitating research, particularly
coordinating, regulating and disseminating research activities and information.
The Maldives has been striving to improve its capacity for research and systematic observation within its constraints. A national climate change research strategy was established in 2012. This strategy focuses on building knowledge, enabling research and linking decision makers and facilitating change. The strategy identifies the following key research areas for climate change.
I. Understanding climate change: Knowing about past climate patterns, current trends and projected future changes to climate
II. Understanding the implications of climate change: Accurately identifying the impacts

9. Other Information 110
09on our physical environment, infrastructure, economy and society.
III. Becoming a low carbon economy – managing emissions: Knowing about practical and cost-effective solutions to become a low carbon economy.
IV. Living with climate change – towards climate resilient islands: Understanding practical and cost effective measures to lead us to a climate resilient pathway.
V. Understanding how we can communicate risks: Knowing what, who, how and when to communicate climate information for towards a climate resilient pathway.
The Maldives Meteorological Service (MMS) measures seismological and meteorological data and has approximately 40 years of records on tide levels, rainfall, wind speeds and direction, and temperature for two locations in the Maldives: Gan in Addu City and Malé City. Table 9–1 highlights the systematic observations made in Maldives.
Table 9-1: Maldives observation network
Monitoring stations Numbers
Meteorological Stations 5
Weather Radar 1
Automatic Weather Stations (AWS) 20
Tide gauge 3
Seismological stations (Kaadehd-hoo and Hanimaadhoo) 2
Annual Coral reef monitoring stations (MEMP) 15 (20)
The Maldives Climate Observatory – Hanimaadhoo (MCOH) was established in 2004. It is operated jointly by the Maldives Meteorological Services (MMS) and MCOH international Science Team through a Memorandum of Understanding with the United Nations Environment Programme to undertake atmospheric and climate research. To date MCOH has accumulated 10 years of continuous data, through state-of-the-art measurements of atmospheric composition over the Indian Ocean. Research undertaken at MCOH has shed light on anthropogenic and natural aerosols and their interaction with clouds, the monsoon system and other parts of the perturbed regional climate system.
National Geographic Information System (NGIS) has been established under Maldives Environmental Management Project and work is under way to populate the system with data. This initiative, implemented with concessional financing from the World Bank, includes the development of policies and procedures, procurement of technical infrastructure and facilities, as well as human resource capacity development to effectively implement the NGIS. The National Bureau of Statistics regularly collects and publishes social and economic statistical data of the Maldives at a high standard, and plans are underway to integrate this data into the NGIS.
Following the mass coral bleaching event of 1998, MRC initiated the National Coral Reef Monitoring Programme, under which 15 sites throughout the country are surveyed and monitored annually for reef health. With support of the European Union and the Government of Australia, a project to strengthen national capacity for coral reef monitoring was carried out, with plans to roll out coral reef monitoring to tourist resorts as partners, who would annually monitor and collect data from a fixed reef in their resort. Under the initiative, monitoring protocols has been developed for various monitoring components, and a web enabled database is developed to enter the data collected by the resorts.
There is a high-resolution satellite imagery receiving system in place in the meteorological observatory at the international airport island of Hulhule. Imageries are available from geostationary meteorological satellite FY-2E every 30 minutes from visible, infrared and water vapour (microwave) channels.
Ministry of Environment and Energy

Second National Communication of Maldives to the United Nations Framework Convention on Climate Change111
09
9.3 Information on research programmesThe National Climate Change Research Strategy developed in 2011 with support from the Least Developed Countries Fund and UNDP highlights lack of scientific research to support planning and decision-making processes as a major to designing climate resilient pathways in the Maldives. While a number of research has been undertaken on various aspects of climate change, these have been largely conducted by international institutions with very little awareness
amongst locals on their results. Furthermore, there is lack of coordination among government institutions, which have undertaken limited research in this field, resulting in duplication of efforts.
The National Climate Change Research Strategy also highlights that the bulk of the research undertaken so far focus on climate science, in areas such as sea level rise, air temperature, rainfall, sea surface temperature
Geographic coverage Research Title Collaborating Institutions Funded by Year
Climate Science
National Climate Risk Profile for the Mal-dives John E. Hay, New Zealand Government of Maldives 2006
NationalDeveloping a Disaster Risk Profilefor Maldives
Risk Management Solution Inc.Sustainable Environment and Eco-logical Development Society UNDP Maldives 2006
National Vulnerability and adaptation assess-ment of the coral reefs of Maldives. Abdulla Naseer, Maldives Ministry of Environment,
Energy and Water 2006
InternationalMirai Indian Ocean Cruise for the study of the Madden-Julian Oscilla-tion9 convection onset (MISMO
Japan Agency for Marine-Earth Science and TechnologyGovernment of Maldives Japan Government 2008
National
Detailed Island Risk Assessment in Maldives/ Natural Hazard and Physical VulnerabilityAssessment Report
UNDP UNDP 2008
NationalDetailed Island Risk Assessment in Maldives/ Social and Economic Assessment Report
UNDP UNDP 2009
NationalCoastal Monitoring, Reef Island Shoreline Dynamics and Manage-ment Implications
Dr. Paul Kench, New ZealandGovernment of MaldivesThe World Bank 2010
International Dynamics of the Madden-Julian Oscillation (DYNAMO)
Australia, France, India, Indonesia, Japan, Kenya, Korea, Maldives, Seychelles, Sri Lanka, Taiwan, United Kingdom
US governmentJapan Government 2012
National
Development of high-resolution regional climate model for the Maldives, through statistical and dynamical downscaling of global models, to provide projections for use in national and local planning
Asian Institute of Technology
LDCF,Government of Maldives,UNDP 2015
Regional
Effects of 2°C Warming/ IM-PACT2C modelling results for a 2°C climate for key global vulnerable regions
Helmholtz-Zentrum Geesthacht, Climate Service Center, Germany with 29 European and international teamsGovernment of Maldives
European Union 2015
(The Madden-Julian Oscillation (MJO) is a 30 to 90 day tropical weather cycle that alternates between large, strong rain storms and relatively quiet periods, moving from the Indian Ocean eastward to the Pacific Ocean.)

9. Other Information 112
09
and wind. A limited number of studies have also been conducted on geological and geomorphological aspects. Studies on coral reef monitoring, and recovery from disturbance have been conducted but not sufficiently. Furthermore, the Strategy also notes that studies that focus on aspects such as socio economic impacts,
adaptation and mitigation are severely limited.
Following is a summary of notable research undertaken on climate change during the reporting period:
9.4 Information on education, training and public awarenessA number of efforts have been undertaken to incorporate climate change education into the formal curriculum. Climate change is incorporated into the syllabus of the teacher training programme of the Maldives National University (MHTE, 2007) Environmental Studies was introduced to primary and middle school curriculum in 1984, and a dedicated topic on climate change and natural disasters was fully integrated in the environmental studies curriculum by 2009. The primary school curriculum (grades 1 to 7) was revised in 2014. Under this new curriculum key topics related to climate change, disaster risk, adaptive and mitigation measures are comprehensively covered under Science syllabus (NIE, 2014).
An undergraduate level degree programme on Environmental Management was commenced at the Maldives National University in 2010 with assistance
from the International Development Agency. The course programme incorporates climate change aspects into its syllabus, and aims to develop national capacity for environmental management. A number of scholarships are being provided to locals to facilitate participation in the programme. However, lack of adequate resources remains a challenge in achieving its full objectives.
These measures to incorporate climate change into formal education has been accompanied by efforts to raise awareness at the national level. Information on climate change is regularly disseminated through local broadcast and print media. In general, there is a high level of awareness on climate change and its impacts amongst the public and related stakeholders.
In order to foster transparency and increase
Adaptation
NationalSurvey of Climate ChangeAdaptation Measures in Maldives
Dr. Ahmed ShaigGovernment of MaldivesUNDP
LDCFGovernment of MaldivesUNDP 2011
Regional
Assessing the Costsof Climate Changeand Adaptationin South Asia
Asian Development Bank UKaid 2014
Mitigation
National
Assessment of Least-cost, Sustain-able Energy ResourcesMaldives
Energy Consulting Network ApSDTI Tech-wise A/SGasCon ApSGovernment of Maldives
Fund for Danish Consul-tancy Services 2004
National
Ocean Thermal Energy Conversionfor theRepublic of the Maldives
SIDS DockGEC Co. Ltd.
Government of MaldivesGovernment of Japan 2009
National
Marine Energy in the MaldivesPre-feasibility report on Scottish Support forMaldives Marine Energy Implemen-tation
Centre for Understanding Sustain-able Practice (CUSP)Robert Gordon University Scottish Government 2011
National Low Carbon Development Strategy UNEP DTU Danish Government 2014

Second National Communication of Maldives to the United Nations Framework Convention on Climate Change113
09accountability of state institutions in the Maldives, the Right to Information Act was ratified in 2014. This right is also enshrined in Article 29 of the Constitution of Maldives. The Environment Protection and Preservation Act mandates undertaking of environment
impact assessments prior to commencement of any development initiative that could have a significant impact on the environment. Under EIA regulations, EIA reports are shared with the public for comments prior to approval.
9.5 Capacity buildingA National Capacity Self-Assessment (NCSA) was undertaken in 2009. NCSA aimed to identify and characterize the nature of critical capacity constraints and priority capacity needs faced by the Maldives in the area of global environment. The NCSAs are also expected to produce a national strategy and action plan for addressing those constraints and needs. NCSA highlighted weaknesses in coordination and collaboration between government agencies and amongst stakeholders in general – public sector, private sector and communities. The experiences with implementation of programmes in Maldives provide insights for capacity development. Key concerns identified through these experiences include;
• Institutional Capacity Barriers • Technical capacity• Human resources continuity • Community outreach• Programme delivery partnerships
The Maldives National Adaptation Programme of Action (NAPA) identifies the specific need for capacity building in the following areas to adapt to climate change:
• Strengthen capacity for planning and design of infrastructure to ensure development of resilient infrastructure.
• Build capacity for coastal protection, coastal zone management and flood control
• Strengthen regulatory and institutional capacity for vector control.
• Strengthen the capacity for healthcare delivery• Establish capacity for emergency food storage
in development focus islands at regional level.• Enhance the capacity for waste management to
prevent pollution of marine environment.• Strengthen tourism institutions to coordinate
climate response in the tourism sector.
Maldives benefits from South to South cooperation in its capacity building efforts, through participation of key personnel in training programmes and study tours etc. Notable partners in this regard include China, India and Singapore. A number of staff members in stakeholder agencies have also been trained through scholarships provided from multilateral development banks, international agencies, and bilateral cooperation. A number of scholarships have also been provided through enabling activities. This has led to significant enhancement of human resource capacities in relevant agencies during the reporting period.
Promotion of involvement of a wide range of stakeholders in climate change adaptation is also a priority of the government. In this regard, grants are
Ministry of Environment and Energy
Ministry of Environment and Energy

9. Other Information 114
09provided directly to civil society organizations for projects to enhance their capacity to address climate change. These grants are managed by organizations such as the United Nations and funded with support from
the GEF, AusAID, USAID and the Mangroves for the Future initiative, among others and have successfully implemented various programmes to achieve their objectives.
9.6 Information and networkingEstablishment of an effective communication and networking mechanism on climate change issues among various stakeholders is identified as a priority area for action in the Maldives Climate Change Policy Framework adopted in 2015. As previously, a National Geographic Information System has been established. The system is being put to use with the stakeholders populating the data. This system would be a useful tool for the vulnerability and impact assessment as this system will gather data related to multi-stakeholders from a single platform.
In addition, this, databases and the stakeholders are developing websites of various nature with information readily being made available in a more systematic manner.
The government periodically publishes State of the Environment Reports which assess the available
environmental data to provide a snapshot of the environmental situation in the Maldives. These reports include a dedicated chapter on climate change, and are made publicly available through the website of the Ministry of Environment and Energy. However, lack of availability of primary data remains a challenge in adequately meeting the objectives of these assessments.
Efforts have also been made to enhance participation in and contribute to information networks at international level. The Table 9–2 provides a summary of membership in such initiatives:
As a member of the three Rio Conventions, UNFCCC, UNCBD and the UNCCD, Maldives further contributes to information sharing in the areas addressed under these Conventions through its national reporting obligations.
Table 9-2: Summary of membership initiatives
Network Joined Date Activities
South Asia Cooperative Environment Pro-gramme 22 October 1981
• Publication of regional state of the environment reports.• Participation in regional information sharing forums
South Asian Association for Regional Coopera-tion- Energy Centre 8 December 1985
• Publication of regional reports• Participation in regional seminars, information and data sharing
activities.
UNEP/ Global Environmental Information Exchange network (Infoterra) 14 November 1993 • Facilitate public access to environment information from a
national-level perspective. Abdulla Naseer, Maldives
Global Learning and Observations to Benefit the Environment (GLOBE) Program 2003
• Participation of students and the public in data collection, to contribute to understanding of the Earth system and global environment.
Asian Environmental Compliance and Enforce-ment Network 2005
• Environmental impact assessment (EIA) clearinghouse to facilitate knowledge capture and dissemination of information on international and regional best practices in EIA implementation
SIDS DOCK 2009
• Platform to connect energy sector in SIDS with the global market for finance, sustainable energy technologies and with the EU and US carbon markets, and able to trade the avoided carbon emissions in these markets.
Regional Integrated Multi-Hazard Early Warn-ing System for Africa and Asia (RIMES) 2009 • Sharing of early warning information
International Renewable Energy Agency 2009 • Participation in seminars, information and data sharing activities.
International Solar Alliance 29 November 2015• Facilitation of resource assessments, support to research and
development and demonstration facilities to encourage applications of solar technologies.

Second National Communication of Maldives to the United Nations Framework Convention on Climate Change115
10
Water Solutions

10. Constraints, Gaps, Financial and Technical Capacity Needs 116
10. Constraints, Gaps, Financial and Technical Capacity Needs
10.1 Data availability and quality Unavailability and the quality of data within sectors was one of the barriers flagged during the stakeholders meeting and encountered during the preparation of the report.
For the preparation of the GHG inventory, significant uncertainty lies within the activity data and emission factors. Data collected by some of the sectors were not systematically recorded or some of the parameters required for the GHG calculations were not collected. Maldives currently do not have specific emission factors. Energy sector being the most emission intensive, grid emission factors are lacking. Efforts are currently underway to establish grid emission factors and same needs to be carried for other sectors. In addition, the current energy balances do not provide sufficient information of fuel usage especially in the marine and land transport sector. The current figures are based on highly estimated values. Significant improvement needs to be done to assess the fuel usage in the transport sector to improve the GHG emissions. Data on usage of electricity production and consumption were poorly recorded at some of the powerhouses.
In-depth vulnerability assessment is a key aspect to
address the vulnerability. However, for the in-depth assessment, various challenges were encountered in data collection. In-situ and historical data were not available to the degree anticipated. Historically recorded data was not digitally available and were incomplete. Sectoral data such health, fisheries and agriculture for vulnerability assessment were not available at the required temporal and spatial scales.
10.1.1 Constraints and gapsSome of the key constraints identified in data availability and quality includes:
• Lack of institutional arrangements for data collection and data sharing
• Lack of local emission factors, in energy, waste and transport sector
• Inconsistent data formats from the same sources and do not provide the necessary information for analysis.
• Lack of proper methods in data acquisition, analysis and management
This chapter provides a synthesis of information on constraints, gaps and related financial technical and capacity need identified in implementing the convention. Consideration here is given in a broader con-text of data quality and uncertainty, technology gaps in adaptation and mitigation, financial needs and capacity building, which were raised across all the sectors. It also considers recommendations on how to address these issues. A brief outline of the financial and technical assistance received for the imple-mentation of the convention is also provided.
Second National Communication of Maldives to the United Nations Framework Convention on Climate Change117
10• Lack of means for data quality control• Lack of local emission factors to be used in the
GHG emissions calculations• Reluctance by the private sector in provision
of their data as it is collected on a commercial basis
• Lack of the necessary infrastructure for collection of data such as atmospheric and oceanic data, coastal and geomorphological changes etc.
10.1.2 Capacity building needsFollowing capacity building needs were identified to address the data availability and quality enhancement gaps.
• Establish and regulate a system for collection of the data needed for GHG inventory establishment, possibly via the MEA and MEE.
• Enhance the availability and reliability of the power production data from the private sector
• Provision of training to the respective staff involved in data handling and analysis
• Establish institutional arrangement for data sharing among various stakeholders with understanding of provision of mutual benefits
• Establishment of necessary infrastructure for data collection by the respective institutions
• Establishment of networks and collaborations with national, regional and international hubs for exchange of data and information
10.2 Adaptation and Mitigation Technology GapsAdaptive and mitigation capacity can vary depending on the availability and access to technology in all the sectors. For proper implementation of the existing policies and strategies feasible and sustainable technology for coastal defense systems, early warning systems, water and sanitation systems, irrigation technologies, food processing and preservation technologies etc, would be needed. Mitigation technologies such as use of energy efficient transportation technologies are needed for the transformation of the transport sector to a greener and sustainable sector. However, lack of appropriate adaptive and mitigation technologies and lack of financial resources has impeded the efforts made for adaptation and mitigation.
10.2.1 Constraints and gapsMajor capacity constraints identified are:
• High transition cost involved in the required transition from the existing technologies to novel technologies
• Limited affordable and reliable technology options for renewable energy technologies in power production and transport sector
• Lack of know-how and confidence in using the existing and newer technologies by the public and private sector
• Limited means to access the financial resources needed and to secure the investment guarantee
10.2.2 Capacity building needsTo address these major technology transfer gaps, include:
• Evaluation of the currently used technologies to the local environment and local needs
• Establish a legal, regulatory and institutional framework for coordination of technology transfer and enforcement
• Support and enhance the existing national institutions including the academia to develop wide range of technical, business management and regulatory skills
• Increase the awareness among the public and private institutions on the costs and benefits of using novel technologies
• Provision of financial incentives and other mechanisms to promote the accessibility and affordability to new technologies
• Increase the role of existing financial institutions to provide affordable financial schemes

10. Constraints, Gaps, Financial and Technical Capacity Needs 118
10
10.3 Institutional and Individual CapacityFor a successful implementation of the convention, the capacity of the individuals and the respective institutions needs to be enhanced. With the availability of the necessary technology and finance, enhancing the capacity of the individuals and the institutions is necessary for effective and efficient implementation of programs and projects for mainstreaming climate change risks into national development.
10.3.1 Constraints and gapsMajor capacity constraints identified are:
• Shortage of skilled and professional staff in various institutions among the stakeholders
• Insufficient information and technical know-how of climate change mainstreaming into planning
• Weak inter sectoral coordination• Over lapping mandates among institutions
10.3.2 Capacity building needsKey capacity building needs identified to address the institutional and individual capacity includes:
• Establish a multi-agency institutional framework to address the diverse cross-cutting nature of climate change
• Establish an institutional mechanism for coordination, exchange of information and data among the public institutions and private sector
• Strengthen the academic and training institutions and review the curriculum
• Review of the institutional policies to retain the skilled personnel in various institutions
• Provision of focused training to enhance the technical capacity of the existing staff for data collection, analysis and research
Mihaaru

Second National Communication of Maldives to the United Nations Framework Convention on Climate Change119
10
10.4 Financial and Technical Assistance ReceivedFinancial and technical assistance were provided by various donors for, assessments and implementation of various activities to address climate change. Some of these are through the established channels through the convention and bilateral means. Some of the key assistance received are outlined in Table 10–1.
Project Funding Source Implementation date Finance (USD)
Maldives Climate Change Trust Fund World Bank, European Union and Australia 2012 – 2015 9,239,406
Increasing climate resilience through an Integrated Water Resource Management Programme in HA. Ihavandhoo, ADh. Mahibadhoo and GDh. Gadhdhoo Island
Adaptation Fund 2011 – 2015 8,989,225
Integrating climate risk in resilient island planning Least Developed Countries Fund 2010 - 2015 4,850,000
Preparation of Second National Communication Global Environmental Facility 2012 – 2015 480,000
Strengthening low carbon energy island strategies Global Environmental Facility 2014 – ongoing 3,885,000
Maldives Environment Management Project World Bank, International Development Assistance 2008 – 2014 13,800,000
Clean energy for climate mitigation project – Phase 2 World Bank 2013- 2014 618,004
Low Emission Climate Resilient Development Danish Government 2012 - ongoing 9,217,000
Support for Climate Neutrality German Government 2010 – 2015 4,047,000
Scaling up of Renewable Energy Program Climate Investment Fund, WB, ADB, IDB, EIB, JFJCM 2012 to on going 137,684,000
Table 10-1: Key financial assistance received to address the climate change issues

10. Constraints, Gaps, Financial and Technical Capacity Needs 120
10
Ahmed Shan Fareed

Second National Communication of Maldives to the United Nations Framework Convention on Climate Change121
A
Water Solutions

Annex A. References 122
Annex A. ReferencesADRC (2005). Report on the Assessment of Early Warning Systems in the Maldives,. Asian Disaster Reduction
Center.
Ali, M. and Manik, M. H. (1989). Sea Level Rise: A Coral Atoll Perspective on Terrestrial Environment and Marine Resources.
Anderson, R. C. (1992). North-south variation in the distribution of fishes in the Maldives. Rasain, 12: 210–226.
Anderson, R. C., Adam, M. S., Kitchen-Wheeler, A.-M. and Stevens, G. (2011). Extent and economic value of manta ray watching in Maldives. Tourism in Marine Environments, 7: 15–27.
Anderson, R. C. and Baldock, M. (2001). New records of birds from the Maldives, with notes on other species. Forktail: 67–74.
Ash, J. and Shafeeg, A. (1994). Birds of the Maldive Islands, Indian Ocean. Forktail, 10: 3–32.
Bernstein, L., Peter Bosch, Osvaldo Canziani, Zhenlin Chen, Renate Christ, Ogunlade Davidson, William Har, Saleemul Huq, David Karoly, Vladimir Kattsov, Zbigniew Kundzewicz, Jian Liu, Ulrike Lohman, Martin Manning, Taroh Matsuno, Bettina Menne, Bert Metz, Monirul Mirza, Neville Nicholls, Leonard Nurse, Rajendra Pachauri, Jean Palutikof, Martin Parry, Dahe Qin, Nijavalli Ravindranath, Andy Reisinger, Jiawen Ren, Keywan Riahi, Cynthia Rosenzweig, Matilde Rusticucci, Stephen Schneider, Youba Sokona, Susan Solomon, Peter Stott, Ronald Stouffer, Taishi Sugiyama, Rob Swart, Dennis Tirpak, Coleen Vogel, Gary Yohe and Lenny Bernstein (2007). Climate Change 2007: Sythensis Report. Contribution of Working Groups I, II and III to the Fourth Assessment Report of the Intergovernmental Panel on Climate Change. In: Climate Change 2007 Synthesis Report 2007. p.104 pp.
Bhat, M. G., Bhatta, R. and Shumais, M. (2011). User-based Financing of Marine Protection in the Maldives. Working Paper-South Asian Network for Development and Environmental Economics (SANDEE).
Biribo, N. and Woodroffe, C. (2013). Historical area and shoreline changes of reef islands around Tarawa Atoll, Kiribati. Sustainability Science, 8: 345–62.
Boehlert, G. and Genin, A. (1987). A review of the effects of seamounts on biological processes. In: Seamounts, Islands and Atolls. Geophysical Monograph (Keating, B., Fryer, P., Batiza, R., Boehlert, G. (Eds.),). American Geophysical Union, Washington. pp.319–344.
Cagua, E. F., Collins, N., Hancock, J. and Rees, R. (2014). Whale shark economics: a valuation of wildlife tourism in South Ari Atoll, Maldives. PeerJ, 2: e515. Christensen, J. H., Hewitson, B., Busuioc, A., Chen, A., Gao, X., Held, I., Jones, R., Kolli, R. K., Kwon, W.-T., Laprise, R., Rueda, V. M., Mearns, L., Menéndez, C. G., Räisänen, J., Rinke, A., Sarr, A. and Whetton, P. (2007). Regional climate projections. In: Climate Change 2007: The Physical Science Basis. Contribution of Working Group I to the Fourth Assessment Report of the Intergovernmental Panel on Climate Change, (S. Solomon, D. Qin, M. Manning, Z. Chen, M. Marquis, K.B. Averyt, M. Tignor and H.L. Miller, Eds.,). Cambridge University Press, Cambridge,

Second National Communication of Maldives to the United Nations Framework Convention on Climate Change123
AUK.
Das, R., Granat, L., Leck, C., Praveen, P. and Rodhe, H. (2011). Chemical composition of rainwater at Maldives Climate Observatory at Hanimaadhoo (MCOH). Atmospheric Chemistry and Physics, 11: 3743–3755.
De’ath, G., Lough, J. M. and Fabricius, K. E. (2009). Declining coral calcification on the Great Barrier Reef. Science, 323: 116–119.
DNP (2008). Detailed Island Risk Assessment in Maldives. Malé, Maldives: Department of National Planning and United Nations Development Programme.
DNP (2010). Statistical Archive of Maldives. Department of National Planning, Ministry of Finance and Treasury.
Easterling, W., Aggarwal, P., Batima, P., Brander, K., Bruinsma, J., Erda, L., Howden, M., Soussana, J.-F., Schmidhuber, J. and Tubiello, F. (2007). Food, fibre, and forest products. In: Climate Change 2007: Impacts, Adaptation and Vulnerability. Contribution of Working Group II to the Fourth Assessment Report of the Intergovernmental Panel on Climate Change (M.L. Parry, O.F. Canziani, J.P. Palutikof, P.J. van der Linden and C.E. Hanson, Eds.). Cambridge University Press, Cambridge, UK. pp.273–313.
Edwards, A., Guest, J., Shafir, S., Fisk, D., Gomez, E., Rinkevich, B., Heyward, A., Omori, M., Iwao, K., Dizon, R., Morse, A., Boch, C., Job, S., Bongiorni, L., Levy, G. and Shaish, L. (2010). Reef Rehabilitation manual (Edwards, A.J. (ed.)). The Coral Reef Targeted Research & Capacity Building for Management Program.
Edwards, A. J. (1989). The implications of sea level rise for the Republic of the Maldives, Part IV, Commomwealth Secretariat, London. London.
Edwards, A. J., Clark, S., Zahir, H., Rajasuriya, A., Naseer, A. and Rubens, J. (2001). Coral bleaching and mortality on artificial and natural reefs in Maldives in 1998, sea surface temperature anomalies and initial recovery. Marine Pollution Bulletin, 42: 7–15.
EPA (2012). Water Sector Brief on Maldives. In: OIC Water Conference. Istanbul Turkey: Environment Protection Agency.
ERC (2008). National solid waste managment policy for the Republic of Maldives. Environment Research Center.
Faber, J. and Brinke, L. (2011). The inclusion of aviation in the EU Emissions Trading System: an economic and environmental assessment. International Centre for Trade and Sustainable Development.
Fabry, V. J., Seibel, B. A., Feely, R. A. and Orr, J. C. (2008). Impacts of ocean acidification on marine fauna and ecosystem processes. ICES Journal of Marine Science: Journal du Conseil, 65: 414–432.
Falkland, T. (2001). Integrated Water Resources Management and Sustainable Sanitation for Four Islands, Republic of Maldives. Maldives Water and Sanitation Authority (MWSA) and UNICEF.
Falkland, T. (2002). Tropical island hydrology and water resources: current knowledge and future needs. In: Hydrology and water resources management in the humid tropics. March 1992. In: UNESCO-IHP-V technical documents in hydrology no. 52. Paris: UNESCO. p.239.
Gagnon, A. S., Bush, A. B. G. and Smoyer-Tomic, K. E. (2001). Dengue epidemics and the El Niño Southern Oscillation. , 39: 35–43.
Haveeru (2011). E-coli found in water tanks in Maldives. 2011. <http://www.haveeru.com.mv/english/details/36817. Accessed 22 August 2011.
Hoegh-Guldberg (2005). Low coral cover in a high-CO2 world. Journal Of Geophysical Research 110, C09S06.
HPA (2016a). SIDAS – SEARO Integrated Data Analysis System. Health Protection Agency, Maldives.

Annex A. References 124
AHPA (2016b). Vital Registration System. Health Protection Agency, Maldives.
Husny, M. M. (2013). The Threshold Framework of Human Development and Island Stability in the Maldives. Master’s Degree Thesis. Melbourne, Victoria: University of Melbourne.
ICTSD (2010). International Transport, Climate Change and Trade What are the Options for Regulating Emissions from Aviation and Shipping and what will be their Impact on Trade? International Center for Trade and Sustainable Development.
IPCC (2001). Climate Change 2001, The Scientific Basis. In: Contribution of Working Group I to the Third Assessment Report of the Intergovernmental Panel on Climate Change (JT Houghton, Y Ding, DJ Griggs, N Noguer, PJ van der Linden, X Dai, K Maskell, and CA Johnson (eds)). Cambridge University Press, Cambridge United Kingdom and New York, NY, USA.
IT power India Pvt. Ltd (2007). Feasibility study: Small scale Waste to Energy incineration. Environment Research Center.
Jacobson, M. Z. (2005). Studying ocean acidification with conservative, stable numerical schemes for nonequilibrium air‐ocean exchange and ocean equilibrium chemistry. Journal of Geophysical Research: Atmospheres, 110.
Jameel, A. (2007). A Model to Integrate the Management of Hazards and Disasters in the National Sustainable Development Planning of the Maldives. University of Canterbury.
JICA (2009). Feasibility study for application of photovoltaic power on Male’ and Hulhumale’ islands in Republic of Maldives - Final Report. Japan International Coorperation Agency.
JICA (1992). Japan International Cooperation Agency 1992, The Development Study on the Seawall Construction Project for Malé island in the Maldives.
Kench, P. S. (2011). Maldives Encyclopedia of Modern Coral Reefs D. Hopley (ed.). Encyclopedia of Modern Coral Reefs: 1236 p.
Kench, P. S., Brander, R. W., Parnell, K. E. and McLean, R. F. (2006). Wave energy gradients across a Maldivian atoll: Implications for island geomorphology. Geomorphology, 81: 1–17.
Kench, P. S., McLean, R. F. and Nichol, S. L. (2005). New model of reef-island evolution: Maldives, Indian Ocean. Geology, 33: 145–148.
Khaleel, Z. (2015). Status of JCM in Maldives and JFJCM project.
Kleypas, J. A., Buddemeier, R. W., Eakin, C. M., Gattuso, J. P., Guinotte, J., Hoegh‐Guldberg, O., Iglesias‐Prieto, R., Jokiel, P. L., Langdon, C. and Skirving, W. (2005). Comment on ‘Coral reef calcification and climate change: the effect of ocean warming’. Geophysical Research Letters, 32.
Lan, K.-W., Evans, K. and Lee, M.-A. (2012). Effects of climate variability on the distribution and fishing conditions of yellowfin tuna (Thunnus albacares) in the western Indian Ocean. Climatic Change, 119: 63–77.
Lasagna, R., Albertelli, G., Colantoni, P., Morri, C. and Bianchi, C. N. (2009). Ecological stages of Maldivian reefs after the coral mass mortality of 1998. Facies, 56: 1–11.
Lehodey, P., Bertignac, M., Hampton, J., Lewis, A. and Picaut, J. (1997). El Nino Southern Oscillation and tuna in the western Pacific. Nature, 389: 715–718.
Manik (1990). Changes in the Topography of the Maldives.
Martin, R. A. and Hakeem, A. A. A. (2006). Development of a sustainable shark diving ecotourism industry in

Second National Communication of Maldives to the United Nations Framework Convention on Climate Change125
Athe Maldives: Challenges and opportunities. Maldives Marine Research Bulletin, 8: 1–53.
MCS (2010). Total imports 2010. Maldives Custom Service.
MCS (2011). Total imports 2011. Maldives Custom Service.
MCS (2012). Total imports 2012. Maldives Custom Service.
MCS (2013). Total imports 2013. Maldives Custom Service.
MEA (2014). Maldives Energy Supply & Demand Survey 2010 - 2012. Maldives Energy Authority. http://www.energy.gov.mv/v1/wp-content/files/downloads/Maldives_Energy_Supply__Demand_Survey_2010_-_2012.pdf.
MED (2013). Maldives Economic Diversification strategy,. Ministry of Economic Development.
MEE (2015a). Development of high-resolution regional climate model for the Maldives: Intergrating climate change risk into resilient island planning in the Maldives project. Ministry of Environment and Energy.
MEE (2015b). Fifth National Report of Maldives to the Covention on Biological Diversity. Maldives: Ministry of Environment and Energy, Maldives.
MEE (2012a). Formulation of Guidelines for Climate Resilient Coastal Protection in Maldives - Report 8 - Final Guidelines. Ministry of Environment and Energy and United Nations Development Programme.
MEE (2014a). Guidance Manual for Climate Risk Resilient Coastal Protection in the Maldives. Ministry of Environment and Energy.
MEE (2015c). Maldives Energy strategy and initiatives.
MEE (2014b). Maldives Low Carbon Development Strategy. Ministry of Environment and Energy.
MEE (2012b). Maldives SREP investment plan 2013-2017. Ministry of Environment and Energy.
MEE (2015d). Survey of Climate Change Adaptation Measures in Maldives. Malé, Maldives: Ministry of Housing and Environment.
MEE (2002). The National Biodiversity Strategy and Action Plan.
MEEW (2006). Climate Change Vunerability and Adaptation Assessment of the Land and Beaches of Maldives. In: Technical Papers to Maldives National Adaptation Plan of Action for Climate Change. Malé, Maldives: Ministry of Environment Energy and Water.
MEEW (2007). National Adaptation Plan of Action (NAPA). Ministry of Environment, Energy and Water.
MCS (2010). Total imports 2010. Maldives Custom Service.
MCS (2011). Total imports 2011. Maldives Custom Service.
MCS (2012). Total imports 2012. Maldives Custom Service.
MCS (2013). Total imports 2013. Maldives Custom Service.
MEA (2014). Maldives Energy Supply & Demand Survey 2010 - 2012. Maldives Energy Authority. http://www.energy.gov.mv/v1/wp-content/files/downloads/Maldives_Energy_Supply__Demand_Survey_2010_-_2012.pdf.
MED (2013). Maldives Economic Diversification strategy,. Ministry of Economic Development.
MEE (2015a). Development of high-resolution regional climate model for the Maldives: Intergrating climate change risk into resilient island planning in the Maldives project. Ministry of Environment and Energy.

Annex A. References 126
AMEE (2015b). Fifth National Report of Maldives to the Covention on Biological Diversity. Maldives: Ministry of
Environment and Energy, Maldives.
MEE (2012a). Formulation of Guidelines for Climate Resilient Coastal Protection in Maldives - Report 8 - Final Guidelines. Ministry of Environment and Energy and United Nations Development Programme.
MEE (2014a). Guidance Manual for Climate Risk Resilient Coastal Protection in the Maldives. Ministry of Environment and Energy.
MEE (2015c). Maldives Energy strategy and initiatives.
MEE (2014b). Maldives Low Carbon Development Strategy. Ministry of Environment and Energy.
MEE (2012b). Maldives SREP investment plan 2013-2017. Ministry of Environment and Energy.
MEE (2015d). Survey of Climate Change Adaptation Measures in Maldives. Malé, Maldives: Ministry of Housing and Environment.
MEE (2002). The National Biodiversity Strategy and Action Plan.
MEEW (2006). Climate Change Vunerability and Adaptation Assessment of the Land and Beaches of Maldives. In: Technical Papers to Maldives National Adaptation Plan of Action for Climate Change. Malé, Maldives: Ministry of Environment Energy and Water.
MEEW (2007). National Adaptation Plan of Action (NAPA). Ministry of Environment, Energy and Water.
MPND (2002). Groundwater Investigation in South and North Atolls, Maldives, Regional Development Project-Phase 1 (2000 and 2001). Ministry of Planning and National Development, Government of Maldives.
MRC (1998). Coral Bleaching in the Maldives - survey carried out in the North and South Malé Atolls. Marine Research Section and Environment Research Unit.
Mumby, P. J., Elliott, I. A., Eakin, C. M., Skirving, W., Paris, C. B., Edwards, H. J., Enríquez, S., Iglesias‐Prieto, R., Cherubin, L. M. and Stevens, J. R. (2011). Reserve design for uncertain responses of coral reefs to climate change. Ecology Letters, 14: 132–140.
MWSA (2008). Consolidation Report on Groundwater Studies in Maldives, 1998 – 2007,. Maldives Water and Sanitation Authority, Government of Maldives.
MWSA (2005). Rainwater harvesting and its safety in Maldives: A pilot study conducted in Laamu atoll Gan, Maldives-2005, Male’: Maldives Water and Sanitation Authority Maldives. Maldives Water and Sanitation Authority.
Naseer, A. and Hatcher, B. G. (2004). Inventory of the Maldives coral reefs using morphometrics generated from Landsat ETM+ imagery. Coral Reefs, 23: 161–168.
NBS (2016). Consumer Price Index (on-line). http://statisticsmaldives.gov.mv/cpi/. Accessed 10 March 2016.
NBS (2015a). Maldives Population and Housing Census 2014; Statistical Release: 1 Population and Households. National Bureau of Statistics, Ministry of Finance and Treasury.
NBS (2015b). Maldives population and housing census 2014: Statistical release IV; employment.
NBS (2015c). Statistical Yearbook 2015. Nationa Bureau of Statistics, Ministry of Finance and Treasury.
NDMC (2007). Joint Rapid Assessment Report on Sea Swells affected Areas, conducted by Government of Maldives-UN-IFRC. National Disaster Management Center.
NIE (2014). Science in the National Curriculum. Maldives: National Institute of Education.
Second National Communication of Maldives to the United Nations Framework Convention on Climate Change127
ANOAA NOAA Coral Reef Watch (on-line). http://coralreefwatch.noaa.gov/satellite/index.php. Accessed 22
March 2016.
NREL (2003a). Solar resource assessment for Sri Lanka and Maldives. National Renewable Energy Laboratory.
NREL (2003b). Wind energy resource atlas of Sri Lanka and the Maldives. National Renewable Energy Laboratory (NREL), Golden, CO.
Orr, J., Fabry VJ, Aumont O, Bopp L, Doney SC, Feely RA, Gnanadesikan A, Gruber N, Ishida A, Joos F, Key RM, Lindsay K, Maier-Reimer E, Matear R, Monfray P, Mouchet A, Najjar RG, Plattner G-K, Rodgers KB, Sabine CL, Sarmiento JL, Schlitzer R, Slater RD, Totterdall IJ, Weirig M-F, Yamanaka Y and Yool A (2005). Anthropogenic ocean acidification over the twenty-first century and its impact on calcifying organisms. Nature, 437: 681–686.
Owen, A., Kruijsen, J., Turner, N. and KerryWright (2011). Marine Energy in the Maldives. Pre-feasibility report on Scottish Support for Maldives Marine Energy Implementation. Robert Gordon University.
Parry, M. L., Canziani, O. F., Jean P Palutikof and Co-authors (2007). Technical Summary. In: Climate Change 2007: Impacts, Adaptation and Vulnerability. Contribution of Working Group II to the Fourth Assessment Report of the Intergovernmental Panel on Climate Change, M.L. Parry, O.F. Canziani, J.P. Palutikof, P.J. van der Linden and C.E. Hanson, Eds.,. Cambridge University Press, Cambridge, UK.
Parthasarathy, B., Munot, A. A. and Kothawale, D. R. (1994). Droughts over homogeneous regions of India: 1871–1990. Drought Network News, 6: 17–19.
Perch-Nielsen, S. L. (2008). Climate change and tourism intertwined.
Pernetta, C. J. (1991). Cities on Oceanic Islands: A case study of Male’, the Captial of the Republic of Maldives. In: Impact of sea level rise on Cities and Regions, Proceedings of the first annual international meeting: ‘Cities on Water’, 11-13 December 1989, Venice.
Pichon, M. and Benzoni, F. (2007). Taxonomic re-appraisal of zooxanthellate Scleractinian Corals in the Maldive Archipelago. Zootaxa, 1441: 21–33.
Pillai, C. S. and Scheer, G. (1976). Report on the stony corals from the Maldive Archipelago.
Raven, J., Caldeira, K., Elderfield, H., Hoegh-Guldberg, O., Liss, P., Riebesell, U., Shepherd, J., Turley, C. and Watson, A. (2005). Ocean acidification due to increasing atmospheric carbon dioxide. The Royal Society.
Rayner, N., Parker, D. E., Horton, E., Folland, C., Alexander, L., Rowell, D., Kent, E. and Kaplan, A. (2003). Global analyses of sea surface temperature, sea ice, and night marine air temperature since the late nineteenth century. Journal of Geophysical Research: Atmospheres, 108.
Riebesell, U., Zondervan, I., Bost, B., Tortell, P. D., Zeebe, R. E. and Morel, M. M. (2000). Reduced calcification of marine plankton in response to increased atmospheric CO2. Nature, 407: 364–367.
Riyaz, M., Shareef, M. and Elder, D. (1998). Coral Bleaching Event: Republic of Maldives, May 1998.
Rosen, B. R. (1971). The distribution of reef coral genera in the Indian Ocean. In: pp.263–300.
Saleem, A. and Nileysha, A. (2011). Characteristics, status and need for conservation of mangrove ecosystems in the Republic of Maldives, Indian Ocean. Journal of the National Science Foundation of Sri Lanka, 31.
Schnieder, S. H., Semenov, S., Patwardhan, A., Burton, I., Magadza, C. H. D., Oppenheimer, M., Pittock, B., Rahman, A., Smith, J. B., Suarez, A. and Yamin, F. (2007). Assessing key vulnerabilities and the risk from climate change. In: Climate Change 2007: Impacts, Adaptation and Vulnerability. Contribution of Working Group II to the Fourth Assessment Report of the Intergovernmental Panel on Climate Change (M.L. Parry, O.F. Canziani, J.P. Palutikof, P.J. van der Linden and C.E. Hanson, Eds.). Cambridge

Annex A. References 128
AUniversity Press, Cambridge, UK,. pp.779–810.
Scott, D., Amelung, B., Becken, S., Ceron, J.-P., Dubois, G., Gössling, S., Peeters, P. and Simpson, M. C. (2008). Climate change and tourism: Responding to global challenges. Madrid, Spain: World Tourism Organization and the United Nations Environment Programme.
Shabau, I. (2006). Food fuel crisis and climate change in the Maldives, A small Island State Perspective. Ministry of Fisheries and Agriculture, Government of Maldives.
Sheppard, C. R. (1987). Coral species of the Indian Ocean and adjacent seas: a synonymized compilation and some regional distribution patterns.
Sinan, H. (2011). Background report of fishery products: The Maldives. Ministry of Fisheries and Agriculture, Government of Maldives.
Sinan, H. and Whitmarsh, D. (2010). Wealth-based fisheries management and resource rent capture: An application to the Maldives marine fisheries. Marine Policy, 34: 389–394.
Solomon, S., Qin, D., Manning, M., Chen, Z., Marquis, M., Averyt, K., Tignor, M. M. B. and Miller, H. L. (2007). Climate Change 2007-the physical science basis: Contribution of Working Group I to the Fourth Assessment Report of the Intergovernmental Panel on Climate Change. Cambridge University Press.
Uehara, H. and O’Connell, P. (2011). Ocean Thermal Energy Conversion for the Republic of the Maldives. SIDSDOCK and GEC Co. Ltd.
Ulstrup, K. E., Berkelmans, R., Ralph, P. J. and Van Oppen, M. J. H. (2006). Variation in bleaching sensitivity of two coral species across a latitudinal gradient on the Great Barrier Reef: the role of zooxanthellae. Marine Ecology Progress Series, 314: 135–148.
UNDP (2006). Disaster Risk Profile of the Maldives. United Nation Development Programme.
UNDP (2014). Human Development Report 2013, The Rise of the South: Human Progress in a Diverse World. http://hdr.undp.org/sites/default/files/Country-Profiles/MDV.pdf.
UNDP (2013). Success Stories and Lessons Learnt, Employment and Enterprise Development for Women and Youth Project & Support to Integrated Farming Project.
UNEP (2014). Strengthening Low Carbon Energy Island Strategies - GFL/ 4629 , PMS: 788. UNEP.
U.S. Department of Energy (2016). Alternative Fuel Price Report. U.S. Department of Energy. http://www.afdc.energy.gov/fuels/prices.html. Accessed 16 January 2016.
WB, ADB (2005). Maldives Tsunami: Impact and Recovery. Joint Needs Assessment by World Bank-ADB-UN System.
Webb, A. and Kench, P. (2010). The dynamic response of reef islands to sea level rise: Evidence from mutli-decadal analysis of island change in the Central Pacific. Global and Planetary Change, 72: 234–64.
Webb, P. A. (1988). Maldives, People and Environment. Media Transasia.
Westmacott, S., Cesar, H. S. J., Pet-Soede, L. and Lindén, O. (2000). Coral bleaching in the Indian Ocean: Socio-economic assessment of effects. Essays on the Economics of Coral Reefs. HSJ Cesar (ed.): 94–106.
Westmacott, S. and Rijsberman, F. (2000). Cost-effectiveness analysis of coral reef management and protection: a case study of the republic of the Maldives. In: Integrated coastal zone management of coral reefs: decision support modeling (Kent Gustavson, Richard M. Huber, H. Jack Ruitenbeek). World Bank Publications. pp.67–81.
White, I., Falkland, T., Perez, P., Dray, A., Metutera, T., Metai, E. and Overmars, M. (2007). Challenges in

Second National Communication of Maldives to the United Nations Framework Convention on Climate Change129
Afreshwater management in low coral atolls. Journal of Cleaner Production, 15: 1522–1528.
Wilkinson, C. (1998). Status of the coral reefs of the world: 1998.
Zahid (2011). The influence of Asian monsoon variability on precipitation patterns over the Maldives. University of Canterbury.
Zahir, H. H., Allison, W. W., Dews, G. G., Gunn, J. J., Rajasuriya, A. A., Sweatman, H. H. P. A., Solandt, J. L., Thompson, A. A. A., Tamelander, J. J. and Wakeford, M. M. (2006). Post-tsunami status of the coral reefs of the islands and atolls of the Maldives. In: Status of coral reefs in tsunami affected countries: 2005 (Wilkinson CR, Souter D, Goldberg J (eds)). Australian Institute of Marine Science, Townsville. pp.111–123.

Annex B. GHG Inventory 2011 130
A
Greenhouse gas source and sink categories Net CO2 (Gg)
CH4 N2O (Gg) CO (Gg) NOx (Gg) NMVOCs (Gg)
SOx (Gg)
Total National Emissions and Removals 1161.573 2.253 0.054 NE NE NE NE
1 - Energy 1146.512 0.083 0.015 NE NE NE NE
1A - Fuel Combustion Activities 1146.512 0.083 0.015 NE NE NE NE
1A1 - Energy Industries 775.820 0.031 0.006 NE* NE* NE* NE*
1A2 - Manufacturing Industries and Construction (ISIC) IE IE IE NA NA NA NA
1A3 - Transport 260.673 0.039 0.008 NE* NE* NE* NE*
1A4 - Other Sectors 110.019 0.013 0.001 NE* NE* NE* NE*
1A5 - Other NO NO NO NO NO NO NO
1B - Fugitive Emissions from Fuels NO NO NO NO NO NO NO
1B1 - Solid Fuels NO NO NO NO NO NO NO
1B2 - Oil and Natural Gas NO NO NO NO NO NO NO
2 - Industrial Processes NO NO NO NO NO NO NO
2A - Mineral Products NO NO NO NO NO NO NO
2B - Chemical Industry NO NO NO NO NO NO NO
2C - Metal Production NO NO NO NO NO NO NO
2D - Other Production NO NO NA NO NO NO NO
2E - Production of Halocarbons and Sulphur Hexafluoride NA NA NA NO NO NO NO
2F - Consumption of Halocarbons and Sulphur Hexafluo-ride NA NA NA NA NO NO NO
2G - Other (please specify) NO NO NO NO NO NO NO
3 - Solvent and Other Product Use NO NO NO NO NO NO NO
4 - Agriculture NA NE NE NE NE NE NE
4A - Enteric Fermentation NA NE NA NE* NE* NE* NE*
4B - Manure Management NA NE NE NE* NE* NE* NE*
4C - Rice Cultivation NA NO NA NO NO NO NO
4D - Agricultural Soils NA NO NO NO NO NO NO
4E - Prescribed Burning of Savannas NA NO NO NO NO NO NO
4F - Field Burning of Agricultural Residues NA NO NO NO NO NO NO
4G - Other (please specify) NA NO NO NO NO NO NO
5 - Land-Use Change & Forestry NE NE NE NE NE NE NE
5A - Changes in Forest and Other Woody Biomass Stocks NE NA NA NE* NE* NE* NE*
5B - Forest and Grassland Conversion NE NE NE NE* NE* NE* NE*
5C - Abandonment of Managed Lands NE NA NA NE* NE* NE* NE*
5D - CO2 Emissions and Removals from Soil NO NA NO NE* NE* NE* NE*
5E - Other (please specify) NO NO NO NO NO NO NO
Annex B. GHG Inventory 2011

Second National Communication of Maldives to the United Nations Framework Convention on Climate Change131
A6 - Waste 15.060 2.170 0.039 0.000 NE NE NE
6A - Solid Waste Disposal on Land NA NO NA NO NO NO NO
6B - Wastewater Handling NA NE NE NE* NE* NE* NE*
6C - Waste Incineration 15.060 2.170 0.039 NE* NE* NE* NE*
6D - Other (please specify) NO NO NO NO NO NO NO
7 - Other (please specify) NO NO NO NO NO NO NO
Memo Items
International Bunkers 400.277 0.003 0.011 NE NE NE NE
1A3a1 - International Aviation 400.277 0.003 0.011 NE* NE* NE* NE*
1A3d1 - International Marine (Bunkers) NE NE NE NE* NE* NE* NE*
Multilateral operations NO NO NO NA NA NA NA
CO2 emissions from biomass NE NA NA NA NA NA NA
Greenhouse gas source and sink categories HFC PFC SF6
HFC-23 (Gg) HFC-134 (Gg) Other (Gg-CO2)
CF4 (Gg) C2F6 (Gg) Other (Gg-CO2)
SF6 (Gg)
• Total National Emissions and Removals NE** NE** NE** NO NO NO NO
• 1 - Energy NA NA NA NA NA NA NA
• 1A - Fuel Combustion Activities NA NA NA NA NA NA NA
• 1A1 - Energy Industries NA NA NA NA NA NA NA
• 1A2 - Manufacturing Industries and Construction (ISIC) NA NA NA NA NA NA NA
• 1A3 - Transport NA NA NA NA NA NA NA
• 1A4 - Other Sectors NA NA NA NA NA NA NA
• 1A5 - Other NA NA NA NA NA NA NA
• 1B - Fugitive Emissions from Fuels NA NA NA NA NA NA NA
• 1B1 - Solid Fuels NA NA NA NA NA NA NA
• 1B2 - Oil and Natural Gas NA NA NA NA NA NA NA
2 - Industrial Processes NE** NE** NE** NO NO NO NO
2A - Mineral Products NA NA NA NA NA NA NA
2B - Chemical Industry NA NA NA NA NA NA NA
2C - Metal Production NO NO NO NO NO NO NO
2D - Other Production NA NA NA NA NA NA NA
2E - Production of Halocarbons and Sulphur Hexafluoride NO NO NO NO NO NO NO
2F - Consumption of Halocarbons and Sulphur Hexafluoride NE** NE** NE** NO NO NO NO
2G - Other (please specify) NA NA NA NA NA NA NA
3 - Solvent and Other Product Use NA NA NA NA NA NA NA
4 - Agriculture NA NA NA NA NA NA NA
4A - Enteric Fermentation NA NA NA NA NA NA NA
4B - Manure Management NA NA NA NA NA NA NA
4C - Rice Cultivation NA NA NA NA NA NA NA
4D - Agricultural Soils NA NA NA NA NA NA NA
4E - Prescribed Burning of Savannas NA NA NA NA NA NA NA

Annex B. GHG Inventory 2011 132
A 4F - Field Burning of Agricultural Residues NA NA NA NA NA NA NA
4G - Other (please specify) NA NA NA NA NA NA NA
5 - Land-Use Change & Forestry NA NA NA NA NA NA NA
5A - Changes in Forest and Other Woody Biomass Stocks NA NA NA NA NA NA NA
5B - Forest and Grassland Conversion NA NA NA NA NA NA NA
5C - Abandonment of Managed Lands NA NA NA NA NA NA NA
5D - CO2 Emissions and Removals from Soil NA NA NA NA NA NA NA
5E - Other (please specify) NA NA NA NA NA NA NA
6 - Waste NA NA NA NA NA NA NA
6A - Solid Waste Disposal on Land NA NA NA NA NA NA NA
6B - Wastewater Handling NA NA NA NA NA NA NA
6C - Waste Incineration NA NA NA NA NA NA NA
6D - Other (please specify) NA NA NA NA NA NA NA
7 - Other (please specify) NA NA NA NA NA NA NA
Documentation boxIE - Fuel combustion for Manufacturing Industries are mostly associated with fisheries industry and thus it is included under other sector/fisheries
NE* - not included for tier 1 methodology
NE - Data not available for these estimation and is assumed to be small.
NE** - HFC gases introduced as part of replacing HCFC, however national-wide replacement started post 2011 thus is not estimated for that year
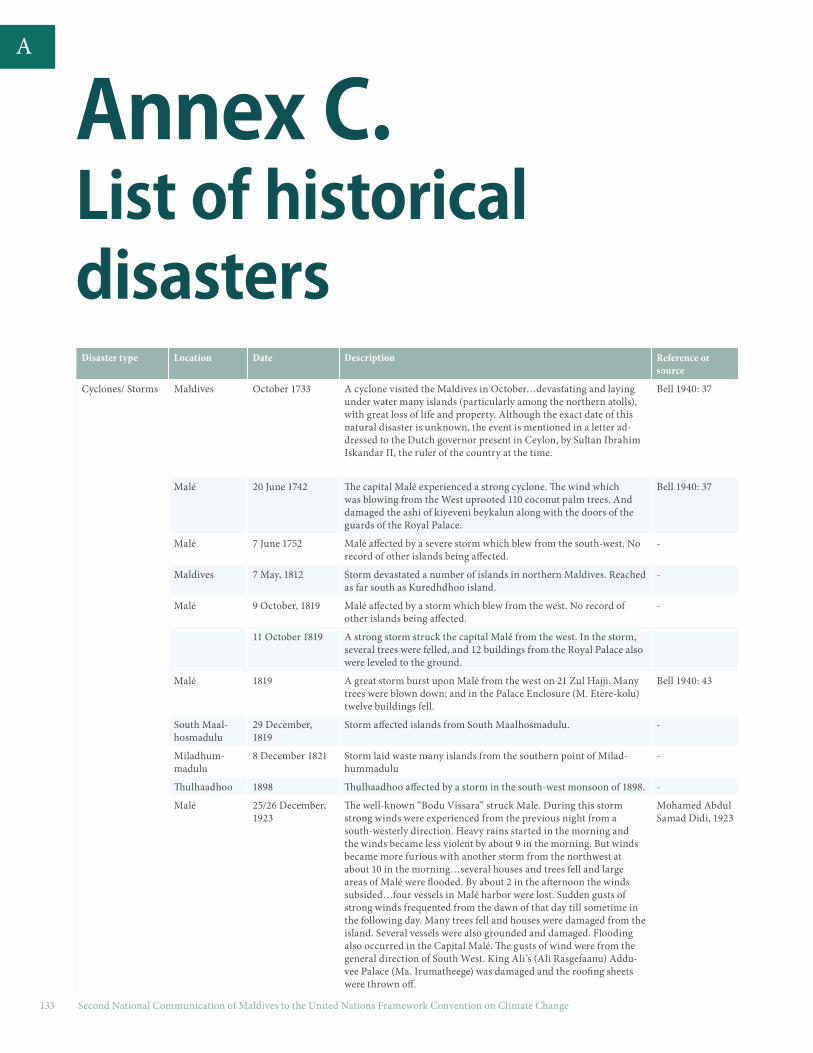
Second National Communication of Maldives to the United Nations Framework Convention on Climate Change133
A
Annex C. List of historical disasters
Disaster type Location Date Description Reference or source
Cyclones/ Storms Maldives October 1733 A cyclone visited the Maldives in October…devastating and laying under water many islands (particularly among the northern atolls), with great loss of life and property. Although the exact date of this natural disaster is unknown, the event is mentioned in a letter ad-dressed to the Dutch governor present in Ceylon, by Sultan Ibrahim Iskandar II, the ruler of the country at the time.
Bell 1940: 37
Malé 20 June 1742 The capital Malé experienced a strong cyclone. The wind which was blowing from the West uprooted 110 coconut palm trees. And damaged the ashi of kiyeveni beykalun along with the doors of the guards of the Royal Palace.
Bell 1940: 37
Malé 7 June 1752 Malé affected by a severe storm which blew from the south-west. No record of other islands being affected.
-
Maldives 7 May, 1812 Storm devastated a number of islands in northern Maldives. Reached as far south as Kuredhdhoo island.
-
Malé 9 October, 1819 Malé affected by a storm which blew from the west. No record of other islands being affected.
-
11 October 1819 A strong storm struck the capital Malé from the west. In the storm, several trees were felled, and 12 buildings from the Royal Palace also were leveled to the ground.
Malé 1819 A great storm burst upon Malé from the west on 21 Zul Hajji. Many trees were blown down; and in the Palace Enclosure (M. Etere-kolu) twelve buildings fell.
Bell 1940: 43
South Maal-hosmadulu
29 December, 1819
Storm affected islands from South Maalhosmadulu. -
Miladhum-madulu
8 December 1821 Storm laid waste many islands from the southern point of Milad-hummadulu
-
Thulhaadhoo 1898 Thulhaadhoo affected by a storm in the south-west monsoon of 1898. -
Malé 25/26 December, 1923
The well-known “Bodu Vissara” struck Male. During this storm strong winds were experienced from the previous night from a south-westerly direction. Heavy rains started in the morning and the winds became less violent by about 9 in the morning. But winds became more furious with another storm from the northwest at about 10 in the morning…several houses and trees fell and large areas of Malé were flooded. By about 2 in the afternoon the winds subsided…four vessels in Malé harbor were lost. Sudden gusts of strong winds frequented from the dawn of that day till sometime in the following day. Many trees fell and houses were damaged from the island. Several vessels were also grounded and damaged. Flooding also occurred in the Capital Malé. The gusts of wind were from the general direction of South West. King Ali’s (Ali Rasgefaanu) Addu-vee Palace (Ma. Irumatheege) was damaged and the roofing sheets were thrown off.
Mohamed Abdul Samad Didi, 1923

Annex C. List of historical disasters 134
AMany islands 9 January 1955 Large storm occurred in the northern atolls of the country. As a
direct result of the storm, several islands were damaged, and some islands “falhun aanuge thoshi levi” (a natural sea-wall created), and surprising changes were seen in the islands. The most damage was to be found in Shaviyani, Noonu, and Raa. Atolls..
Hijree Saadha vana Saththa ah balaalumeh 1986: 58
Miladhum-madulu
9 January 1955 Storm laid waste many islands from the southern point of Milad-hummadulu.
-
23 June 1987 A large number of islands affected by what Maniku (1990) refers to as freak storms. 4 islands in Faaf Atoll, 5 islads in Dhaal Atoll, 8 islands in Gaafu-Alif Atoll, 7 islands in Gaaf-Dhaal Atoll
-
25 June 1987 A large number of islands affected by what Maniku (1990) refers to as freak storms. Impacted islands include: 2 islands in Haa-Dhaal Atoll, 1 island in Alif Atoll, 2 islands in Vaavu Atoll, 2 islands in Faaf Atoll, 2 islands in Dhaal Atoll, 2 islands is Laamu Atoll, 8 islands in Gaaf-Dhaal Atoll, 1(and only) island in Gnaviyani Atoll, 6 islands in Seenu Atoll
-
Maldives 30 May 1991 Storm causes damage throughout Maldives including damage to 4081 houses in 13 atolls, with 23,849 people being forced to evacuate their homes and a total of 36,000 altogether affected by the storm. This represented 13% if all the houses in the country (based on the 1990 census). The total cost of damage was estimated to be as high as USD 30 million (Reuters News Service, 1991)
Campbell, J, R, 1993.
Waves Maldives 10-12 April 1987 Malé, and several of the country’s islands faced major flooding due to high waves, and suffered massive damages. In all, except for 6 atolls, all the atolls, up to some extent, suffered damages due to the wave. In Malé, 15 houses were badly damaged, and the dhoni’s and other vessels at the South Western harbour were largely damaged. Much of the reclaimed land in southern area was washed away. The Eastern sea wall surrounding the island suffered major damages and was shattered, and stones were flung ashore. The water of the wells was also greatly increased in salinity. There was also serious damage on Hulhule’ and in other inhabited and resort islands in north and south Malé atolls. It is estimated that the total costs exceeded MVR 90 million (Edwards 1989).
Haveeru News: 11 April 1987, 12 April 1987 and Aafathis News: 12 April 1987, 13 April 1987, Edwards 1989
June and Septem-ber 1987
The country again was faced with storm surges. Many of the agricul-tural fields were inundated by seawater and some causeways linking islands were badly damaged.
June and July 1988 Number of islands stretching from Haa Dhaalu atoll to the island of Gan in the south (especially the islands in the western side of the Maldives) was affected due to flooding caused by waves. Thulhaad-hoo was worst high and faced inundation caused by high waves (2-2.5m high) and lost several meters of beach.
Islands in the south
Tornados Malé 1742 A Tornado struck Malé from West, and more than 110 coconut trees were laid down
Bell 1940: 37
30 December, 1819 or 1820
A tornado occurred in the country. Many islands of Thiladhum-mathi, Miladummadulu Atolls, and one or two in Malosmadulu were devastated and more than 30 odifaharu wrecked and many people drowned. It has been described in the history books as follows. The islands from Thiladhunmathi to some islands of Miladhunmadulu experienced heavy rains. The wind speeds were fast, and the wave crests were high. More than 30 vessels were damaged and lost, and numerous members of their crew went missing. The islands which suffered damages during the rains are: Hirubadhoo, Magoodhoo, Maakandoodhoo, Milandhoo, Narudhoo, Rinbidhoo, Kurend-hoo, Nalandhoo, Madidhoo, Feydhoo, Feevah, Foakaidhoo, Neyo, Noomaraa, Maavaidhoo, Goidhoo, Kanditheemu, Kakai-ariyadhoo, Vaikaradhoo, Nookurendhoo, Kattalafushi, Nellaidhoo, Naavaid-hoo, Hirinaidhoo, Mu-iri, Kuninbi, Keylakunu, Maakumundhoo, Kulhudhuffushi, Kunburudhoo, Nolhivaram and Hirimaradhoo.
Dhivehi Thaa-reekh 1991
Earthquakes Malé 1729 Much of Henvareu ward of Malé was destroyed by fire and an earth-quake was felt throughout the islands.
Bell, 1940:36
Malé 1 August 1729 Destructive earthquake occurred in the east Bell, 1940:36
12 March 1730 Destructive earthquake occurred in the east Bell, 1940:36

Second National Communication of Maldives to the United Nations Framework Convention on Climate Change135
A 21 September
1730Earthquake Bell, 1940:36
29 September 1730
Earthquake Bell, 1940:36
October 1730 Earthquake Bell, 1940:36
Malé 1759 Male suffered a double visitation. A great conflagration in Henveru ward destroyed “Danna Mohammad Miskit” (mosque) and another mosque, besides the whole of the bazaars. This disaster was preceded by an earthquake
Bell, 1940:40
Malé 15 December 1759 The capital Malé and several other islands experienced a large earthquake. While this incident has been noted down in history, the names of the other islands which experienced this earthquake was not recorded.
Dhivehi Thaa-reekh, 1981:204; Bell, 1940:39
2 September, 1815 It has been documented that at some time on the afternoon, a loud sound was heard, along with the islands shaking within the islands from Thiladhunmathi to Feevah. It was reported that this earth-quake stopped in a while.
(Dhivehi Thaareekh 1991, Pg.278, Bell 1940, Pg.42)
4 September 1815 Between the times of Magrib and Isha prayer (approximately between 6-7 pm), a loud sound was said to have been heard, and an earthquake reported to have occurred. The sound was said to have lasted for approximately an hour. The said earthquake was described as being violent enough that lighted oil lamps within the houses could be falling any minute. This incident struck fear into the hearts of the people
(Dhivehi Thaareekh 1991, Pg.278, Bell 1940, Pg.42)
Epidemics Maldives Late 16th century Epidemics of something like smallpox, from which many people died, occurred every 10 years.
United Nations Conference on Trade and De-velopment, 1983: Annex 8
Maldives 1704 Smallpox United Nations Conference on Trade and Devel-opment
Malé October/Novem-ber, 1922
“No less than 300 victims, Noble and plebian alike, perished from this scourge at Malé.”….”the dread ‘Maldive gift-fever’ (a type of deadly “Influenza” notorious for centuries past)…”
Bell 1940: 06
- 1965 Gastro-enteritis. United Nations Conference on Trade and Devel-opment, 1983
- 1966 Typhoid epidemic United Nations Conference on Trade and Devel-opment, 1983
- 1968 Diarrhea epidemic United Nations Conference on Trade and Devel-opment, 1983
Malé 1978-1979 Major outbreak of cholera occurred in Malé. 11258 people were af-fected representing 7.5% of population. Cases were reported on over 50 islands. Fatalities totalled 219 (in 1978).
United Nations Conference on Trade and Devel-opment, 1983
Malé 1982 Major outbreak of shigella occurred in Malé Interview notes
Famine Malé 1737 That year [A.H. 1152 (A.C. 1739)] a famine occurred at Malé. One kotte (28 lbs) of cowries would hardly purchase 12 seers of rice. People were reduced to eating leaves and even weeds.
Bell 1940: 37
Islands 1818-1819 A great famine occurred at the islands in A.H. 1234 (A.C. 1818-19) which reduced people to eating grass.
Bell 1940: 43
Huvarafushi and kulhud-huffushi
1920 The inhabitants of two islands (Huvarafuri in Lhavandifulu Atoll, and Kuludufuri in Tiladummati Atoll) were driven to the same straits [of eating grass, as in the “famine” of 1818-19]
(Cyclone Sessional Paper XV,1921, p48) Bell, 1940:43

Annex C. List of historical disasters 136
AFire Malé 1704-1721 “During this reign [of S. Muzaffar Mohammad ‘Imad-ud-din 11]
several disastrous fires destroyed important residences at Malé.”Bell, 1940:36
Malé 1729 “…much of Henvaru Avaru (Ward) of Malé was destroyed by fire…” Bell, 1940:36
Malé 1735 “on the night of 25th Rabi-ul-Akhir, A.H 1148 (A.C 1735) another serious fire occurred; this time at Kuda Kiba the apartments of the Quees.”
Bell, 1940:37
Malé 1742 The tornado was followed a fortnight later by a great fire in Henveiru Avaru, in which many buildings were burnt down including the Attarafanin Miskit (Mosque).
Bell, 1940:37
N. Himiti island
1772 “All houses except one in Himiti Island (N. Nilande Atoll) were burnt down the next year [1772]
Bell, 1940:40
Malé 3 February, 1887 On Malé there was a major fire in which “all merchant shops and some of the Maldivians houses and other shops burnt down, also shops and houses belonging to the government.”
United Nations Conference on Trade and De-velopment, 1983: Annex 8

Second National Communication of Maldives to the United Nations Framework Convention on Climate Change137
A
Annex D. Vulnerability and Adaptation Assessment Methodology- Coastal Vulnerability
Erosion and changes in sea level rise were used as the main indicators of coastal vulnerability. Analysis of shoreline change, island topography and inundation
modelling were used for assessing the respective indicators.
Shoreline change analysisThe aerial images of 2008, 2004 and 1969, for the case study islands, were processed with the Geographic Information System (GIS) software ArcGIS version 10.0. The aerial images were initially mounted on ArcGIS and geo-rectified; with the WGS 84 coordinate system and projected to UTM N43. In order to locate these images geographically on the exact space, control points were identified and then placed on a geographic system. The 2008 aerial images were rectified to the coordinate system, as 2008 images are much recent and could be much accurately geographically positioned. The baseline established from geographically positioned 2008 images was then used to geo-rectify historical images of 2004 and 1969 respectively.
Following the geo-rectification process, the islands were digitized and the Digital Shoreline Analysis System (DSAS) tool version 4.0 in ArcGIS was used to calculate the Net Shoreline Movement (NSM) and End Point Rate (EPR) or erosion rate of the islands. The DSAS tool calculates the shoreline change, movement statistics and rate of movement of shoreline, against a baseline, the 1969 vegetation line in this assessment. The interval spacing for transects in this study was 50 meters as the island size is small, thus the rate of change could be accurately determined with smaller spacing. Along the shoreline of the island, at 50 m interval several transect lines were drawn radiating from the baseline (normally vegetation line of either 2004 or 1969).
Digital Elevation Modelling and sea level inundation modelling The topographical analysis of the island was assessed using automatic leveling techniques and total stations. Elevations with GPS coordinates were recorded with respect to the mean sea level. The island topography is represented by a Digital Elevation Model (DEM) constructed in the ArcGIS software. However, in some of the islands, island elevation data were sourced from secondary sources.
The prepared DEM was used as a baseline, for inundation
modelling. The IPCC, AR4 sea level rise projections were utilized for this inundation models. The three scenarios selected are the best case scenario (B1), middle range scenario (A1B) and worst case scenario (A2). The island of Hithadhoo and Bandos is projected for sea level inundation with respect to these scenarios on top of the water level at Highest Astronomical Tide (HAT) (Table 9–3).

Annex D. Vulnerability and Adaptation Assessment Methodology- Coastal Vulnerability 138
A
Scenario HAT (m) AR4 projections (m) Sea level projection used in the analysis
Sea level projection used in the analysis
B1 scenarioLower
0.624544
0.18 0.80
Upper 0.38 1.00
A1B scenarioLower 0.21 0.83
Upper 0.48 1.10
A2 scenarioLower 0.23 0.85
Upper 0.51 1.13
Table A: Parameters used for the inundation modelling
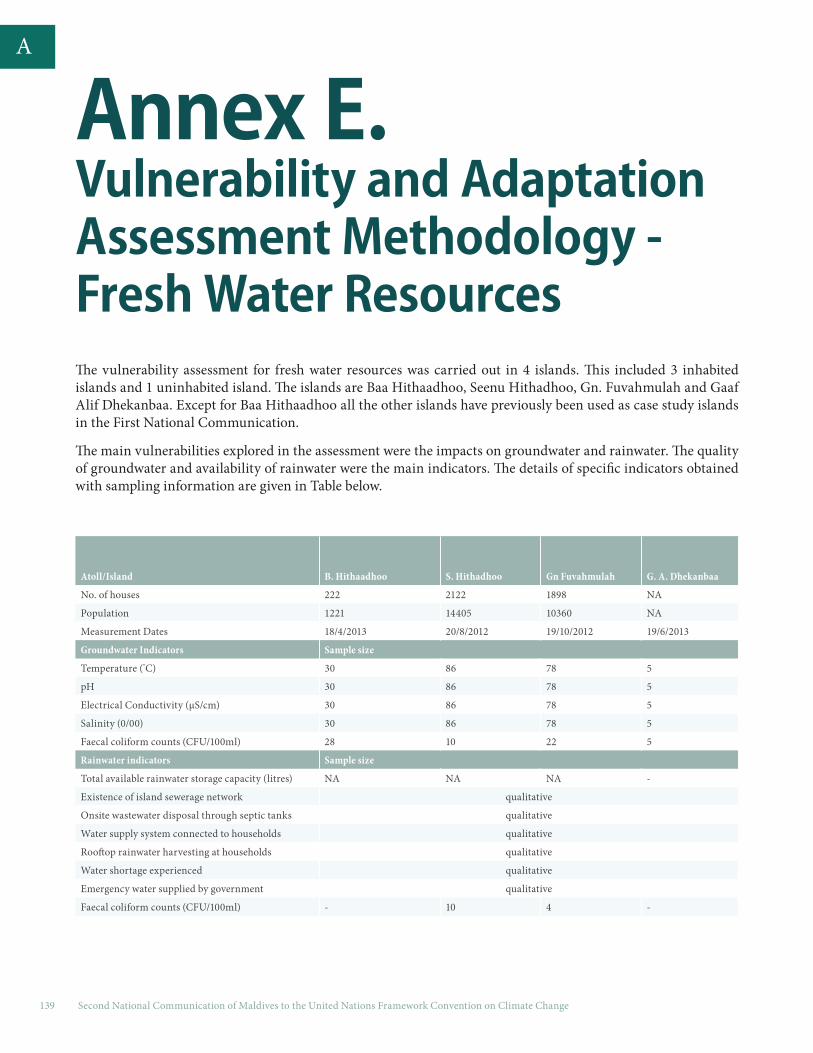
Second National Communication of Maldives to the United Nations Framework Convention on Climate Change139
A
Annex E. Vulnerability and Adaptation Assessment Methodology - Fresh Water ResourcesThe vulnerability assessment for fresh water resources was carried out in 4 islands. This included 3 inhabited islands and 1 uninhabited island. The islands are Baa Hithaadhoo, Seenu Hithadhoo, Gn. Fuvahmulah and Gaaf Alif Dhekanbaa. Except for Baa Hithaadhoo all the other islands have previously been used as case study islands in the First National Communication.
The main vulnerabilities explored in the assessment were the impacts on groundwater and rainwater. The quality of groundwater and availability of rainwater were the main indicators. The details of specific indicators obtained with sampling information are given in Table below.
Atoll/Island B. Hithaadhoo S. Hithadhoo Gn Fuvahmulah G. A. Dhekanbaa
No. of houses 222 2122 1898 NA
Population 1221 14405 10360 NA
Measurement Dates 18/4/2013 20/8/2012 19/10/2012 19/6/2013
Groundwater Indicators Sample size
Temperature (°C) 30 86 78 5
pH 30 86 78 5
Electrical Conductivity (µS/cm) 30 86 78 5
Salinity (0/00) 30 86 78 5
Faecal coliform counts (CFU/100ml) 28 10 22 5
Rainwater indicators Sample size
Total available rainwater storage capacity (litres) NA NA NA -
Existence of island sewerage network qualitative
Onsite wastewater disposal through septic tanks qualitative
Water supply system connected to households qualitative
Rooftop rainwater harvesting at households qualitative
Water shortage experienced qualitative
Emergency water supplied by government qualitative
Faecal coliform counts (CFU/100ml) - 10 4 -

Annex F. Rainfall threshold categories and associated impacts 140
A
Annex F. Rainfall threshold categories and associated impactsRainfall thresholds used to identifying flood related impacts.
Rainfall threshold (mm) Possible impacts associated with rainfall
50-70 Puddles on road, flooding in low houses, occasional minor damage to household goods
70-110 Moderate flooding in low houses; minor damage to household items, damage to household crops, tempo-rary (minor to moderate) disruptions to socio-economic functions for less than 24 hours
110-150 Widespread flooding on roads and low lying areas. Moderate damage to household goods, disruptions to socio-economic functions for more than 24 hours.
150-175Widespread flooding on roads, low areas and houses. Moderate damage to household goods, backyard crops, disruption to socio economic functions for more than 24 hours, gullies created along shoreline, possible damage to road and harbour infrastructure.
175-200 Widespread flooding around the island. Major damages to household goods, schools closed, businesses closed, damage to crops, damage to road infrastructure, sewerage network and quay wall.
200+Widespread flooding around the island. Extensive damages to household goods and housing structure, schools, businesses, damage to crops, damage to road infrastructure, sewerage network and quay wall and erosion
Second National Communication of Maldives to the United Nations Framework Convention on Climate Change141
A
Annex G. Bleaching Risk Assessment Tool (BRAT)The bleaching risk assessment tool (BRAT) was developed by University of Queensland for a project administered by World Bank through Climate Change Trust Fund established by European Union for Maldives aiming to assist Maldives adaptation efforts to climate change. BRAT applies remote sensing monitoring and decision tools for to address coral reef vulnerability to thermal stress across the Maldives as a consequence of climate change. The idea is to assist in national level evaluation of impacts of future bleaching events with identification of high and low risk bleaching areas so that better planning for marine areas are established.
Key aspect of BRAT is the identification of thermal stress regimes for the Maldives using justification and methodology described by Mumby et al. (2011). Sea surface temperature anomaly database of NOAA Coral Reef from 1982-2010 (29 year period) was used to distinguish and classify sites (4x4 km pixels) according to their history chronic versus acute thermal stress. Chronic stress represents regular and ambient maximum seasonal temperature to which corals are acclimated (Ulstrup et al., 2006) and varies markedly at scales of hundreds of kilometres whereas acute stress occurs during bleaching events and develops over weeks to months and may vary dramatically at local scales of kilometres because it is influenced by local hydrodynamics (Figure A). Chronic and acute stress measures were divided independently into terciles (thirds) and pixels at the extremes of each stress measure (i.e. upper and lower tercile) were used to generate four contrasting thermal stress regimes (FigureB).
Corals in regime A are predicted to be the most resistant coral communities to current bleaching. They are acclimated to warmer temperatures, but experience relatively lower levels of acute stress. Corals in regime B may have some natural resistance to bleaching conditions by virtue of their acclimation to high chronic temperature, but their exposure to acute warming during bleaching events is likely to cause significant mortality. Corals in regime C are predicted to benefit from a lack of severe bleaching events but their acclimation to cooler conditions is likely to increase their vulnerability to even weak periods of rapid warming. Finally, corals in regime D are predicted to experience relatively severe mortality because they are acclimated to cooler chronic temperatures, but are exposed to high acute stress likely resulting in severe bleaching.
It is difficult to assess how corals within each of the four stress regimes (A,B,C,D) will respond to future acute stress events (bleaching) and remains hypothetical (Mumby et al., 2011). Application of BRAT can be used to establish a link between response and regimes. Sites (pixels) can be identified within each of the four regimes, and corals within specific regime can monitored before, during and after future bleaching events to enable testing and refinement of some of the proposed hypotheses. With time, and continuous monitoring of reefs across the different thermal stress regimes allowing for broad scale analysis may reveal patterns of national relevance.

Annex G. Bleaching Risk Assessment Tool (BRAT) 142
A
Figure A: Chronic and acute stress is mapped for pixels with reef habitat. The lower and upper third values are used to build thermal stress regimes (from BRAT at http://www.marinespatialecologylab.org/brat/)
Figure B: Thermal stress regimes are defined by dividing both chronic (SST) and acute (DHW) stress into terciles. Pixels at the extremes of each stress measure (upper and lower tercile) were used to generate four contrasting thermal stress regimes, labelled: A (l low acute, high chronic); B (high acute, high chronic); C (low acute, low chronic); and D (high acute, low chronic).
