ministry of education and ministry of industry and
TRANSCRIPT
MINISTRY OF EDUCATION AND
TRAINING MINISTRY OF INDUSTRY AND
TRADE
NATIONAL RESEARCH INSTITUTE OF MECHANICAL ENGINEERING
LE VAN THOAI
RESEARCH EFFECTS OF SOME TECHNOLOGICAL PARAMETERS OF
SUBMERGED ARC WELDING WITH ADDITIONAL METAL POWDER ON THE WELDING QUALITY
MAJOR: MECHANICAL ENGINEERING
CODE No: 62.52.01.03
PHD THESIS ON MECHANICAL ENGINEERING
SCIENCE INSTRUCTOR: 1. Phd. Hoang Van Chau 2. Phd. Nguyen Ha Tuan
HaNoi – 2018

1
INTRODUCTION 1. Necessary of project Welding technology is one of the basic technologies that are widely used in industrial production. It allows to product many different types of structures such as: steel frame, beams, truss, shipbuilding industry ... or manufacturing of high load, high pressure structures such as boiler, condenser etc. by various materials such as carbon steel or alloy steel. Due to continuous development of the mechanical industries, the demand for fabrication of steel structures and welding products in our country is immense to meet the requirements of infrastructure construction for the new industry. Submerged arc welding with additional metal powder is advanced welding technology, high productivity, and good quality but not widely applied in production. The main reason is the lack of basic research on the nature and optimization of technological regime, the lack of basic conditions such as materials and equipment, the establishment of a set of technological processes standard to apply to production. Therefore, the research project "RESEARCH EFFECTS OF SOME TECHNOLOGICAL PARAMETERS OF SUBMERGED ARC WELDING WITH ADDITIONAL METAL POWDER ON THE WELDING QUALITY" is very necessary for our country. 2. Research propose of the thesis - Study on the influence of main welding parameters and the rate of additional metal powder to the welding quality of carbon steel. - Establish mathematical relationship between the mechanical properties of the weld and the main welding parameters, including welding current (Ih), welding speed (Vh) and the additional metal powder rate (N). 3. Object of research Study on one-sided V-shaped carbon steel butt weld by the submerged arc welding with additional metal powder. 4. Methodology of research Research method has combined theory and experiment - Theory: Analyze and synthesize the theoretical basis the submerged arc welding with additional metal powder. - Experiment: A combination of Taguchi methods for measuring, analyzing and analyzing influence factors, constructing regression models, calculating the optimum parameters, and experimenting at the same time. Verification to verify the effectiveness, reliability of the method, empirical data and regression models from which the scientific basis for the construction of the submerged arc welding with additional metal powder to apply in practice. 5. Scientific and practical significance of thesis Scientific significance - Present a relationship between welding parameters including Ih, Vh, N with welding properties in the form of mathematical functions which are the basis functions for constructing the submerged arc welding procedure with additional metal powder. - Indicate influence of the main welding parameters, rate of added metal powder to the welding quality such as the weld shape and size, welding microstructure, welding mechanical properties and productivity of welding process. - Provide a simple approach to determine the optimal domain of multiple simultaneous criteria of welding quality. - Analysis of variance to determine the combination of the three parameters Ih, Vh, N to achieve the highest mechanical properties in the surveyed domain and quantify the impact of these parameters on the mechanical properties of welds. - Use the least squares regression tool to establish the mathematical relationship between Ih, Vh, N with the mechanical criteria of the weld. Thereby their influences are analyzed. This is a basis for

2
making parameters of the welding process.. Practical significance: - Suggest a set of technological parameters including (Ih, Vh, N) for the submerged arc welding with additional metal powder to weld carbon steel structure with the highest quality. - Evaluate the tendency and the influence of the technological parameters on the welding mechanical properties as a basis for adjusting the welding parameters to satisfy the requirements. 6. New points of thesis - Synthesis of theoretical basis of the submerged arc welding technology with additional metal powder to study the application in manufacturing products in our country. - Apply the submerged arc welding with additional metal powder to manufacture mechanical products. - Compare the microstructures of the welding joints between submerged arc welding with additional metal powder and conventional submerged arc welding to construct a basis for evaluating weld quality. - Construct a regression function to express the simultaneous influence of the parameters (Ih, Vh, N) on the objective function as the mechanical properties of the weld. - Use the OEC overall rating to find the appropriate level of technological parameters that simultaneously meet multiple welding goals.. 7. Content and research results of thesis Introduction Chapter 1: OVERVIEW OF SUBMERGED ARC WELDING TECHNOLOGY WITH ADDITIONAL METAL POWDER Chapter 2: BUILDING THE EXPERIMENTAL MODEL Chapter 3: BASIC THEORY ON SUBMERGED ARC WELDING WITH ADDITIONAL METAL POWDERS Chapter 4: EXPERIMENTAL RESULT AND DISCUSSION Conclusions References List of publications Appendix
CHAPTER 1. OVERVIEW OF SUBMERGED ARC WELDING TECHNOLOGY WITH ADDITIONAL METAL POWDER
1.1. Research situation on submerged arc welding (SAW) and SAW technology with additional metal powder on the world. Submerged arc welding (SAW) is an advanced welding technology for high productivity, good welding quality and is used in manufacturing large steel structures in the field of installation, shipbuilding, thermal power, oil and gas, etc. The researches on SAW technology are diverse and comprehensive including studies on theoretical basis, technological characteristics, process parameters, equipment, materials, productivity ... etc.
SAW technology with added metal powder is developed based on SAW technology to increase welding productivity, ensuring the requirements of structural quality without using too much welded wire. In addition to technological elements such as SAW, the rate and type of metal additions have a great influence on the mechanical, microstructure and welding power. To assess the impact of technological parameters as well as the additional metal particles to above criteria, there are many studies of the authors in the world such as the study of Phillip D. T; J.Tusek; Bailey N; Sachchida Nand; Chandel R. S and colleagues. The authors have studied the influence of rate, power type and supported additional metal method on mechanical properties, microstructure, heat-affected area, welding yield, etc. From the analysis and evaluation results of those studies, it shows that: - The addition of metal powder increases yield of fillings, increases welding capacity up to 60%, reduces the number of welded layers by up to 50%, improving the efficiency of arc energy in welding process, fine microstructure, improved welding properties, reduced HAZ area, and reduced welding

3
deformation. With the good alloying effect of the powdered metal, the use of additional metal powders can produce welds or coatings with required chemical elements. - The main focus of the study was to investigate the effect of additional metal powder and heat input on the yield and quality of the welded joint under the powdered layer with added metal powders and without with added metal powders [30, 31, 52, 57] but have not determined the suitability of the technical parameters to achieve good welding quality as well as not establishing the relationship between the input parameters to the criteria. On the other hand, the technological parameters in the research works are not detail and inadequate. So the application of this technology to reality in our country still faces many difficulties. 1.2. Research and application situation of SAW technology with additional metal powder in mechanical engineering in Vietnam. In our country before the 80s, the industry developed very slowly and much lower than other countries in the world, the products made by welding mainly using common welding technology such as manual arc welding, gas welding... low productivity, quality is limited. By the end of the 1980s, a number of advanced welding technologies (SAW, GMAW ..) began to be applied to the manufacture of welding products and are increasingly being used in more widespread applications. The research in our country mainly focus on developing technology and production of welding materials ... to effectively apply advanced welding technologies in production and reduce import costs. Specifically, the Ministry of Science and Technology and the Ministry of Science and Technology projects have the code: Science-Technology: 242.07RD / HD-KHCN (2007), KC.02.04 / 11-15, KHCN 05- 05 by the Corporation Motors and Agricultural Machinery, Research Institute of Mechanics under the Ministry of Industry and Trade. The result of the above projects have to create welding material with Aluminate-rutile slag (AR), to design the production line of sintered welding flux to submerged arc welding with the base of slag from the main substance ( CaO + MgO), Al2O3, CaF2, TiO2, determine the reasonable technology parameters for welded joints with V shape using the low alloy steel plate 10mm and 20mm thick with added metal powders and evaluation of the efficiency of using additional metal powders increases the welding yield by up to 100% while the power output increases only by 15-20% when welding with manganese wires with welding ceramic flux. Studies have also shown that in order to avoid slag inclusion, undercut, metal welds with welding currents need to increase 100-200A compared to conventional SAW technology. There are also a number of doctoral dissertations in the country, such as Dr. Ngo Huu Manh, study on the effects of additional metal powders to improve the corrosion resistance of fill layers when Plasma weld with additional metal powders. The research results of these topics have important theoretical and practical significance in the field of research and production of welding materials. However, these studies are still incomplete. In addition to setting up the welding technology parameters based on the test results of the experimental test tensile strength, we also need to check and evaluate other quality characteristics such as microstructure, impact strength, bending strength of the weld. On the other hand, the study does not deal with the relationship between the welding parameters, the metal particles and the quality characteristics of the weld to facilitate the extensive research and application of the technology. According to find out at some companies in the Hung Yen province, the authors find: The application of SAW technology with added metal powder to manufacture steel structures is not common. Part of this problem is that there are no comprehensive research or difficult to invest in technology equipment. Thus, in order to deploy the application of SAW technology with added metal powders into product and manufacture the welding products in our country, it is necessary to invest fully research, detail the influence of factors as well as the interaction between the technological parameters and added metal powders to the quality of the welded joint. It is a basis for the design and development of technological processes. This material is suitable for SAW technology with additional metal powders. 1.3. Research scope of thesis According to above analysis, this thesis includes some constents as follows:

4
+ Research, synthesis of theoretical basis for the submerged arc welding technology with additional metal powders. + Apply the experiment of the technology for low carbon steel (SS400), 20mm thick steel plate and welded V-shaped butt joint, one side with solder: HJ431-GB / T5293-1999, welded wire: AWS. 17.EL12, diameter 3.2 mm and metal particle addition: W40.29 of HOGANAS - Sweden to evaluate the influence of some major welding technology parameters such as (Ih, Vh) and ratio metal addition (N) to welding quality. The welding parameters set to meet the requirements of mechanical properties of welding. + Analyze and validate the together influence of the technological parameters (Ih, Vh, N) and find out the suitability to satisfy many of the mechanical objectives of the weld. + Establish the regression relation between the parameters (Ih, Vh, N) with the mechanical properties of the weld and evaluate their influence tendency to the targets. Creates a mathematical basis for the design of technological parameters for SAW welding with added metal powders.
Conclusion for chapter 1 Through the analysis and evaluation of domestic and foreign research results on advanced welding technology, some conclusions are draw as follows: + SAW technology has been thoroughly researched on materials, techniques and technological parameters that affect the productivity and quality of welding joints. For SAW technology with added metal powders, there is not much the research works and mainly focus on studying the effect of type and ratio of supplement metal powder, heat input to productivity and quality of welding joints that have not built the relationship of the technological parameters with the addition of metal powder to the quality of welding joint so the application to the production is limited + SAW technology has a number of advantages than that of the conventional SAW technology such as: high productivity and many characteristics of welding joints are improved. Analyzing, synthesizing the theoretical basis and studying the effect, building the relationship between the technological parameters and welding quality when performing submerged arc welding with additional metal powder are needed. + The objectives and scope of the thesis have been defined. Wherein the focus of the thesis is to synthesize the theoretical basis and study the influence of technological parameters on welding quality in submerged arc welding with additional metal powder as the basis for building technological processes to apply in fact production.
CHAPTER 2. BASIC THEORY ON SUBMERGED ARC WELDING
WITH ADDITIONAL METAL POWDERS
2.1. Overview on submerged arc welding technology (SAW). 2.1.1. Principles, characteristics, scope of application + Principles: Submerged arc welding is a welding process which the arc forms between the welded wire and welded sample, the generated heat by arc melts the weld wire, base metal and weld flux. In welding process, weld wire is pushed into the arc area by a special mechanism at a consistent speed with its flow rate. According to the displacement of the arc heat source, the weld metal is cooled and crystallized to form of weld joint. Above of weld joint form a slag layer which is involved in the metallurgical process of welding, protecting and keeping heat for welding [12,14]. The principle of submerged arc welding is presented in Figure 2.1 + Characteristics [12]: - Focused arc energy, high-temperature allows to weld with a high-speed and high productivity. High weld quality, metal welding is relatively homogeneous in terms of chemical composition. The surface of the weld is smooth and uniform, less defects such as lack of penetration, porosity and splashing. Reduced consumption of electrodes and electricity + Application range: - Submerged arc welding is usually applied to welding in the welding position with the angle of welding sample <70, the thickness of welding parts from 5 to 100mm.

5
Figure 2.1. Submerged arc welding principle
. 2.1.2. Welding equipment and materials 2.1.2.1. Welding equipment Including: Welding power source, automatic welding head, welding car, spreading and recovering flux elements 2.1.2.2. Welding materials [13,39,44]. Including: welding wire and welding material, determined according to the base metal 2.1.3. Influence of technological factors a) Welding wire angle [12,14]. When the welding wire is tilted towards the welding direction, the arc is directed to the weld pool, the weld penetration depth and weld height increase but the weld width decreases. When tilting the welded wire back to the welding direction causes the arc to point to the base metal more, resulting in increased weld width, reduced weld penetration depth. b) Angle of welding sample To ensure the good shape for weld, the inclination angle of the weld sample has not exceed 80 degrees relative to the horizontal plane [12,14]. c) Type of welding electric [12,14]: including AC currents or DC currents, DC current is easily induced arc, adjustable geometric parameters and good welding speeds. AC currents need no large voltage to adjust arc when the current is changed. c) Size of welding flux powder: certainly influence to fusion level of weld. 2.1.4. Influence of technological parameters 2.1.4.1. Effect of welding currents 12,33. The increase of welding current has made the increase of the heat input. Increases amount of filler materials and used flux, increases welding penetration depth and height and slight increases the welding width. 2.1.4.2. Effect of arc voltage 12,33. Welding voltage is proportional to the length of the arc and affects the width of the weld. When the voltage rises, the weld width and welding consumptions increase but penetration depth reduces. 2.1.4.3. Effect of welding speed 12,33. The welding speed is inversely proportional to the input heat, which is often used to control the width and the thickness of the weld. 2.1.4.4. Effect of electrode cross section 12,33. Electrodes conduct electricity and provide the material needed to fill the groove between the parts to bond it together with the welds. Increasing the electrode diameter increases the arc area and the

6
reduced arc current density increases the weld width, decreases the weld depth and weld height. 2.1.5. Determination of SAW parameters The SAW technology mode parameters are determined by the experimental formula and with each specific welding connection. 2.1.5.1. Technological parameters of butt welding joint [12,17]. - Including: Welding current Ih (A), welding wire diameter d (mm), welding speed Vh (m / h), welding voltage Uh (V), line energy (qđ). These technological parameters are determined by experimental formulas. - h1, b1, c1; h2, b2, c2: is the penetration depth, width and height of the weld when welding the first and the second side.
a) b)
Figure 2.2 . Types of welds a) Butt welding joint; b) Fillet welding joint
2.1.5.2. Technological parameters of fillet weld 12,17. Similar to butt welds, to determine the technological parameters for the fillet weld, It is given parameters of edge welding. 2.1.6. Metallurgical process in SAW The metallurgical process in SAW is determined by the chemical interaction between the gas phase, the slag with the melted metal of the electrode transferred to the welded pool and the liquid metal in welded pool. 2.1. 6.1. Effect of hydrogen on metal welds. Hydrogen source primarily from the moisture of the environment, the moisture of the drug, the dissolution of hydrogen mainly into droplets of liquid metal, the solubility of hydrogen depends on the temperature and the partial pressure of H2 in the gas phase. Hyddro causes welds defects such as air cavity, micro-cracking, rough need to be thoroughly eliminated in the welding process. 2.1.6.2 Effect of oxygen on metal welds. Metals can be interacted directly with oxygen when it is welded under the drug layer. The main source of oxygen is the reaction of the metal in the welded tank with the slag ... The metal oxidation processes in the welded tank include: oxidation of the welded tank by surface oxidation, by moisture in the drug, by the drug contains FeO, by active oxidants. 2.1.6.3. Impact of metal welds with welding slag. Slag is a compound of metal oxide and salt, which is a harmful impurity. In the welding process under the drug layer, the slag is mainly: SiO2, MnO, FeO, Al2O3. SiO2,FeO, TiO2FeO... [13,17], residues in the metal reduce the viscosity and impact strength of the weld. 2.2. Submerged arc welding with additional metal powder. 2.2.1. Principles and characteristics + Principles: Submerged arc welding with additional metal powder, in addition, weld flux is melt to protect welding metal, welding alloy and melting electrolytic supply metal filler for welding groove as normal SAW. The filler metal is also supplied by added metal, the filler performance is so relatively high, which significantly increases the welding efficiency and the alloying efficiency of the added metal [43]. Figure 2.3 introduces the principle of submerged arc welding with additional metal powder.
7
Figure 2.3. Ddiagram of submerged arc welding with additional metal powder
1- Supporting sheet; 2- basic metal; 3- added metal; 4- hopper providing added metal; 5- welding flux; 6- hopper providing welding flux; 7- welding wire; 8- arc; 9- melted slag; 10- welding pool; 11- Weld
+ Characteristics: - Welding performance is higher than that of conventional SAW about 30-60% - Efficient use of arc energy, reduced widths of heat afect zone and fine particle size at HAZ, welded joint has small deformation [30,52,60]. - Reduces the number of welds when welding element has large thickness [30,52]. - Efficient welding alloys from fine metal powders. 2.2.2. Difference to conventional SAW + SAW technology with additional metal, the welds is formed from a combination of three components welding materials, metal additions and basic metals, conventional SAW usually consists of two components are welding materials and basic metals. + SAW with metal addition has a high-grade metal filler. Weld metalization is better due to the metal fillings welded from the supplement metal without moving through the arc into the groove, thus limiting oxidation and the effect of hydrogen. + In SAW with additional metal, the welding current intensity must be higher to provide sufficient hot metal extraction and to ensure deep penetration of the weld [22]. 2.2.3. Influence factors to the melting metal in welding 2.2.3.1. Welded wire arrangement and supplying additional metals.
a) b) c) Figure 2.4. supplying additional metals: a) First wire welding, flux welding;
b) through a tube attached to the electrode; c) parallel with welding wire 2.2.3.2. Influence of welding conditions Including: welding current Ih (A), welding voltage Uh (V), welding wire diameter d (mm), welding speed Vh (m/h), welding power qd (J / cm, KJ / cm) and added metal N (%). In SAW with additional metal, the energy of the arc is usually higher to make melt the supplemented metal. So the welding current is usually higher than that of the conventional SAW from (100-200A) [22]. These parameters also affect to the shape and size of the weld. That is similar to conventional SAW technology, but to varying degrees. As in SAW, there is an additional metal powder due to high filler welding, high welding speed, so the welds are usually narrower and the HAZ area is smaller than that of conventional SAW.

8
2.3. Determine the parameters of SAW technology with additional metals for experimentation From the analysis and evaluation influence of technological parameters, in conjunction with the reference to similar researches [22, 52, 60], the technological parameters of the SAW technology with the added metal are selected as (Ih; Vh; N) to conduct experiments investigating its effect on welding quality.
Conclusions of chapter 2. By studying on the theoretical basis for SAW with additional metal powder, the following
conclusions are drawn + The SAW with additional metal powder is developed base on the SAW technology, is a high-performance welding technology and meets the requirements of quality welding joints. + The SAW technological parameters with added metal powder are determined by the empirical formula of the SAW technology, then adjusted (Ih, Vh) in accordance with the added metal mass to ensure sufficient heat supply for the welding process to avoid defects that exist in the welding joint. + From the analysis of the influence of technological parameters and similar studies, three technological parameters (Ih, Vh, N) were determined to perform SAW with added metal powders. + Hydrogen and oxygen negatively affect to the quality of welding. It reduces the toughness of metal welds, and it is cause of defects (porosity, slag inclusion, cracking…) for the weld. Hydrogen and oxygen generating sources are mainly from welding humidity, welding seams, so the welding process needs to select suitable welding materials and complete treatment before welding such as cleaning the required weld bead to the highest limit the damage of these two gases to the welding process.
CHAPTER 3. BUILDING THE EXPERIMENTAL MODEL 3.1. Equipment and materials for experimentation. 3.1.1. Equipment for experimentation. [12,39]. + SAW with additional metal equipments: using automatic welding equipment under the class "LINCOLN IDEALARC DC600", welding currents up to 1000A, welding wire diameter up to 4mm, as shown in Figure 3.1a. And the metal supplementary equipment is ЧГ Н-009 from Russia, as shown in Figure 3.1b.
a) b) c) Figure 3.1. SAW and providing added metal equipment: a) Lincoln idearc DC600 welding equipment:
b) providing added metal equipment; c) SAW equipment with and added metal for experimentation. 3.1.2. Materials 3.1.2.1. Basic materials for making samples Select low-carbon steel as experimental sample, SS400 steel grade, plate thickness δ = 18-20 mm with chemical and mechanical components being checked at Quality Assurance and Testing Center No. 1 of the General Department of Standardization, as shown in Table 3-1; 3-2.
Table 3-1. Chemical composition of steel (%) C Si Mn Ni Cr V Cu W S P 0,1946 0,868 0,8107 0,0254 0,0276 0,0025 0,0374 0,0035 0,0043 0,028
Table 3-2. The mechanical properties of steel Steel grade σt (N/mm2) σb (N/mm2) δs (%)
SS400 327 473 30 3.1.2 .2. Welding materials, added metal + Welding materials: Using welded wire AWS.17.EL12 with diameter d = 3.2mm and flux HJ431 - GB/ T5293-1999 of Kim Tin Corporation manufacturing, address: 40 Ngo Gia Tu - Duc Giang -

9
Long Bien - Hanoi (Email: [email protected]). + Additional metal: Select added metal powder with grade W40.29 of HOGANAS - Sweden for experimental welding of the sample. The added metal powders are dried at a temperature of 200- 2500C in 2-3 hours before welding. 3.2. Experimental model and experimental conditions 3.2.1. Experimental model: As presented in Figure 3.2
Figure 3.2. Experimental model
Figure 3.3. Structural welding samples for experiments
3.2.2. Experimental conditions. Welding samples at welding practice workshop of Viet Hoa Vocational College in Xuan Hoa - Vinh Phuc, at environmental temperature conditions. Welding joints are made of steel base material of the base metal type and are welded in the welding position. With a welded V-shaped bevelled edge joint dimension 18 x 140 x 300 mm, the pad size is 12 x 80 x 400 mm. Figure 3.5 shows the experimental structure welding [13.52]. The parameters of welding joint and weld size [13]: α = 340, b = 4.5 mm, c = 1.0 mm, e = 24mm, g = 2.0 mm, Fđ = 205mm2, mass of fill metal (wire and added metal) Mđ = 0,483 kg. - From empirical formulas, exploratory experiments and similar studies [11, 22, 30, 52], we determine the level of technological parameters to experiment, as shown in Figure 3.4.
Figure 3.4. Complete welding experiments and the value level of technological parameters for experiment.
3.3. Experimental planning method. Using the Taguchi method and analyzing the results by analyzing the variance (ANOVA)
3.3.1. An overview of Taguchi experimental design methods [4,54] According to the Taguchi method, the combination of factors affecting the target function is
performed through orthogonal arrays (OAs). The experimental results were analyzed by statistical methods using signal-to-noise ratio (S/N). The S/N ratio is the ratio of the mean value of the signal (S) to standard deviation (N). For the purpose of studying three factors (Ih, Vh, N), each element of 3 orthogonal array is L9. + The basic steps of the experimental design with Taguchi method. Step 1: Determine the objective function, the desired value, the elements and their level. Step 2: Select the orthogonal array, run the test conditions and measure the results. Step 3: Data analysis, forecasting, level and quality optimization. Step 4: Experimental verification and action planning for next step. 3.3.2. Analysis of variance ANOVA [4,54] Analysis ANOVA is a statistical technique that allows us to quantify the relative influence of

10
factors and their importance to the objective function, which is used to analyze the influence of factors on the objective function. 3.3.3. Optimize multiple targets and overall rating criteria. (OEC) There are usually four main access groups or are used to optimize simultaneously multiple targets:
1. Approach group relating to surface response methods. 2. Approach group using the desired function or goal. 3. Group using numerical methods. 4. Approach team using Taguchi's sustainable design theory. Experimental results are often analyzed for one criterion at a time, this approach is rough and does
not guarantee that the best obtained design for a criterion is well suited for other criteria. Combining the Taguchi Experimental Design, Roy gave the OEC criteria to represent multiple criteria in the same test, predicting optimal results for each single criterion for The overall OEC rating was adopted as a benchmark for individual criteria. 3.4. Weld quality assessment method. 3.4.1. Steps for welding the sample [43,59]. The process of welding the samples is done according to the technological parameters, as shown in Table 3-3. Table 3-3. Experimental parameters for welding samples.
Experiment No
Sample No
Ih (A)
Vh (m/h)
Added metal rate: N (%)
Layer
1 07 620 17 30 22 08 620 20 40 23 05 620 23,5 45 24 03 670 17 40 25 09 670 20 45 26 12 670 23,5 30 27 02 720 17 45 28 04 720 20 30 29 11 720 23,5 40 2
Figure 3.5. Experimental welding
process
3.4.2. The quality criteria of welding joint [10,27,52] a) Evaluation of the shape and size of the weld: the shape and size of the outer and inner sides by shooting rough organization of the welded joint. b) Evaluation of welding metal organization and HAZ: photographic organization of micro-welding welding; Evaluation of weld chemical composition: Determining for grain level of weld metal organization. c) Mechanical evaluation of welds: including tensile strength, hardness, impact strength and bending strength of the weld. .
a) b) c) d) Figure 3.6. Test samples of welds: a) Test sample of the micro-organism, rough organization;
b) Tensile strength test; c) impact strength test; d) bending strength test.

11
3.4.3. Test equipment The evaluation of the quality parameters of welding and welding joints was carried out at the
Material Destruction Research Center (COMFA) of the Institute of Materials Science (IMS) by specialized testing equipment. Test equipment are includes: + The equipment is used to capture the structure of a rough and microscopic organization: using Axiovert 40 MAT (Calzeii) optical microscope with magnification of 100, 200, 500 .... 1000 times: + Equipment for chemical composition testing: SPECTROTEST và PMI- UV plus + Equipment for impact strength testing: RKP 450/ Zwich (Germany) + Equipment for hardness testing: AVK-CO/ Mitutoyo. + Equipment for bending strength testing: Super L.120/TO Figure 3.7 describes the experimental quality testing equipment:
a) b) c) d) Figure 3.7. The equipment to check the welding joint: a) structure of a rough and microscopic testing;
b) chemical composition testing; c) bending strength testing; d) impact strength testing Conclusions of chapter 3
After studying the contents of the experimental model with automatic welding technology under the drug layer with addedl metal powder, we draw some following conclusions. + From the actual understanding process of the use of steel in the manufacture of products by welding technology, materials have been selected for testing process. Based on that, the welding material (welding wire, welding drug) and the metal particle are suitable for welding samples. + From empirical formulas, exploratory experiments and reference to similar studies. We have determined the value levels of the technological parameters (Ih, Vh, N) conducted experiments. + Select the Taguchi experimental design method and appropriate orthogonal array (L9 array) for the identification of experimental options, and apply the ANOVA variance analysis to quantify the effect and determine the appropriate level and determine a reasonable level of technological parameters to the required mechanical properties. + Selection of appropriate methods and equipment to evaluate the quality characteristics of welding such as shape, size, chemical composition, mechanical properties (durability, hardness, impact strength, etc.). .) of the weld and the rough organization, the microorganism of the welding joint.
CHAPTER 4. EXERIMENTAL RESULT AND DISCUSSION
4.1. Shape and size of weld Shape and size of welding joint are estimated according to AWS D1.1/D1.1M :2010 standard including external and internal size shapes. + External welding shape and size are evaluated by observation of weld profile; welded width and height were measured by using a gauge and rule. Figure 4.1 shows photographs of experimental welding samples.
12
Ih= 620A; Vh= 17m/h; N= 30%; (M. 07)
Ih= 620A; Vh= 20m/h; N= 40%; (M.08)
Ih=720A; Vh= 17m/h; N= 45%; (M.02)
Ih=620A; Vh=23,5m/h; N=45%; (M.05)
Ih= 670A; Vh= 17m/h; N=40%; (M.03)
Ih=720A; Vh= 20m/h; N= 30%; (M.04)
Ih= 670A;Vh= 20m/h; N= 45%; (M.09)
Ih=670A;Vh=23,5m/h; N=30%; (M.12)
Ih=720A; Vh=23,5m/h; N=40%; (MII)
Figure 4.1 Welded joints with different parameters after welding + Table 4-1 indicates measured results of experimental welding samples: width (e), height (g) and penetration depth of backing (h)
Table 4-1 Dimensions of welded sample Sample number
Experimental conditions Weld size Ih (A) V (m/h) N (%) Uh (V) Layers e (mm) g (mm) h (mm)
07 620 17 30 37 2 22,4 1,4 4,0 08 620 20 40 37 2 22,0 1,3 3,0 05 620 23,5 45 37 2 21,2 1,8 2,0 03 670 17 40 38 2 26,5 2,9 2,5 09 670 20 45 38 2 25,2 3,0 0,6 12 670 23,5 30 38 2 23,2 1,9 3,9 02 720 17 45 39 2 27,5 3,0 0,3 04 720 20 30 39 2 26,2 2,9 2,9 11 720 23,5 40 39 2 24,3 2,6 1,8
+ Internal welding shape and size are evaluated by macrostructure of weld joints. Axiovert 40 MAT (Calzeii) equipment were used for ASTM 340-00 testing. Figure 4-2 displays welding macrostructure. From results of the outer appearance of the weld and welding macrostructure shows: - Welds are not undercut, slag inclusion, crack or porosity - Welds are penetrated and don’t appear cracks in welding and heat affect zone as well as other defects in welding metal. - The weld size is basically consistent with allowable standard, the welding height g 3mm. From experimental results, the size and shape of welds satisfied requirements. However, parameters (Ih, Vh, N) differently affect to the size and shape of welds:

13
M07 M08 M05 M03
M09 M12 M02 M04
M11 None of additional metal
Figure 4.2. Welding macrostructure - Welding samples with small Vh, low Ih and low metal addition rates are associated with wider welds, lower height (M07) than those with slower Vh, higher Ih, and larger metal addition rate ( M02; M03). - Welding samples with a welding speed of 20 m / h (M09; M04) have relatively good welded size, (M08) has a narrower weld width due to low Ih. + With the same Vh and different Ih, if N increases then the penetration depth of the welding backing plate decreases even with large Ih (Table 4-1). This demonstrates that arc energy consumption has more on melting additional metal particles. + For case of the same Ih, different Vh, N , the welded joints with slow Vh and smaller N gives deeper penetration of the welding backing plate (M07 4,0mm, M08 3,0mm, M05 1,2mm). The weld for small Ih , smaller N (M07), or welds for small Vh, but larger N, penetration depth of welding backing plate decreases (M02). - As the same Ih and different N, the welds with slower Vh have a larger HAZ width and the weld cross section at the same Ih level is equivalent. At large Ih levels (M02, M04, M11), the weld cross section is larger than the small Ih (M05, M07, M08). With different Ih, same Vh, width of HAZ increases with Ih increases (M02, M04, M11) compared to small Ih cases (M05, M07, M08). - Compared with the HAZ width of the welded joint without additional metal, most of the welded joints with the added metal, HAZ width is smaller, except for the three welded joints with slow Vh with an equivalent HAZ width. This result is consistent with the study in [52,57]. Table 4-2 shows result of measurement HAZ withd of experimental samples.
Table 4-2. HAZ width of welding samples
Samples M05 M07 M08 M03 M09 M12 M02 M04 M11 M.II
HAZ width.(mm)
2,9 3,7 3.2 4,1 3,7 3,3 4,1 3,8 3,4 4,1
4.2. Microstructure of welding samples Microstructure of welding joint is established by ASTM E407- 07 method using Axiovert 40 MAT (Calzeii) equipment. The welding microstructure is listed in Table 4-3
14
Table 4-3. Microstructures at welding and heat affect zone No.
Microstructure Composition of microstructure: weld, HAZ
07
Weld HAZ
-Ih= 620A; Vh= 17m/h;N= 30%; -Weld: acicular ferrite (bright), peclit (dark), and inclusion -HAZ: acicular ferrite (bright), bainit/ peclit (dark)
08
- Ih= 620A;Vh= 20m/h;N= 40%; - Weld: acicular ferrite (bright), peclit (dark), and inclusion - HAZ: acicular ferrite (bright), bainit (dark)
05
Ih= 620A;Vh=23,5m/h;N=45%; -Weld: acicular ferrite (bright), peclit (dark), and inclusion -HAZ: acicular ferrite (bright), bainit (dark)
03
-Ih= 670A; Vh= 17m/h; N=40%; -Weld: acicular ferrite (bright), peclit (dark), carbide and inclusion -HAZ: acicular ferrite (bright), bainit, peclit (dark)
09
-Ih= 670A;Vh= 20m/h;N= 45%; -Weld: acicular ferrite (bright), peclit (dark), and inclusion -HAZ: acicular ferrite (bright), bainit, peclit (dark)
12 -Ih= 670A;Vh=23,5m/h;N=30%; -Weld: acicular ferrite (bright), peclit (dark), and inclusion -HAZ: acicular ferrite (bright), bainit, peclit (dark)
02
-Ih=720A;Vh= 17m/h; N= 45%; -Weld: acicular ferrite (bright), peclit (dark), and inclusion - HAZ: acicular ferrite (bright), peclit (dark)
11
- Ih=720A;Vh= 23,5m/h; N= 40%; -Weld: acicular ferrite (bright), peclit (dark), and inclusion -HAZ: acicular ferrite (bright), bainit/ peclit (dark)and a small amount of carbide at the grain boundary
II
-Ih=570A; Vh= 17m/h; Uh= 37V; -Weld: acicular ferrite (bright), peclit (dark), and inclusion - HAZ: acicular ferrite (bright), peclit (dark)and inclusion

15
From the microstructure of weld and HAZ, it is shown as: + As welding with different Ih, Vh, N, welding microstructures are similar including acicular ferrite (bright), peclit (dark); while microstructures of HAZ are same involving acicular ferrite (F), bainit/ peclit. However, ratio of phase F and P in the welds, their size and distribution are different. Welding samples metal with large N-rate, fast Vh contain multi-phase F. The microstructures of HAZ are basically same as those of welding metal consisting two main phases, F and P, but the distribution of phases are not uniform as in welding metal - The microstructures of HAZ for cases of same Ih, fast Vh are smaller and more uniformly distributed than that for cases of slow Vh. Samples’ (0,12,11) HAZ microstructures have smaller F and more uniform distribution compared with other samples with the same Ih. When the same Vh, the samples with larger Ih the HAZ microstructure have larger F and non-uniform distribution, as sample (07) HAZ has smaller Ferit, more evenly distributed than samples (03, 02). Sample (08) HAZ has smaller F, more evenly distributed than samples (09.04). - Measurement grains of specimens (Table 4-4) with additional metal has finer than that of non- addition metallic sample
Table 4-4. Measured grain level of welding microstructure Location No. Sample
2 3 4 5 7 8 9 11 12 II 1 8,46 8,64 8,67 8,78 9,04 8,73 8,2 8,61 9,12 9,26 2 8,61 8,89 8.61 8,97 8,73 8,67 8,2 8,61 8,97 9,26 3 8,37 8,64 8,61 8,97 8,81 8,99 8,14 8,78 8,75 9,42 4 8,49 8,67 8.58. 8,94 8,91 8,99 8,17 8,7 9,09 9,37 5 8,55 8,73 8,67 8.94 8,75 8,97 8,3 8,61 9,12 9,37
4.3. Results of analysis chemical composition of welding Results of chemical composition of weld metal are given in Table 4-5.
Table 4-5. Essential chemical composition of welds after testing Samples % C %Si %Mn %P %S %Cr %M0 Notes
M07 0,0659 0,1658 0,4845 0,0164 0,0136 0,0282 0,0069
M08 0,0660 0,1890 0,5072 0,0163 0,0124 0,0276 0,0081
M05 0,0548 0,1464 0,4511 0,0172 0,0141 0,0187 0,0057
M03 0,0639 0,1933 0,4957 0,0186 0,0139 0,0235 0,0033
M09 0,0566 0,1928 0,4744 0,0157 0,0129 0,0236 0,0097
M12 0,0812 0,1973 0,5194 0,0158 0,0166 0,0399 0,0096
M02 0,0642 0,2118 0,5190 0,0168 0,0133 0,0355 0,0030
M04 0,0718 0,1840 0,4838 0,0206 0,0140 0,0428 0,0052
M11 0,0763 0,2080 0,5183 0,0173 0,0123 0,0379 0,0094
M(II) 0,0627 0,2745 0,5932 0,0156 0,0146 0,0356 0,0085 With different welding conditions, basic chemical compositions of the welded samples with additional metals are different. But the difference in the composition of the elements in the welds is small. Compared with the non-addition metallic welded sample, the carbon content of the welding metal with additional metal was significantly higher, except for the 05 and 09 specimens, because these two samples with high additional metal ratio (45%) and large Vh, amount of base metal involved in the filler metal is less than that of other samples of welding. 4.4. Welding mechanical properties Including: tensile strength, impact resistance and hardness. Mechanical properties of welding metal are checked at center of material and failure analysis (COMFA) of Institute of Materials Science. Tensile strength and ductility are tested in accordance with TCVN 8311: 2010; while impact resistance
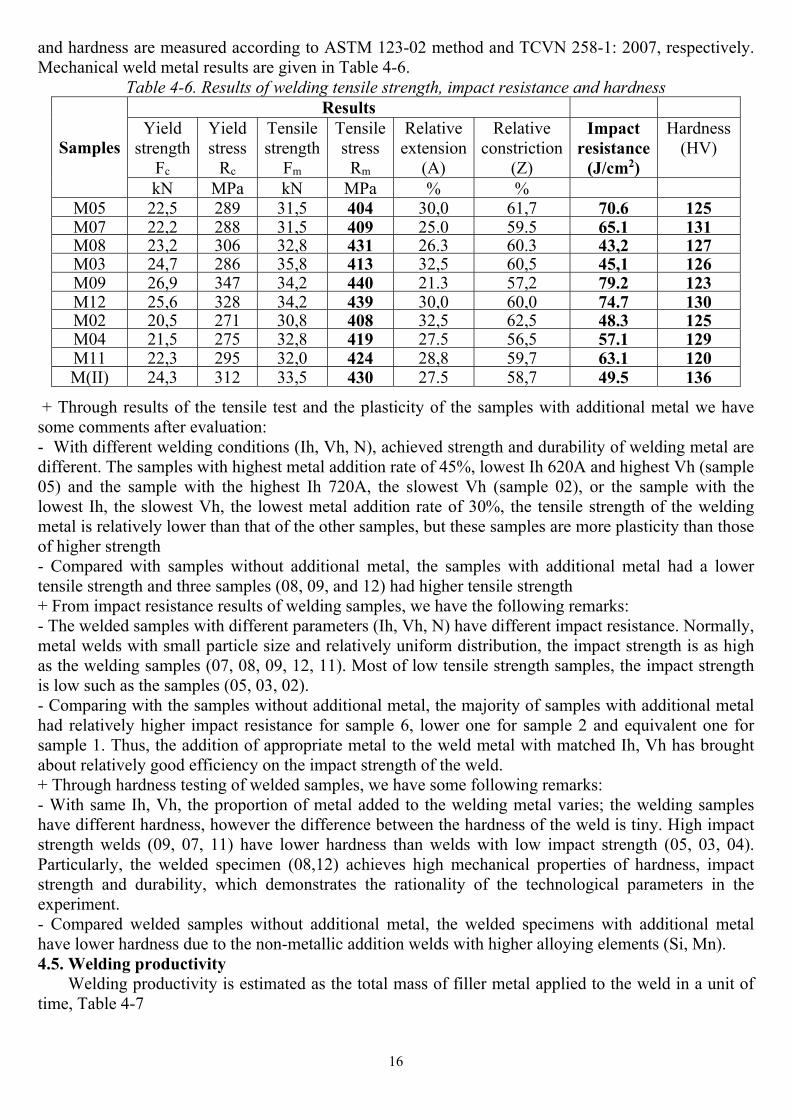
16
and hardness are measured according to ASTM 123-02 method and TCVN 258-1: 2007, respectively. Mechanical weld metal results are given in Table 4-6.
Table 4-6. Results of welding tensile strength, impact resistance and hardness
Samples
Results Yield
strength Fc
Yield stress
Rc
Tensile strength
Fm
Tensile stress
Rm
Relative extension
(A)
Relative constriction
(Z)
Impact resistance
(J/cm2)
Hardness (HV)
kN MPa kN MPa % % M05 22,5 289 31,5 404 30,0 61,7 70.6 125M07 22,2 288 31,5 409 25.0 59.5 65.1 131M08 23,2 306 32,8 431 26.3 60.3 43,2 127M03 24,7 286 35,8 413 32,5 60,5 45,1 126M09 26,9 347 34,2 440 21.3 57,2 79.2 123M12 25,6 328 34,2 439 30,0 60,0 74.7 130M02 20,5 271 30,8 408 32,5 62,5 48.3 125M04 21,5 275 32,8 419 27.5 56,5 57.1 129M11 22,3 295 32,0 424 28,8 59,7 63.1 120M(II) 24,3 312 33,5 430 27.5 58,7 49.5 136
+ Through results of the tensile test and the plasticity of the samples with additional metal we have some comments after evaluation: - With different welding conditions (Ih, Vh, N), achieved strength and durability of welding metal are different. The samples with highest metal addition rate of 45%, lowest Ih 620A and highest Vh (sample 05) and the sample with the highest Ih 720A, the slowest Vh (sample 02), or the sample with the lowest Ih, the slowest Vh, the lowest metal addition rate of 30%, the tensile strength of the welding metal is relatively lower than that of the other samples, but these samples are more plasticity than those of higher strength - Compared with samples without additional metal, the samples with additional metal had a lower tensile strength and three samples (08, 09, and 12) had higher tensile strength + From impact resistance results of welding samples, we have the following remarks: - The welded samples with different parameters (Ih, Vh, N) have different impact resistance. Normally, metal welds with small particle size and relatively uniform distribution, the impact strength is as high as the welding samples (07, 08, 09, 12, 11). Most of low tensile strength samples, the impact strength is low such as the samples (05, 03, 02). - Comparing with the samples without additional metal, the majority of samples with additional metal had relatively higher impact resistance for sample 6, lower one for sample 2 and equivalent one for sample 1. Thus, the addition of appropriate metal to the weld metal with matched Ih, Vh has brought about relatively good efficiency on the impact strength of the weld. + Through hardness testing of welded samples, we have some following remarks: - With same Ih, Vh, the proportion of metal added to the welding metal varies; the welding samples have different hardness, however the difference between the hardness of the weld is tiny. High impact strength welds (09, 07, 11) have lower hardness than welds with low impact strength (05, 03, 04). Particularly, the welded specimen (08,12) achieves high mechanical properties of hardness, impact strength and durability, which demonstrates the rationality of the technological parameters in the experiment. - Compared welded samples without additional metal, the welded specimens with additional metal have lower hardness due to the non-metallic addition welds with higher alloying elements (Si, Mn). 4.5. Welding productivity Welding productivity is estimated as the total mass of filler metal applied to the weld in a unit of time, Table 4-7

17
Table 4-7. Evaluating the productivity of the welding process
Samples Welding parameters Productivity of filler metal (kg/h) Welding
time, min/m Ih(A)
Vh
(m/h) N
(%) Welding
layer From wire
From additional metal
Total
M07 620 17 30 2 9,65 4,14 13,80 7,0M08 620 20 40 2 9,67 6,44 16,11 6,0M05 620 23,5 45 2 10,46 8,56 19,02 5,1 M03 670 17 40 2 8,28 5,52 13,80 7,0M09 670 20 45 2 8,85 7,25 16,10 6,0M12 670 23,5 30 2 13,31 5,71 19,02 5,1M02 720 17 45 2 7,59 6,21 13,80 7,0M04 720 20 30 2 11,27 4,83 16,10 6,0M11 720 23,5 40 2 11,42 7,61 19,02 5,1M(II) 540 17 - 3 9,28 - 9,28 10,4
From Table 4-7, the productivity of the filler metal for case of welding with additional metal is higher than that of the non-metallic addition weld case, leading to increases the weld productivity, which is consistent with the literature review [22,52,60]. 4.6. Determining the effects and appropriate level of welding parameters on the welding mechanical properties 4.6.1. The effects and appropriate level of technology parameters of Ih, Vh, N on welding tensile strength 4.6.1.1.Estimating influence and appropriate level of Ih, Vh, N on welding tensile strength Based on test results, the effects of Ih, Vh, N on welding tensile strength are obtained by using Taguchi method and ANOVA analysis; they are then shown in Table 4-8. Table 4-8. Influence rate of technology parameters on welding tensile strength
Experiments 1 2 3 4 5 6 7 8 9Results of σb (Mpa) 409 431 404 413 440 439 408 419 424
Avergare of the experiment results(Mpa). 420,78 Total of the experiment results (T) 3787 Adjustment coefficients (CF) 1594949 Degree freedom of the experiment (fT) 8
Different levels of the parameters (mji)
mIh1 52,35 mIh2 52,68 mIh3 52,40 mVh1 52,26 mVh2 52,67 mVh3 52,51 mN1 52,51 mN2 52,52 mN3 52,40
Sum of squares for the parameters (Sj)
SIh 448,222 SVh 610,889 SN 53,555
Sum of squares for the experiments 1112,67
Degree freedom of the parameters (fj)
fIh 2 fVh 2 fN 2
Squares of average for the parameters (Vj)
VIh 224,111 VVh 305,444 VN 26,778
Percentage of effect for the parameters (Pj)
PIh 40,28 PVh 54,91 PN 4,81

18
The influence rate results listed in Table 4-8 are further depicted on Figures 4.3 and 4.4.
Figure 4.3. Charts showing parameter level and its influence rate on the welding tensile strength
a) Parameter of Ih; b) Parameter of Vh; c) Parameter of N
Figure 4.4.
Graph of percentage effect for Ih, Vh and N on the welding tensile strength
. To obtain demand quality, the bigger welding tensile strength is better. Therefore, from these figures, it indicates that case with parameters of Ih2,Vh2, N2 is appropriate. Magnitude of the tensile welding strength for the case is predicted by: Yopt = T+ (Ih2 – T)+ (Vh2 - T) + (N2 - T) = 441,78.MPA In addition, the results in figures also reveal that Vh has highest effect with 54,91%; sequentially Ih is with 40,28% ; and N is smallest effect with 4,81%. Hence, to acquire the higher tensile strength of welding, Vh and Ih should priorly be adjusted. 4.6.1.2. Experiment results for verifying the welding tensile strength The welding experiment with optimal parameters ( Ih= 670 (A), Vh= 20 (m/h), N = 40 (%), Uh= 38 (V)) was conducted and tensile results were shown in Table 4-9.
Table 4-9. Proving results for the welding tensile strength
Sample Dimension Testing results
Note D0 L0 Fc Rc Fm Rm A Z
MKC,B 9,94 40 27,0 347 34,2 441 22.5 56,8 Non-defect According to above result, they demonstrates that tested tensile strengths of weld are approximate with calculated results. The highest welding tensile strength will be acquired by using the optimal parameters. 4.6.1.3. Developing mathematical relationship between the technological parameters and the welding tensile strength by the least squares method The welding tensile strength depends on technological parameters such as Ih,Vh, N. Thus, finding an equation which describes relationship between above mentioned parameters and objective function of the welding tensile strength is necessary. Then the equation can be used to analyze the effect trend of the parameters on object function. Based on the least squares method, both of linear and nonlinear regression models have been established as - Equation of linear regression model: b = 379,921+ 0,023.Ih+ 1,785.Vh - 0,281.N (4-1) - Exponentiation equation of nonlinear regression model: b = 261,1037.Ih0,045 .Vh0,09 .N-0,0237 (4- 2) Comparison of the welding tensile strength results using two equation forms is given in Figure 4.5.
Figure 4.5. Comparison of the tensile strength of welding using the two equations

19
Interpolation results by exponentiation and linear equations are quite similar. Because the interpolation results using two equations are almost the same, therefore, both of them can be applied to establish the regression model of Ih,Vh, N with b. The welding tensile strength results are obtained by using linear and nonlinear model are depicted in Figure 4.6 and 4.7, respectively.
Figure 4.6. 3D- The welding tensile strength respect to the welding parameters using linear model
Figure 4.7. 3D- The welding tensile strength respect to the welding parameters using nonlinear model Figure 4.5 shows that the welding tensile strength is directly proportional with Ih, Vh and is inversely proportional with N. It means that the welding tensile strength decrease with increasing N; and opposite, the welding tensile strength increases with increasing Vh and Ih. If Ih is a constant, the welding tensile strength will be raised with increment of Vh and reduction of N (Figure 4.6a). Similarly, If Vh is a constant the welding tensile strength will be raised with increment of Ih and reduction of N (Figure 4.6b). If N is a constant the welding tensile strength will be raised with increment of both Ih and Vh (Figure 4.6c). The effect trend of each welding parameters is the same for case of the nonlinear model, refer to Figure 4.7. 4.6.2. Effects and appropriate level of technology parameters of Ih, Vh, N on welding hardness 4.6.2.1.Estimating influence rate and appropriate level of Ih, Vh, N on welding hardness Based on hardness test, using the same method for calculating the welding tensile strength, analysis results are provided in Table 4-10. Table 4-10. Influence rate of technology parameters on the welding hardness
Experiments 1 2 3 4 5 6 7 8 9 Results of HV 125 131 127 126 123 130 125 129 120
Avergare of the experiment results (HV) 126,22 Total of the experiment results (T) 1136 Adjustment coefficients (CF) 143388,44
Degree freedom of the experiment (fT) 8 Different levels of the parameters (mji)
mIh1 42,12 mIh2 42,03 mIh3 41,91 mVh1 41,96 mVh2 42,12 mVh3 41,98 mN1 42,14 mN2 41,98 mN3 41,94
Sum of squares for the parameters (Sj) SIh 13,556 SVh 9,555

20
Continued Table 4-10. SN 14,889
Sum of squares for the experiments (ST) 38,00
Degree freedom of the parameters (fj) fIh 2 fVh 2 fN 2
Squares of average for the parameters (Vj) VIh 6,777 VVh 4,777 VN 7,444
Percentage of effect for the parameters (Pj) PIh (%) 35,67 PVh (%) 25,15 PN (%) 39,18
From Table 4-10, the influence rate results of Ih,Vh, N are estimated and illustrated by Figures 4.8 and 4.9.
Figure 4.8. Charts showing parameter (Ih, Vh, N) and its influence rate on the welding hardness
Figure 4.9. Percentage effect for Ih, Vh and N on the welding hardness
From Figure 4.8, to obtain demand quality, the bigger welding hardness is better. Therefore, case with parameters of Ih1,Vh2, N1 is appropriate. Magnitude of the hardness for the optimal parameters is estimated by Yopt = T+ (Ih1 – T)+ (Vh2 - T) + (N1 - T) = 130,89 (HV) According to Figure 4.9, the effects of N, Ih and Vh are 39,18%, 35,67% and 25,15%, respectively. It also reveals that influence of N and Ih are higher than that of Vh. Thus, to acquire demand the hardness, N and Ih should priorly be adjusted. 4.6.2.2.Experiment results for proving the welding hardness The welding experiment with optimal parameters (Ih=620 (A), Vh=20 (m/h), N =30 (%), Uh=37 (V)) was conducted and the hardness test results were shown in Table 4-11.
Table 4-11. Proving results for the welding hardness
Sample Measured hardness HV10 Average of
measured hardness HV10 Point 1 Point 2 Point 3 Point 4 Point 5
MKC. HV 128 130 129 130 129 129 According to above result, they demonstrates that tested hardness of welds are approximate with calculated results. The highest welding hardness will be acquired by using the optimal parameters. 4.6.2.3.Mathematical relationship between Ih, Vh, N and the welding hardness By the same method for the tensile strength, the regression equation for the welding hardness is found as: - Equation of linear regression model: HV = 153,483 - 0,033.Ih + 0,334.Vh - 0,205.N (4-3) - Exponentiation equation of nonlinear regression model:

21
HV= 436,165.Ih-0,160 .Vh0,0066 .N-0,0597 (4-4) Based on Equations (4-4) and (4-5), comparison of the welding hardness results using two kinds of the equations is given in Figure 4.10.
Figure 4.10. Comparison of the welding hardness using the two equations with respect to N,Vh,Ih
From Figure 4.10a, it indicates that if Ih and Vh are constants, the welding hardness is inversely proportional with N. if Ih and N are constants; the hardness of welding is directly proportional with Vh (Figure 4.10b). Interpolation results by exponentiation and linear equations in Figure 4.10 are quite similar; the difference of them is about 0,08 %. Therefore, both of them can be applied to establish the regression model of the hardness. Using these regression equation, the effects of the parameters (Ih,Vh, N) are presented in Figures 4.11 and 4.12.
Figure 4.11. 3D- The welding hardness with respect to the welding parameters (Ih,Vh, N) using linear
model
Figure 4.12. 3D- The welding hardness with respect to the welding parameters (Ih,Vh, N) using
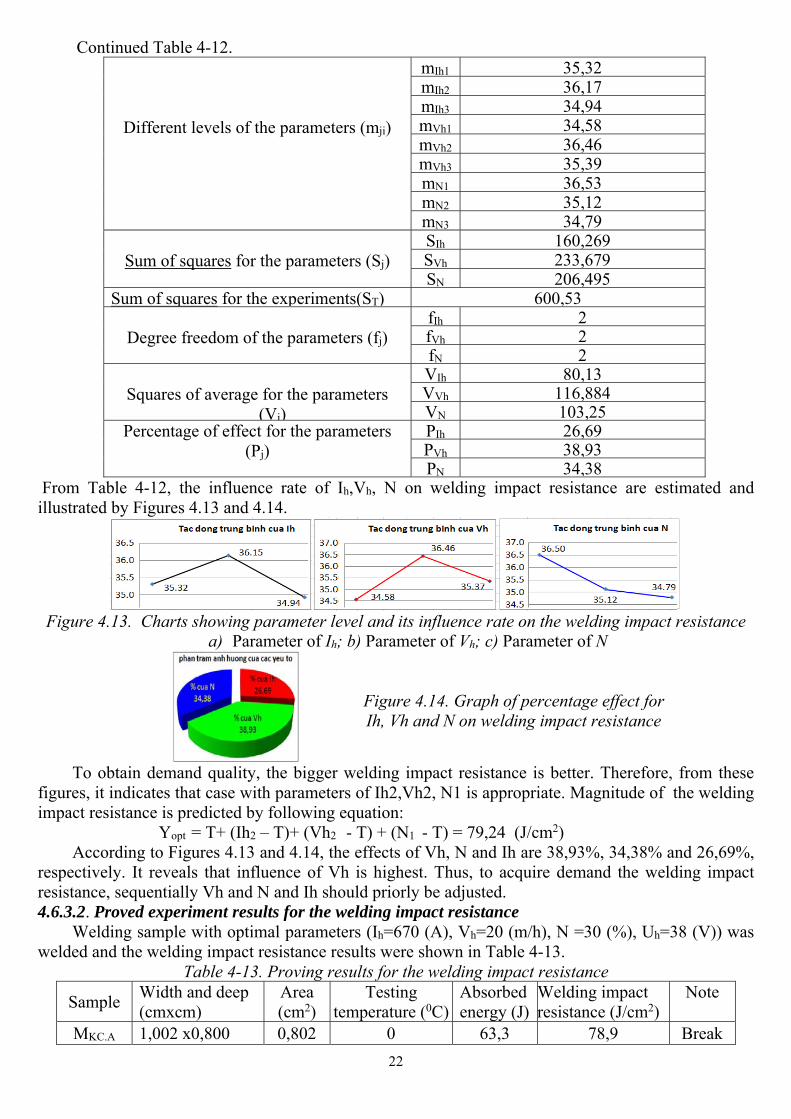
nonlinear model Figure 4.11 and 4.12 show that when Ih equals optimal value of 620A, the welding hardness increases with increasing Vh and decreasing N. While Vh sets as optimal value of 20m/h, the welding hardness increases with decreasing both of Ih and N. For case of N equals optimal value of 30%, the welding hardness increases with increasing Vh and decreasing Ih. The 3D interpolation graphs in the form of exponential and linear functions are similar, and influence trend of the technological parameters is the same. 4.6.3. The effects and appropriate level of technology parameters of Ih, Vh, N on welding impact resistance 4.6.3.1. Estimating influence rate and appropriate level of Ih, Vh, N on the welding impact resistance Based on impact test results, using Taguchi method and ANOVA, the analysis results are given in Table 4-12. One again, to obtain demand quality, the bigger welding impact resistance is better.
Table 4-12. Influence rate of technology parameters on the welding impact resistance Experiments 1 2 3 4 5 6 7 8 9 Results of aK (J/cm2) 70,6 65,1 43,2 45,1 79,2 74,7 48,3 57,1 63,1 Avergare of the experiment results (J/cm2) 60,71 Total of the experiment results (T) 546,4 Adjustment coefficients (CF) 33172,55 Degree freedom of the experiment (fT) 8
22
Continued Table 4-12.
Different levels of the parameters (mji)
mIh1 35,32 mIh2 36,17 mIh3 34,94 mVh1 34,58 mVh2 36,46 mVh3 35,39 mN1 36,53 mN2 35,12 mN3 34,79
Sum of squares for the parameters (Sj)
SIh 160,269 SVh 233,679 SN 206,495
Sum of squares for the experiments(ST) 600,53
Degree freedom of the parameters (fj) fIh 2 fVh 2 fN 2
Squares of average for the parameters
(Vj)
VIh 80,13 VVh 116,884 VN 103,25
Percentage of effect for the parameters (Pj)
PIh 26,69 PVh 38,93 PN 34,38
From Table 4-12, the influence rate of Ih,Vh, N on welding impact resistance are estimated and illustrated by Figures 4.13 and 4.14.
Figure 4.13. Charts showing parameter level and its influence rate on the welding impact resistance
a) Parameter of Ih; b) Parameter of Vh; c) Parameter of N
Figure 4.14. Graph of percentage effect for Ih, Vh and N on welding impact resistance
To obtain demand quality, the bigger welding impact resistance is better. Therefore, from these figures, it indicates that case with parameters of Ih2,Vh2, N1 is appropriate. Magnitude of the welding impact resistance is predicted by following equation: Yopt = T+ (Ih2 – T)+ (Vh2 - T) + (N1 - T) = 79,24 (J/cm2) According to Figures 4.13 and 4.14, the effects of Vh, N and Ih are 38,93%, 34,38% and 26,69%, respectively. It reveals that influence of Vh is highest. Thus, to acquire demand the welding impact resistance, sequentially Vh and N and Ih should priorly be adjusted. 4.6.3.2. Proved experiment results for the welding impact resistance Welding sample with optimal parameters (Ih=670 (A), Vh=20 (m/h), N =30 (%), Uh=38 (V)) was welded and the welding impact resistance results were shown in Table 4-13.
Table 4-13. Proving results for the welding impact resistance
Sample Width and deep (cmxcm)
Area (cm2)
Testing temperature (0C)
Absorbed energy (J)
Welding impact resistance (J/cm2)
Note
MKC.A 1,002 x0,800 0,802 0 63,3 78,9 Break

23
According to above results, they demonstrate that welding impact resistance are approximate with calculated results. The highest welding impact resistance will be acquired by using the optimal parameters. 4.6.3.3. Establishing mathematical relationship between Ih, Vh, N to the welding impact resistance - Equation of linear regression model: Ak = 96,38 + 0,0347.Ih + 0,7924.Vh + 0,7424.N (4 - 5) - Exponentiation equation of nonlinear regression model: AK = 929,41.Ih-0,2737 .Vh0,2903.N-0,5063 (4 - 6) Comparison of the welding impact resistance results using two kinds of the equations is given in Figure 4.15 and 4.16.
Figure 4.15. Welding impact resistance depend on each parameter using the two equations in 2D
Figure 4.16. Welding impact resistance depend on each parameter using the linear equations in 3D
Figure 4.17.Welding impact resistance depend on each parameter using the nonlinear equations in 3D From these figures, it can be pointed out as - The welding impact resistance is directly proportional with Vh (Figure 4.15b) and is inversely proportional with Ih and N (Figures 4.15a and c). Interpolation results using two kinds of equations are quite similar. Therefore, it can be said that the experiment results are convergence and reliable. - The welding impact resistance increases with increasing Vh and decreasing N (Figures 4.16 and 4.17). When both Ih and N are decreased, the welding impact resistance will be increased (Figures 4.16b and 4.17b). Similarly, the welding impact resistance increases with increasing Vh and decreasing Ih (Figures 4.16c and 4.17c). 4.7. Determining appropriate parameter level to response all mechanical properties
Analysis of above section indicate that all parameters of Ih,Vh, N also effect on the welding mechanical properties. However, effect of each parameter on the mechanical properties is different. It may best for one but worst for other. To overcome this problem, the Overall Evaluation Criteria (OEC) is employed to simultaneously find the optimal parameters for multi-objectives. The calculation results shows in table 4-11.

24
Table 4-14. Input parameters and OEC for 9 experiments Parameters levels and testing
conditions Values of objectives (Gij) Factor
of OEC MSD S/N
Ih(A) Vh N(%) HV AK σb
620 17 30 125 70,6 409 0,4202 5,6621 -7,5298620 20 40 131 65,1 431 0,7825 1,6332 -2,1303620 23.5 45 127 43,2 404 0,1909 27,4376 -14,3834670 17 40 126 45,1 413 0,2794 12,8036 -11,0733670 20 45 123 79,2 440 0,7818 1,6360 -2,1378670 23.5 30 130 74,7 439 0,9241 1,1710 -0,6854720 17 45 125 48,3 408 0,2233 20,0535 -13,0219720 20 30 129 57,1 419 0,5279 3,5876 -5,5480720 23.5 40 120 63,1 424 0,3880 6,6407 -8,2221
Weight of each criterion (Wj) 0,3 0,3 0,4 Influence rate of Ih, Vh, N on OEC is analyzed and listed in Table 4-15.
Table 4-15. Influence rate of factors on the OEC Experiments 1 2 3 4 5 6 7 8 9 Results of 42,02 78,25 19,09 27,94 78,18 92,41 22,33 52,79 38,80Average of the experiment results (OEC) 0,502 Total of the experiment results (T) 4,52 Adjustment coefficients (CF) 2,2684 Degree freedom of the experiment (fT) 8
Different levels of the parameters (mji)
mIh1 -8,01 mIh2 -4,63 mIh3 -8,93 mVh1 -10,54 mVh2 -3,27 mVh3 -7,76 mN1 -4,59 mN2 -7,14 mN3 -9,85
Percentage of effect for the parameters (Pj)
PIh(%) 29,13 PVh (%) 52,83 PN (%) 18,04
From Table 4-15, the influence rate of Ih,Vh, N on OEC are estimated and illustrated by Figures 4.18 and 4.19.
Figure 4.18 Charts showing parameter level Ih, Vh, N and its influence rate on OEC
Figure 4.19. Graph of percentage effect for Ih, Vh and N on OEC

25
From these figures, to obtain highest OEC, the optimal parameter corresponds to Ih2, Vh2, N1 and the value of OEC is following
2 2 1 0,977optOEC OEC Ih OEC Vh OEC N OEC
The magnitude of OEC with optimal levels is much higher than its average value. The result demonstrates that multi-objectives based on OEC can be acquired high value [54]. In addition, Figure 4.19 indicates that Vh has highest effect on OEC with 52,83%. Ih for 29,13% and N with 18,04% effect on OEC. After we have the optimal results by using OEC, the predicting optimal result for each objective is performed through Eq. 3-21 and given in table 4-16.
Table 4-16 Predicting results for each criteria based on optimal parameter from OEC Each criteria Optimal result by single objective Optimal result by OEC Error (%)
Welding tensile strength 441,78 (MPa) 441,44 (MPa) 0,077% Welding hardness 130,89 (HV) 129,56 (HV) 1,016% Welding impact resistance 79,24(J/cm2) 79,24(J/cm2) 0%
From Table 4-16, it exposes that the objective values obtained by OEC is smaller than that by using single objective. However, the maximum percentage errors approximate 1%. Thus OEC can be applied to optimize multi-mechanical properties of the weld. The welding sample with optimal parameters from OEC (Ih=670 (A), Vh=20 (m/h), N =30 (%)) was welded and the test results were shown in Table 4-17.
Table 4-17. Test results of proving sample Sample Tensile strength: b (MPa) Hardness: HV10 Impact resistance AK(J/cm2 MKC.Đ 439 129,2 78,9
According to verifying results, the tensile strength, hardness and impact resistance are approximate with calculated results by OEC. This proves that the welding mechanical properties can be simultaneously acquired by using the presented optimal parameters Ih, Vh in current research.
Conclusions of chapter 4 From the analysis and evaluation of experimental results, some of the following conclusions were drawn: + The welding parameters (Ih, Vh, N) affect the shape and size, microstructure and chemical composition of the weld. At the experimental parameters, the welds achieved different penetration depth that satisfied requirements of shape and size according to selected criteria. Width of HAZ significantly depends on Vh, Ih; it increases with increasing Ih and small Vh. In SAW technology with additional metal, Vh is often larger than conventional SAW technology; thus, HAZ width is usually smaller. The welded microstructures are the same and consist of two phase ferrite, peclite with different ratio and phase size, depending on the additional metal mass and arc welding energy of the welding process. Microstructure of SAW with additional metal welds is finer than that of SAW welds. + Using Taguchi method and ANOVA, we determined: - The appropriate technology parameters for object function of tensile strength, hardness and impact resistance of the welds are: Ih2, Vh2, N2; Ih1, Vh2, N1; Ih2, Vh2, N1, respectively. And influence of these parameters to each welding properties is also calculated specifically - Using the least squares method, a mathematical model was developed to show the relationship between mechanical properties and technological parameters by linear and nonlinear regression to evaluate the influence trend of the technological parameters on the welding properties. The graphs of interpolation from the two forms of function are similar and approximate, showing the high convergence of the experimental results
26
+ Based on the overall OEC rating, the appropriate technology parameters for all three of the welding properties are Ih2, Vh2, N1. The influence of each technology parameter on the welding properties is also determined + The theoretical and the empirical values in the experimental domain of the mechanical properties are quite appropriate, which confirms the reliability of the theory and studied results.
CONCLUSIONS
From the theoretical and empirical research of the thesis, some main conclusions are drawn as follows: 1. An theoretical overview of SAW technology with additional metal based on the analysis of domestic and foreign research and understanding the theory of welding were generalized. 2. The influence of technological parameters, added metal proportion to the shape and size, chemical composition of the weld and the welded microstructure have been investigated. Microstructures of SAW with additional metal are finer than that of traditional SAW. 3. Using Taguchi experimental design method and analysis of variance (ANOVA), we have provided the appropriate level and technological parameters (Ih, Vh, N) to obtain the highest tensile strength, hardness and impact strength in the surveyed field. At the same time, the effect of each parameter on the mechanical parameters is given 4. Using the least squares method, linear and nonlinear regression has been developed to show the relationship between the parameters of Ih, Vh, N to the specific welding mechanical properties. + Regression function for welded tensile strength - Linear form: b = 379,921+ 0,023.Ih+ 1,785.Vh - 0,281.N - Nonlinear form: b = 261,1037.Ih0,045 .Vh0,09 .N-0,0237 + Regression function for welded hardness - Linear form: HV = 153,483 - 0,033.Ih + 0,034.Vh - 0,205.N - Nonlinear form: HV= 436,165.Ih-0,160.Vh0,0066.N-0,0597 + Regression function for welded impact resistance - Linear form: Ak = 96,38 - 0,0347.Ih + 0,7924.Vh - 0,7424.N - Nonlinear form: AK = 929,41.Ih-0,2737.Vh0,2903.N-0,5063 We have analyzed and evaluated the influence of each parameter and simultaneous 3 technological parameters to the welding mechanical parameters as the basis for the technology processes design and development of SAW with additional metal. Recommendations on the use of nonlinear regression are given by comparing the total variance of the S / N ratios of the regression forms 5. Based on the overall OEC rating, a set of parameters of SAW with additional metal for low-carbon structural steel (SS400) with a thickness of 18 mm, beveled angle of 340 has found as: Ih = 670 A; Vh = 20 m / h; N = 30% simultaneously satisfied the welded tensile strength, impact strength and hardness 6. Achieved parameters Ih, Vh, N were experimentally verified. The results were consistent with the theoretical calculations. This proves that the calculated results are reliable and can be applied in reality

27
LIST OF PUBLICATIONS 1. ThS. Lê Văn Thoài, ThS. Nguyễn Minh Tân, TS. Hoàng Văn Châu, PGS.TS. Đào Quang Kế, “ Nâng cao năng suất chất lượng kết cấu hàn bằng công nghệ hàn tự động với bột kim loại bổ sung”, Kỷ yếu Hội nghị Khoa hoc và Công nghệ toàn quốc về Cơ khí lần thứ IV, Tp. Hồ Chí Minh, ngày 6 tháng 11 năm 2015, tập (1), tr 188-195. 2. ThS. Lê Văn Thoài, ThS. Nguyễn Minh Tân, TS. Hoàng Văn Châu, “ Độ dai va đập kim loại mối hàn trong công nghệ hàn tự động với bột kim loại bổ sung”, Kỷ yếu Hội nghị Khoa học và Công nghệ toàn quốc về Cơ khí- Động lực 2016, Hà Nội ngày 13 tháng 10 năm 2016, tập (1), tr 327-331. 3. ThS. Lê Văn Thoài, TS. Hoàng Văn Châu, KS. Đinh Trần Nghĩa, ThS. Nguyễn Quốc Dũng, “ Ảnh hưởng của tốc độ hàn và tỷ lệ cấp bột đến tổ chức kim loại liên kết hàn trong công nghệ hàn tự động với bột kim loại bổ sung”, Tạp chí Khoa học và Công nghệ Trường Đại học công nghiệp Hà Nội tháng 12/2016. 4. ThS. Lê Văn Thoài, ThS. Vũ Đức Phúc, TS. Hoàng Văn Châu, KS. Phạm Phúc Hưng, “Tối ưu hóa thông số công nghệ trong hàn tự động dưới lớp thuốc với bột kim loại bổ sung bằng phương pháp thiết kế thực nghiệm Taguchi”, Tạp chí Cơ khí Việt Nam số tháng 9/ 2017.