mining system audit data: opportunities and...
TRANSCRIPT

Mining System Audit Data: Opportunities and Challenges
Wenke Lee College of C o m p u t i n g
Georgia I n s t i t u t e of Techno logy At l an t a , G A 30332-0280
Wei Fan IBM T.J . W a t s o n Research Cen te r
H a w t h o r n e , NY 10532
A b s t r a c t
Intrusion detection is an essential component of computer security mechanisms. It requires accurate and efficient analysis of a large amount of system and network audit data. It can thus be an application area of data mining. There are several characteris- tics of audit data: abundant raw data, rich system and network semantics, and ever "streaming". Ac- cordingly, when developing data mining approaches, we need to focus on: feature extraction and con- struction, customization of (general) algorithms ac- cording to semantic information, and optimization of execution efficiency of the output models. In this paper, we describe a data mining framework for min- ing audit data for intrusion detection models. We discuss its advantages and limitations, and outline the open research problems.
1 In troduc t ion
As the Internet plays an increasingly important role in our society, e.g., the infrastructure for E- Commerce and Digital Government, criminals and enemies have begun devising and launching sophis- ticated attacks motivated by financial, political, and even military objectives. We must ensure the se- curity, i.e., confidentiality, integrity, and availabil- ity, of our network infrastructures. Intrusion detec- tion is the process of identifying and responding to malicious activity aimed at compromising computer and network security [2]. It is a critical component of the defense-in-depth security mechanisms, which also include: security policy, vulnerability scanning and patching, authentication and access control, en- cryption, program wrappers, firewalls, and intrusion tolerance.
Intrusion detection is a very hard problem. There are always "security holes" due to design flaws, im- plementation errors, and operation oversights in to- day's complex network systems. Research in soft- ware engiiieering has shown that it is hard to pre-
vent, discover, and remove all software "bugs". It is even harder to prevent and detect intrusions be- cause intelligent adversaries, with malicious intents, can exploit the security holes (and their combina- tions) to devise potentially a very large number of intrusion methods.
Most intrusion detection approaches rely on anal- ysis of system and network audit data. Network traf- fic can be recorded using "packet capturing" utilities (e.g., l ibpcap [16]), and operating system activi- ties can be recorded at the system call level (e.g., BSM [19]). A basic premise here is that when audit mechanisms are enabled, distinct evidence of legiti- mate activities and intrusions will be manifested in the audit data. Thus, instead of (statically) analyz- ing (all source codes of) complex software, intrusion detection uses a more practical approach of analyz- ing the audit records of run-time activities of net- works and systems (and users).
At an abstract level, an intrusion detection system (IDS) extracts ]eatures, i.e., the individual pieces of evidence, from the system event-level or network packet-level audit data, and uses some modeling and analysis algorithms to reason about the avail- able evidence. Traditionally, IDSs are developed by knowledge-engineering. Expert knowledge or in- tuition of networks, operating systems, and attack methods are used to select the features, and hand- craft the detection rules. Given the complexities of today's network environments and the sophisti- cation of the increasingly hostile attackers, the so- called expert knowledge is often very limited and unreliable.
On the other hand, data mining approaches can be used to extract features and compute detection models from the vast amount of audit data. The features computed from data can be more "objec- tive" than the ones hand-picked by experts. The inductively learned detection models can be more "generalizable" than hand-coded rules (that is, they can have better performance against new variants of known normal behavior or intrusions). There-
S IGMOD Record, Vol. 30, No. 4, December 2001 35

fore, data mining approaches can play an impor- tant role in the process of developing an IDS. We need to point out that data mining should comple- ment rather than exclude the use of expert knowl- edge. Our objective should be to provide the tools, grounded on sound statistics and machine learning principles, for IDS developers to construct better ID models quickly and easily. For example, experts can view and edit the patterns and rules produced by data mining approaches, and translate them into ef- ficient detection modules.
The rest of the paper is organized as follows. We first give an brief overview of research in intru- sion detection, particularly data mining-based ap- proaches. We then describe the characteristics of audit data. We next present a data mining frame- work for extracting features and computing detec- tion models, and describe our experiments and re- sults. We then discuss the benefits of as well as research challenges in applying data mining ap- proaches to intrusion detection.
1 .1 R e l a t e d W o r k
Several influential research IDSs were developed from mid-S0's to mid-90's. STAT [6] and IDIOT [8] are misuse detection systems that use the "signa- tures" of known attacks, i.e., the patterns of attack behavior or effects, to identify a matched activity as an attack instance. By definition, misuse detection is not effective against new attacks, i.e., those that do not have known signatures. NIDES [3] has an anomaly detection subsystem that uses established normal profiles, i.e., the expected behavior, to iden- tify any unacceptable deviation as the result of an attack. Anomaly detection is capable of catching new attacks. However, new legitimate behavior can also be falsely identified as an attack, resulting in a false alarm. These systems and most of the later re- search and commercial systems are developed using a pure knowledge-engineering process.
In recent years, there have been several learning- based or data mining-based research efforts in in- trusion detection. Warrender et al. [20] showed that a number of machine-learning approaches, e.g., rule induction, can be used to learn the normal execu- tion profile of a program, which is the short se- quences of its run-time system calls made. These learned models were shown to be able to accurately detect anomalies caused by exploits on the pro- grams. Lane and Brodley developed machine learn- ing algorithms for analyzing user shell commands and detecting anomalies of user activities [9]. A team of researchers at Columbia University have
been working on data mining-based intrusion de- tection since 1996 (see Stolfo et al. [18] for an overview). The main capabilities developed in this research include: pattern mining and feature con- struction, cost-sensitive modeling for efficient run- time model execution, anomaly detection, learning over noisy data, and correlation analysis over multi- ple of data streams. The ADAM project at George Mason University is developing anomaly detection algorithms based on automated audit data analysis. (see http://ise. Emu. edu/'dbarbara/adam, html)
2 A u d i t D a t a
The first step in applying or developing data min- ing approaches for an application is to have a basic understanding of the problem domain. We briefly discuss the main characteristics of audit data.
First, system audit data is "raw", i.e., in binary format, unstructured, and time dependent. For data mining, we need to first preprocess audit data to a suitable form, i.e., ASCII tabular data with at- tributes (or features). For example, data output by l ibpcap contains binary records describing network packets. The records are ordered by the timestamps (i.e., packet arrival time). In order to analyze a network connection, we need to first "summarize" all packet data that belong to the same connec- tion. The connection data, in ASCII format, can contain for each connection its source and destina- tion hosts, service (e.g., t e l n e t , f t p , etc.), and the number of bytes transfered, etc., that describe the connection activities. The key objective of audit data preprocessing is to extract and construct ap- propriate features so that effective detection models can be constructed. The challenge for data mining is to develop techniques to automate some of the knowledge-intensive data preprocessing and feature extraction tasks.
Second, audit data contains rich network and sys- tem semantics. For example, network connections that originate from the same host, destine for the same host, or request the same service may be "re- lated" to a specific user or program activity. Such semantics or context information is very useful in in- trusion detection. The challenge for data mining is to customize the general algorithms to incorporate domain knowledge so that only the relevant patterns are computed from audit data.
Third, audit data is high-speed and high-volume streaming data. Auditing mechanisms are designed to record all network and system activities in great details. While this can ensure that no intrusion
36 S I G M O D Record , Vol. 30, No. 4, D e c e m b e r 2001

evidence will be missed, the high-speed and high- volume data stream requires the run-time execution of detection models be very efficient. Otherwise, the long delay in data analysis simply presents a time window for attacks to succeed. The challenge for data mining is to develop techniques to compute de- tection models that are not only accurate but also efficient in run-time execution.
2.1 D a t a M i n i n g A l g o r i t h m s
Several types of algorithms are particularly useful for mining audit data.
Classif icat ion An ideal application in intrusion detection will be to gather sufficient "normal" and "abnormal" audit data for a user or a program, then apply a classification algorithm to learn a classifier that can label or predict new unseen audit data as belonging to the normal class or the abnormal class.
Assoc ia t ion analysis Associations of system features in audit data, for example, the correlation between command and argument in the shell com- mand history data of a user, can serve as the basis for constructing normal usage profiles.
Sequence analysis Frequent patterns of time- based network and system activities provide guide- lines for incorporating temporal statistical measures into intrusion detection models. For example, fi'e- quent patterns of network-based denial-of-service (DOS) attacks suggest that several per-host and per- service measures should be included.
3 A F r a m e w o r k
We have developed a data mining framework for constructing features and intrusion detection mod- els from audit data [10]. Using this framework, raw (binary) audit data is first processed and summa- rized into network connection records (or host ses- sion records) containing a number of basic features: timestamp, duration, source and destination IP ad- dresses and port numbers, protocol type, and an error condition flag. Specialized data mining pro- grams [12, 10] are applied to compute frequent pat- terns, i.e., the association rules [1] describing the correlations among the features, and the frequent episodes [15] describing the frequently co-occurring events across the records. The consistent patterns of normal activities and the "unique" patterns associ- ated with intrusions are then identified and analyzed to construct additional features for the records [13]. Machine learning algorithms (e.g., the RIPPER [4] classification rule learner) are then used to learn
the detection models. For (run-time) execution ef- ficiency, multiple models each with different com- putation cost and detection accuracy are produced. The idea is to execute the lighter weight detection model(s) first; and if the desired prediction accu- racy is not attained, the more time-consuming mod- els will then be activated [5].
We next describe the key components of this framework in more details.
3 .1 P a t t e r n M i n i n g a n d C o m p a r i s o n
We compute the association rules and frequent episodes from audit data, which capture the intra- and inter- audit record patterns. These frequent pat- terns can be regarded as the statistical summaries of network and system activities captured in the audit data, because they measure the correlations among system features and the sequential (i.e., temporal) co-occurrences of events.
The basic association rules and frequent episodes algorithms do not consider any domain knowledge. That is, assume I is the interestingness measure of a pattern p, then I(p) =/(support (p) , confidence(p)), where f is some ranking function. As a result, the basic algorithms can generate many rules that are "irrelevant" (i.e., uninteresting) to the appli- cation. When customizing these algorithms for audit data, we incorporate schema-level knowl- edge into the interestingness measures. Assume IA is a measure of whether a pattern 19 contains the specified important (i.e. "interesting") at- tributes, our extended interestingness measure is Ie (/9) = /e ( I A (p),/(support(/9), confidence(p))) = f~(Ia(p) , I (p) ) , where A is a ranking function that first considers the attributes in the pattern, then the support and confidence values.
We discuss two kinds of important schema-level knowledge about audit data here. First, there is a partial "order of importance" among the attributes of an audit record. Some attributes are essential in describing the data, while others only provide aux- iliary information. For example, a network connec- tion can be uniquely identified by the combination of its start time, source host, source port, desti- nation host, and service (destination port). These are the essential attributes when describing network data. We argue that the "relevant" association rules should describe patterns related to the essential at- tributes. We call the essential attribute(s) axis at- tribute(s) when they are used as a form of i tem constraints in the association rules algorithm. Dur- ing candidate generation, an item set must contain value(s) of the axis attribute(s). We consider the
S I G M O D Record , Vol. 30, No. 4, D e c e m b e r 2001 37

correlations among non-axis attributes as not in- teresting. In other words, if p contains axis at- tribute(s), then IA(p) = 1, else IA(p) = O. To avoid having a huge amount of "useless" episode rules, we extended the basic frequent episodes algorithm to compute frequent sequential patterns in two phases: compute the frequent associations using the axis at- tribute(s); then generate the frequent serial patterns from these associations.
Another interesting schema-level information is that some attributes can be the references of other attributes. A group of events are related if they have the santo reference attribute value. For ex- ample, connections to the same destination host can be related. When mining for patterns of such related events, we need to use reference attribute as an item constraint. That is, when forming an episode, an additional condition is that, within its minimal occurrences, the records covered by its con- stituent itemsets have the same value(s) of the ref- erence attribute(s). In other words, if the itemsets of p refer to the same reference attribute value, then IA (p) = 1, else IA (p) = O.
We carl compare the patterns, i.e., frequent episodes computed using our extended algorithms, from an intrusion dataset and the patterns from the normal dataset to identify those that exhibit only in the intrusion dataset. These patterns are then used for feature construction. The details of the pattern comparison algorithm is described in [13]. The idea is to first convert patterns into numbers in such a way that "similar" patterns are mapped to "closer" numbers. Then pattern compar- ison and intrusion pattern identification are accom- plished through comparing the numbers and rank ordering the results. We devised an encoding pro- cedure that converts each pattern into a numerical number~ where t he order of digit significance cor- responds to the order of importance of the features. Each unique feature value is mapped to a digit value in the encoding process. The "distance" of two pat- terns is then simply a number where each digit value is the digit-wise absolute difference between the two encodings. A comparison procedure computes the "intrusion score" for each pattern from the intrusion dataset, which is its lowest distance score against all patterns from the normal dataset, and outputs the user-specified top percentage patterns that have the highest intrusion scores as the "intrusion only" pat- terns.
As an example, consider the "SYN flood" attack where the attacker uses many spoofed source ad- dresses to send a lot of SO connections (only the first SYN packet, the connection request, is sent) to
a port (e.g., http) of the victim host in a very short time span (the victim's connection buffer is filled up, hence Denial-of-Service). Table 1 shows one of the top intrusion only patterns, produced using service as the axis and dst_host as the feature.
3 . 2 F e a t u r e C o n s t r u c t i o n
Each of the intrusion patterns is used as a guideline for adding additional features into the connection records to build better classification models. We use the following automatic procedure for parsing a frequent episode and constructing features:
• Assume Fo (e.g., dst_host) is used as the refer- ence feature, and the width of the episode is w seconds.
• Add the following features that examine only the connections in the past w seconds that share the same value in Fo as the current connection:
- A feature that computes "the count of these connections";
- Let F1 be service, src_dst or dst_host other than Fo (i.e., F1 is an essential fea- ture). If the same F1 value (e.g., "http") is in all the item sets of the episode, add a feature that computes "the percentage of connections that share the same F1 value as the current connection"; otherwise, add a feature that computes "the percentage of different values of Fi" .
- Let V2 be a value (e.g., "SO") of a feature F2 (e.g., f lag) other than Fo and F1 (i.e., V2 is a value of a non-essential feature). If V2 is in all the item sets of the episode, add a feature that computes "the percentage of connections that have the same V2"; oth- erwise, if F2 is a numerical feature, add a feature that computes "the average of the F2 values".
This procedure parses a frequent episode and uses three operators, count, percent, and average, to con- struct statistical features. These features are also temporal since they measure only the connections that are within a time window w and share the same reference feature value. The intuition behind the feature construction algorithm comes from the straightforward interpretation of a frequent episode. For example, if the same feature value appears in all the itemsets of an episode, then there is a large percentage of records that have the same value. We treat the essential and non-essential features differ- ently. The essential features describe the anatomy
38 S I G M O D Reco rd , Vol. 30, No. 4, D e c e m b e r 2001

Table 1: Example Intrusion Pattern Frequent Episode Meaning (flag = SO, service = http, dst_host = victim), (flag = SO, service = http, dst_host = victim)
(flag = SO, service = http, dst_host = victim) [0.93, 0.03, 21
93% of the time, after two http connections with SO flag are made to host ~ctim, within 2 seconds from the first of these two, the third similar connection is made, and this pattern occurs in 3% of the data
of an intrusion, for example, "the same service (i.e., port) is targeted". The actual values, e.g., "http", is often not important because the same attack method can be applied to different targets, e.g., "ftp". On the other hand, the actual non-essential feature val- ues, e.g., flag = SO, often indicate the invariant of an intrusion because they summarize the connection behavior according to the network protocols. The "SYN flood" pattern shown in Table 1 results in the following additional features: a count of connec- tions to the same dst_host in the past 2 seconds, and among these connections, the percentage of those that have the same service, and the percentage of those that have the "S0" flag.
3.3 Cons t ruc t ing Efficient Models
A detection model is deemed efficient if its (analysis and ) detection delay, or computational cost, is small enough for the model to keep up with the run-time data streams (i.e., it can detect and respond to an intrusion before much damage is done). The com- putational cost of a model is derived mainly from the costs of computing the required features. The feature cost includes not only the time required for computing its value, but also the time delay of its readiness (i.e., when it can be computed).
We partition features into three relative cost lev- els. Level 1 features, e.g., service, are computed using at most the first three packets (or events) of a connection (or host session). They normally re- quire only simple recording. Level 2 features are computed in the middle or near the end of a con- nection using information of the current connection only. They usually require just simple book keep- ing. Level 3 features are computed using informa- tion from all connections within a given time window of the current connection. They are often computed as some aggregates of the level 1 and 2 features. We assign qualitative values to these cost levels, based on our run-time measurements with a prototype system we have developed using Network Flight Recorder (NFR) [17]: level 1 cost is 1 or 5; level 2 cost is 10; and level 3 cost is 100. It is important to note that level 1 and level 2 features must be computed indi-
vidually. However, because all level 3 features re- quire iteration through the entire set of connections in a given time window, they can all be computed at the same time, in a single iteration. This saves computational cost when multiple level 3 features are computed for analysis of a given connection.
3.3.1 A Multiple Model Approach
In order to reduce the computational cost of a de- tection model, the low cost features should be used whenever possible while maintaining a desired accu- racy level. Our approach is to build multiple models, each using features from different cost levels. Low cost models are always evaluated first by the IDS, and high cost models are used only when the low cost models can not predict with sufficient accuracy. We use a multiple ruleset approach based on RIPPER.
Before discussing the details of our approach, it is necessary to outline the advantages and disadvan- tages of the different forms of rulesets that RIPPER can generate: ordered or un-ordered.
O r d e r e d Ru le se t s An ordered ruleset has the form "if r l t h e n il e l se i f r2 t h e n i2, . . . , else de- faulf'. Before learning rules from a dataset, RIP- PER first heuristically orders the classes by one of the following methods: +freq, increasing fre- quency; - f r eq , decreasing frequency; given, a user- defined ordering; mdl, minimal description length heuristics to guess an optimal ordering. After ar- ranging the classes, RIPPER finds rules to separate class1 from classes class2, . . . , classn, then rules to separate class2 from classes class3,... ,class,e, and so on. The final class classn will become the de- fault class. The end result is that rules for a sin- gle class will always be grouped together, but rules for classi are possibly simplified, because they can assume that the class of the example is one of classy,.. . , classn. If an example is covered by rules from two or more classes, this conflict is resolved in favor of the class that comes first in the ordering.
An ordered ruleset is usually succinct and effi- cient. Evaluation of an entire ordered ruleset does not require each rule to be tested, but proceeds from the top of the ruleset to the bottom until any rule
SIGMOD Record, Vol. 30, No. 4, December 2001 39
evaluates to true. The features used by each rule can be computed one by one as evaluation proceeds. The computational cost to evaluate an ordered rule- set for a given connection is the total cost of com- puting unique features until a prediction is made. In any reasonable network environment, most con- nections are normal. A - f req ruleset is most likely lowest in computational cost and accurate in identi- fying normal connections since the top of the ruleset classifies normal. On the contrary, a +freq rule- set would most likely be higher in computational cost but more accurate in classifying intrusions than - f req since the ruleset identifies intrusions from normal connections and normal is the bot tom de- fault rule. Depending on the class order, the perfor- mances of given and mdl will be in between those of - freq and +freq.
U n - o r d e r e d l : tulesets An un-ordered ruleset has at least one rule for each class and there are usually many rules for frequently occurring classes. There is also a default class which is used for predic- tion when none of these rules are satisfied. Unlike ordered rulesets, all rules are evaluated during pre- diction and conflicts are broken by using the most accurate rule. Un-ordered rulesets, in general, con- tain more rules and are less efficient in execution than - f req and +freq ordered rulesets, but there are usually several rules of high precision for the most frequent class, normal.
With the advantages and disadvantages of ordered and un-ordered rulesets in mind, we propose the fol- lowing multiple ruleset approach:
• We first generate multiple training sets T1 , . . . ,T4 using different feature subsets. T1 uses only cost 1 features. T2 uses features of costs 1 and 5, and so forth, up to T4, which uses all available features.
• R.ulesets R 1 , . . . , R 4 are learned using their re- spective training sets. R4 is learned as either +freq or - f req ruleset for efficiency, as it may contain the most costly features. R 1 , . . . , R3 are learned as either - f req or un-ordered rulesets, as they will contain accurate rules for classify- ing normal connections, and we filter normal as early as possible to reduce computational cost.
• A precision measurement pr 1 is computed for every rule, r, except for the rules in R4.
• A threshold value r~ is obtained for every sin- gle class. It determines the tolerable precision
1Precision describes how accurate a prediction is. If P is the set of predict ions with label i and W is the set of instances with label i in the da t a set, by definition, p = l _ _ ~ J .
required in order for a classification to be made by any ruleset except for R4.
In real-time execution, the feature computation and rule evaluation proceed as follows:
• R1 is evaluated and a prediction i is made. • If Pr >_ r~, the prediction i will be fired. In this
case, no more features will be computed and the system will examine the next connection. Otherwise, additional features required by R~ are computed and R2 will be evaluated.
• Evaluation will continue with Rs, followed by R4, until a prediction is made. The evaluation of R4 does not require any firing condition and will always generate a prediction.
The computational cost for a single connection is the total computational cost of all unique features used before a prediction is made. If any level 3 features (of cost 100) are used at all, the cost is counted only once since all level 3 features are calculated in one function call.
The precision and threshold values can be ob- tained during model training from either the train- ing set or a separate hold-out validation set. Thresh- old values are set to the precisions of R4 for each class on that dataset since we want to reach the same accuracy as R4. Precision of a rule can be obtained easily from the positive, p, and negative, n, counts of a rule, p+~. The threshold value will, on average, ensure that the predictions emitted by the first three rulesets are not less accurate than using R4 alone.
4 Experiments and Results
In this section, we describe our experiments in build- ing intrusion detection models on the dataset from the 1998 DAR.PA Intrusion Detection Evaluation Program, prepared by MIT Lincoln Lab [14].
4 .1 T h e D A B . P A D a t a
We were provided with about 4 gigabytes of com- pressed tcpdump [7] data of 7 weeks of network traf- fic. The data can be processed into about 5 million connection records of about 100 bytes each. The data contains the content (i.e., the data portion) of every packet transmitted between hosts inside and outside a simulated military base 2. The data con-
2Disclaimer: We are in no posi t ion to endorse any claim that th is DAR,PA dataset reflects a "typical" real-world en- vi ronment . We used it in our s tudy because it is the only available comprehensive da tase t wi th various normal back- ground traffic conditions and a large number of at tacks.
40 S I G M O D Reco rd , Vol. 30, No. 4, D e c e m b e r 2001

tains four main categories of attacks: DoS, denial- of-service, e.g., $YN flood; R2L, unauthorized ac- cess from a remote machine, e.g., guessing password; U2R, unauthorized access to local root privileges by a local unprivileged user, e.g., buffer-overflow attacks; and PROBING, surveillance and probing, e.g., port-scan.
We preprocessed the binary tcpdump packet data into ASCII connection records each with a set of intrinsic features, i.e., duration, source and destina- tion hosts, service, number of bytes transferred, and a flag that signifies normal or error conditions (e.g., "SO") of connection. This set of features are com- monly used in many different network analysis tasks (other than intrusion detection).
4 . 2 F e a t u r e a n d M o d e l C o n s t r u c t i o n
We participated in the official 1998 DARPA Intru- sion Detection Evaluation. The 7 weeks of connec- tion data is training data, and can be labeled us- ing the provided "truth files". Due to constraints in time and data storage space, we did not include all connection records in pattern mining and model learning. We instead extracted all the connection records that fall within a surrounding time window of plus and minus 5 minutes of the whole duration of each attack to create a dataset for each attack type, e.g., SYN flood and port-scan. We also extracted sequences of normal records to create an aggregate normal dataset that has the same distribution as the original dataset.
For each attack type, we performed pattern min- ing and comparison using its intrusion dataset and the normal dataset. We constructed features accord- ing to the top 20% intrusion-only patterns of each attack type. Here we summarize the automatically constructed temporal and statistical features:
* The "same host" feature that examine only the connections in the past 2 seconds that have the same destination host as the current connec- tion: the count of such connections, the per- centage of connections that have the same ser- vice as the current one, the percentage of dif- ferent services, the percentage of SYN errors, and the percentage of REJ (i.e., rejected con- nection) errors;
• The "same service" features that examine only the connections in the past 2 seconds that have the same service as the current connection: the count of such connections, the percentage of dif- ferent destination hosts, the percentage of SYN errors, and the percentage of REJ errors.
7 0
.......... .................. : ................................................... J
..." 30 ..-"" C o l u m b i a -~-
, / Group1 .+--. / f G roup3 .s3-.
1
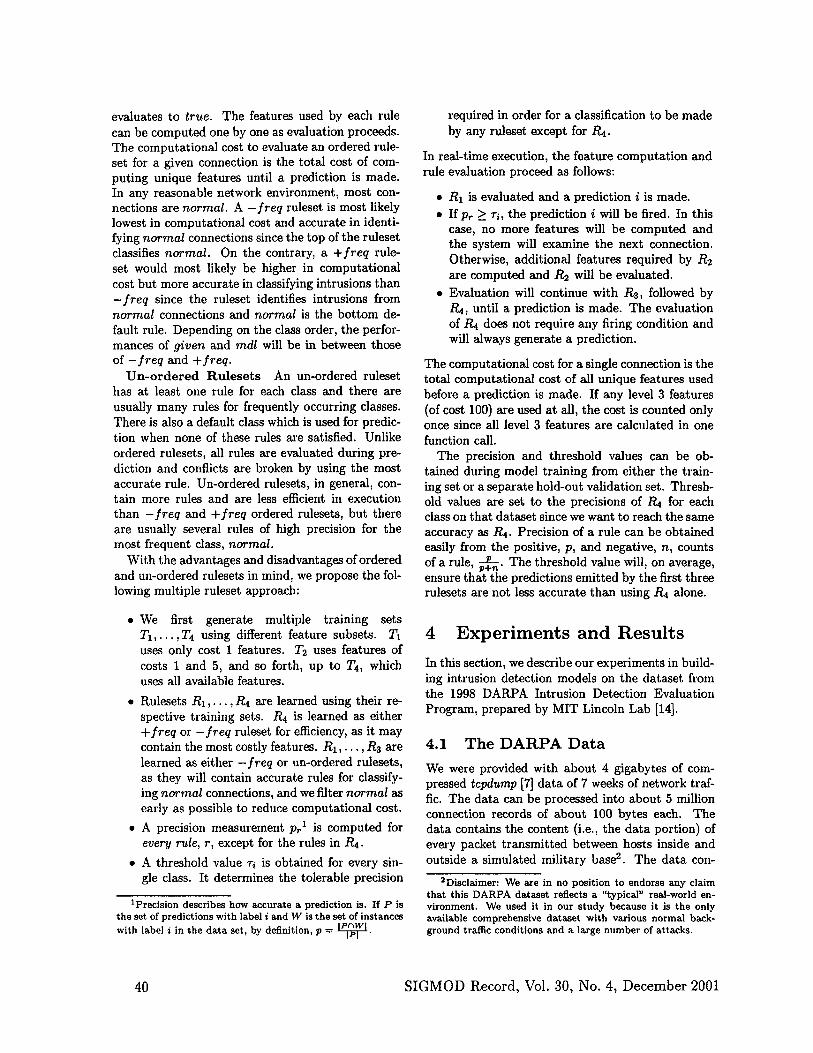
Figure 1: The Overall Detection Performance
We call these the "time-based traffic" features for connection records. In order to detect "slow" PROBING attacks, we sorted the connection records by destination hosts, then mined patterns and con- structed the "host-based traffic" features that mirror the "time-based traffic" features.
We discovered that unlike most of the DoS and PROBING attacks, the R2L and U2R attacks do not have any intrusion-only frequent patterns. This is because most of the DoS and PROBING attacks involve sending a lot of connections to some host(s) in a very short period of time, and therefore can have frequent sequential patterns that are different from the normal traffic. The R2L and U2R attacks are embedded in the data portions of the packets and normally involve only a single connection. There- fore, it is unlikely that they can have any unique frequent traffic patterns. We instead used domain knowledge to construct a set of "content" features to indicate whether the connection contents suggest suspicious behavior (see [11] for details).
4 .2 .1 R e s u l t s
We briefly report the performance of our detec- tion models as evaluated by MIT Lincoln Lab [14] (see [11] for more detailed results). We trained our intrusion detection models, using the 7 weeks of la- beled data, and used them to make predictions on the 2 weeks of unlabeled test data (i.e., we were not told which connection is an attack). The test data contains a total of 38 attack types, with 14 types in test data only (i.e., our models were not trained with instances of these attack types, hence these are considered as "new" attack types).
Figure 1 shows the ROC curves of the detection models on all intrusions. We compare here our models with other participants (denoted as Group 1 through 3, group 2 did not cover all intrusions) in the DARPA evaluation program 3. These participating
3The tested systems produced binary output, hence, the
S I G M O D Record , Vol. 30, No. 4, D e c e m b e r 2001 41

Table 2: Average CompCost Per Connection
H - ±:k:k . . . . .
CompCo.t 104.30 4.91~ 3.59~ ~,do n a 95.23% 96.56%
c o r n , c o . , 190.93 4.93 ~ 4.85 U,do n a 97.42% 97.46%
~: significantly reduced
groups used pure knowledge engineering approaches. We can see from the figure that our detection model has the best overall performance, under the "accept- able" false alarm rate (under 0.02%). However, an overall detection rate of below 70% is hardly satis- factory in a mission critical environment.
4 . 3 C o m p u t a t i o n a l C o s t R e d u c t i o n
We compute both a single model and multiple mod- els oil the same DARPA dataset and compare their computational cost and accuracy. We measure the expected computational costs, denoted as Com- pCost, in our experiments. The expected com- putational cost over all occurrences of each con- nection class and the average computational cost per connection over the entire test set are defined as E,es~ CompCost(c) ~o~s CompCost(c)
ISd and ISl , respec- tively, where S is the entire test set, i is a connec- tion class, and S~ represents all occurrences of i in S. In all of our reported results, CompCost(c) is com- puted as the sum of the feature computation costs of all unique features used by all rules evaluated until a prediction is made for connection c.
4.3.1 Results
In presenting our results, we use +, - and ::t= to represent +freq, - f req and un-ordered rulesets, re- spectively. A multiple model approach is denoted as a sequence of these symbols. For example, - - - - indicates that all 4 rulesets are -freq.
Table 2 shows the average computational cost per connection for a single classifier approach R4 ( - or +) and the respective multiple model approaches (=E::E:k , or =EL=E+, - - - + ) . The first row below each method is the average Com- pCost per connection and the second row is the re-
R O C ' s a re not cont inuous . In fact , t h e y shou ld j u s t be d a t a points , one for each g roup . L ines ave connec t ed for d i sp lay and c o m p a r i s o n purposes .
Table 3: Precision/Recall for Each Connection Class
CompCost Accuracy + ±±±+ + d: d: :k+
normal 190.99 4.18 T F 0.99 0.99 p 0,99 0.99
back 75 7 T P 1,0 1.0 p 1.0 1.0 T P 1.0 1.0 buffer.overflow 175 75 p 1.0 1.0 TP 1.0 0.88 ftp_write 146 60.5 p 1.0 1.0 T P 0.91 0.91 guess.passwd 191 37 p 1.0 1,0
imap 181 95.3 T P 1.0 0.83 p 1.0 1.0
ipsweep 191 I TP 0.99 0.99 p 1.0 1.0
land 191 I TP 1.0 1.0 p 1.0 1.0
load_module 168.78 67 TP 1.0 1.0 p 0.9 1.0
mul t ihop 182.43 88.42 T P 1.0 1,0 p 0.88 0.88
neptune 191 1 TP 1.0 1.0 p 1.0 1.0
n m a p 191 1 T P 1.0 1.0 p 1.0 1.0
pcrl 151 77 TP 1.0 1.0 p 1.0 1.0 T P 1.0 1.0 phf 191 1 p 1.0 1.0
pod 191 1 TP 1.0 1.0 p 0.98 0.98
portsweep 191 I T P 0.99 0.99 p 1.0 1.0
rootkit 155 54.2 T P 1.0 0.6 p 0.77 1.0
satan 191 1 T P 1.0 0.98 p 0.99 0.99
smurf 191 1 T P 1.0 1.0 p 1.0 1.0
spy 191 21.5 T P 1.0 1.0 p 1.0 1.0
teardrop 191 1 T P 1.0 1.0 p 1.0 1.0 TP 0.99 0.99 warezclient 191 82.9 p 1.0 1,0
warezmaster 191 87 TP 0.6 0.6 p 1.0 1,0
duction (%rdc) by the multiple model over the re- Single- Mult iple spective single model, Sinal e X I00%. As
clearly shown in the table, there is always a signifi- cant reduction by the multiple model approach. In all configurations, the reduction is more than 95%. An average CompCost of no greater than 5 means that in practice we can classify most connections by examining the first three packets of the connection at most 5 times. This significant reduction is due to the fact that Rz, R2 and Rs are very accurate in fil- tering normal connections (including intrusions not worthy of response and re-labeled as normal), and a majority of connections in real network environ- ments are normal. Our multiple model approach thus computes more costly features only when they
42 S I G M O D Record , Vol. 30, No. 4, D e c e m b e r 2001

are needed. This is shown in the first two columns of Table 3, which lists the detailed average CompCost for each connection class for + and :t: :t: =l:+.
Detailed precision and TP 4 rates of four sample models are shown in last two columns of Table 3 for different connection classes. The values for the sin- gle classifier and multiple classifier methods are very close to each other. This shows that the coverage of the multiple classifier method is similar to those of the corresponding single classifier method.
5 Discussion
We have presented how data mining approaches can be applied to system audit data to construct features and models for intrusion detection. The main ben- efit is that, instead of using the unreliable expert knowledge to manually construct detection mod- els, we can semi-automatically compute (or mine), from a large amount of data, more accurate models. An official evaluation showed that our mined mod- els performed very well when compared with purely knowledge-engineered models. Our experiments also showed that our multiple-model approach can be used to construct models with less computational cost while maintaining accuracy. We are developing a real-time system to verify that this approach can indeed reduce run-time detection delay.
There are limitations in our current approaches, which present research opportunities and challenges.
Our data mining approaches compute only the "frequent" patterns of connection records. Many in- trusions, e.g., those that embed all activities within a single connection, do not have frequent patterns in connection data. Some of these intrusions have frequent patterns in packet data. However, there is no fixed format of packet data contents, and hence we cannot use our (attribute-based) data mining programs. Free text mining algorithms are needed for packet data. Still, some of these intrusions in- volve only a single event (e.g., one command), and hence leave no frequent patterns even in packet data. Thus, we need algorithms capable of mining rare and unexpected patterns for these intrusions.
We had hoped that the features we constructed would be general enough so that new variations of known intrusions can also be detected by our misuse detection models. The results from the 1998 DARPA evaluation showed that our models were able to de-
4Unlike precision, T P rate descr ibes the fraction of oc- currences of a connection class tha t were correctly labeled. Using the same notat ion as in the definition of precision, T . P = 1 ~ 1 .
tect a large percentage of new PROBING and U2R attacks because these attacks have relatively lim- ited variances. However, our models were not as effective for new DoS and R2L attacks because they exploit the weaknesses of a large number of differ- ent services (hence a wide variety of behavior) [11]. We need anomaly detection models to detect new attacks. Anomaly detection is much more challeng- ing than misuse detection. False alarm may not be avoided because a new (or previously not observed) normal activity can trigger an alarm. In the real- world, the false alarm rate has to be extremely low (given the huge number of connections) for the sys- tem to be acceptable to human operators 5
There is an increasing trend of distributed and co- ordinated attacks. Merging audit data from differ- ent sites is not efficient, and may not be possible due to legal constraints. We need correlation algorithms capable of merging alarms (i.e., detection outcomes) from different sources.
6 Conclusion
Intrusion detection is a real-world application area critical to the well-being of our society. Based on the characteristics of system audit data, we devel- oped specialized data mining algorithms to con- struct features and detection models. Our experi- ments showed that the mined models are accurate (compared with expert system) and efficient.
There are still many open problems. We as re- searchers must take up these opportunities and chal- lenges, and make contributions to both data mining and intrusion detection.
7 Acknowledgments
This research has been supported in part by DARPA (F30602-96-1-0311 and F30602-00-1-0603).
Many thanks to Sal Stolfo and members of his Columbia research team for all the guidances and helps. We also wish to thank all the open-minded researchers in security and data mining who gave us encouragements and good suggestions at the early stage of our research.
References
[1] R. Agrawal, T. Imielinski, and A. Swami. Min- ing association rules between sets of items in
5A recent indus t ry survey found tha t , on average, an op- erator spends one hour to investigate an alarm
SIGMOD Record, Vol. 30, No. 4, December 2001 43

large databases. In Proceedings of the ACM SIGMOD Conference on Management of Data, pages 207-216, 1993.
[2] E. Amoroso. Intrusion Detection: An In- troduction to Internet Surveillance, Correla- tion, Traps, Trace Back, and Response. Intru- sion.Net Books, 1999.
[3] D. Anderson, T. Frivold, and A. Valdes. Next- generation intrusion detection expert system (NIDES): A summary. Technical Report SRI- CSL-95-07, Computer Science Laboratory, SRI International, Menlo Park, California, May 1995.
[4] W. W. Cohen. Fast effective rule induction. In Machine Learning: the 12th International Con- ference, Lake Taho, CA, 1995. Morgan Kauf- mann.
[5] Wei Fan, Wenke Lee, Sal Stolfo, and Matt Miller. A multiple model cost-sensitive ap- proach for intrusion detection. In Proceedings of The Eleventh European Conference on Machine Learning (ECML PO00), Lecture Notes in Arti- ficial Intelligence No. 1810, Barcelona, Spain, May 2000.
[6] K. Ilgun, l:t. A. Kemmerer, and P. A. Porras. State transition analysis: A rule-based intru- sion detection approach. IEEE Transactions on Software Engineering, 21(3):181-199, March 1995.
[7] V. Jacobson, C. Leres, and S. McCanne. tcpdump, available via anonymous ftp to ftp.ee.lbl.gov, June 1989.
[8] S. Kumar and E. H. Spafford. A software archi- tecture to support misuse intrusion detection. In Proceedings of the 18th National Information Security Conference, pages 194-204, 1995.
[9] T. Lane and C. E. Brodley. Temporal sequence learning and data reduction for anomaly detec- tion. ACM Transactions on Information and System Security, 2(3):295-331, August 1999.
[10] W. Lee. A Data Mining l~ramework for Con- structing Features and Models for Intrusion De- tection Systems. PhD thesis, Columbia Univer- sity, June 1999.
[11] W. Lee and S. J. Stolfo. A framework for con- structing features and models for intrusion de- tection systems. ACM Transactions on Infor- mation and System Security, 3(4), November 2000.
[12] W. Lee, S. J. Stolfo, and K. W. Mok. Mining audit data to build intrusion detection models. In Proceedings of the ~th International Confer- ence on Knowledge Discovery and Data Mining, New York, NY, August 1998. AAAI Press.
[13] W. Lee, S. J. Stolfo, and K. W. Mok. Min- ing in a data-flow environment: Experience in network intrusion detection. In Proceedings of the 5th ACM SIGKDD International Confer- ence on Knowledge Discovery ~4 Data Mining (KDD-99), August 1999.
[14] R. Lippmann, D. Fried, I. Graf, J. Haines, K. Kendall, D. McClung, D. Weber, S. Webster, D. Wyschogrod, R. Cunninghan, and M. Ziss- man. Evaluating intrusion detection systems: The 1998 DARPA off-line intrusion detection evaluation. In Proceedings of the 2000 DARPA Information Survivability Conference and Ex- position, January 2000.
[15] H. Mannila, H. Toivonen, and A. I. Verkamo. Discovering frequent episodes in sequences. In Proceedings of the 1st International Conference on Knowledge Discovery in Databases and Data Mining, Montreal, Canada, August 1995.
[16] S. McCanne, C. Leres, and V. Jacobson. libpcap, available via anonymous ftp to ftp.ee.lbl.gov, 1989.
[17] Network Flight Recorder Inc. Network flight recorder, http://www.nfr.com, 1997.
[18] S.J. Stolfo, W. Lee, P.K. Chan, W. Fan, and E. Eskin. Data mining-based intrusion detec- tors: An overview of the Columbia IDS project. ACM SIGMOD Record, 30(4), December 2001.
[19] SunSoft. SunSHIELD Basic Security Module Guide. SunSoft, Mountain View, CA, 1995.
[20] C. Warrender, S. Forrest, and B. Pearlmutter. Detecting intrusions using system calls: Al- ternative data models. In Proceedings of the 1999 IEEE Symposium on Security and Pri- vacy, May 1999.
44 SIGMOD Record, Vol. 30, No. 4, December 2001